Environmental and Economic Evaluation of Fuel Choices for Short Sea Shipping †


School of Technology and Innovations, University of Vaasa, P.O. Box 700, 65101 Vaasa, Finland
*
Author to whom correspondence should be addressed.
†
This paper is an extended version of our paper “Emission reduction by biogas use in short sea shipping” published in Integrated Energy Solutions to Smart and Green Shipping, Proceedings of the INTENS public project seminar, Espoo, Finland, 13 March 2019; Zou, G., Ed.; VTT Technical Research Centre of Finland, 2019, pp. 102–106.
Clean Technol. 2020, 2(1), 34-52; https://0-doi-org.brum.beds.ac.uk/10.3390/cleantechnol2010004
Submission received: 19 December 2019
/
Revised: 10 January 2020
/
Accepted: 20 January 2020
/
Published: 22 January 2020
Abstract
:The shipping industry is looking for strategies to comply with increasingly stringent emission regulations. Fuel has a significant impact on emissions, so a switch to alternative fuels needs to be evaluated. This study investigated the emission performances of liquefied natural gas (LNG) and liquefied biogas (LBG) in shipping and compared them to conventional marine diesel oil (MDO) combined with selective catalytic reduction (SCR). For assessing the complete global warming potential of these fuels, the life-cycle approach was used. In addition, the study evaluated the local environmental impacts of combustion of these fuels, which is of particular importance for short sea shipping operations near coastal marine environment and residential areas. All three options examined are in compliance with the most stringent emission control area (ECA) regulations currently in force or entering into force from 2021. In terms of local environmental impacts, the two gaseous fuels had clear advantages over the MDO + SCR combination. However, the use of LNG as marine fuel achieved no significant CO2-equivalent reduction, thus making little progress towards the International Maritime Organization’s (IMO’s) visions of decarbonizing shipping. Major life cycle GHG emission benefits were identified by replacing fossil fuels with LBG. The most significant challenge facing LBG today is fuel availability in volumes needed for shipping. Without taxation or subsidies, LBG may also find it difficult to compete with the prices of fossil fuels.
Keywords:
marine fuels; short sea shipping; LBG; LNG; MDO; global warming potential; life cycle assessment1. Introduction
Reducing ship emissions and developing the sector in an environmentally friendly manner has been the subject of the regulatory framework for years. The International Maritime Organization (IMO) regulates both the maximum sulfur content of fuel and emissions of NOx in Annex VI of MARPOL (International Convention for the Prevention of Pollution from Ships). Particularly strict regulations apply in some sensitive areas, known as emission control areas (ECAs). The Baltic Sea was designated a Sulphur Emission Control Area (SECA) in 1998, and the current fuel sulfur content limit of 0.1% came into force in 2015 [1]. In July 2017, the IMO’S Marine Environment Protection Committee (MEPC) also designated the Baltic Sea a NOx Emission Control Area (NECA), effective from 1 January, 2021 onwards [2]. NECA regulation (Tier III) applies to all vessels built after 2021 and demands an 80% cut in NOx emissions compared to the present emission level. Practically, this means new-builds either will have to be equipped with a proper exhaust after-treatment system for NOx reduction, or use liquefied natural gas (LNG) as fuel to comply with the regulation. There are also concerns about health risks associated with particle emissions from shipping, so regulations focused on particulates may be expected in the future [3].
In addition, greenhouse gas (GHG) emissions from shipping have received increased attention lately. This stems from the fact that shipping is one of the fastest-growing sectors in terms of GHG emissions [4]. In April 2018, MEPC adopted the Initial IMO Strategy on Reduction of GHG Emissions from Ships. According to the decision, international maritime transportation will reduce annual absolute GHG emissions by at least 50% by 2050 (compared to 2008 levels), despite rising volumes of traffic, and after that to continue the process of completely phasing out CO2 emissions in line with the Paris Climate Agreement temperature target [5]. These restrictions apply to all maritime traffic, not just to new vessels.
The maritime sector is now looking for strategies to achieve these future emissions targets. Fuel has a significant impact on emissions, so switching to alternative fuels is one of the strategies being discussed. The environmental impact of fuel, however, is not only linked to combustion in the engine, but also the entire fuel life cycle [3]. Fuels always emit pollutants at various stages of their life cycle, like refining and distribution, or during the cultivation if they are of biological origin [6].
Natural gas has become an increasingly attractive alternative to conventional marine fuels. A large number of existing studies have examined the impact of the use of natural gas on NOx, SOx and particulate emissions in marine engines. The literature review shows that switching to LNG instead of traditional bunker fuels would significantly improve the overall environmental performance. NOx emissions are reduced by approximately 80–85% compared to the use of heavy fuel oil (HFO)/marine diesel oil (MDO) [7,8,9] as a result of reduced peak combustion temperatures in the engine [10]. SOx emissions are almost eliminated [11,12], and particulate matter (PM) production is very low. A recent study by Lehtoranta et al. [13] showed that dual-fuel operation, with LNG as the main fuel, resulted in PM levels 72–75% lower than MDO. Li et al. [14] reported similar results with a maximum drop percentage of 78% in dual fuel mode compared to pure diesel mode. Reduction of these local pollutants is particularly important for short sea vessels with regional operations near coasts and populated areas [15].
In LNG operation, CO2 emissions are reduced by 25% compared to HFO or MDO, thanks to high hydrogen content in methane molecules [7]. However, LNG’s advantage in terms of total GHG emissions is less clear-cut. This is because its main constituent, methane (CH4), is a potent greenhouse gas with a global warming potential (GWP) 28–34 times greater than that of CO2 over a 100-year timescale [16]. Consequently, LNG’s real-world GHG benefits are highly dependent on the rates of methane leakage within the LNG supply chain (fuel production, storage, transportation, bunkering) and “methane slip”, i.e., unburned methane from an engine’s combustion process released during vessel operation [17]. The benefits of using LNG are reduced if methane slip is not adequately controlled, in which case LNG may give only marginal GHG emissions benefits over conventional bunker fuels [18]. The findings by Lowell et al. [19] indicated that relatively modest CO2-equivalent emission benefits, in a range of 5–10 percent, should be applied when assessing the use of LNG by ships. Previously quoted higher values tended to underplay or ignore some of the upstream emissions.
In contrast, the combustion of liquefied bio-methane (LBG) exhibits a neutral recirculation loop for CO2, which has been identified as the major reason for global warming. The literature review shows that the use of methane produced from biomass has the potential to cut life-cycle GHG emissions significantly [6,15,20,21]. Therefore, LBG could be an attractive low carbon alternative to LNG.
For GHG emissions studies, usually the global warming potential factor for 100 years of 25 (IPCC AR4) or 28 (IPCC AR5) is used. These values, however, does not include the climate-carbon feedback for methane. Gasser et al. [22] define climate-carbon feedback as “the effect that a changing climate has on the carbon cycle”. In concrete: global warming slows down the capture of atmospheric CO2 by land and ocean sinks, thereby increasing the fraction of CO2 that remains in the atmosphere [22,23], and the warming climate is warmed further. Excluding the climate-carbon feedback may underestimate the relative impacts of non-CO2 gases [16,24]. For example, Gillet and Matthews [25] found that climate-carbon feedbacks inflate the GWPs of methane and nitrous oxide by approximately 20%.
One of the main purposes of the present study was to evaluate the emissions performance of fuel choices for short-sea shipping. The fuels investigated are LNG, LBG, and conventional marine diesel oil. For assessing the complete global warming potential of these fuels, the life-cycle approach was used. In addition, the study evaluated the local environmental impacts of combustion of these fuels in terms of acidification and eutrophication potential and impacts on human health. The preliminary results of the emission inventory have been previously presented in a conference paper [26], prepared by the authors. However, assessing the potential of an alternative fuel to become a viable option, in terms of large-scale deployment, requires a thorough analysis that also covers economic aspects and verification of fuel availability.
The present study provides an updated life-cycle GHG analysis for MDO, LNG and LBG as a marine fuel. In the investigation, the carbon-climate feedback effect was included to avoid underestimating the impacts of non-CO2 greenhouse gases. Furthermore, the study made an economic analysis for operating on LNG, LBG, and on MDO combined with selective catalytic reduction (SCR), thus addressing the need for an economic evaluation of LBG as a marine fuel, so far lacking in the literature. Finally, the study assessed current and future prospects of fuel availability, which is of particular relevance to LBG. The study used a Ro-Ro/passenger vessel, equipped with a dual-fuel (DF) engine, in the Baltic Sea ECA as a case ship.
2. Investigated Fuels and the Case Ship
Three different fuels were selected for detailed analysis and comparison: MDO, LNG and LBG.
2.1. MDO 0.1% S
Marine diesel oil is a blend of middle distillates derived from the crude oil refining process. Its international trading names are DMA (marine gas oil/MGO) and DMB (marine diesel oil/MDO). The main difference between DMA and DMB is that DMB may contain traces of residual fuel. In terms of CO2 and NOx emissions, these fuels are not significantly different from heavy fuel oil (HFO) [27]. The reduced sulfur level does, however, result in lower SOx emissions, making them attractive for shipping in ECA.
2.2. LNG
LNG is the liquid form of natural gas, a mixture of hydrocarbon compounds found deep in underground reservoirs near other solid and liquid hydrocarbons beds like crude oil and coal. The main constituent of natural gas is methane, along with smaller quantities of other hydrocarbons like ethane, propane, and butane. The production of LNG from natural gas includes the removal of these trace gases, carbon dioxide, hydrogen sulfide, water, and other components that freeze at low temperatures. Then the gas is cooled to −162 °C to change it into a liquid form. As a liquid, the volume of the methane is reduced to 1/600 its gaseous state. This makes the fuel easier and safer to store and transport.
2.3. LBG
Bio-methane is methane produced from organic matter. Like its fossil equivalent natural gas, bio-methane also can be converted into a liquid form. LNG and LBG are nearly identical as far as engine’s fueling is concerned, so using LBG instead of LNG does not pose any additional challenges. It is in the upstream section of their life cycles that they differ, e.g., the raw material used and the production processes [28].
Biogas, the pre-stage of bio-methane, can be produced from a vast variety of raw materials. Wet organic matter with low lignocellulose content, such as organic waste or sewage sludge, is suitable for biogas production by anaerobic digestion [29]. This is the most common way to produce bio-methane currently. It is also possible to produce bio-CH4 from gasification of biomass [21]. Irrespective of production method, biogas then is cleaned of impurities and upgraded to increase its CH4 content so that it matches natural gas specifications [28].
LBG has potential to be carbon-neutral because combustion of bio-methane releases biogenic CO2, which does not add to the natural carbon cycle. However, although in principle bio-methane combustion offers climatic-neutral energy production, it still affects the atmosphere. As with LNG, burning bio-methane releases CH4 and some particulate emissions. Some GHG emissions also occur during its processing, transport and distribution, and so these must be included when evaluating LBG’s credentials over the entire life cycle.
2.4. The Case Ship
The environmental performance of the fuels described above is assessed by a case study on a Ro-Ro/passenger ship (RoPax) vessel operating one route across the Gulf of Bothnia. The 53-nautical-mile crossing between Vaasa (Finland) and Umeå (Sweden) takes 4 h and 30 min. A new ferry with a dual-fuel engine will be deployed by the beginning of the summer season 2021. Thus, the new vessel must meet both the NOx and the SOx emission standards set by IMO. Characteristics of the vessel are presented in Table 1.
There are different strategies for dealing with ECA regulations. For sulfur oxides, the most apparent reduction strategy is to avoid the problem by using low-sulfur (below 0.1% S) marine fuels. For nitrogen oxides, the situation is somewhat different. The most significant contributor to these types of emissions is thermally produced NOx, which is formed in the combustion process by high-temperature oxidation of the molecular nitrogen present in the combustion air. The formation of thermal NOx is strongly dependent on combustion temperature, residence time, and the concentration of oxygen atoms. In other words, the formation of thermal NOx is associated with high temperatures and fuel-lean environments. Different fuels give rise to different degrees of NOx formation: LNG and LBG will give significant reductions compared to heavy fuel oil, while a switch to MGO/MDO gives a reduction of only a few percent [21]. It can be difficult to reach the most stringent NOx standard, IMO Tier III, with MGO/MDO without using exhaust gas after-treatment.
3. Method and Data Collection
3.1. Life Cycle Assessment
Any activity or process during the lifetime of a product causes environmental impacts due to the consumption of resources, emissions of harmful substances into the natural environment, and through other environmental exchanges [30]. Life cycle assessment (LCA) is a standardized method for assessing the potential environmental impact of a product or service throughout its life cycle [31]. Environmental impacts commonly assessed include global warming, eutrophication, acidification, human toxicity, and the depletion of resources [32].
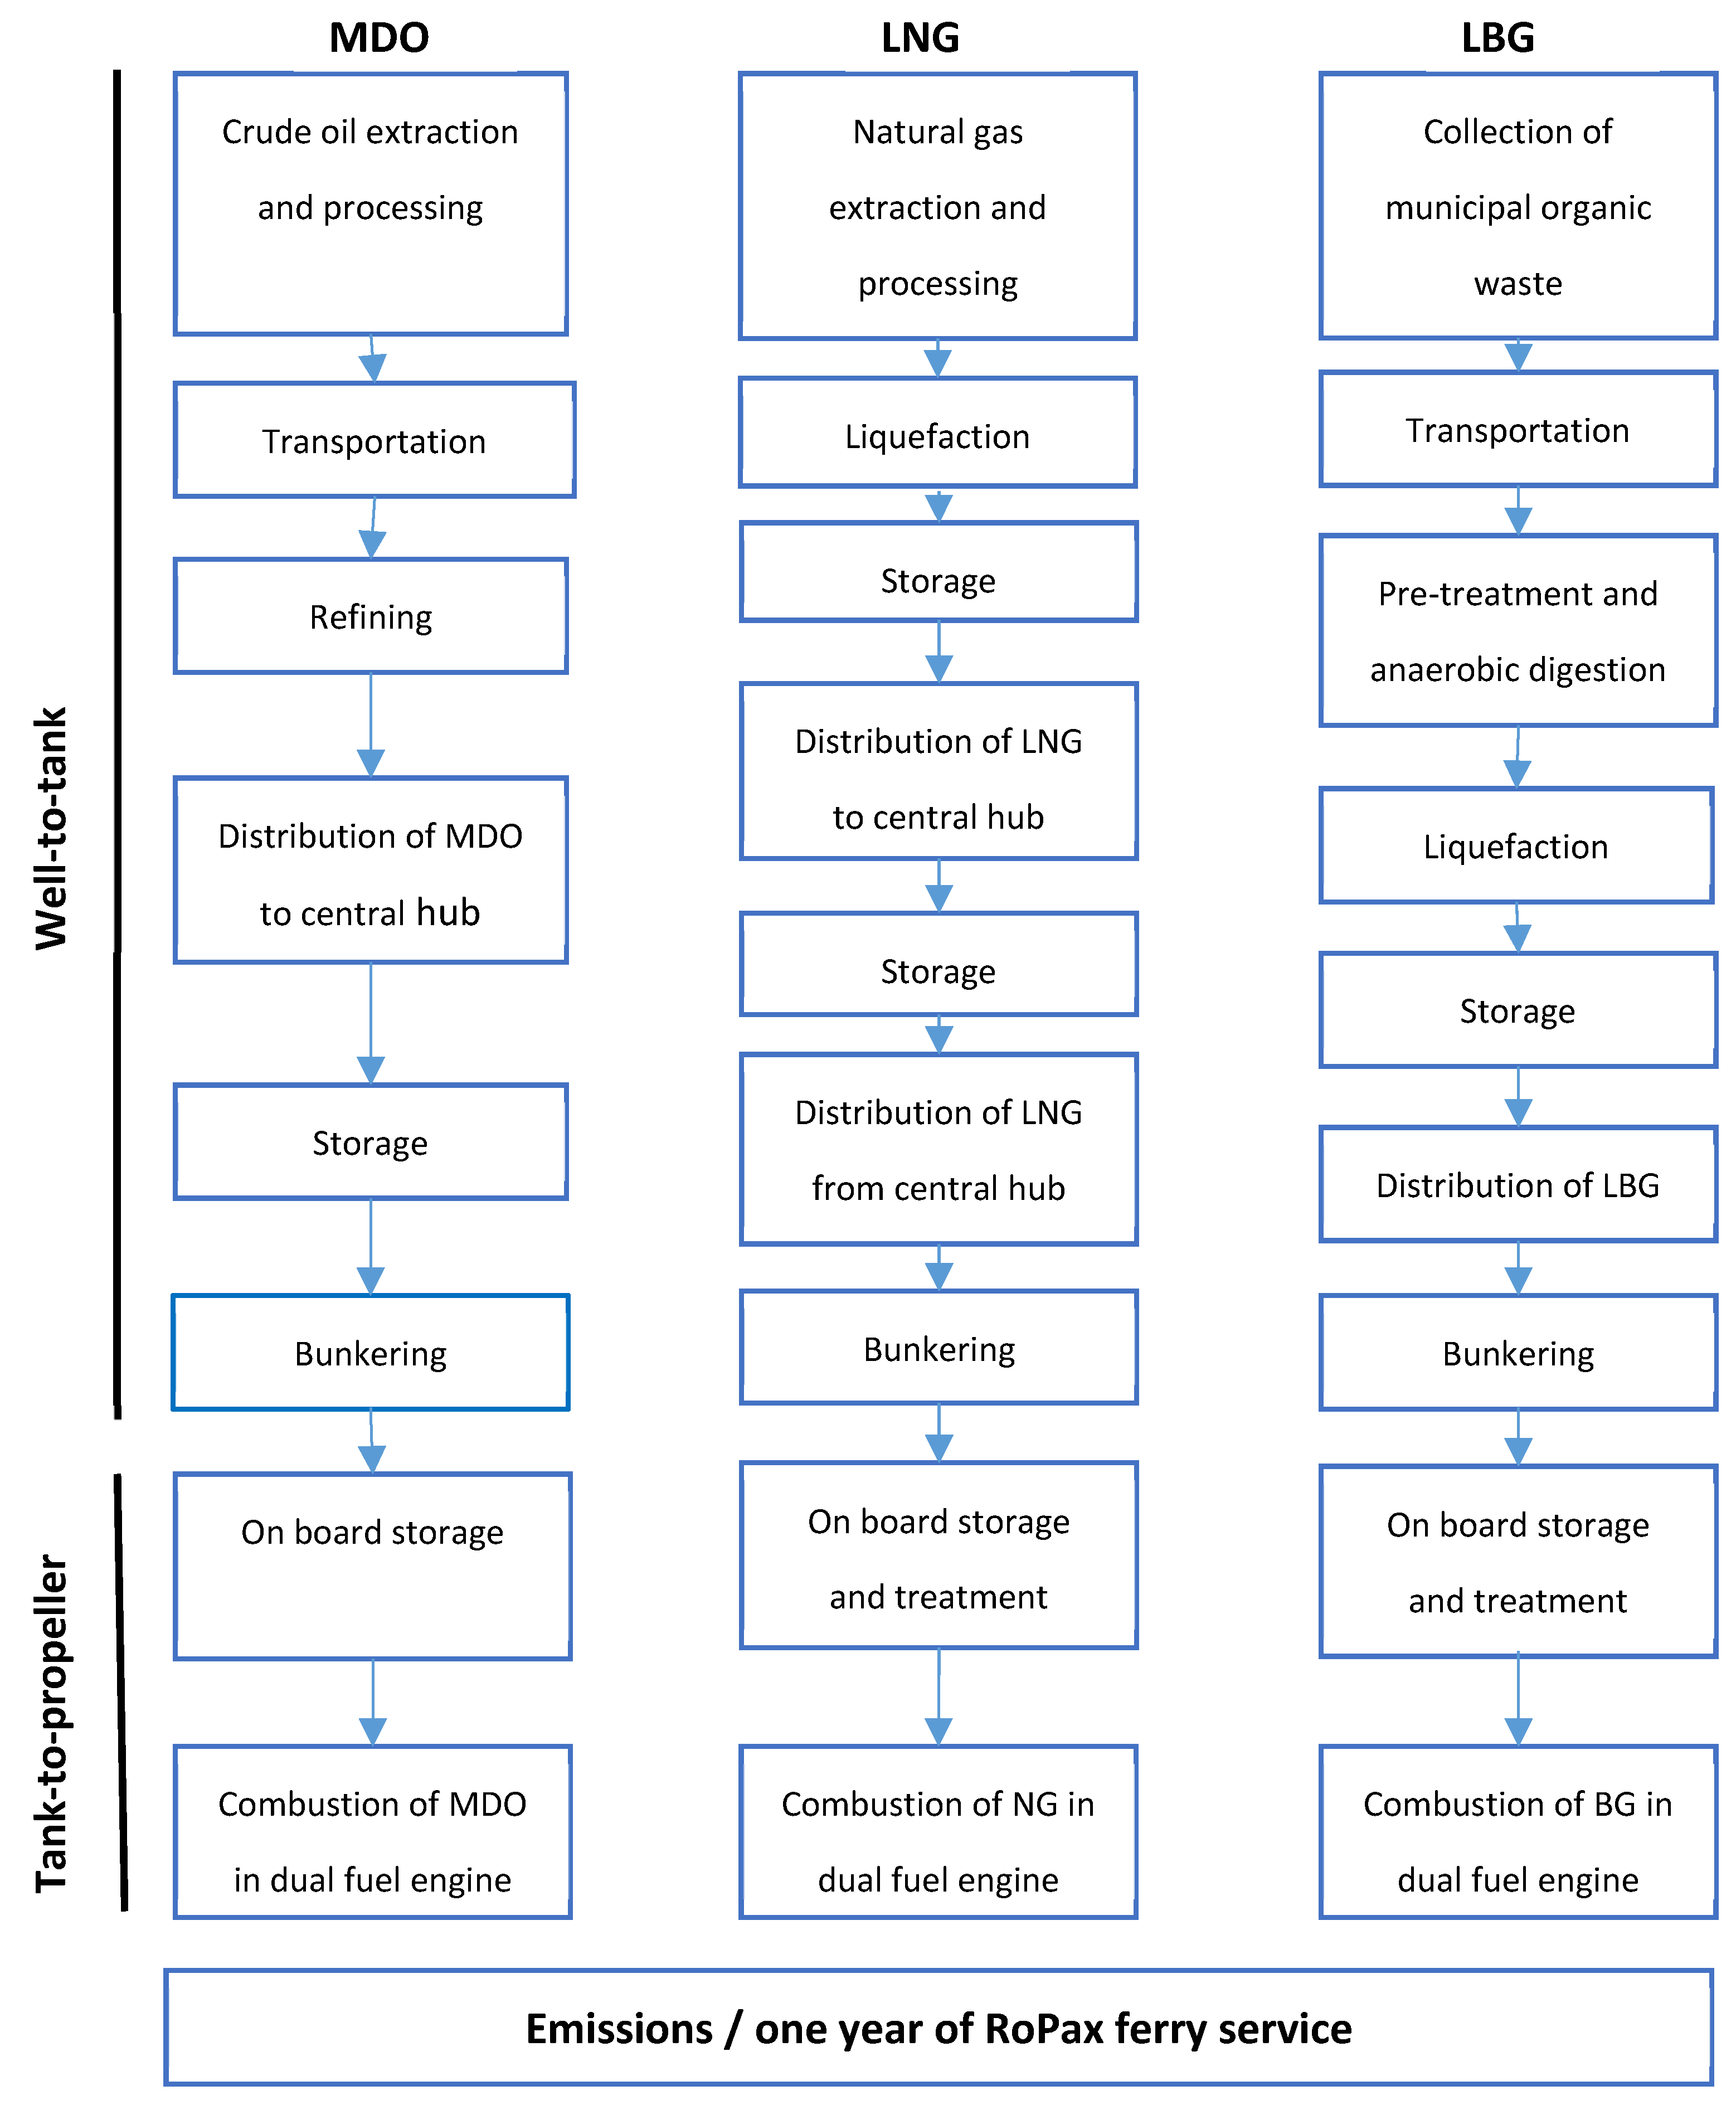
This study used the LCA method for evaluating the global warming potential of the selected fuels. Data on GHG emissions were collected for all processes in the life cycle chains of the fuels (Figure 1), including extraction and pre-treatment of the raw materials, fuel production, storage and transport and distribution (termed well-to-tank, WTT), and finally, combustion in a dual-fuel marine engine (termed tank-to-propeller, TTP).
The local environmental impacts evaluated in this study include acidification potential, eutrophication potential, formation of particulate matter and human health damage caused by PM10. These impacts were analyzed only for the tank-to-propeller phase. Table 2 outlines the modelling choices made in this study.
3.2. Functional Unit
The functional unit is the reference unit against which life-cycle inventory data is calculated. This reference value is necessary to ensure the comparability of the investigated alternatives [31,32]. The functional unit considered in this study is one year of RoPax ferry operation, including freight and passenger transportation. The average engine load was set to 45%. Engine efficiency at 45% load is 46%. Based on these values and vessel data in Table 1, the annual fuel consumption was calculated to correspond to the energy content of 225 TJ fuel.
3.3. Fuel Chains and Data Sources
3.3.1. MDO Route
The production steps of MDO include drilling and extracting crude oil, pre-treatment, and refining. After refining, MDO is transported on dedicated tankers to a distribution hub and stored prior further distribution. GHG emissions data during well-to-tank for MDO are from Kollamthodi et al. [18].
MDO is combusted in a medium-speed four-stroke engine equipped with SCR after-treatment system, which reduces NOx emissions by 82% from 9.6 g/kWh (Tier II engine) to 1.73 g/kWh. Urea dosing for target NOx conversion was determined based on stoichiometric dosing, assuming 1:2 for urea:NH3 stoichiometry and 1:1 for NOx:NH3 stoichiometry [33,34]:
Using molar masses 46 g/mole for NOx and 60 g/mole for urea, we can conclude that 5.1 g pure urea/kWh is needed. This corresponds to 12.8 kg UWS40/MWh (11.7 L/MWh).
For operational emission factors the 3rd IMO Greenhouse Gas Study [35] was used, augmented with data from Brynolf et al. [36]. Ammonia (NH3) was included in the inventory since the use of urea in SCR may cause ammonia emissions, known as ammonia slip. Ammonia emission factor 0.005 g/MJ fuel was used, corresponding to NH3 slip just below 10 ppm. Ammonia emissions were calculated by using the equation:
where EP = pollutant mass referenced to output power (g/kWh), EV = exhaust emission value in ppm, MNH3 = molecular mass of NH3 (17.031 g/mole), MExh. = molecular mass of wet exhaust (28.84 g/mole), and ṁExh. = exhaust mass flow in g/kWh. For exhaust gas mass flow, the rate 7 kg/kWh was applied.
3.3.2. LNG Route
In this study, natural gas was assumed to be extracted from North Sea and brought to the LNG plant in Norway by subsea pipeline. At the LNG plant the gas first passes through a cleansing process, separating CO2 and water. Then the gas is cooled to approximately −162 °C to change it into a liquid form. The liquid gas is then transported cryogenically to the central hub in Finland and stored before distribution by road tankers.
GHG emissions data during the well-to-tank phase for LNG are from Edwards et al. [37], with the exception that the assumed shipping distance was reduced from 5500 nautical miles to 2000 nm, and the road transport distance was halved from 500 km to 250 km. The emission factors for the combustion of natural gas were collected from Gilbert et al. [6], Brynolf et al. [21] and Bengtsson et al. [20]. It was assumed an SCR system would not be needed. A methane slip rate of 2%, calculated from Gilbert et al. [6], and a pilot fuel (MDO) rate of 1.4% for ignition were applied.
3.3.3. LBG Route
An LCA study of biogas production systems can be complex. There is a large range of systems to consider, reflecting the great variety of available raw materials (feedstocks), digestion technologies and biogas applications [38]. This study assumed LBG to be produced from anaerobic digestion of locally collected municipal organic waste. Other biomass resources could lead in somewhat different emission profiles. Following anaerobic digestion, the biogas is purified and upgraded to around 97% methane. Then it is liquefied and stored before distribution via cryogenic road tanker to the customer.
Operation of the biogas plant is usually the most energy-intensive part of the process, accounting for 50–80% of the energy input embodied in these products [38]. However, the fossil energy share is moderate, as the biogas produced in the system can be used, for example, in heating processes. A significant source of GHG emissions is through methane leakages. Kollamthodi et al. [18] applied methane leakage of 1.2% for anaerobic digestion and 0.5% for upgrading the biogas to bio-methane, leading to total CO2-equivalents 21.3 g CO2-eq./MJ fuel. These values are also used in this study. It should be noted that higher leakage rates associated with, e.g., incomplete processing or inadequate storage would markedly increase total GHG emissions in CO2-equivalents. For example, methane slippage of 3% from anaerobic digestion would increase CH4 emissions from this step to 0.6 g CH4/MJ, leading to total CO2-equivalents 33.5 g CO2-eq./MJ during well-to-tank. Therefore, it is extremely important that leakages during the gas processing are carefully prevented and monitored.
Tank-to-propeller emissions data are mainly from Bentgsson et al. [20] and Brynolf et al. [36]. Producing bio-methane from anaerobic digestion of organic waste results in fuels that contain only biogenic carbon. Hence, combustion of bio-derived methane releases only biogenic CO2 emissions. Biogenic CO2 emissions are related to the natural carbon cycle, and are not considered to contribute to global warming [18,37]. Dinitrogen oxide (N2O) emissions were assumed to be the same as in the LNG case. No SCR system was expected to be needed. Methane slip of 2% during the tank-to-propeller phase and a pilot fuel (MDO) rate 1.4% for ignition were applied, also identical to the rates used for LNG.
Table 3 summarizes the emissions to air, divided into well-to-tank and tank-to-propeller phases.
3.4. Impact Categories and Included Primary Pollutants
This study addressed both local pollutants and GHG emissions. Global warming potential (GWP) is used to determine a substance’s climate impact. “This is a measure of the effect on radiation of a particular quantity of the substance over time, relative to that of the same quantity of CO2” [39]. Therefore, GWP depends on the gas’s time in the atmosphere and on its capacity to affect radiation [39]. The main GHG from shipping are CO2, CH4 and N2O. All three species are evaluated in this study and total GHG emissions are presented in terms of CO2-equivalents, using 100-years global warming potential factors of 34 for CH4 and 298 for N2O [16].
Examples of regional environmental impacts categories include acidification and eutrophication. The primary contributors to acidification are oxides of sulfur (SOx), nitrogen oxides (NOx) and ammonia. “In order to describe the acidifying effect of substances, their acid formation potential (ability to form H+ ions) is calculated and set against a reference substance, SO2” [39]. This produces a measure of their acidification potential, expressed as an SO2-equivalent (SO2-eq.) [40]. This study applies SO2-eq. factors of 0.5 for NOx and 1.6 for NH3. These values are based on Huijbregts et al. [41], where acidification and terrestrial eutrophication potentials for a number of European regions were determined, taking into account background depositions and ecosystem sensitivities.
Eutrophication refers to the enrichment of nutrients in the ecosystem that cause excessive biomass growth in water or soil, leading to numerous adverse effects such as oxygen depletion in the sea. Eutrophication in marine and terrestrial ecosystems mainly is linked to transformation of NOx and NH3 emissions into nitrogen [39]. In this study, NOx-equivalent (NOx-eq.) factor 3.7 for NH3 was used, also based on Huijbregts et al. [41].
Important air pollutants causing human health damage include primary fine particles (PM10), NH3, NOx and SO2 producing inorganic secondary PM10 aerosols [42]. Two different evaluation methods were included in this study. First, primary PM10 emissions from combustion of selected fuels were calculated (in kg emissions/functional unit) as an indicator for impact on human health. Second, the disability-adjusted life year (DALY) concept was applied as a more specific method for assessing impacts on human life. DALY is a sum of years lost due to illness, disability or early death [40]. It is expressed as the number of years lost per kilogram emission. The characterization factors (Table 4) for health effects of PM, NH3, NOx and SOx emissions are from van Zelm et al. [42].
4. Results
The main results of the analysis are presented in the following sections. More detailed calculations and complete numerical results are available as Supplementary Materials, Spreadsheet S1, accompanying the online article
4.1. Global Warming Potential
Total GHG emissions from all three species considered (CO2, CH4 and N2O) are presented in terms of CO2-equivalents, using 100-years global warming potential value 34 for CH4 and 298 for N2O.
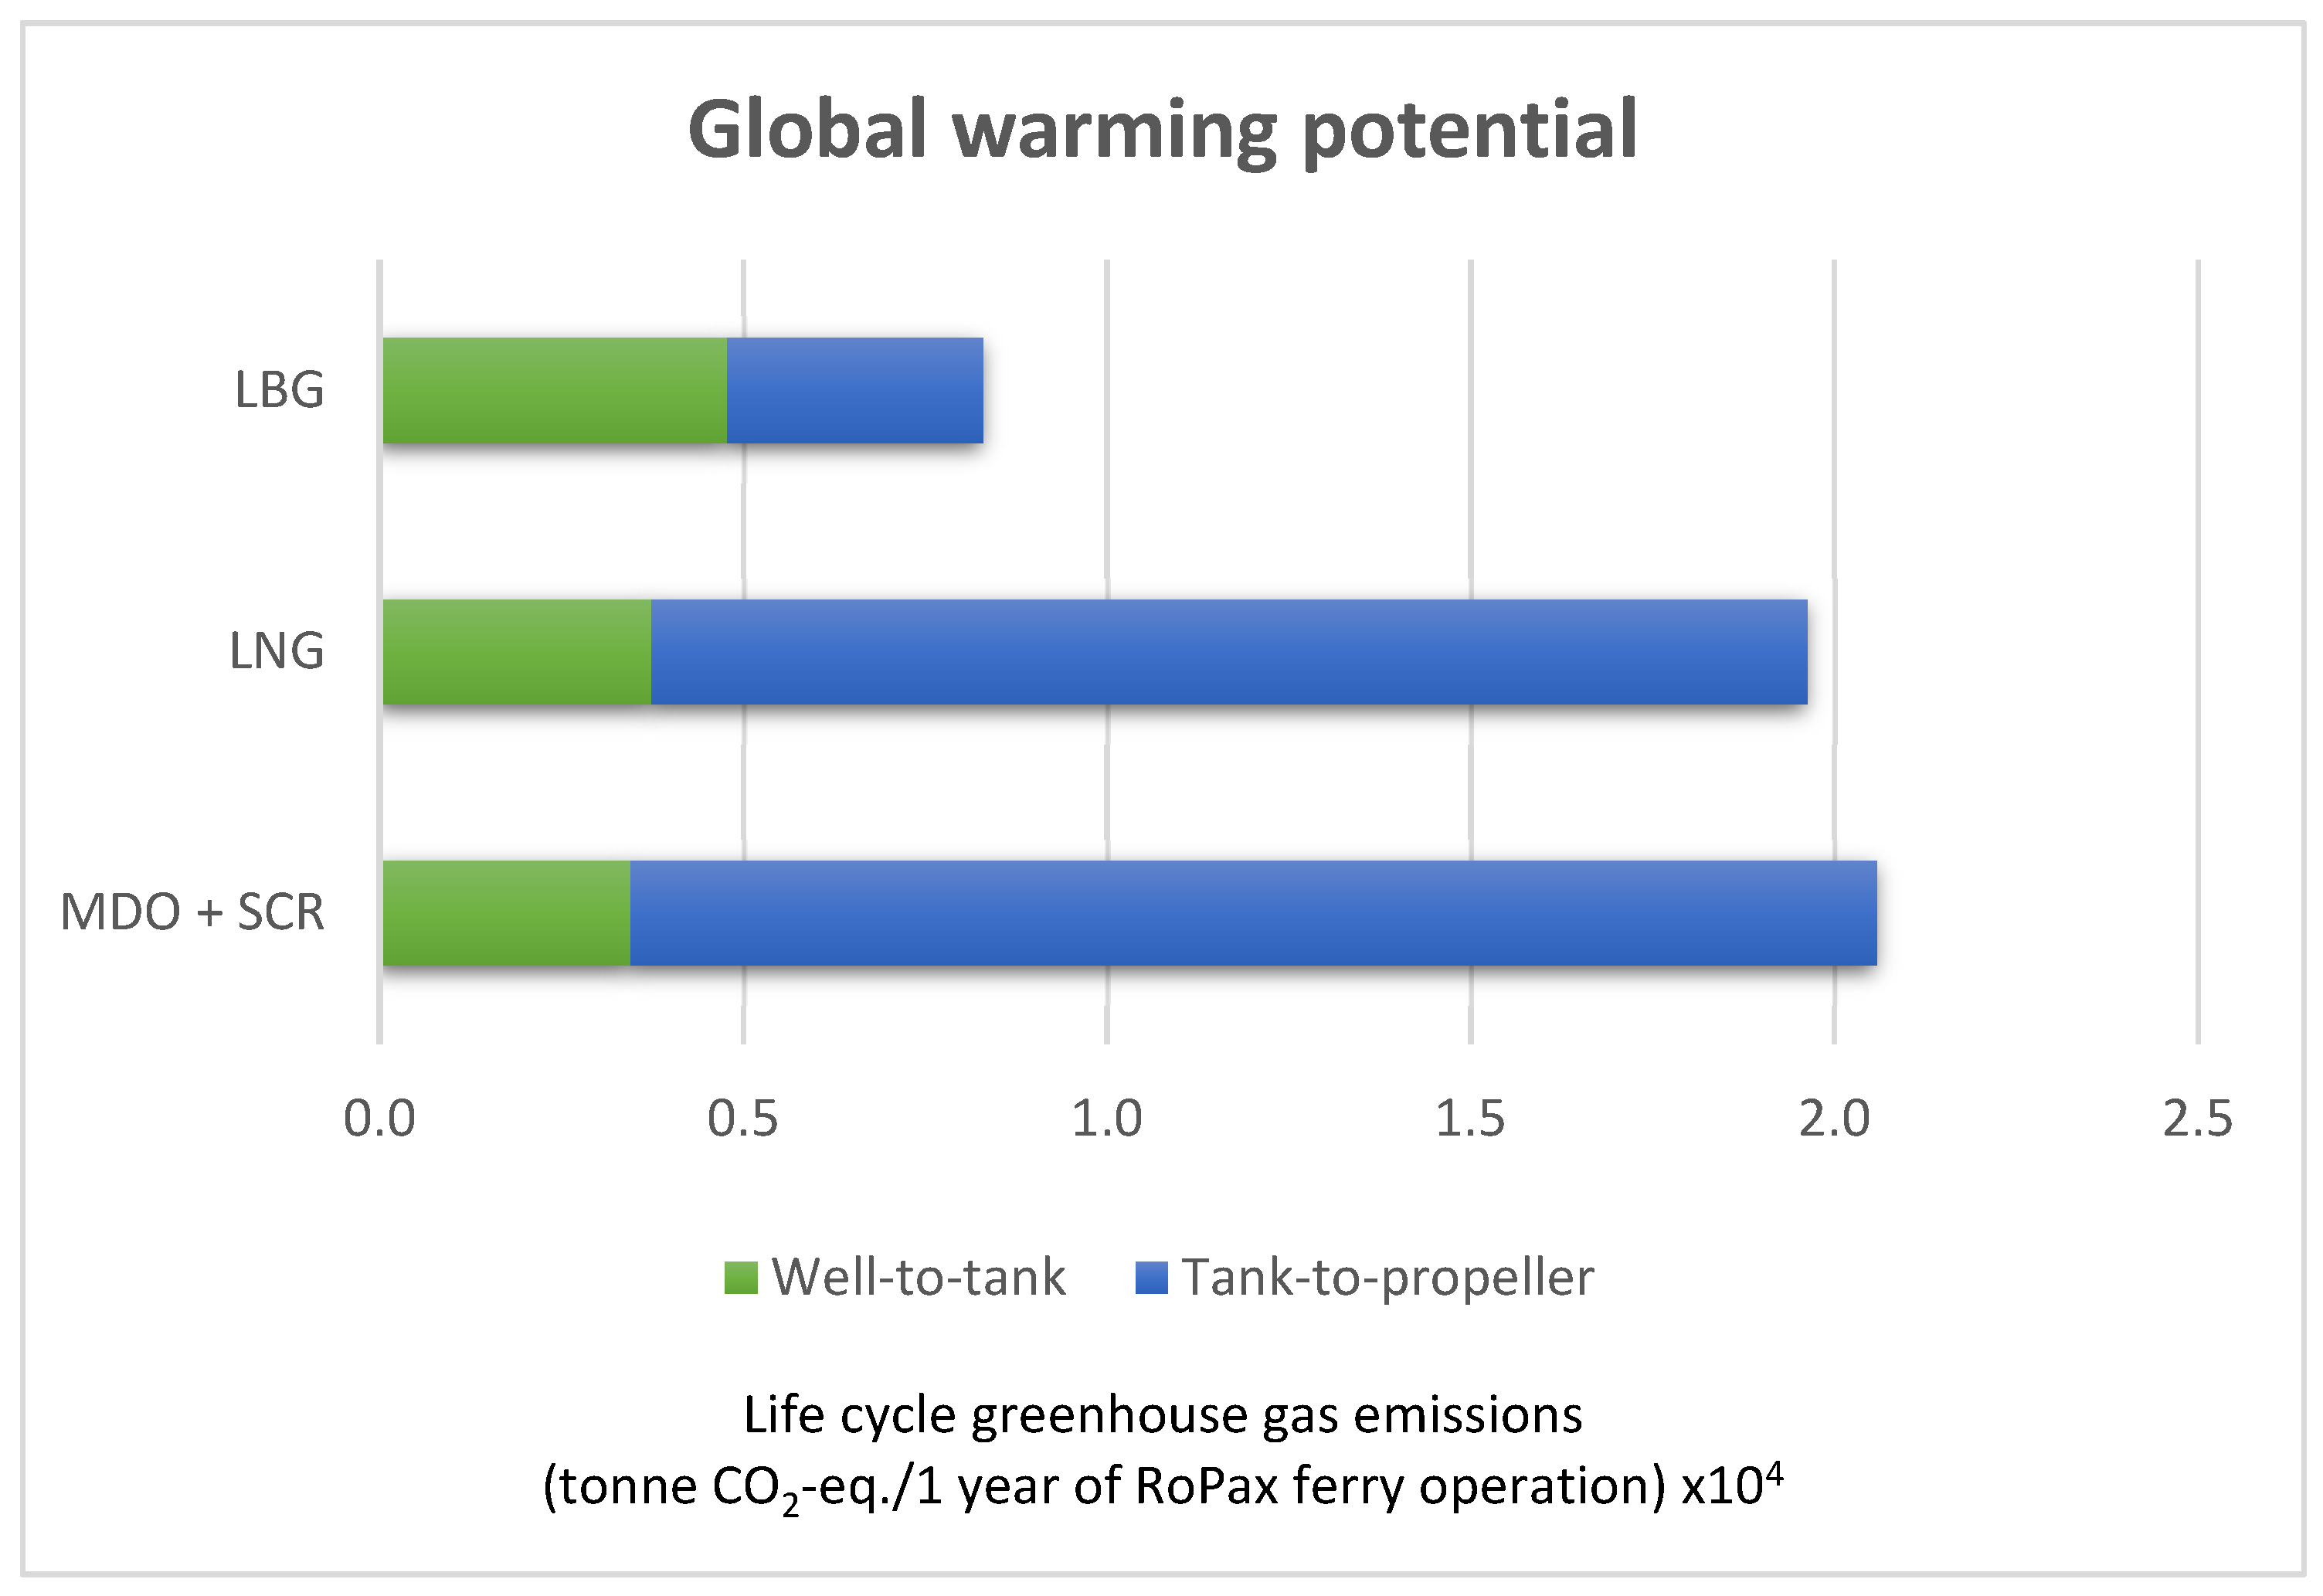
The dominance analysis (Figure 2) shows where in the life cycle the largest GHG emissions occur. With fossil fuels, MDO and LNG, the TTP phase of the life cycle dominates the global warming impact. Approximately 80% of the total GHG emissions from the whole chain are released during this phase. The analysis for LBG is markedly different, showing very large TTP emissions benefits in the shift from fossil fuel to bio-methane. This difference is due to the biogenic nature of CO2 emissions from the combustion of renewable fuels. As mentioned above, biogenic CO2 emissions are not considered to contribute to global warming and are therefore reported as zero from an accounting perspective [18]. LBG’s TTP phase GHG emissions mainly are caused by methane slip from the dual-fuel engine, and to a minor extent from fossil CO2 emissions originating from the MDO pilot fuel. The WTT phase GHG emissions mainly originate from the use of electricity during biogas production and bio-methane liquefaction processes and from methane leakages during anaerobic digestion.
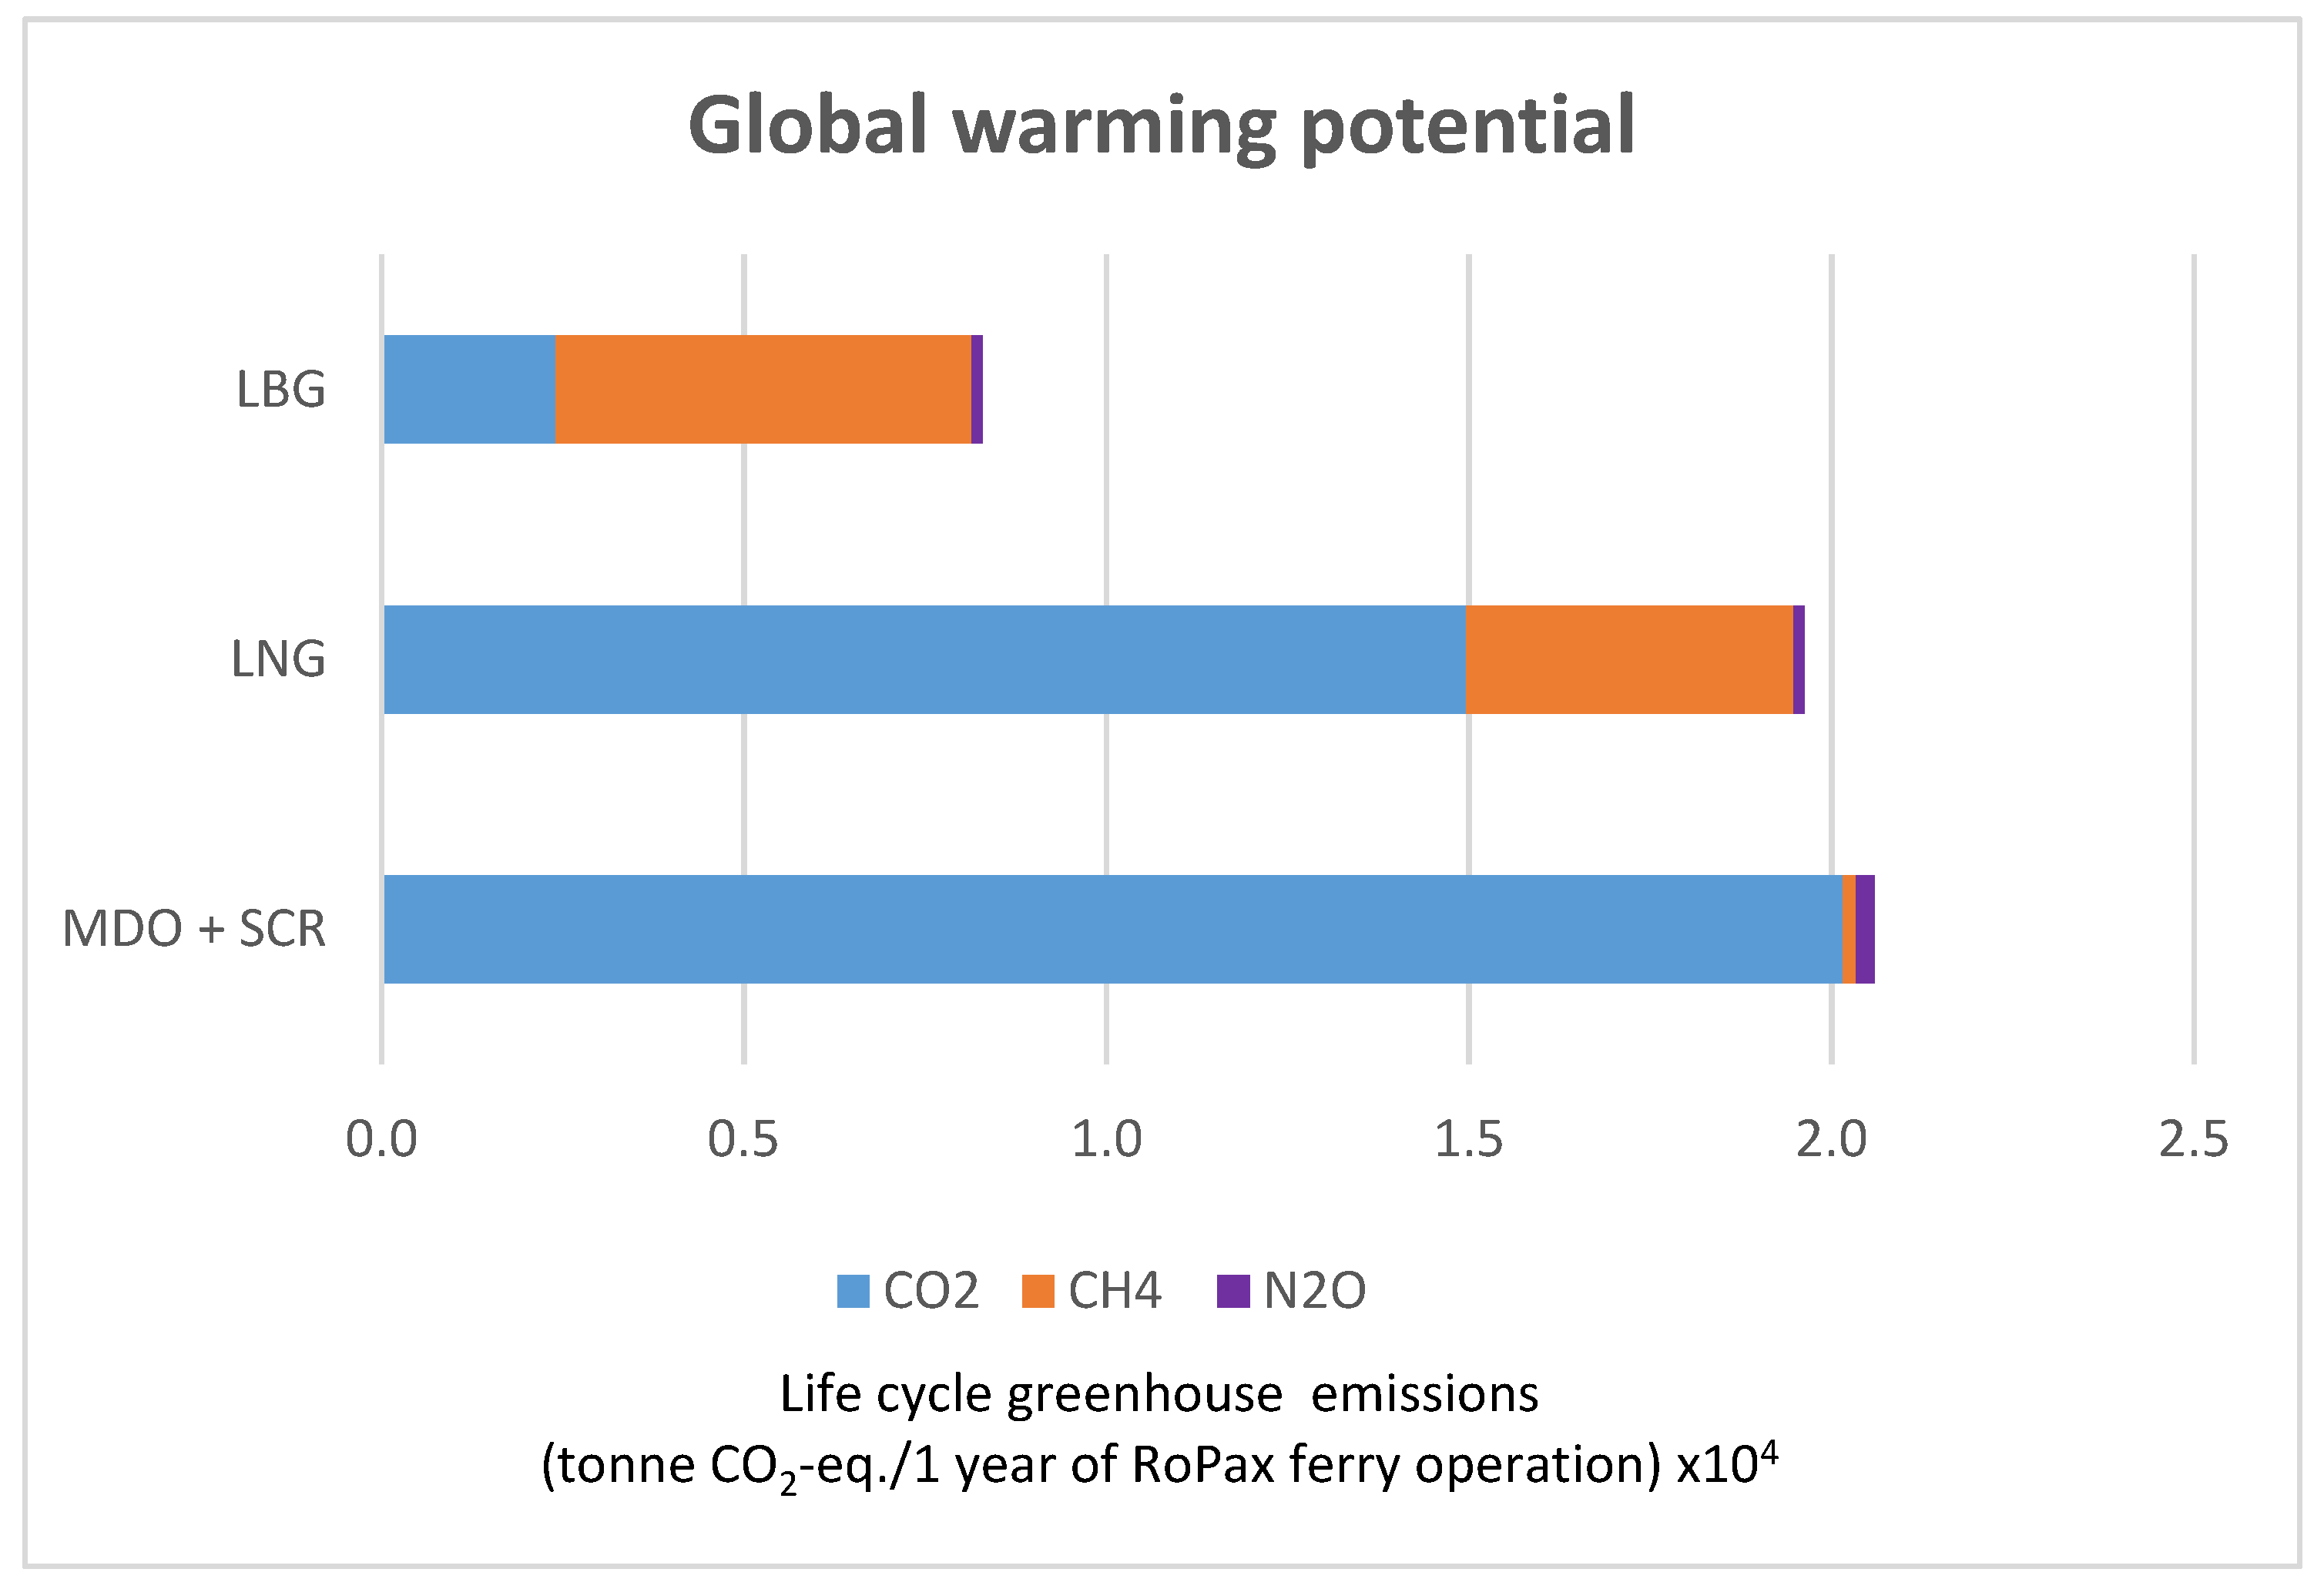
The contribution analysis (Figure 3) shows how the three different climate gases contribute to each fuel’s global warming impact. CO2 is the main contributor to the GWP100 for the two fossil fuels, MDO and LNG. The direct life cycle CO2 emissions from combustion of natural gas are about 25% lower than with MDO. However, much of this benefit is negated due to higher CH4 emissions when using LNG instead of MDO. Overall, the analysis shows that when assuming 2% methane slip from the dual-fuel engine used for natural gas combustion, the life-cycle climate impact of LNG is slightly lower (5%) than for MDO.
The climate impact contribution from CH4 emissions is significant for both methane-based fuels, LNG and LBG. The methane stems from fugitive leakages in the fuel chain and methane slip from combustion. Well-to-propeller CH4 emissions for LNG represent 23% of the total life cycle GWP100, and for LBG the CH4 emissions are 69% of the total life cycle GWP100. Direct CO2 emissions from LBG originate mainly from biogas production and liquefaction processes, and to a lesser extent from the MDO pilot fuel.
Emissions of N2O account for less than 2% of the total GWP100 of all three fuels in this study, despite its potency as a GHG being assessed as 298 times greater than CO2.
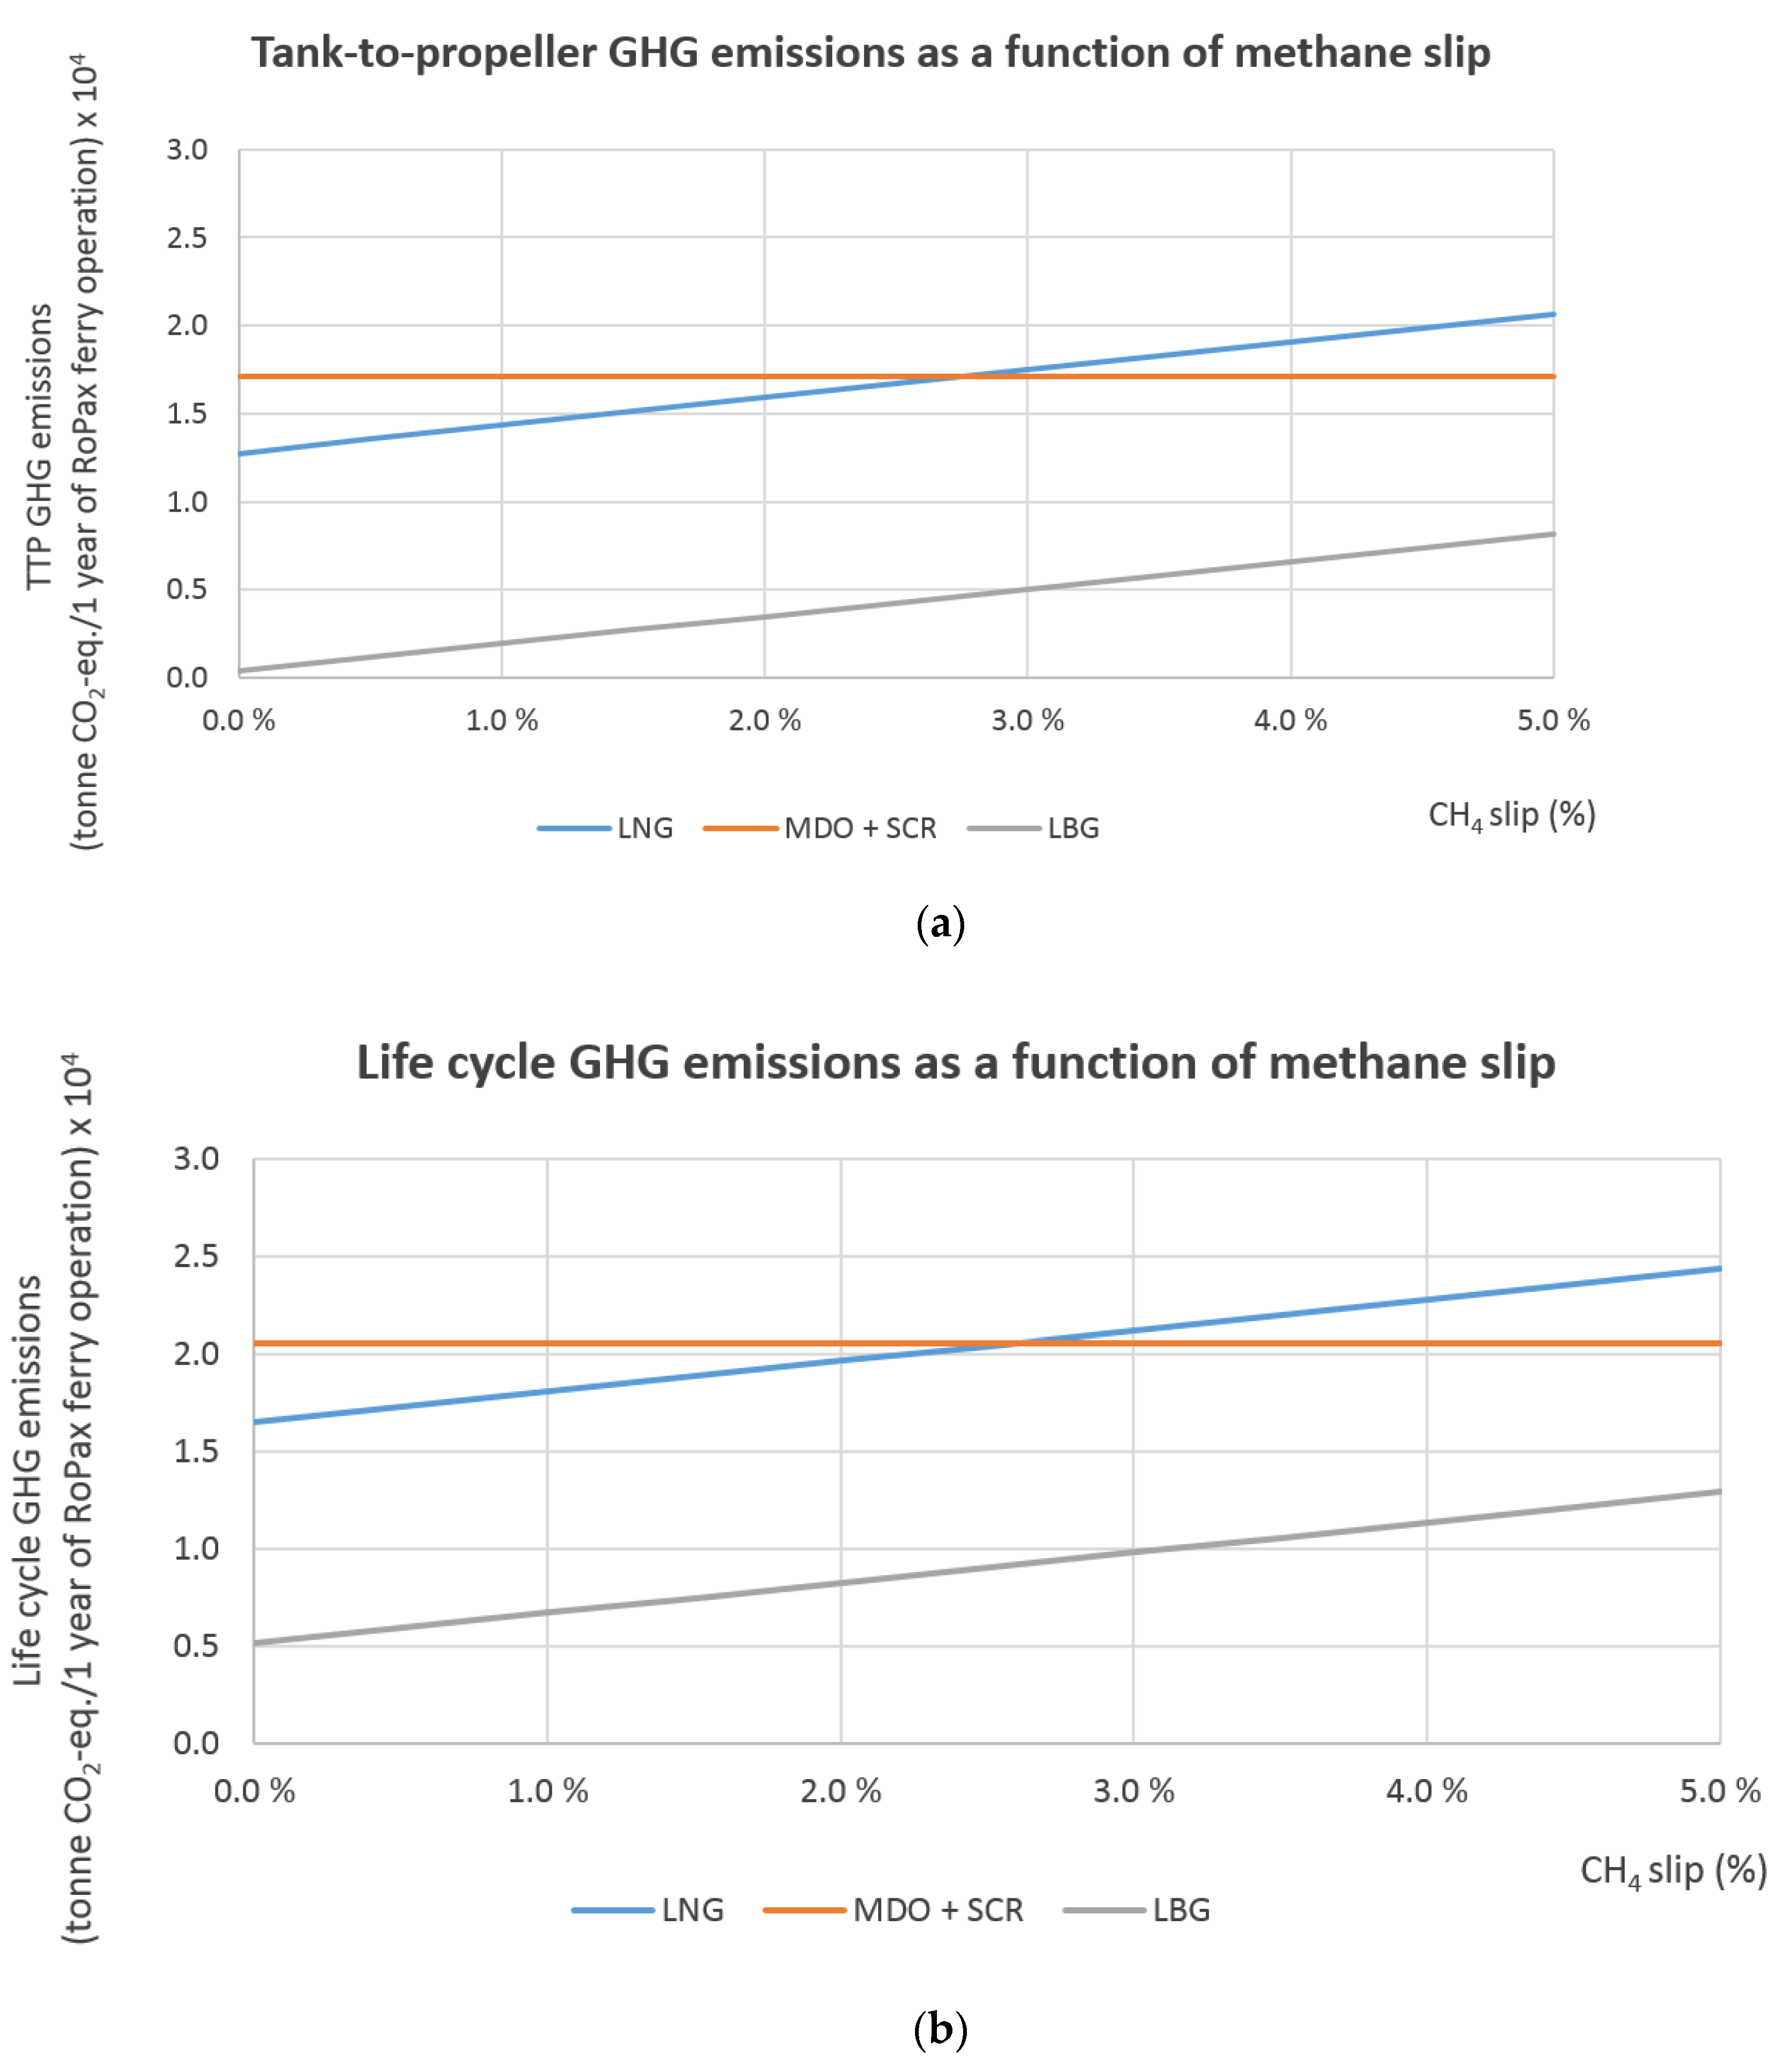
The contribution analysis indicates clearly that GHG emission impacts of methane-fueled vessels are highly sensitive to the level of methane slip. In Figure 4b, a comparison of life cycle GHG emissions from the three investigated fuel options is presented as a function of methane leakage from the dual-fuel engine.
It shows that with methane slip of approximately 2.5% (4 g CH4/kWh engine out) during combustion, the life cycle GHG emissions of MDO and LNG use are equal. With zero CH4 slip from combustion, LNG would give a 20% reduction in total life cycle GHG compared with MDO. This underscores the theoretical potential to decrease the GWP100 impact by a fuel switch from MDO to LNG. Conversely, poor control of combustion (CH4 slip > 2.5%) would result in an increase in LNG GWP100 compared with the MDO alternative.
In Figure 4a, only tank to propeller GHG emissions are considered. It shows that annual TTP GHG emissions from an LNG vessel with zero methane slip during combustion would be 26% lower than those from MDO-fueled vessels.
LBG significantly lowers GHG emissions on both life cycle and tank-to-propeller measures. With assumed zero CH4 slip, LBG would cut life cycle GHG emissions by 75% and TTP GHG emissions by 98% compared to MDO.
4.2. Local Environmental Impacts
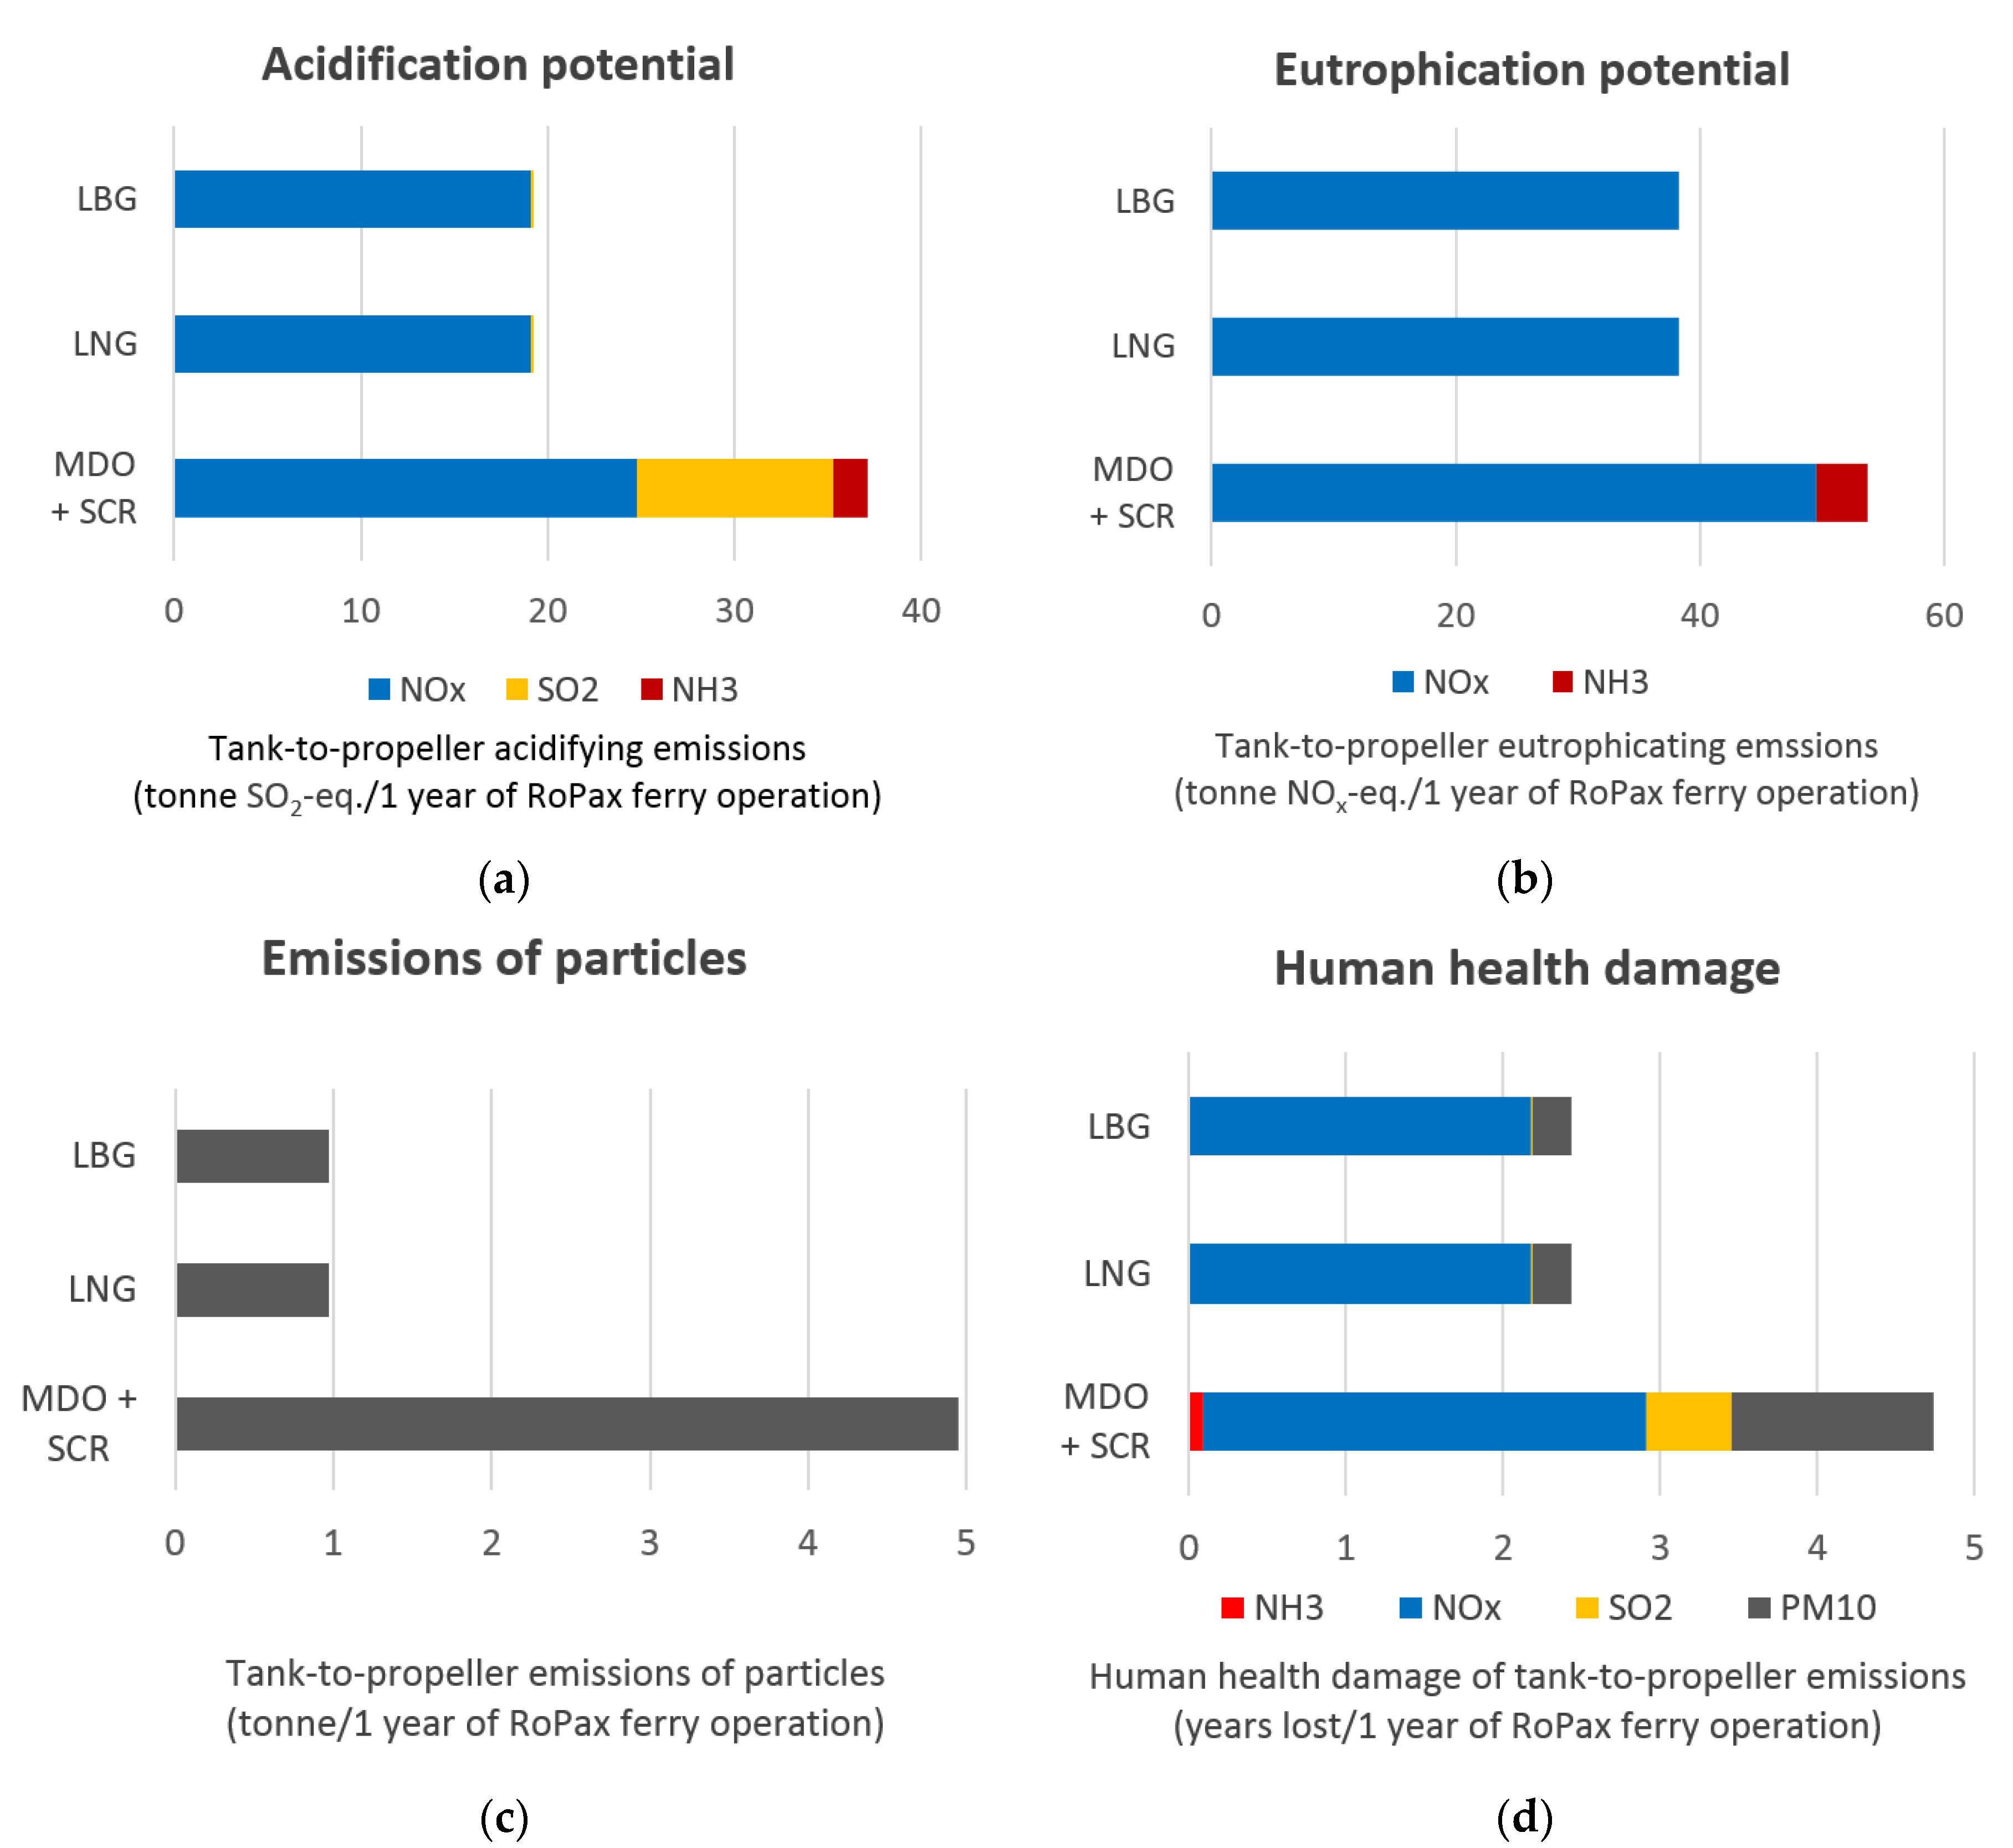
All emissions analyzed here result from fuel combustion. The results are presented in Figure 5. Two clear trends can be seen. First, MDO has a higher contribution than gaseous fuels across all four impact categories. Secondly, local environmental impacts are closely related to nitrogen oxide emissions. The two gaseous fuels, LNG and LBG, produce comparable NOx emissions. Even with the benefit of SCR’s proven NOx reduction, MDO cannot match the two gaseous fuels. Potential ammonia slip from the SCR system’s urea also adds a further small increase to human health damage and to acidification and eutrophication potentials in the case of MDO + SCR.
MDO 0.1% S is a low-sulfur option to standard heavy fuel oil but the SO2 produced in its combustion is still a major addition to this fuel’s acidifying potential compared to LNG and LBG. MDO’s total acidifying emissions are almost double those of the other two fuels. MDO also produces the highest PM emissions: particulates from LNG and LBG are approximately 80% lower. This is due to the gaseous fuels’ low sulfur content and simple fuel molecule, which burns with low soot and PM formation [43].
The impact category for human health damage identifies the relative contributions of NOx, SO2 and NH3 emissions, plus directly emitted particles. Human health damage in terms of years lost due to illness, disability or early death for each year of RoPax ferry operation nearly doubles (from 2.4 to 4.7 years) with MDO compared to LNG or LBG.
4.3. Economic Aspects
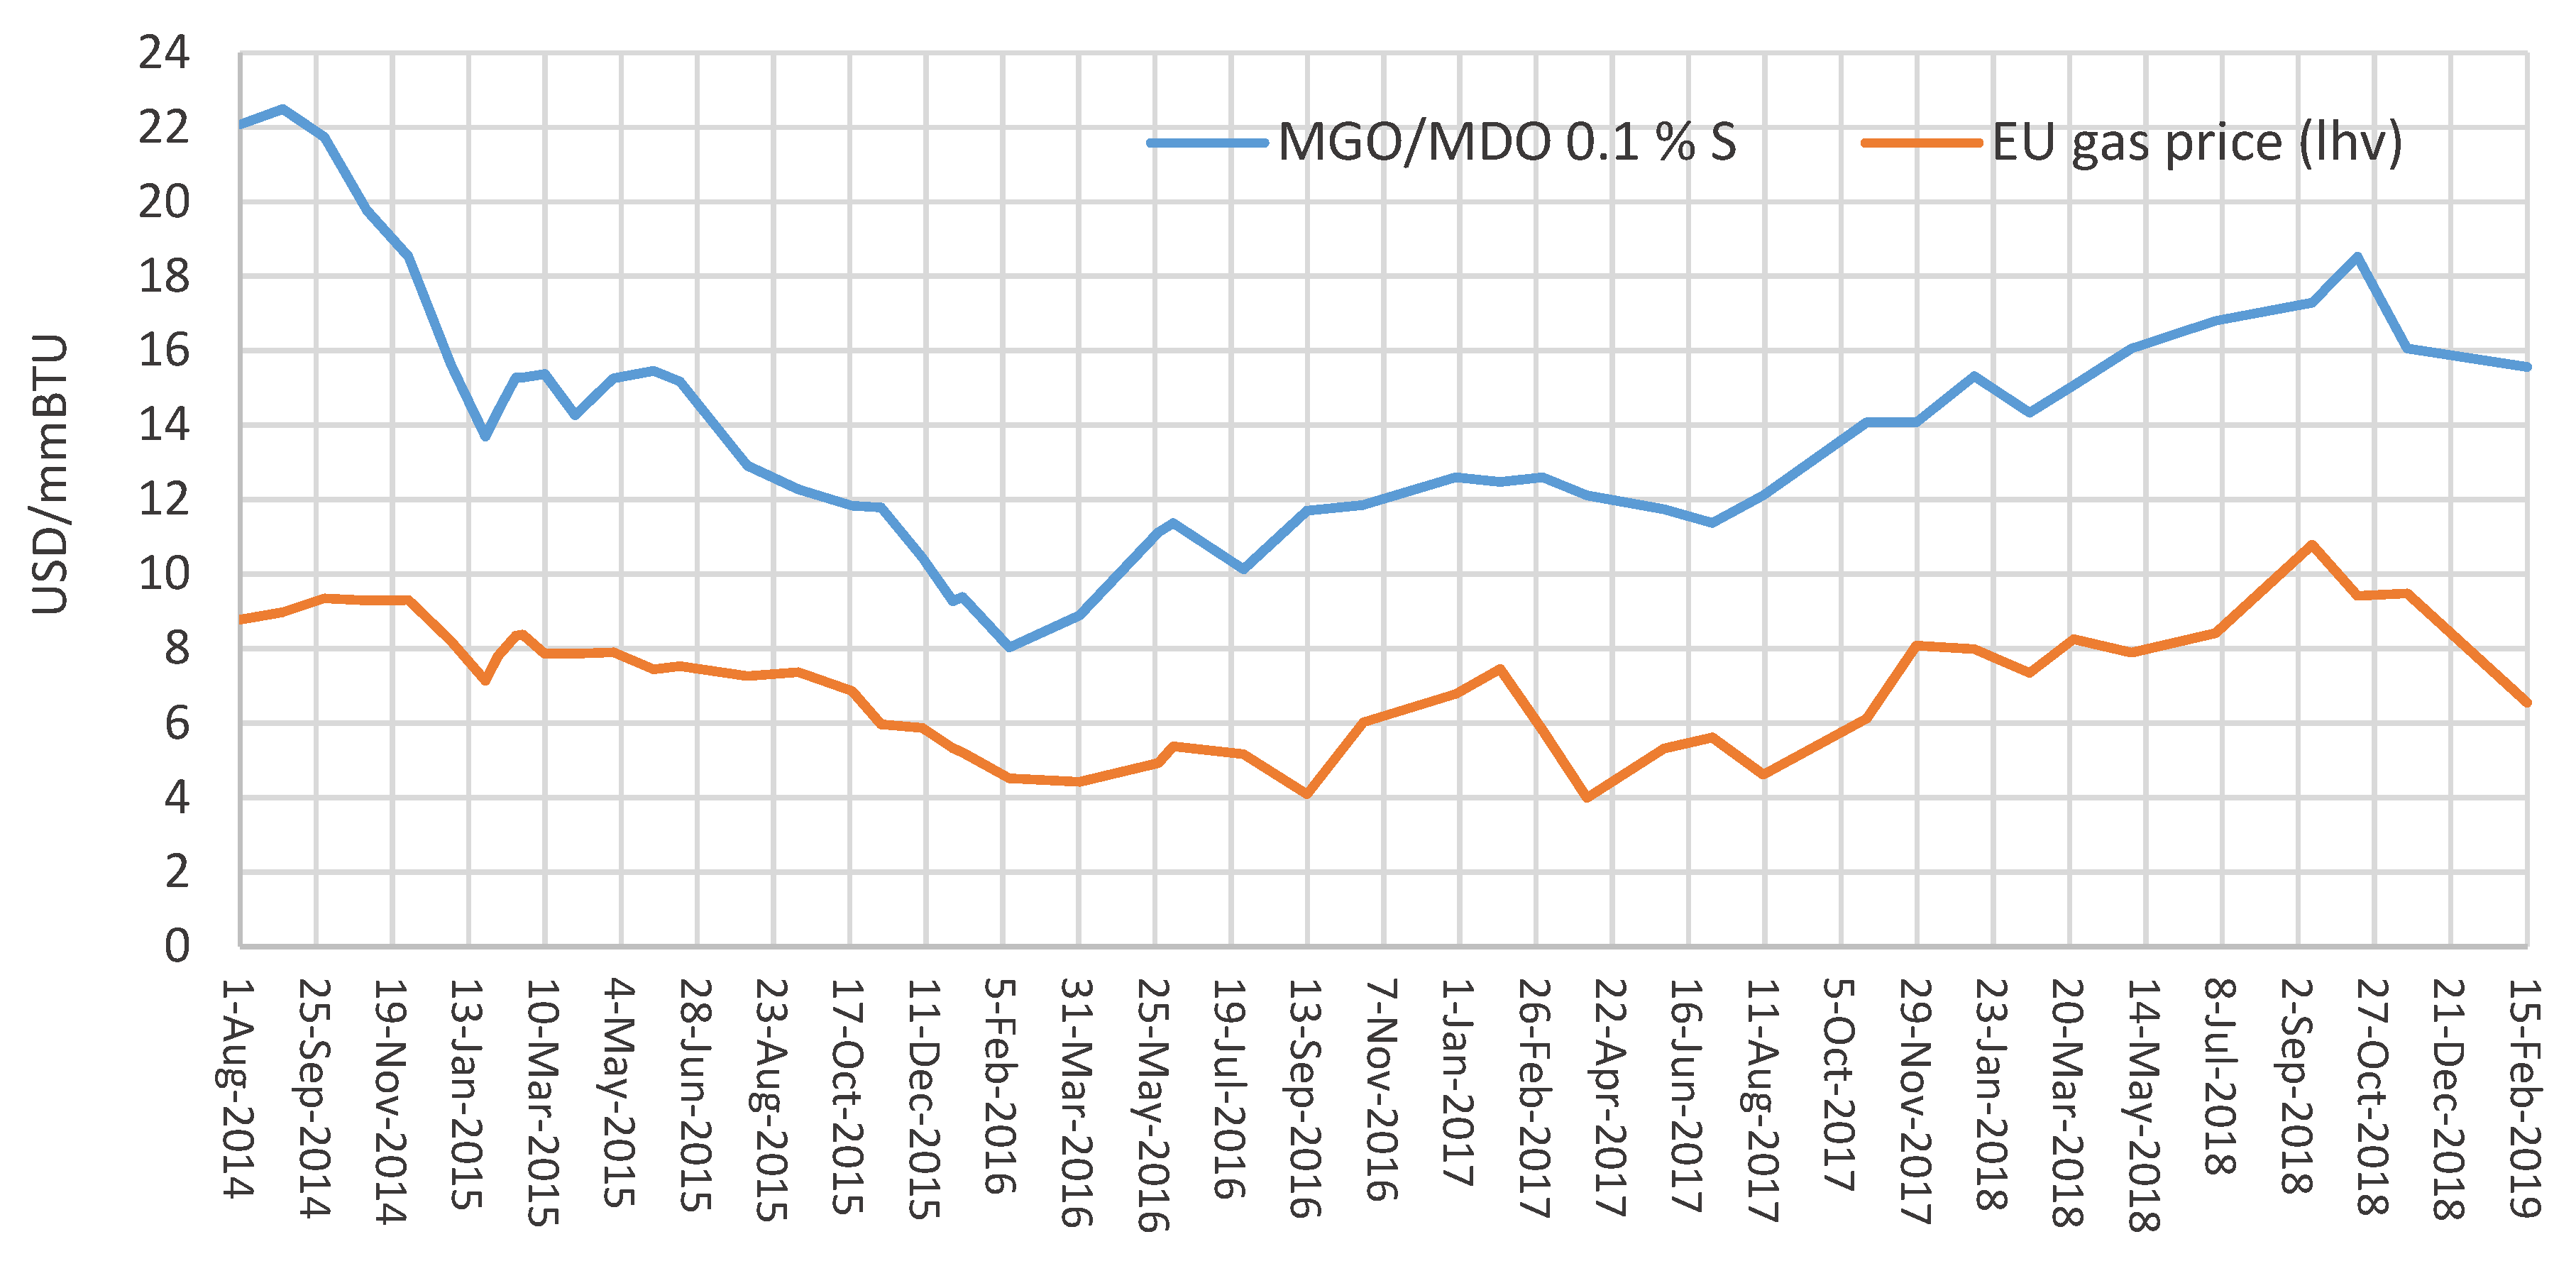
Figure 6 deals with marine fuel prices, giving an overview of the price development for natural gas and low-sulfur MDO/MGO. The price data refers to lower heating values, so the gas prices are about 10% higher than the figures commonly used in the gas industry that relate to the upper heating value [44]. The gas price does not include liquefaction.
Unlike conventional marine fuel oil, LNG has no global bunker prices. LNG price is generally tied to European pipeline gas prices, supplemented by the additional costs of liquefaction and logistics [45]. This study uses $3/mmBTU (2.50 €/GJ) as the cost for liquefaction [44]. Price statistics for LBG in maritime transportation were not found on literature. Information on LBG price was obtained from North European Oil Trade (NEOT); the current price of LBG is 80–90 €/MWh [46].
Based on the above information and fuel prices in February 2019, the prices used in this study were:
- MDO 0.1% S: 554 EUR/t (13.00 EUR/GJ)
- LNG: 389 EUR/t (8.00 EUR/GJ)
- LBG: 1080 EUR/t (22.00 EUR/GJ)
In the case of MDO, the SCR after-treatment system incurs additional operating costs. This study assumes SCR operation and maintenance cost to be 5.55 EUR/MWh, as indicated by Campling et al. [47]. The major operating cost is that of the reducing agent, UWS40. The SCR maintenance procedures include regular cleaning by compressed air to reduce fouling of the catalyst surfaces and gas passages. The urea handling system’s filters and injection nozzles also need regular cleaning. The catalyst has a finite life, so the maintenance regime should include periodic analysis of catalyst activity. Typical lifespans for catalyst blocks are between two and five years, with replacement undertaken by SCR suppliers or authorized contractors [48]. The cost of replacement catalysts can be considered an operating cost.
An SCR after-treatment system can increase exhaust backpressure, typically by around 12–15 mbar at 100% engine load [49]. Any fuel penalties that may arise due to this slight increase in backpressure were not included in this study.
Operational costs per functional unit (1 year of RoPax ferry operation) are presented in Table 5. Only fuel costs and SCR operation and maintenance costs are included. Fuel costs do not include the cost of final delivery to the ship.
The SCR system’s capital cost is not included in the cost matrix. An SCR system, including installation, costs between 50 and 65 EUR/kW [49,50].
Based on above, there is a strong economic argument for LNG in shipping compared to the other two investigated alternatives. Without taxation or subsidies, LBG will find it difficult to compete with the prices of fossil fuels.
5. Discussion
5.1. Environmental Performance
All three options studied are in compliance with the most stringent ECA regulations currently in force or entering into force from 2021. Still, in terms of local environmental impacts, the two gaseous fuels had clear advantages over the MDO + SCR combination. In addition to reduced emissions of acidifying and eutrophying pollutants into the ecosystem, clear health benefits were found associated, e.g., with substantially reduced PM emissions. Reducing particulate emissions can also have short-term climate benefits. For example, Kandlikar et al. [51] found that black carbon—one of the components in PM—could be responsible for about 15 percent of current global warming. Lower PM emissions also facilitate compliance with possible future PM regulations. PM emissions for international shipping currently are regulated only indirectly, by means of limiting sulfur level in fuels. However, quantitative emissions standards for PM already have been incorporated in Euro standards for inland waterway vessels [52] and other non-road machinery. Therefore, new regulations for PM emissions in international shipping may be expected. In this case, specific PM abatement technology would be required for engines running on MDO.
Moreover, concerns about climate change and security of supply of fossil fuels are driving interest in alternative ship fuels. A shift from marine diesel oil to LNG leads to significantly reduced particulate matter, SO2 and NOx emissions, so it is unsurprising that these local environmental benefits are generating substantial interest in LNG as a marine fuel. However, progress towards decarbonization and cutting GHG emissions appears more difficult. Life cycle CO2 emissions of LNG are about 25% lower than with marine diesel oil, but the case for LNG as a marine fuel is less persuasive in terms of total emissions of CO2-equivalents. The overall greenhouse gas impact of LNG depends to a large extent on the amount of methane leaks in LNG production and distribution, and in particular, on the methane slip from fuel combustion. Already, 2.5% methane slip from LNG combustion negates the benefit of reduced CO2 emissions, leading to global warming potential equal to diesel fuel. It, therefore, appears that natural gas currently does not provide the significant reduction in CO2-equivalents needed to achieve the IMO’s ambitious GHG reduction target. This conclusion is consistent with previous studies [3,6,36,53,54]. This underlines the importance of controlling methane emissions from engines. If a methane slip could be minimized to near-zero level, by emissions regulations and technology development, life cycle GHG savings of 20% versus MDO would be possible.
To meet IMO’s goal on decarbonization of shipping is a huge challenge. The active uptake of alternative low-carbon and zero-carbon fuels is needed to meet this target [27,53]. This study demonstrates significant life-cycle GHG emission benefits by replacing fossil fuels with bio-methane; in terms of CO2-equivalent, the reduction is 58% compared to LNG, and 60% compared to MDO.
5.2. Fuel Availability
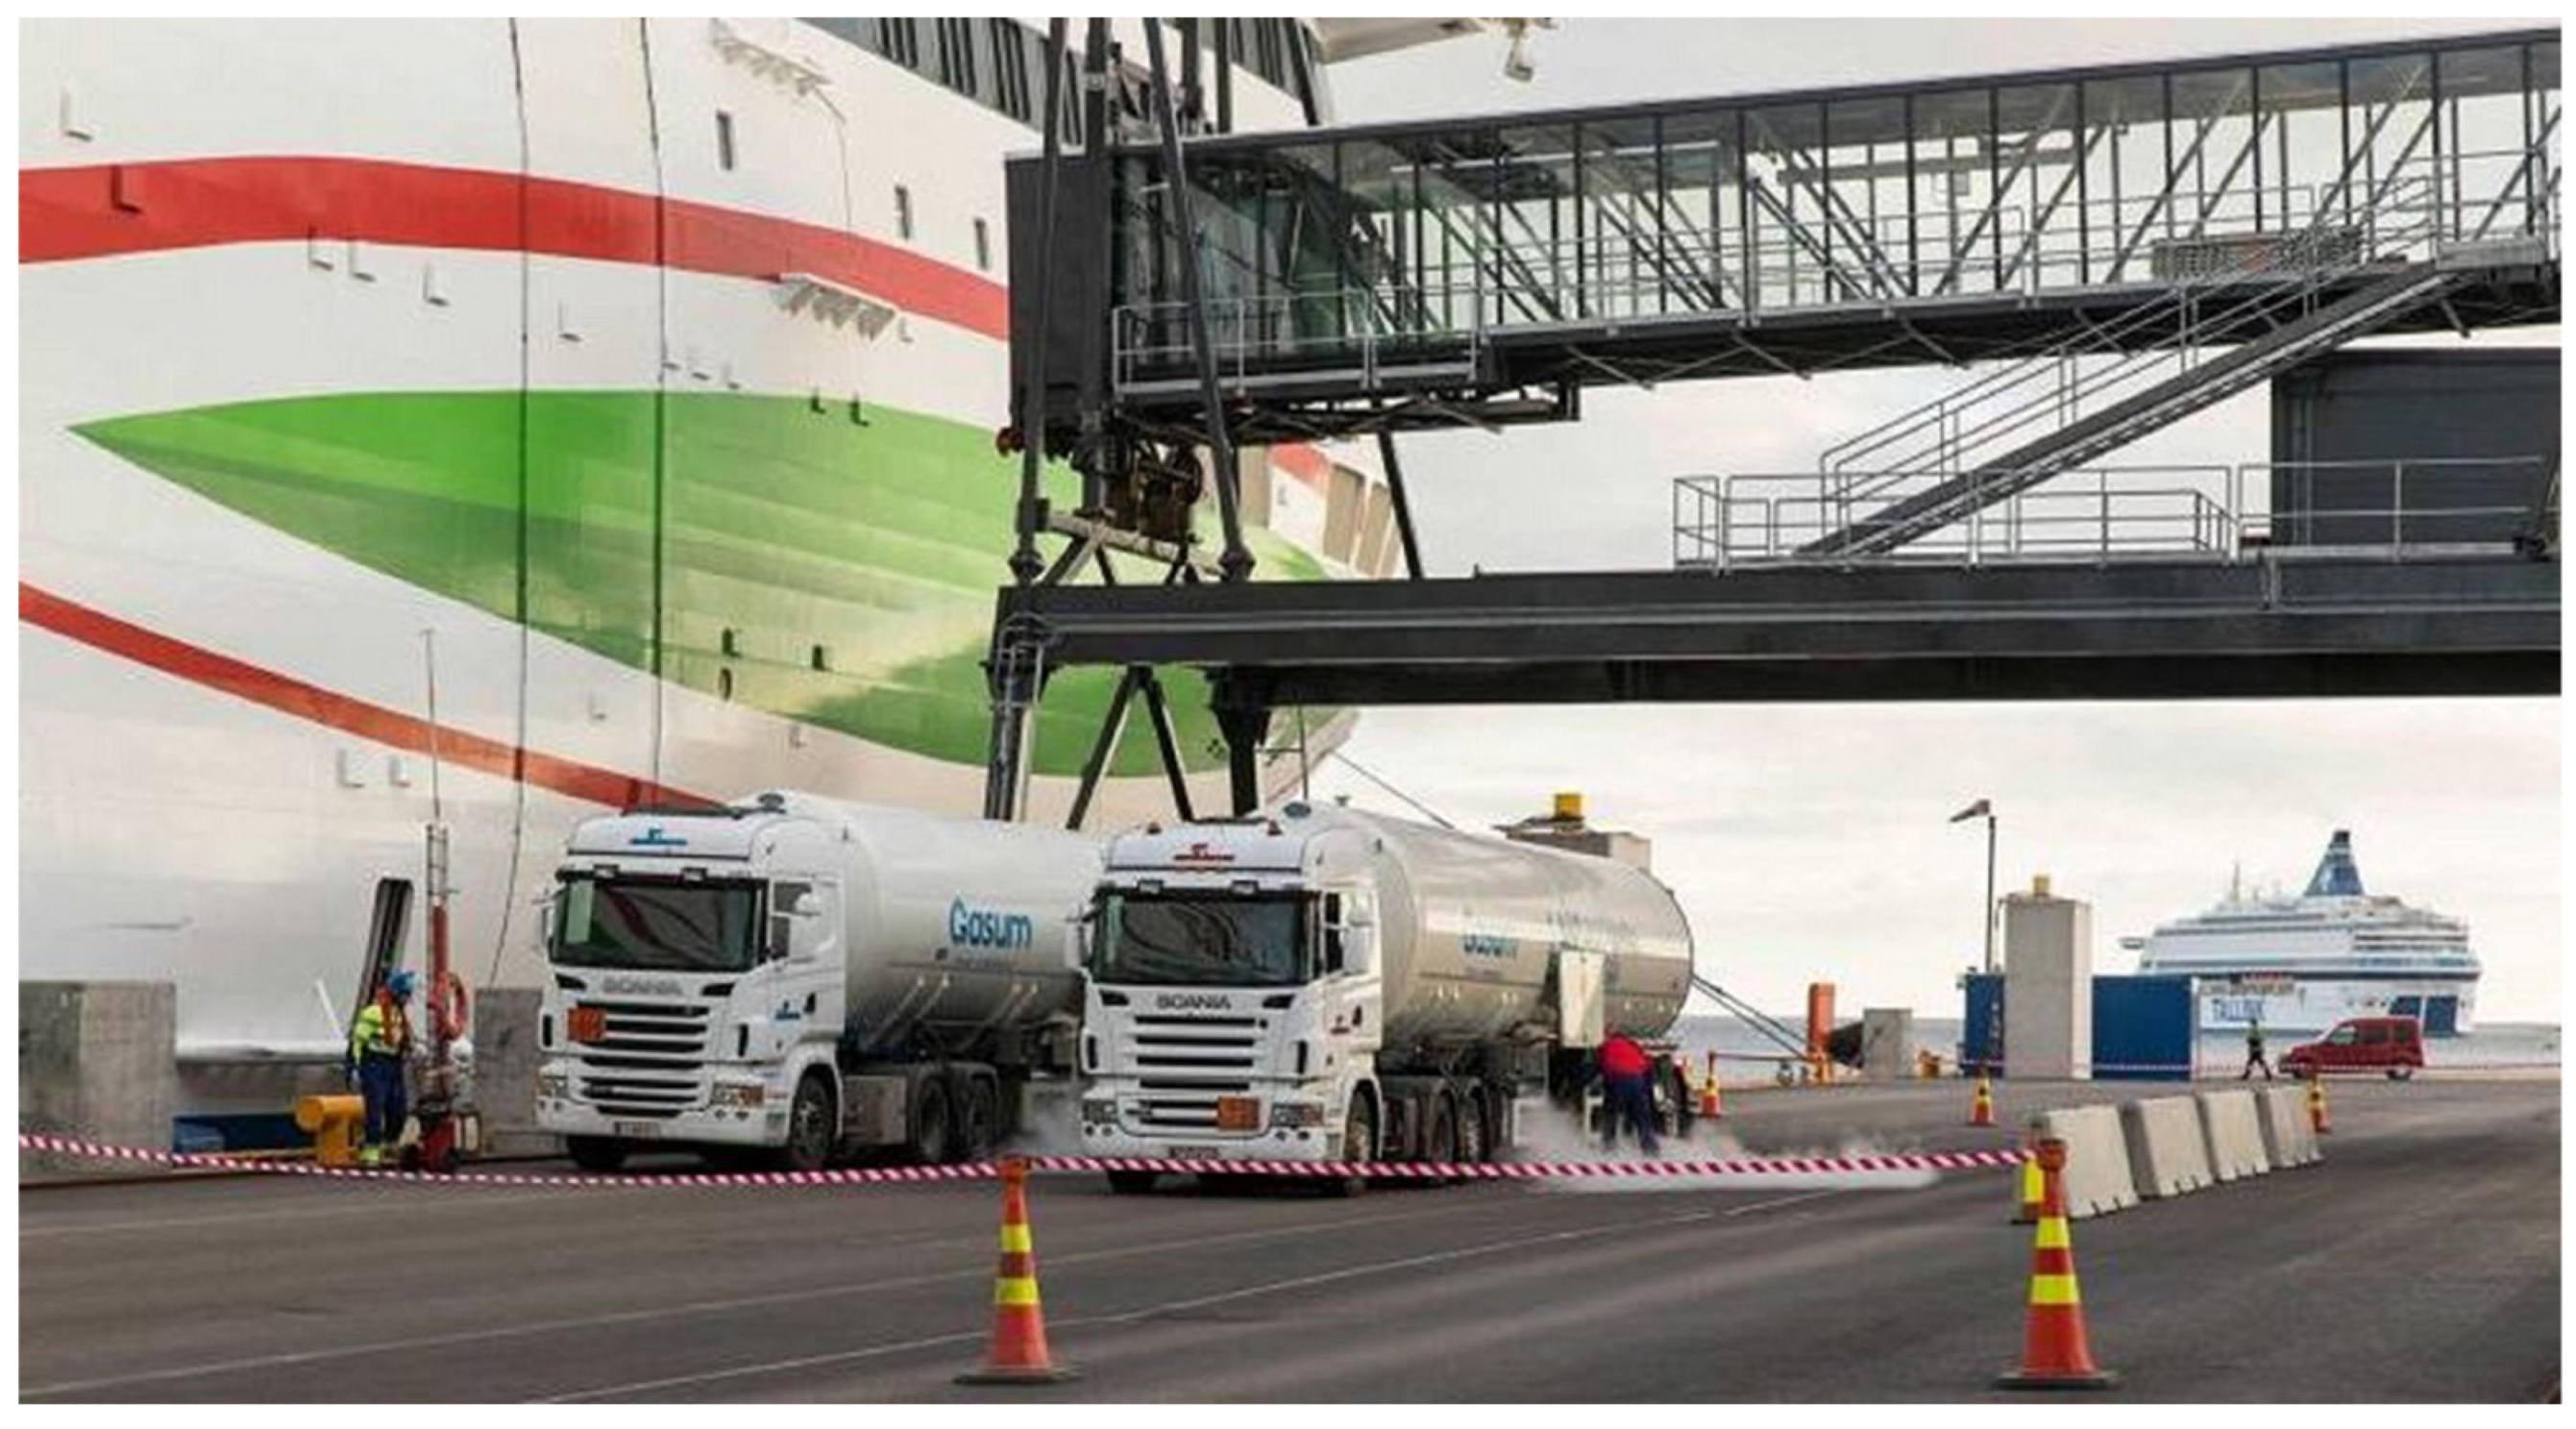
Availability of LNG in Finland is good. For example, the most effective way today for the forthcoming RoPax vessel in the case study would be to deliver LNG to the ship while in port in Vaasa by tanker truck from Pori LNG terminal. There is also a new LNG terminal in Tornio. Estimated LNG consumption for the Vaasa-Umeå route is 4600 tons/year, equating to four to five tanker truckloads per week, 20 tons/delivery. The truck-to-ship bunkering (Figure 7) time is less than two hours for each delivery [45].
Availability of LBG is limited at present, but growing. For example, during 2019 Gasum (Espoo, Finland) is expanding its biogas production in Turku and also adding a bio-methane liquefaction plant on the site. In Sweden, Gasum delivers LBG from the company’s Lidköping biogas facility. The first supply of LBG to a marine customer was in 2018, delivered to Swedish shipping line Furetank’s chemical tanker M/T Fure Vinga. Furthermore, in October 2018 Gasum announced it is cooperating with Stora Enso in the construction of a biogas plant, including upgrading and liquefaction, at Stora Enso’s Nymölla paper mill in Sweden. The Nymölla plant is scheduled to start operations in 2020, with LBG production projected to be 220 MWh per day [55]. Gasum and other industry players are also working on LBG projects not yet in the public domain [45]. All this activity confirms that LBG will available to a greater extent by 2021 when the new Vaasa-Umeå vessel comes into service.
Today, the greatest challenge facing LBG is fuel availability in the volumes needed for shipping [27,56]. The adoption of biofuels on the market is, however, also possible by blending biofuels with fossil-based fuels [4]. LBG is perfectly suitable for blending with LNG and can be mixed with LNG with any desired ratio [45]. So far, LNG provides a bridge technology to a lower carbon shipping. Having infrastructure already in place enables a smooth transition to LBG in the long term.
5.3. Recommendations
The main barriers to the deployment of bio-methane in short sea shipping identified in this study are (1) the limited availability of the fuel and (2) the large price gap between bio-methane and fossil fuels. A major policy push is needed to address these barriers. Eliminating fossil fuel subsidies and implementing carbon pricing could be important measures to increase the competitiveness of low-carbon renewable fuels [57]. The two basic ways to implement carbon pricing are via a carbon tax or an emission-trading scheme [58]. Moreover, specific blending mandates could guarantee the demand for renewable fuels and secure the necessary investments [57]. Despite the global nature of the shipping industry and the need for global regulation, there is also room for national regulations and initiatives to promote carbon-free shipping [58]. Many innovations depend on favorable national and local conditions and policies. Regulatory actions may also be required to reduce methane slip emissions in the coming years.
This study covers the environmental impacts of fuel choices for short sea shipping from local to global impacts, economic aspects, and prospects for fuel availability. The study provides important information for decision-makers and local authorities to support and promote the shift to more sustainable energy sources in short sea shipping. The research also provides relevant information for ship-owners, who play an important role here. The economic part of the study could be further developed by including various fuel price scenarios.
Adopting LBG into business is not simple or risk-free: it requires not only significant investments but also changes in existing practices and business models and the establishment of business relationships with new players. These factors raise many questions and create uncertainty. Further research is needed to identify which market dialogue mechanisms would support the deployment of bio-methane in short sea shipping. Local actors would also benefit from feasibility studies related to the establishment of new regional biogas/LBG infrastructure. Thorough investigations of market sizes and market development, investment costs, risks, and profitability margins play a crucial role in investment decisions.
6. Conclusions
Environmental concerns and new emissions regulations for shipping are the main drivers behind the introduction of alternative marine fuels. Today, the global environmental agenda is increasingly shifting to focus on climate change. In addition, tackling local air pollutants remains an important issue, especially for short sea shipping operations near coastal marine environment and residential areas.
This paper has given a detailed emission analysis for three marine fuel alternatives. The study also addressed economic aspects and prospects for fuel availability. The main findings were:
- In terms of local environmental impacts, both gaseous fuels had clear advantages over the MDO + SCR combination, but LNG is not the solution for decarbonizing shipping.
- Achieving IMO’s ambitious GHG reduction target seems possible only with the transition towards low-carbon and zero-carbon fuels.
- Replacing fossil fuels with bio-methane produced from organic municipal waste showed 60% life cycle GHG benefits compared with marine diesel oil.
- The most significant challenge facing LBG today is fuel availability in volumes needed for shipping.
- LNG can provide a bridge technology to a lower carbon shipping. Having infrastructure already in place enables a smooth transition to LBG in the long term.
- For now, there is also a strong economic argument for LNG in shipping. Without taxation or subsidies, LBG will find it difficult to compete with the prices of fossil fuels.
- Eliminating fugitive methane emissions and methane slip will be an important technology development topic for the coming decade.
Supplementary Materials
The following is available online at https://0-www-mdpi-com.brum.beds.ac.uk/2571-8797/2/1/4/s1. Spreadsheet S1: Calculations and complete numerical results.
Author Contributions
Conceptualization, K.S.-T.; funding acquisition, S.N.; investigation, K.S.-T.; project administration, S.N.; supervision, S.N.; writing–original draft, K.S.-T.; writing—review and editing, K.S.-T. and S.N. All authors have read and agree to the published version of the manuscript.
Funding
This work is part of the INTENS (Integrated Energy Solutions to Smart and Green Shipping) project, Task 3.3.5 ‘Emission reduction by biogas use’. The authors would like to express their gratitude to Business Finland for funding support, grant number 7889/31/2017.
Acknowledgments
We acknowledge Wasaline for allowing use of its ferry traffic for the case study. The authors would also like to express their gratitude to Tommy Mattila from Gasum for his assistance in determining LNG and LBG availability.
Conflicts of Interest
The authors have no conflicts of interest to declare.
References
- HELCOM; Baltic Marine Environment Protection Commission. Cleaner Exhaust Gases from Baltic Shipping—The New NECA Regulations. HELCOM 2017. Available online: http://www.helcom.fi/Lists/Publications/Baltic%20Sea%20NECA%20-%20Cleaner%20Exhaust%20Gases%20from%20Baltic%20Shipping.pdf (accessed on 28 February 2019).
- International Maritime Organization; Marine Environment Protection Committee. Designation of the Baltic Sea and the North Sea Emission Control Areas for NOx Tier III Control; MEPC 71/17/Add.1, Annex 1, Resolution MEPC.286(71); International Maritime Organization: London, UK, 2017. [Google Scholar]
- Bengtsson, S.; Andersson, K.; Fridell, E. A comparative life cycle assessment of marine fuels: Liquefied natural gas and three other fossil fuels. J. Eng. Marit. Environ. 2011, 225, 97–110. [Google Scholar] [CrossRef]
- Winnes, H.; Styhre, L.; Fridell, E. Reducing GHG emissions from ships in port areas. Res. Transp. Bus. Manag. 2015, 17, 73–82. [Google Scholar] [CrossRef] [Green Version]
- International Maritime Organization; Marine Environment Protection Committee. Initial IMO Strategy on Reduction of GHG Emissions from Ships; MEPC 72/17/Add.1, Annex 11, Resolution MEPC.304(72); International Maritime Organization: London, UK, 2018. [Google Scholar]
- Gilbert, P.; Walsh, C.; Traut, M.; Kesieme, U.; Pazouki, K.; Murphy, A. Assessment of full life-cycle air emissions of alternative shipping fuels. J. Clean. Prod. 2018, 172, 855–866. [Google Scholar] [CrossRef]
- Burel, F.; Taccani, R.; Zuliani, N. Improving sustainability of maritime transport through utilization of Liquefied Natural Gas (LNG) for propulsion. Energy 2013, 57, 412–420. [Google Scholar] [CrossRef]
- Seddiek, I.B.; Elgohary, M.M. Eco-friendly selection of ship emissions reduction strategies with emphasis on SOx and NOx emissions. Int. J. Nav. Archit. Ocean Eng. 2014, 6, 737–748. [Google Scholar] [CrossRef] [Green Version]
- Verbeek, R.; Kadijk, G.; Menscli, P.V.; Wulffers, C.; Beemt, B.; Fraga, F. Environmental and Economic Aspects of Using LNG as a Fuel for Shipping in The Netherlands; Report No. 2011-00166; The Netherlands Organisation for Applied Scientific Research: The Hague, The Netherlands, 2011. [Google Scholar]
- Woodyard, D. Pounder’s Marine Diesel Engines and Gas Turbines, 9th ed.; Butterworth-Heinemann: Oxford, UK, 2009; ISBN 978-0-7506-8984-7. [Google Scholar]
- Aakko-Saksa, P.; Lehtoranta, K. Ship Emissions in the Future—Review; VTT Research Report; No. VTT-R-00335-19; VTT Technical Research Centre of Finland: Espoo, Finland, 2019. [Google Scholar]
- Anderson, M.; Salo, K.; Fridell, E. Particle-and Gaseous Emissions from an LNG Powered Ship. Environ. Sci. Technol. 2015, 49, 12568–12575. [Google Scholar] [CrossRef] [PubMed]
- Lehtoranta, K.; Aakko-Saksa, P.; Murtonen, T.; Vesala, H.; Ntziachristos, L.; Rönkkö, T.; Karjalainen, P.; Kuittinen, N.; Timonen, H. Particulate Mass and Nonvolatile Particle Number Emissions from Marine Engines Using Low-Sulfur Fuels, Natural Gas, or Scrubbers. Environ. Sci. Technol. 2019, 53, 3315–3322. [Google Scholar] [CrossRef] [PubMed]
- Li, J.; Wu, B.; Mao, G. Research on the Performance and Emission Characteristics of the LNG-Diesel Marine Engine. J. Nat. Gas Sci. Eng. 2015, 27, 945–954. [Google Scholar] [CrossRef]
- Bengtsson, S.; Fridell, E.; Andersson, K. Fuels for short sea shipping: A comparative assessment with focus on environmental impact. J. Eng. Marit. Environ. 2014, 228, 44–54. [Google Scholar] [CrossRef]
- Myhre, G.; Shindell, D.; Bréon, F.-M.; Collins, W.; Fuglestvedt, J.; Huang, J.; Koch, D.; Lamarque, J.-F.; Lee, D.; Mendoza, B.; et al. Anthropogenic and Natural Radiative Forcing. In Climate Change 2013: The Physical Science Basis. Contribution of Working Group I to the Fifth Assessment Report of the Intergovernmental Panel on Climate Change; Stocker, T.F., Qin, D., Plattner, G.-K., Tignor, M., Allen, S.K., Boschung, J., Nauels, A., Xia, Y., Bex, V., Midgley, P.M., Eds.; Cambridge University Press: Cambridge, UK; New York, NY, USA, 2013; pp. 659–740. [Google Scholar]
- Corbett, J.J.; Thomson, H.; Winebrake, J.J. Methane Emissions from Natural Gas Bunkering Operations in the Marine Sector: A Total Fuel Cycle Approach; U.S. Department of Transportation, Maritime Administration: Washington, DC, USA, 2015.
- Kollamthodi, S.; Norris, J.; Dun, C.; Brannigan, C.; Twisse, F.; Biedka, M.; Bates, J. The Role of Natural Gas and Biomethane in the Transport Sector: Final Report; Ricardo Energy & Environment: Harwell, UK, 2016. [Google Scholar]
- Lowell, D.; Wang, H.; Lutsey, N. Assessment of the Fuel Cycle Impact of Liquefied Natural Gas as Used in International Shipping; ICCT White Paper; The International Council on Clean Transportation: Washington, DC, USA, 2013. [Google Scholar]
- Bengtsson, S.; Fridell, E.; Andersson, K. Environmental assessment of two pathways the use of biofuels in shipping. Energy Policy 2012, 44, 451–463. [Google Scholar] [CrossRef]
- Brynolf, S.; Fridell, E.; Andersson, K. Environmental assessment of marine fuels: Liquefied natural gas, liquefied biogas, methanol and bio-methanol. J. Clean. Prod. 2014, 74, 86–95. [Google Scholar] [CrossRef]
- Gasser, T.; Peters, G.P.; Fuglestvedt, J.S.; Collins, W.J.; Shindell, D.T.; Ciais, P. Accounting for the climate—Carbon feedback in emission metrics. Earth Syst. Dyn. 2017, 8, 235–253. [Google Scholar] [CrossRef] [Green Version]
- IPCC. Climate Change 2007: The Physical Science Basis. Working Group I Contribution to the Fourth Assessment Report of the Intergovernmental Panel on Climate Change; Solomon, S., Qin, D., Manning, M., Chen, Z., Marquis, M., Averyt, K.B., Tignor, M., Miller, H.L., Eds.; Cambridge University Press: Cambridge, UK, 2007; p. 996. [Google Scholar]
- Levasseur, A.; Cavalett, O.; Fuglestvedt, J.S.; Gasser, T.; Johansson, D.J.A.; Jørgensen, S.V.; Raugei, M.; Reisinger, A.; Schivley, G.; Strømman, A.; et al. Enhancing life cycle impact assessment from climate science: Review of recent findings and recommendations for application to LCA. Ecol. Indic. 2016, 71, 163–174. [Google Scholar] [CrossRef] [Green Version]
- Gillet, N.P.; Matthews, H.D. Accounting for carbon cycle feedbacks in a comparison of the global warming effects of greenhouse gases. Environ. Res. Lett. 2010, 5. [Google Scholar] [CrossRef] [Green Version]
- Spoof-Tuomi, K.; Niemi, S. Emission reduction by biogas use in short sea shipping. In Integrated Energy Solutions to Smart and Green Shipping, Proceedings of the INTENS Public Project Seminar, Espoo, Finland, 13 March 2019; Zou, G., Ed.; VTT Technical Research Centre of Finland: Espoo, Finland, 2019; pp. 18102–18106. [Google Scholar]
- DNV, GL. Assessment of Selected Alternative Fuels and Technologies; DNV GL: Oslo, Norway, 2019. [Google Scholar]
- Dominguez, J. LNG Blue Corridors—Liquefied Biomethane Experiences; The Seventh Framework Programme; Deliverable No. D3.6; European Commission: Brussels, Belgium, 2014. [Google Scholar]
- Strauch, S.; Krassowski, J.; Singhal, A. Biomethane Guide for Decision Makers—Policy Guide on Biogas Injection into the Natural Gas Grid; Project Green Gas Grids WP 2/D 2.3; Fraunhofer UMSICHT: Oberhausen, Germany, 2013. [Google Scholar]
- Life Cycle Assessment (LCA). European Commission, LIFE Programme. EU LIFE04 ENV/GR/110. Available online: http://www.ecoil.tuc.gr/LCA-2.pdf (accessed on 1 March 2019).
- International Organization for Standardization. Environmental Management—Life Cycle Assessment—Principles and Framework; ISO: Geneva, Switzerland, 2006. [Google Scholar]
- Rebitzer, G.; Ekvall, T.; Frischknecht, R.; Hunkeler, D.; Norris, G.; Rydberg, T.; Schmidt, W.-P.; Suh, S.; Weidema, B.P.; Pennington, D.W. Life cycle assessment Part 1: Framework, goal and scope definition, inventory analysis, and applications. Environ. Int. 2004, 30, 701–720. [Google Scholar] [CrossRef] [PubMed]
- Prieto, G.; Iitsuka, Y.; Yamauchi, H.; Mizuno, A.; Prieto, O.; Gay, C.R. Urea in Water-in-Oil Emulsions for Ammonia Production. Int. J. Plasma Environ. Sci. Technol. 2009, 3, 54–60. [Google Scholar]
- Willems, F. Modeling & Control of Diesel Aftertreatment Systems; TNO-TU/e-LiU Course; Linköping University: Linköping, Sweden, 2015. [Google Scholar]
- Smith, T.W.P.; Jalkanen, J.P.; Anderson, B.A.; Corbett, J.J.; Faber, J.; Hanayama, S.; O’Keeffe, E.; Parker, S.; Johansson, L.; Aldous, L.; et al. Third IMO GHG Study 2014; International Maritime Organization (IMO): London, UK, 2015. [Google Scholar]
- Brynolf, S.; Magnusson, M.; Fridell, E.; Andersson, K. Compliance possibilities for the future ECA regulations through the use of abatement technologies or change of fuels. Transp. Res. 2014, 28, 6–18. [Google Scholar] [CrossRef]
- Edwards, R.; Larivé, J.F.; Rickeard, D.; Weindorf, W. JEC Well-to-Wheels Analysis: Well-to-Wheels Analysis of Future Automotive Fuels and Powertrains in the European Context; Well-to-Tank Report Version 4.0; JRC Technical Reports; Publications Office of the European Union: Brussels, Belgium, 2013. [Google Scholar] [CrossRef]
- Berglund, M.; Börjesson, P. Assessment of energy performance in the life-cycle of biogas production. Biomass Bioenergy 2006, 30, 254–266. [Google Scholar] [CrossRef]
- Environmental Impacts Analysed and Characterisation Factors. A Study to Examine the Costs and Benefits of the ELV Directive—Final Report Annexes, Annex 5. GHK in Association with Bio Intelligence Service 2006. Available online: https://ec.europa.eu/environment/waste/pdf/study/annex5.pdf (accessed on 5 March 2019).
- Keoleian, G.A.; Spitzley, D.V. Life Cycle Based Sustainability Metrics. In Sustainability Science and Engineering—Defining Principles; Abraham, M.A., Ed.; Elsevier B.V.: Amsterdam, The Netherlands, 2006; pp. 127–160. ISBN 978-0444517128. [Google Scholar]
- Huijbregts, M.A.J.; Schöpp, W.; Verkuijlen, E.; Heijungs, R.; Reijnders, L. Spatially explicit characterization of acidifying and eutrophying air pollution in life-cycle assessment. J. Ind. Ecol. 2000, 4, 75–92. [Google Scholar] [CrossRef]
- Van Zelm, R.; Huijbregts, M.A.J.; den Hollander, H.A.; van Jaarsveld, H.A.; Sauter, F.J.; Struijs, J.; van Wijnen, H.J.; van de Meent, D. European characterization factors for human health damage of PM10 and ozone in life cycle impact assessment. Atmos. Environ. 2008, 42, 441–453. [Google Scholar] [CrossRef]
- Stenersen, D.; Thonstad, O. GHG and NOx Emissions from Gas Fueled Engines—Mapping, Verification, Reduction Technologies; SINTEF Report No. OC2017 F-108, Version 3.0; SINTEF Ocean AS: Trondheim, Norway, 2017. [Google Scholar]
- DNV, GL. LNG as Ship Fuel. Current Price Development Oil and Gas. Available online: https://www.dnvgl.com/maritime/lng/current-price-development-oil-and-gas.html (accessed on 1 March 2019).
- Mattila, T.; (Skangas, Göteborg, Sweden). Personal communication, 2018.
- Hellman, R.; (North European Oil Trade Oy NEOT, Helsinki, Finland). Personal communication, 2019.
- Campling, P.; Janssen, L.; Vanherle, K.; Cofala, J.; Heyes, C.; Sander, R. Final Report: Specific Evaluation of Emissions from Shipping including Assessment for the Establishment of Possible New Emission Control Areas in European Seas; VITO Vision on Technology: Mol, Belgium, 2013. [Google Scholar]
- Lloyd’s Register. Your Options for Emissions Compliance. Guidance for Shipowners and Operators on the Annex VI SOx and NOx Regulations; Lloyd's Register: London, UK, 2015. [Google Scholar]
- Fathom. The Ship Operator’s Guide to NOx Reduction; Macdonald, F., Rojon, I., Austin, C., Eds.; Fathom Maritime Intelligence: Windsor, UK, 2015; ISBN 978-0-9932678-8-8. [Google Scholar]
- Bachér, H.; Albrecht, P. Evaluating the Costs Arising from New Maritime Environmental Regulations; Transport Safety Agency Trafi: Helsinki, Finland, 2013; ISBN 978-952-5893-89-2. [Google Scholar]
- Kandlikar, M.; Reynolds, C.C.O.; Grieshop, A.P. A Perspective Paper on Black Carbon Mitigation as a Response to Climate Change; Copenhagen Consensus Center Report; Copenhagen Consensus Center: Copenhagen, Denmark, 2009. [Google Scholar]
- European Union. Regulation (EU) 2016/1628 of the European Parliament and of the Council of 14 September 2016 on Requirements Relating to Gaseous and Particulate Pollutant Emission Limits and Type-Approval for Internal Combustion Engines for Non-Road Mobile Machinery, Amending Regulations (EU) No 1024/2012 and (EU) No 167/2013, and Amending and Repealing Directive 97/68/EC; EU: Brussels, Belgium, 2016. [Google Scholar]
- Baresic, D.; Smith, T.; Raucci, K.; Rehmatulla, C.; Narula, N.; Rojon, I. LNG as a Marine Fuel in the EU: Market, Bunkering Infrastructure Investments and Risks in the Context of GHG Reductions; UMAS: London, UK, 2018. [Google Scholar]
- Verbeek, R.; Verbeek, M. LNG for Trucks and Ships: Fact Analysis. Review of Pollutant and GHG Emissions; TNO Report 2014 R11668; The Netherlands Organisation for Applied Scientific Research: The Hague, Netherlands, 2015. [Google Scholar]
- Gasum. About Gasum. For the Media. News. Available online: https://www.gasum.com/en/About-gasum/for-the-media/News/2018/circular-economy-cooperation-with-stora-enso-gasum-to-produce-biogas-from-waste-waters-at-nymolla-mill/ (accessed on 15 December 2018).
- Florentinus, A.; Hamelinck, C.; van der Bos, A.; Winkel, R.; Cuijpers, M. Potential of Biofuels for Shipping—Final Report; European Maritime Safety Agency (EMSA): Lisbon, Portugal, 2011. [Google Scholar]
- IRENA; IEA; REN21. Renewable Energy Policies in a Time of Transition; IRENA: Abu Dhabi, United Arab Emirates; OECD/IEA: Paris, France; REN21: Paris, France, 2018; ISBN 978-92-9260-061-7. [Google Scholar]
- International Transport Forum. Decarbonising Maritime Transport. Pathways to Zero-Carbon Shipping by 2035; Case-Specific Policy Analysis; OECD: Paris, France, 2018. [Google Scholar]
Figure 1.
Flowchart of studied fuels and included processes.

Figure 2.
Life cycle GWP100 for the compared alternatives divided into well to tank (WTT) and termed tank to propeller (TTP) phases.
Figure 2.
Life cycle GWP100 for the compared alternatives divided into well to tank (WTT) and termed tank to propeller (TTP) phases.

Figure 3.
Life cycle GHG emissions for the compared alternatives divided into the different contributing emissions.
Figure 3.
Life cycle GHG emissions for the compared alternatives divided into the different contributing emissions.

Figure 4.
(a) Tank-to-propeller and (b) life cycle GHG emissions (in metric tons CO2-eq./year) as a function of CH4 slip from the dual-fuel engine.
Figure 4.
(a) Tank-to-propeller and (b) life cycle GHG emissions (in metric tons CO2-eq./year) as a function of CH4 slip from the dual-fuel engine.

Figure 5.
Tank-to-propeller (a) acidifying and (b) eutrophying emissions, (c) formation of primary particulate matter (in metric ton/year), and the impact of emissions on (d) human health.
Figure 5.
Tank-to-propeller (a) acidifying and (b) eutrophying emissions, (c) formation of primary particulate matter (in metric ton/year), and the impact of emissions on (d) human health.

Figure 6.
Price development for natural gas and ultra low sulfur MGO/MDO. The price data are retrieved from DNV GL [44]; 1 mmBTU energy equals 1055 MJ in energy; 10 USD/mmBTU is equivalent to approx. 30 EUR/MWh.
Figure 6.
Price development for natural gas and ultra low sulfur MGO/MDO. The price data are retrieved from DNV GL [44]; 1 mmBTU energy equals 1055 MJ in energy; 10 USD/mmBTU is equivalent to approx. 30 EUR/MWh.

Figure 7.
Truck-to-ship bunkering in the Port of Helsinki.


Table 1.
RoPax vessel basic data.
| Engine output (kW) | 16,000 |
| Engine type | Dual fuel (liquefied natural gas (LNG)/ liquefied biogas (LBG) + 1.4% marine diesel oil (MDO) as pilot fuel) |
| Engine speed (rpm) | 750 |
| Engine efficiency at maximum continuous rating (MCR) (%) | 48 |
| Hours per year (h) | 4000 |
Table 2.
Modelling choices of the study. Reproduced from [26], VTT Technical Research Centre of Finland: 2019.
Table 2.
Modelling choices of the study. Reproduced from [26], VTT Technical Research Centre of Finland: 2019.
| Functional unit | One year of RoPax ferry service to and from Vaasa and Umeå |
| Fuel chains | Marine diesel oil (MDO) 0.1% S Liquefied natural gas (LNG) Liquefied bio-methane (LBG) |
| Geographical boundaries | The sulfur emission control area (SECA) in the Baltic Sea The NOx emission control area (NECA) in the Baltic Sea (from 2021) |
| System boundary | In terms of greenhouse gas (GHG) emissions, the study covers the entire fuel life cycle from the extraction of raw materials to production, distribution, and combustion in a dual-fuel marine engine. Local environmental impacts are evaluated from the termed tank-to-propeller (TTP) perspective, i.e., only the emissions released during vessel operation are taken into account. |
| Included primary pollutants | GHG
|
Local pollutants
| |
| Impact categories | Global warming potential (GWP100) |
Local environmental impacts
|
Table 3.
Summary of emissions to air from well-to-tank and tank-to-propeller.
| MDO 0.1% S | LNG | LBG | |
|---|---|---|---|
| Net calorific value (MJ/kg) | 42.6 | 48.6 | 49.3 |
| Well-to-tank GHG-emissions: | g/MJ fuel | g/MJ fuel | g/MJ fuel |
| CO2 (fossil) | 14.6 | 10.5 | 9.7 |
| CH4 | 0.021 | 0.18 | 0.34 |
| N2O | <0.001 | <0.001 | <0.001 |
| Total in CO2-eq. | 15.3 | 16.6 | 21.3 |
| MDO 0.1% S + SCR | LNG | LBG | |
| Emissions to air from the fuel combustion (tank-to-propeller): | g/MJ fuel | g/MJ fuel | g/MJ fuel |
| CO2 (fossil) | 75 | 56 | 1 |
| CO2 (biogenic) | 0 | 0 | 54 |
| CH4 | 0.0014 | 0.41 | 0.41 |
| N2O | 0.0038 | 0.0022 | 0.0022 |
| NOx | 0.22 | 0.17 | 0.17 |
| SO2 | 0.047 | 0.00056 | 0.00058 |
| PM10 | 0.022 | 0.0043 | 0.0043 |
| NMVOC | 0.059 | - | - |
| NH3 | 0.005 | - | - |
Table 4.
Characterization factors for health effects of PM, NH3, NOx and SOx.
| Emitted Substance | Characterization Factor (Years Lost Per Kg Emission) |
|---|---|
| NH3 | 8.3 × 10⁻⁵ |
| NOx | 5.7 × 10⁻⁵ |
| SOx | 5.1 × 10⁻⁵ |
| PM10 | 2.6 × 10⁻⁴ |
Table 5.
Operational costs/one year of RoPax ferry service.
| Cost | MDO 0.1% S | LNG | LBG |
|---|---|---|---|
| Fuel | 2,925,000 € | 1,800,000 € | 4,950,000 € |
| SCR O&M | 159,563 € | - | - |
| Total | 3,084,563 € | 1,800,000 € | 4,950,000 € |
© 2020 by the authors. Licensee MDPI, Basel, Switzerland. This article is an open access article distributed under the terms and conditions of the Creative Commons Attribution (CC BY) license (http://creativecommons.org/licenses/by/4.0/).
Share and Cite
MDPI and ACS Style
Spoof-Tuomi, K.; Niemi, S. Environmental and Economic Evaluation of Fuel Choices for Short Sea Shipping. Clean Technol. 2020, 2, 34-52. https://0-doi-org.brum.beds.ac.uk/10.3390/cleantechnol2010004
AMA Style
Spoof-Tuomi K, Niemi S. Environmental and Economic Evaluation of Fuel Choices for Short Sea Shipping. Clean Technologies. 2020; 2(1):34-52. https://0-doi-org.brum.beds.ac.uk/10.3390/cleantechnol2010004
Chicago/Turabian StyleSpoof-Tuomi, Kirsi, and Seppo Niemi. 2020. "Environmental and Economic Evaluation of Fuel Choices for Short Sea Shipping" Clean Technologies 2, no. 1: 34-52. https://0-doi-org.brum.beds.ac.uk/10.3390/cleantechnol2010004