Patterns in Indices of Daily and Seasonal Rainfall Extremes: Southwest Florida Gulf Coastal Zone


Department of Agricultural and Biological Engineering, Purdue University, 225 South University Street, West Lafayette, IN 47906, USA
Climate 2018, 6(4), 83; https://0-doi-org.brum.beds.ac.uk/10.3390/cli6040083
Submission received: 1 October 2018
/
Revised: 19 October 2018
/
Accepted: 22 October 2018
/
Published: 25 October 2018
(This article belongs to the Special Issue Decadal Variability and Predictability of Climate)
Abstract
:Extreme events have the most adverse impacts on society and infrastructure, and present the greatest challenges with respect to impacts. Information on the status and trends of these events is, thus, important for system design, management, and policy decision-making. In this study, variations in daily and seasonal rainfall extremes were explored with a focus on the southwest Florida Gulf coastal zone for the period 1950–2016. Rainfall occurring on very wet days accounted for about 50% of the seasonal rainfall in the area (regardless of the season), while about 25% of the seasonal rainfall came from extremely wet days except in the period between October and December for which this latter value was about 40%. No significant changes were seen in the maximum one-day rainfall at any of the stations regardless of the time scale. However, there was a significant increase in the number of wet days in the rainy season at Myakka River (p = 0.0062) and Naples (p = 0.0027) and during October–December at Myakka River (p = 0.0204). These two stations also experienced significant increases in the number of wet days in a year. Significant increases in the contribution to rainy season rainfall from very wet days (rainfall > 25.4 mm, 1 in) were seen at Arcadia (p = 0.0055). Regional results point to an increasingly wetter climate with increasing contributions from extreme events in some areas, both of which have implications for design and management decision making.
1. Introduction
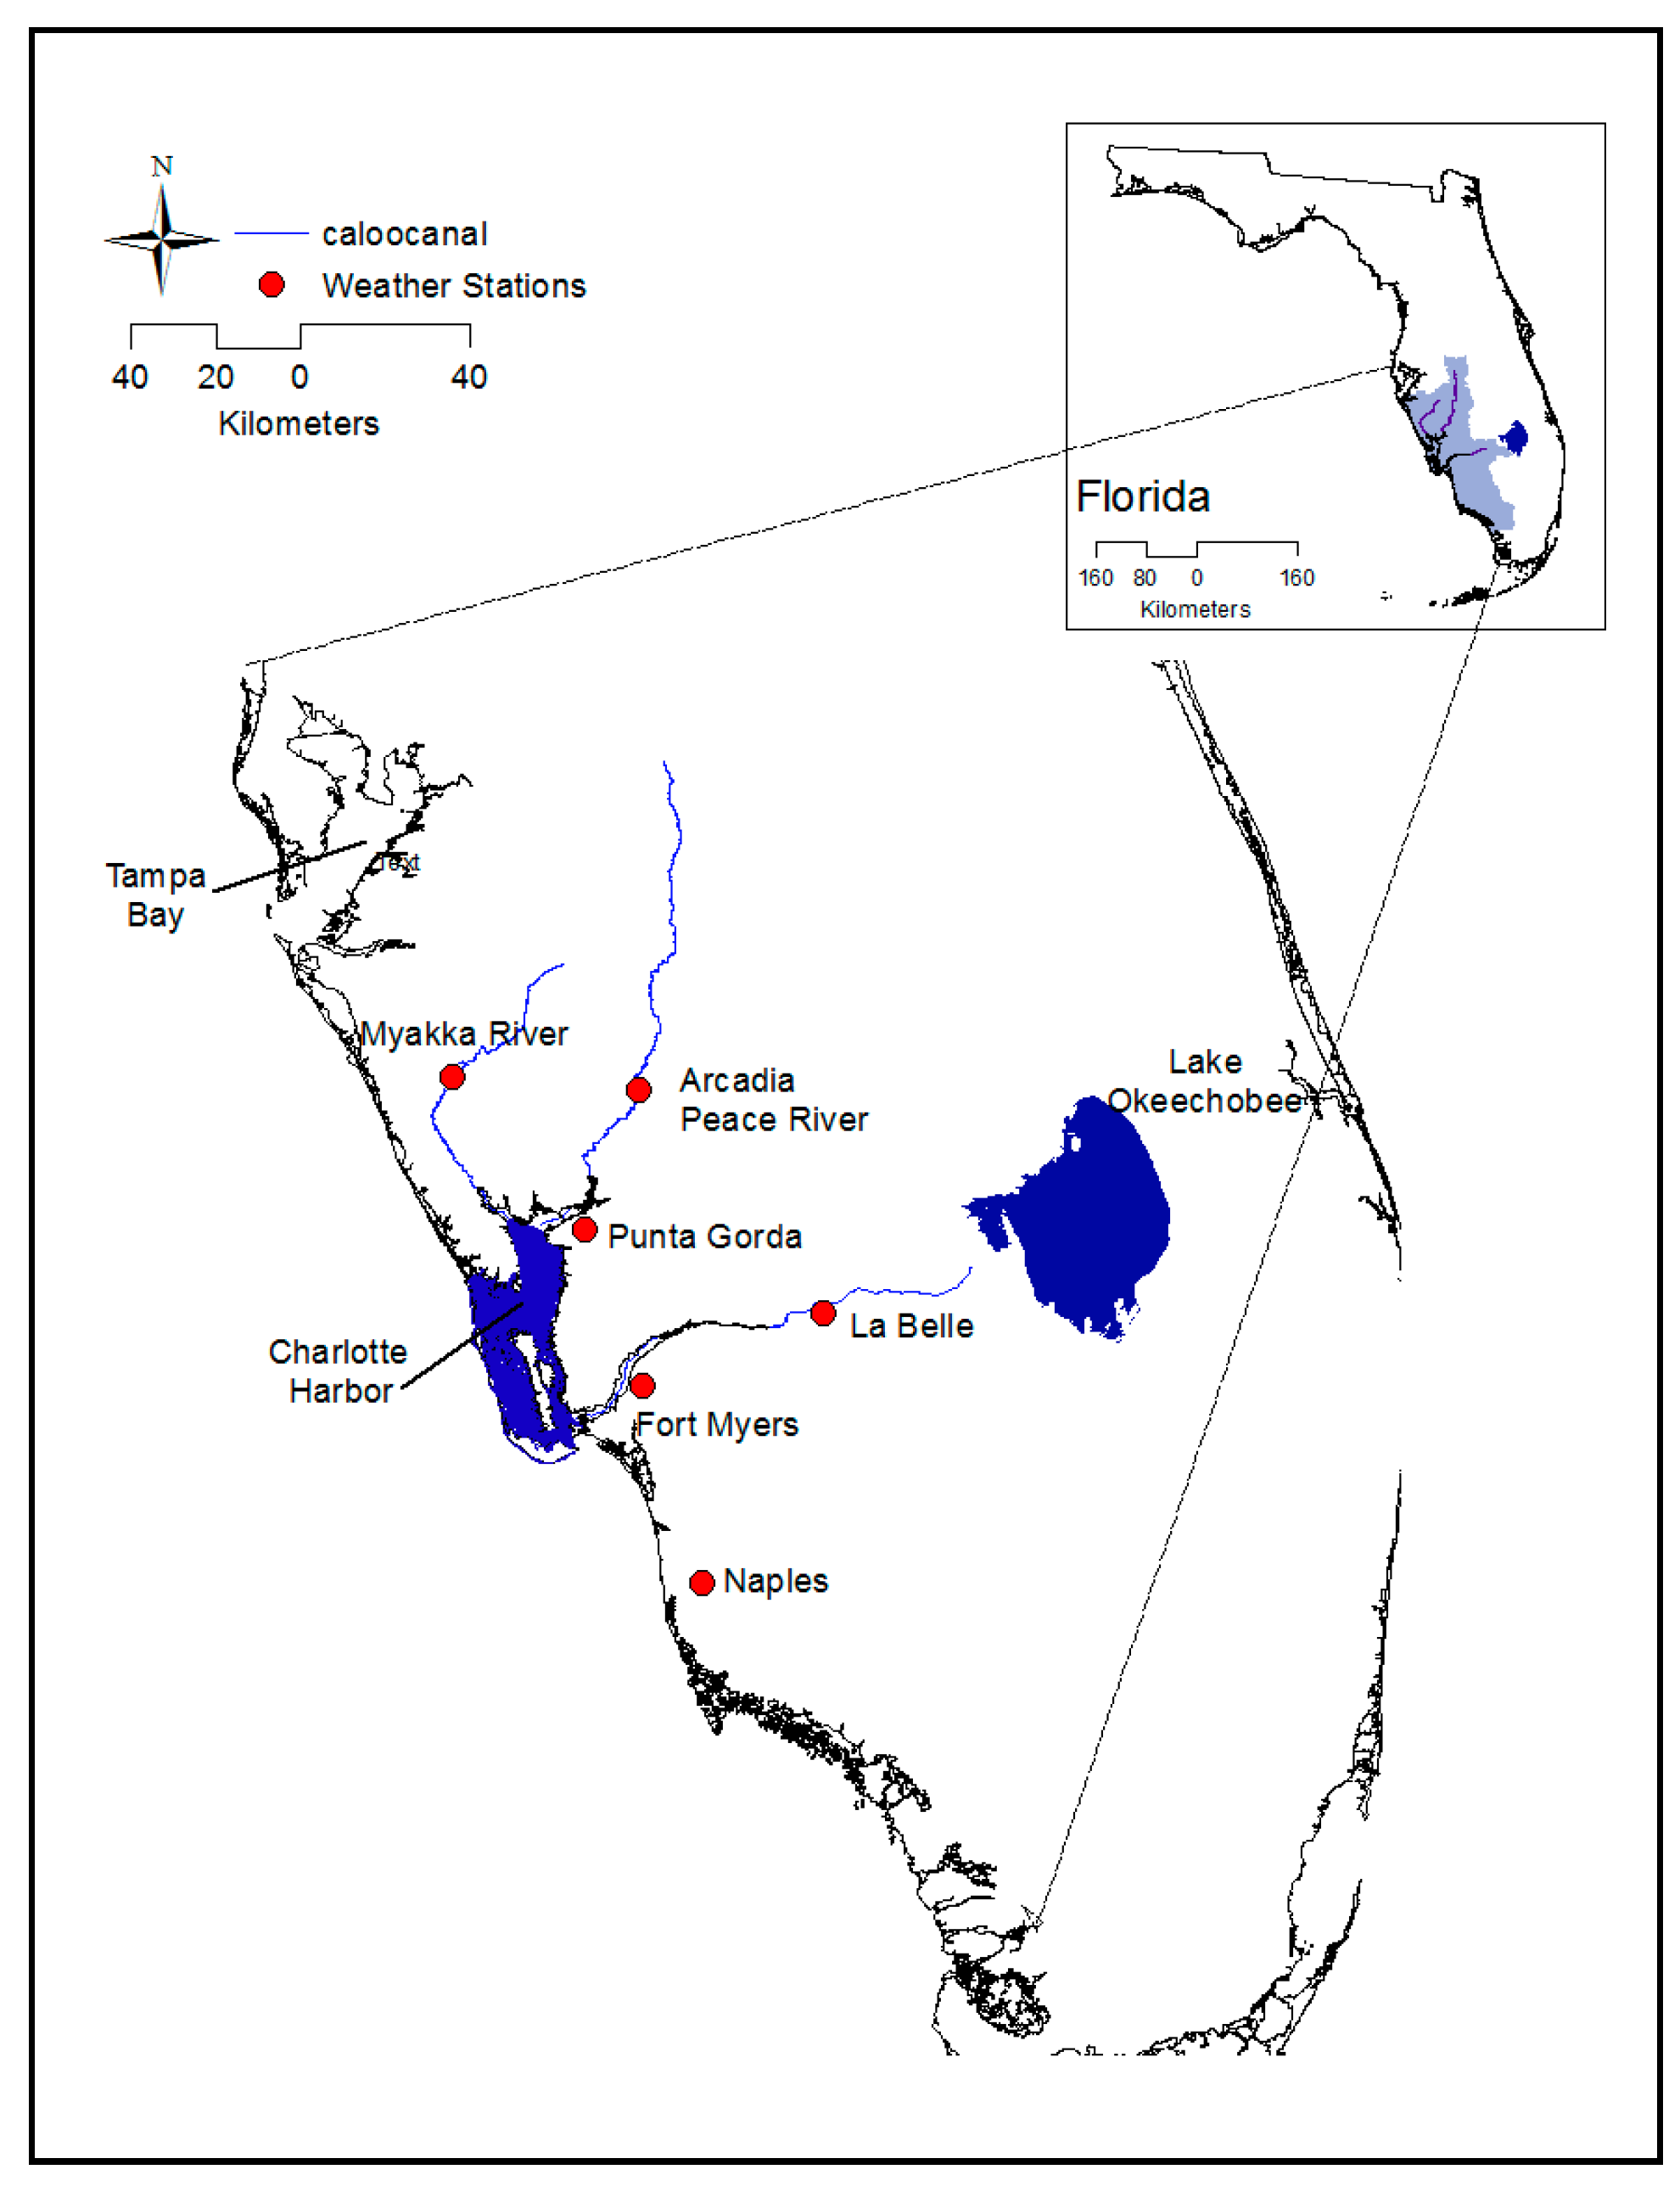
Coastal regions are ecologically important with respect to supporting fisheries and wildlife and providing water purification. Furthermore, coastal regions protect inland areas from storm surges in addition to providing a number of intangible benefits [1,2,3]. Many of these areas are also of cultural and historical significance. Globally, coastal regions are economically important. In the U.S., for example, coastal regions (which also include the U.S. Great Lakes) contributed more than $352 billion to the U.S. GDP in 2014; in 2016, $1.5 trillion worth of cargo was transported in U.S. and international waters [4]. Like many other areas of the world, coastal regions are under threat from a changing or highly variable climate. In particular, there is the need to pay attention to extreme events as these have the most adverse impacts on society and infrastructure, and present the greatest challenges with respect to being able to cope with the impacts [5,6]. Information on the status and trends of these events is, thus important, for infrastructure design, management and policy decision-making in these areas. The aim of this study was to explore variations in indices of daily and seasonal rainfall extremes with a focus on the southwest Florida Gulf coastal zone. The study area comprises the region between the Florida Keys and Tampa Bay and covers the region west of Lake Okeechobee (Figure 1). While rainfall occurs throughout the year, the region described above experiences a distinct wetter period (June–September) and a drier period which runs from October of one year to May of the following year [7,8]. The region is characterized by severe storms, including tropical storms, which typically occur annually and hurricanes which occur about once every 10 years [8]. Results from previous work in the region [9] show a regional tendency towards long drier periods and decreases in rainfall in the period between October through December. Results also show increases in rainy season (June–September) rainfall. This current work furthers previous research to provide insights into variations in rainfall extremes. Methodologies and approaches used in this study are widely applicable.
2. Materials and Methods
2.1. Preprocessing of Rainfall Data
Rainfall data used in the aforementioned previous work [9] were used in this study. As these data only included values up to 31 December 2014, additional data were downloaded from the NOAA Climate Data Online facility (https://www.ncdc.noaa.gov/cdo-web/) to cover the period 1 January 2015–31 December 2017. This allowed the analysis to include the 2010s, which had not been possible in the previous study. In this effort, care was taken to ensure that data came from the same stations as used in the previous study. The data used that were available for this study covered the period from 1 January 1920 to 31 December 2017 depending on availability for specific stations, including from: 1 January 1920 (Arcadia and Fort Myers); 1 January 1930. (La Belle); 1 January 1943 (Myakka River); 1 January 1942 (Naples); and, 1 January 1965 (Punta Gorda). The designation for assigning decades was maintained from previous work including associated numbering starting from 0 (1890s) to 12 (2010s). As a starting point, data were screened for completeness and all station-years with at least 95% of data availability (not more than 18 missing values in any one year) were preserved for further processing. This initial screening primarily affected Arcadia in the 1990s and the earlier decades for La Belle and Punta Gorda, all of which had several years with large amounts of missing data in the affected decades.
For daily extremes, data were further evaluated for missing values and cleaned based on Expert Team on Climate Change Detection and Indices (ETCCDI) criterion on data quality for analyzing daily extremes [5] such that only years with four or fewer missing values were preserved. Following this screening, resulting data for La Belle were not sufficiently consistent for the daily analysis (33 years of complete data available, missing the 1990s and 2000s, inconsistent in the 2010s). This station was, thus, excluded from further analysis. The resulting datasets (all other stations) were then checked for integrity at each station by comparing statistical properties and distributions with those from the original datasets.
For the seasonal analysis, data were examined on a month-by-month basis as this is the initial level at which the data would be aggregated. Any months with greater than three values missing were removed from the analysis consistent with existing literature [10]. The remaining (three or fewer) missing values were imputed using the Multivariate Normal Imputation procedure in JMP® statistical software (SAS Institute Inc. 2017, JPM® 13. Cary NC, USA). The resulting datasets were checked for integrity by comparing their statistical properties and distribution with those of the original datasets. For this study, seasons were defined as Dry1 (January–May), Rainy (June–September), and Dry2 (October–December), consistent with previous work [9]. To determine seasonal rainfall amounts, monthly totals for the constituent months were summed up based on the seasons. For any one station-year, only seasons in which all constituent months had data were included in the development of seasonal data. For example, in any one year, the rainy season needed to have all four months of data for the season to be included in the analysis. Data were also evaluated from a decadal perspective considering only years with complete data as explained and decades with 5 years or more of complete data were preserved. Different criteria were used for the different time scales due to the number of missing values that could be tolerated without potentially confounding the analysis, as determined based on preliminary analysis of the data.
The pre-processed data were then screened to determine a common period on which to base the analysis. In this secondary screening, the period 1 January 1950–31 December 2016 was identified, resulting in data lengths of 49, 61, 53, 53, and 40 years at Arcadia, Fort Myers, Myakka River, Naples, and Punta Gorda, respectively.
2.2. Data Analysis
The pre-processed data were then analyzed to establish the statistical properties and essential characteristics [11] of the data as well as patterns in seasonal rainfall. Statistical properties included the minimum, maximum, mean, standard deviation, median, and interquartile range (IQR) for both daily and seasonal rainfall. The essential characteristics that were evaluated included annual and seasonal values of: One-day maximum rainfall; number of wet days; number of days with greater than 50.8 mm (2 in) and 101.6 mm (4 in) rainfall; and, the proportion of rainfall resulting from rainfall greater than the 95th and 99th percentile amounts. These characteristics are consistent with extreme indices described in previous studies [5,6,12,13,14,15]. For this study, a wet day was defined as a day with greater than 0.1 mm rainfall [11]. The percentile thresholds represent very wet days and extremely wet days, respectively [6]. Region-wide (Table 1), the 95th percentile rainfall corresponded closely to 25.4 mm (1 in) while the 99th percentile rainfall corresponded closely to 50.8 mm (2 in). Thus, these values (25.4 mm and 50.8 mm) were used to represent very wet and extremely wet days across all stations. In addition, the aforementioned essential characteristics were evaluated at the regional scale.
3. Results
3.1. Statistical Properties
Based on the statistical properties (Table 1), Myakka River had the highest daily mean rainfall in the region although values did not differ greatly across the region. Myakka River also had the highest amount of rainfall in the 95th and 99th percentile. The maximum value of daily rainfall was experienced at Punta Gorda (270 mm, 10.7 in) while Arcadia had the lowest value of maximum daily rainfall (187.5 mm, 7.4 in). However, the other values did not differ substantially across stations and when considered region-wide.
3.2. Essential Characteristics
Based on Table 2, Fort Myers had the highest one-day maximum rainfall in Dry1 (196.9 mm, 7.7 in) while this value was highest at Punta Gorda during the rainy season (270.5 mm, 10.6 in). Punta Gorda also had the lowest values of one-day maximum rainfall in both Dry1 and Dry2. For Dry2, this value was highest at Myakka River. The median amounts of seasonal rainfall experienced in Dry1 and Dry2 were both highest at Myakka River, with the value for Dry1 being 51.1 mm (≈2 in) higher than the regional median. Fort Myers had the highest amounts of Rainy season rainfall, which was 185.2 mm (7.3 in) higher than the region median, while Punta Gorda had the lowest amounts for both Dry2 and Rainy season. The number of wet days experienced varied across seasons but did not generally vary across station, with most of the values obtained being relatively close to the regional medians. The number of days with rainfall greater than 50.8 mm (2 in) and greater than 101.6 mm (4 in) also did not differ substantially across stations considering the different seasons.
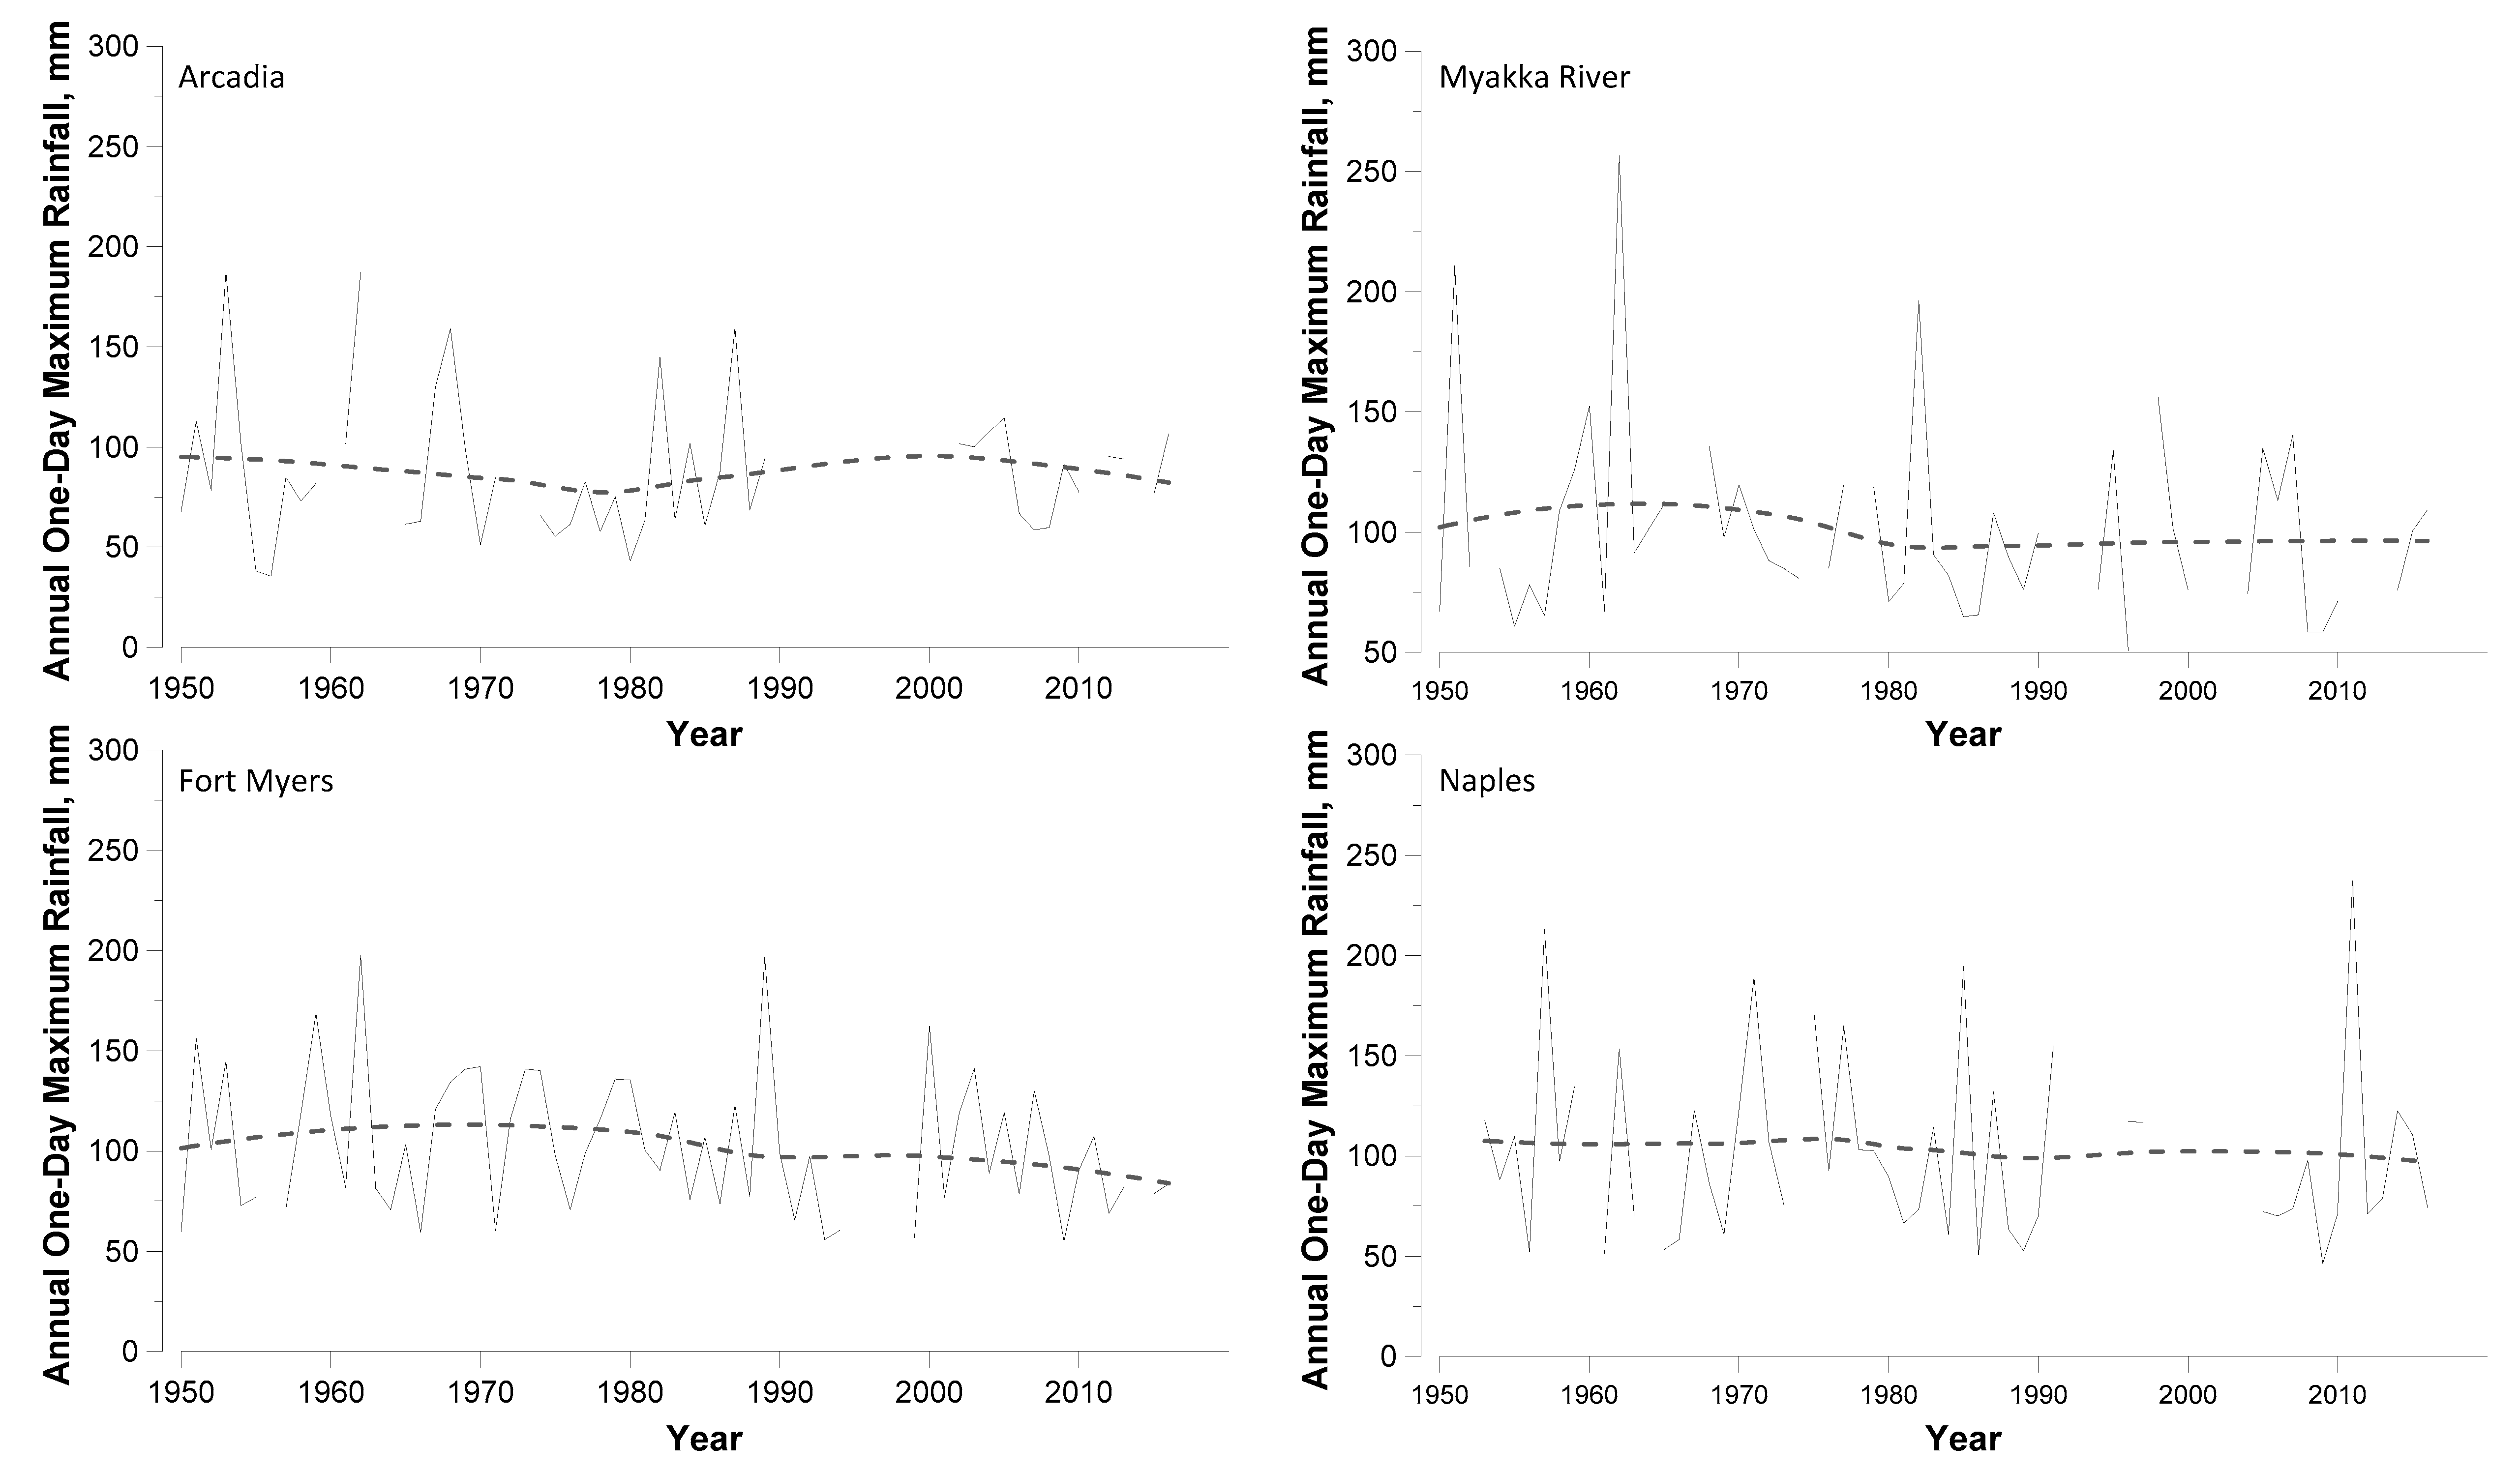
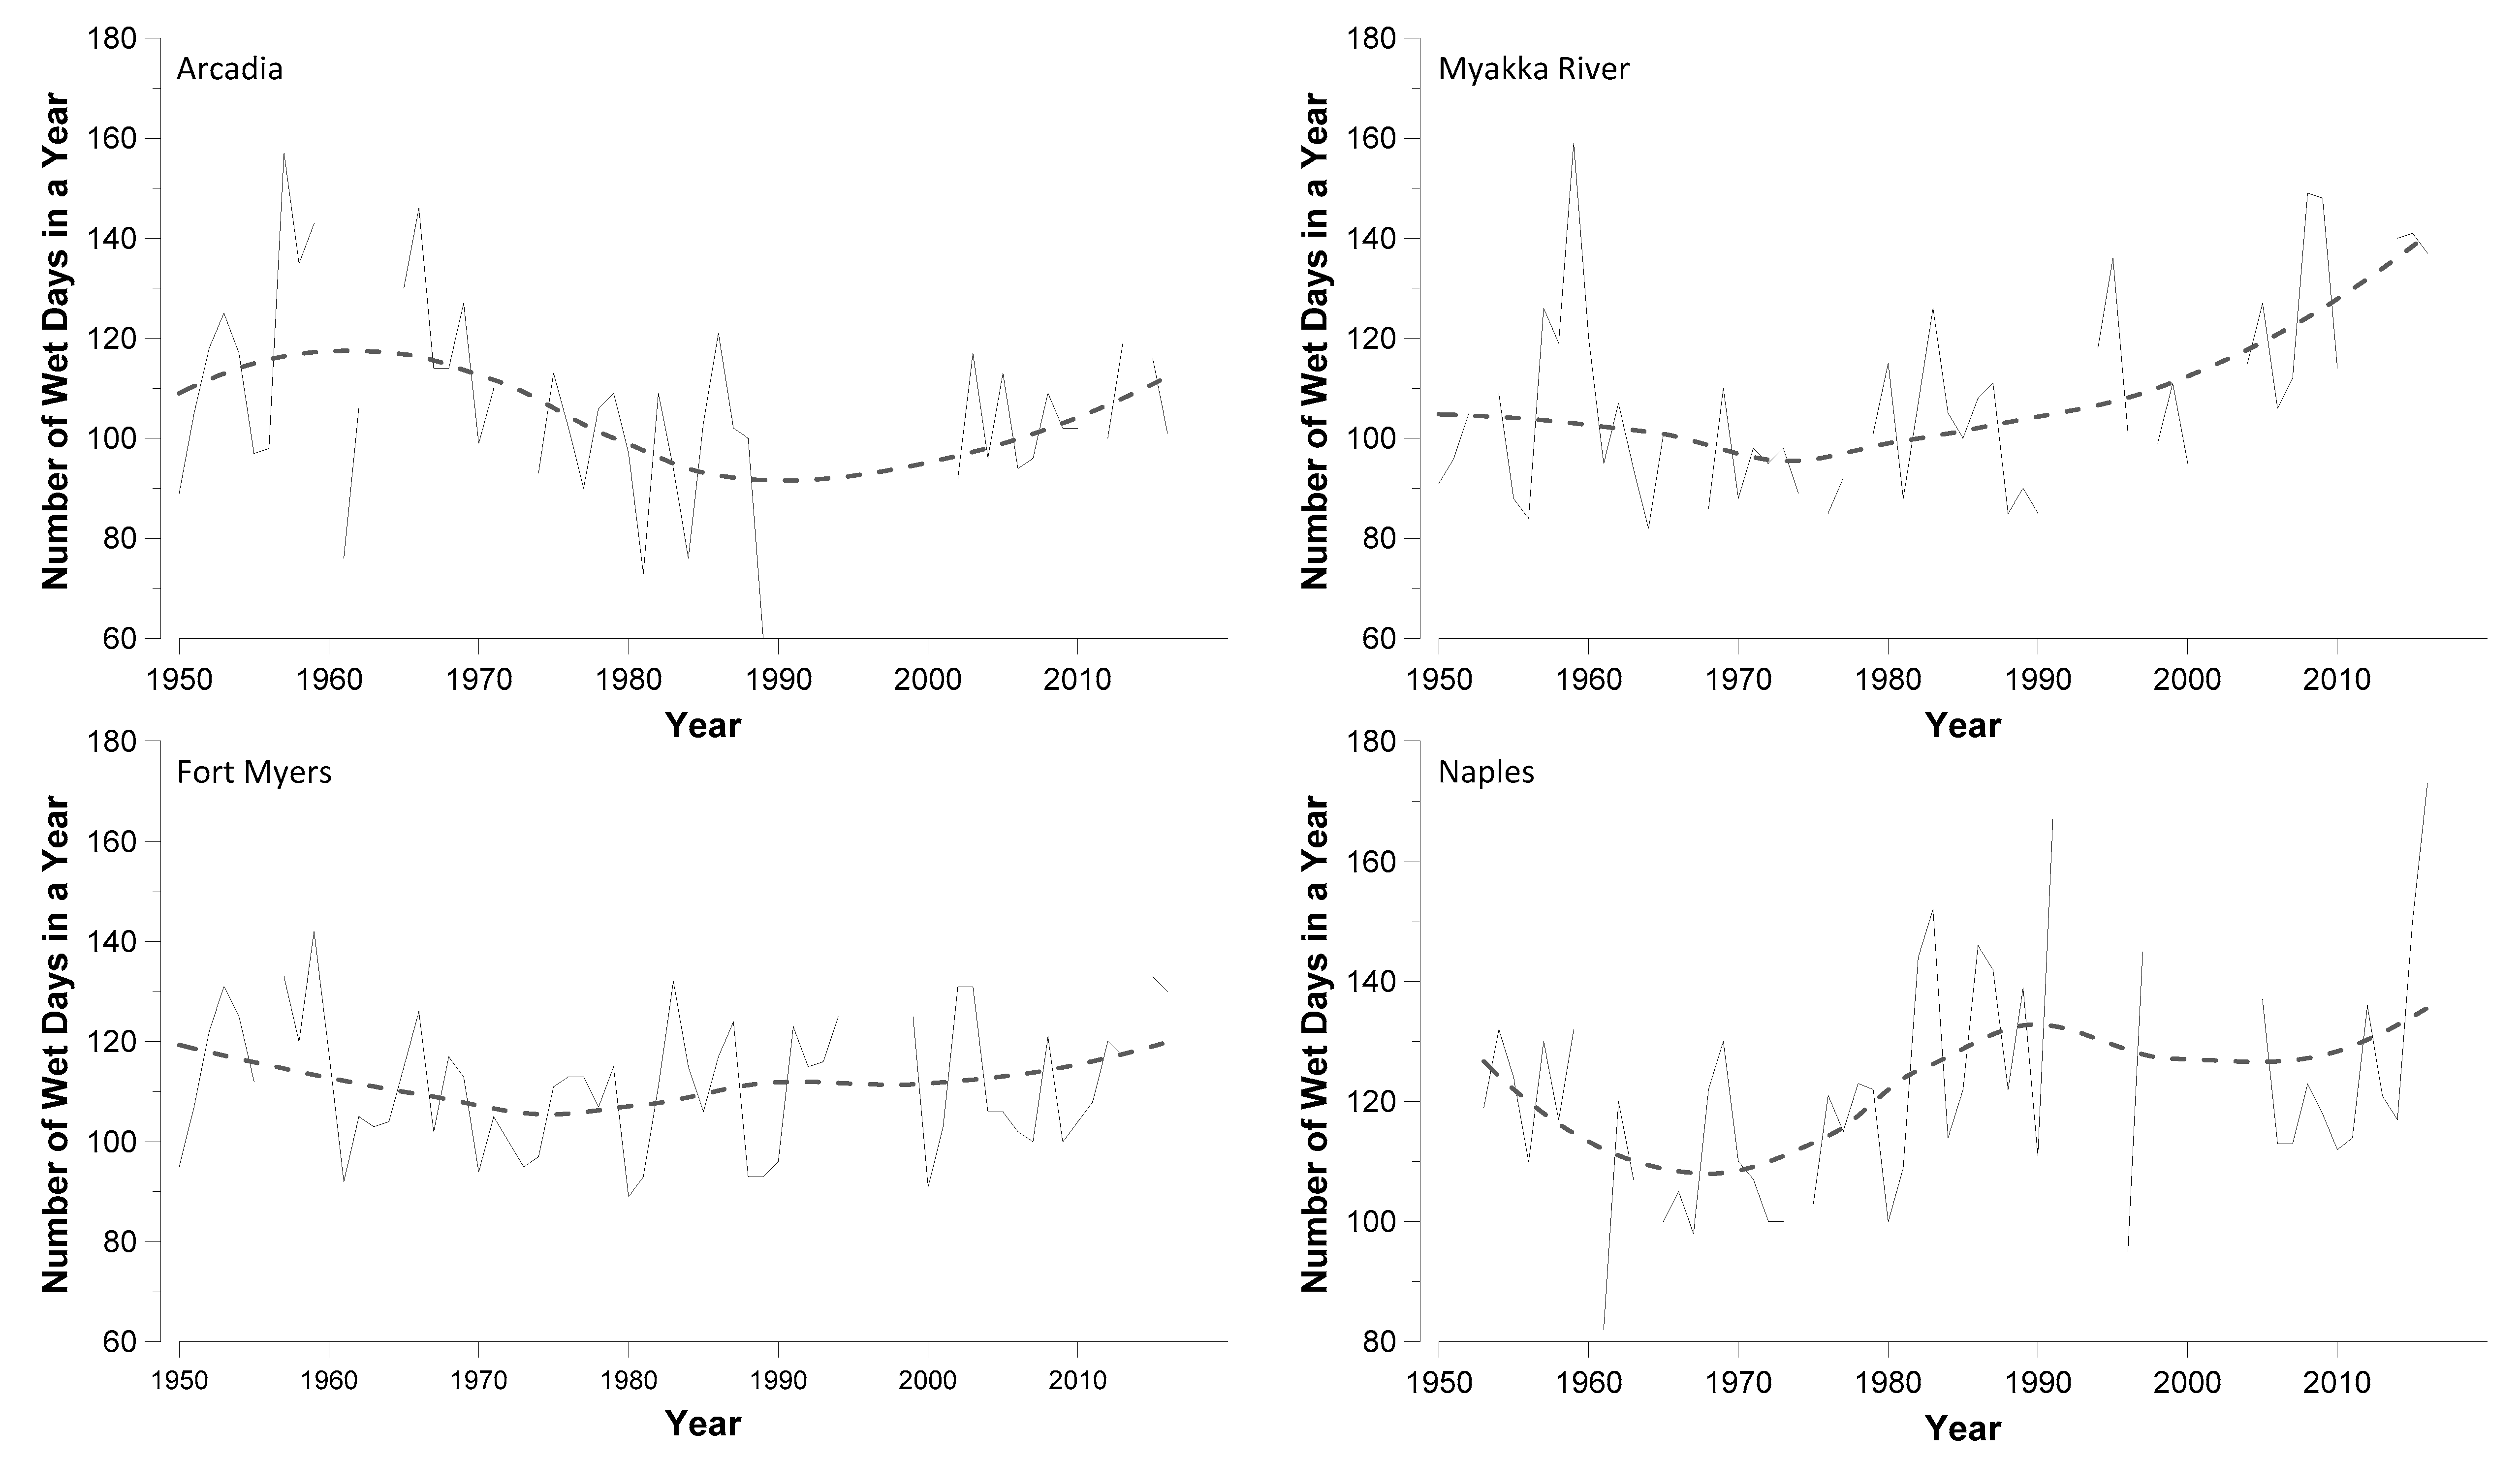
Based on Figure 2, annual one-day maximum rainfall followed a cyclical pattern at Arcadia, although patterns for the 1990s were uncertain due to missing data during that period. Annual one-day maximum rainfall experienced general decline at all other stations although none of the trends were significant based on the Mann–Kendall test. The number of wet days in a year (Figure 3) experienced a decline at Arcadia in the years between the mid-1960s and the early 1990s but seemed to be on the rise, although with decreased variability relative to the earlier decades. A similar pattern was observed at Fort Myers with a decline between the 1950s and the 1980s and an increase in recent years. At Myakka River, the number of wet days in a year declined slightly between the 1950s and the 1970s and then increased dramatically after about 1975. The number of wet days in a year also increased substantially at Naples from the 1960s to the present. Both increases were statistically significant (p = 0.0013 and 0.0382, respectively).
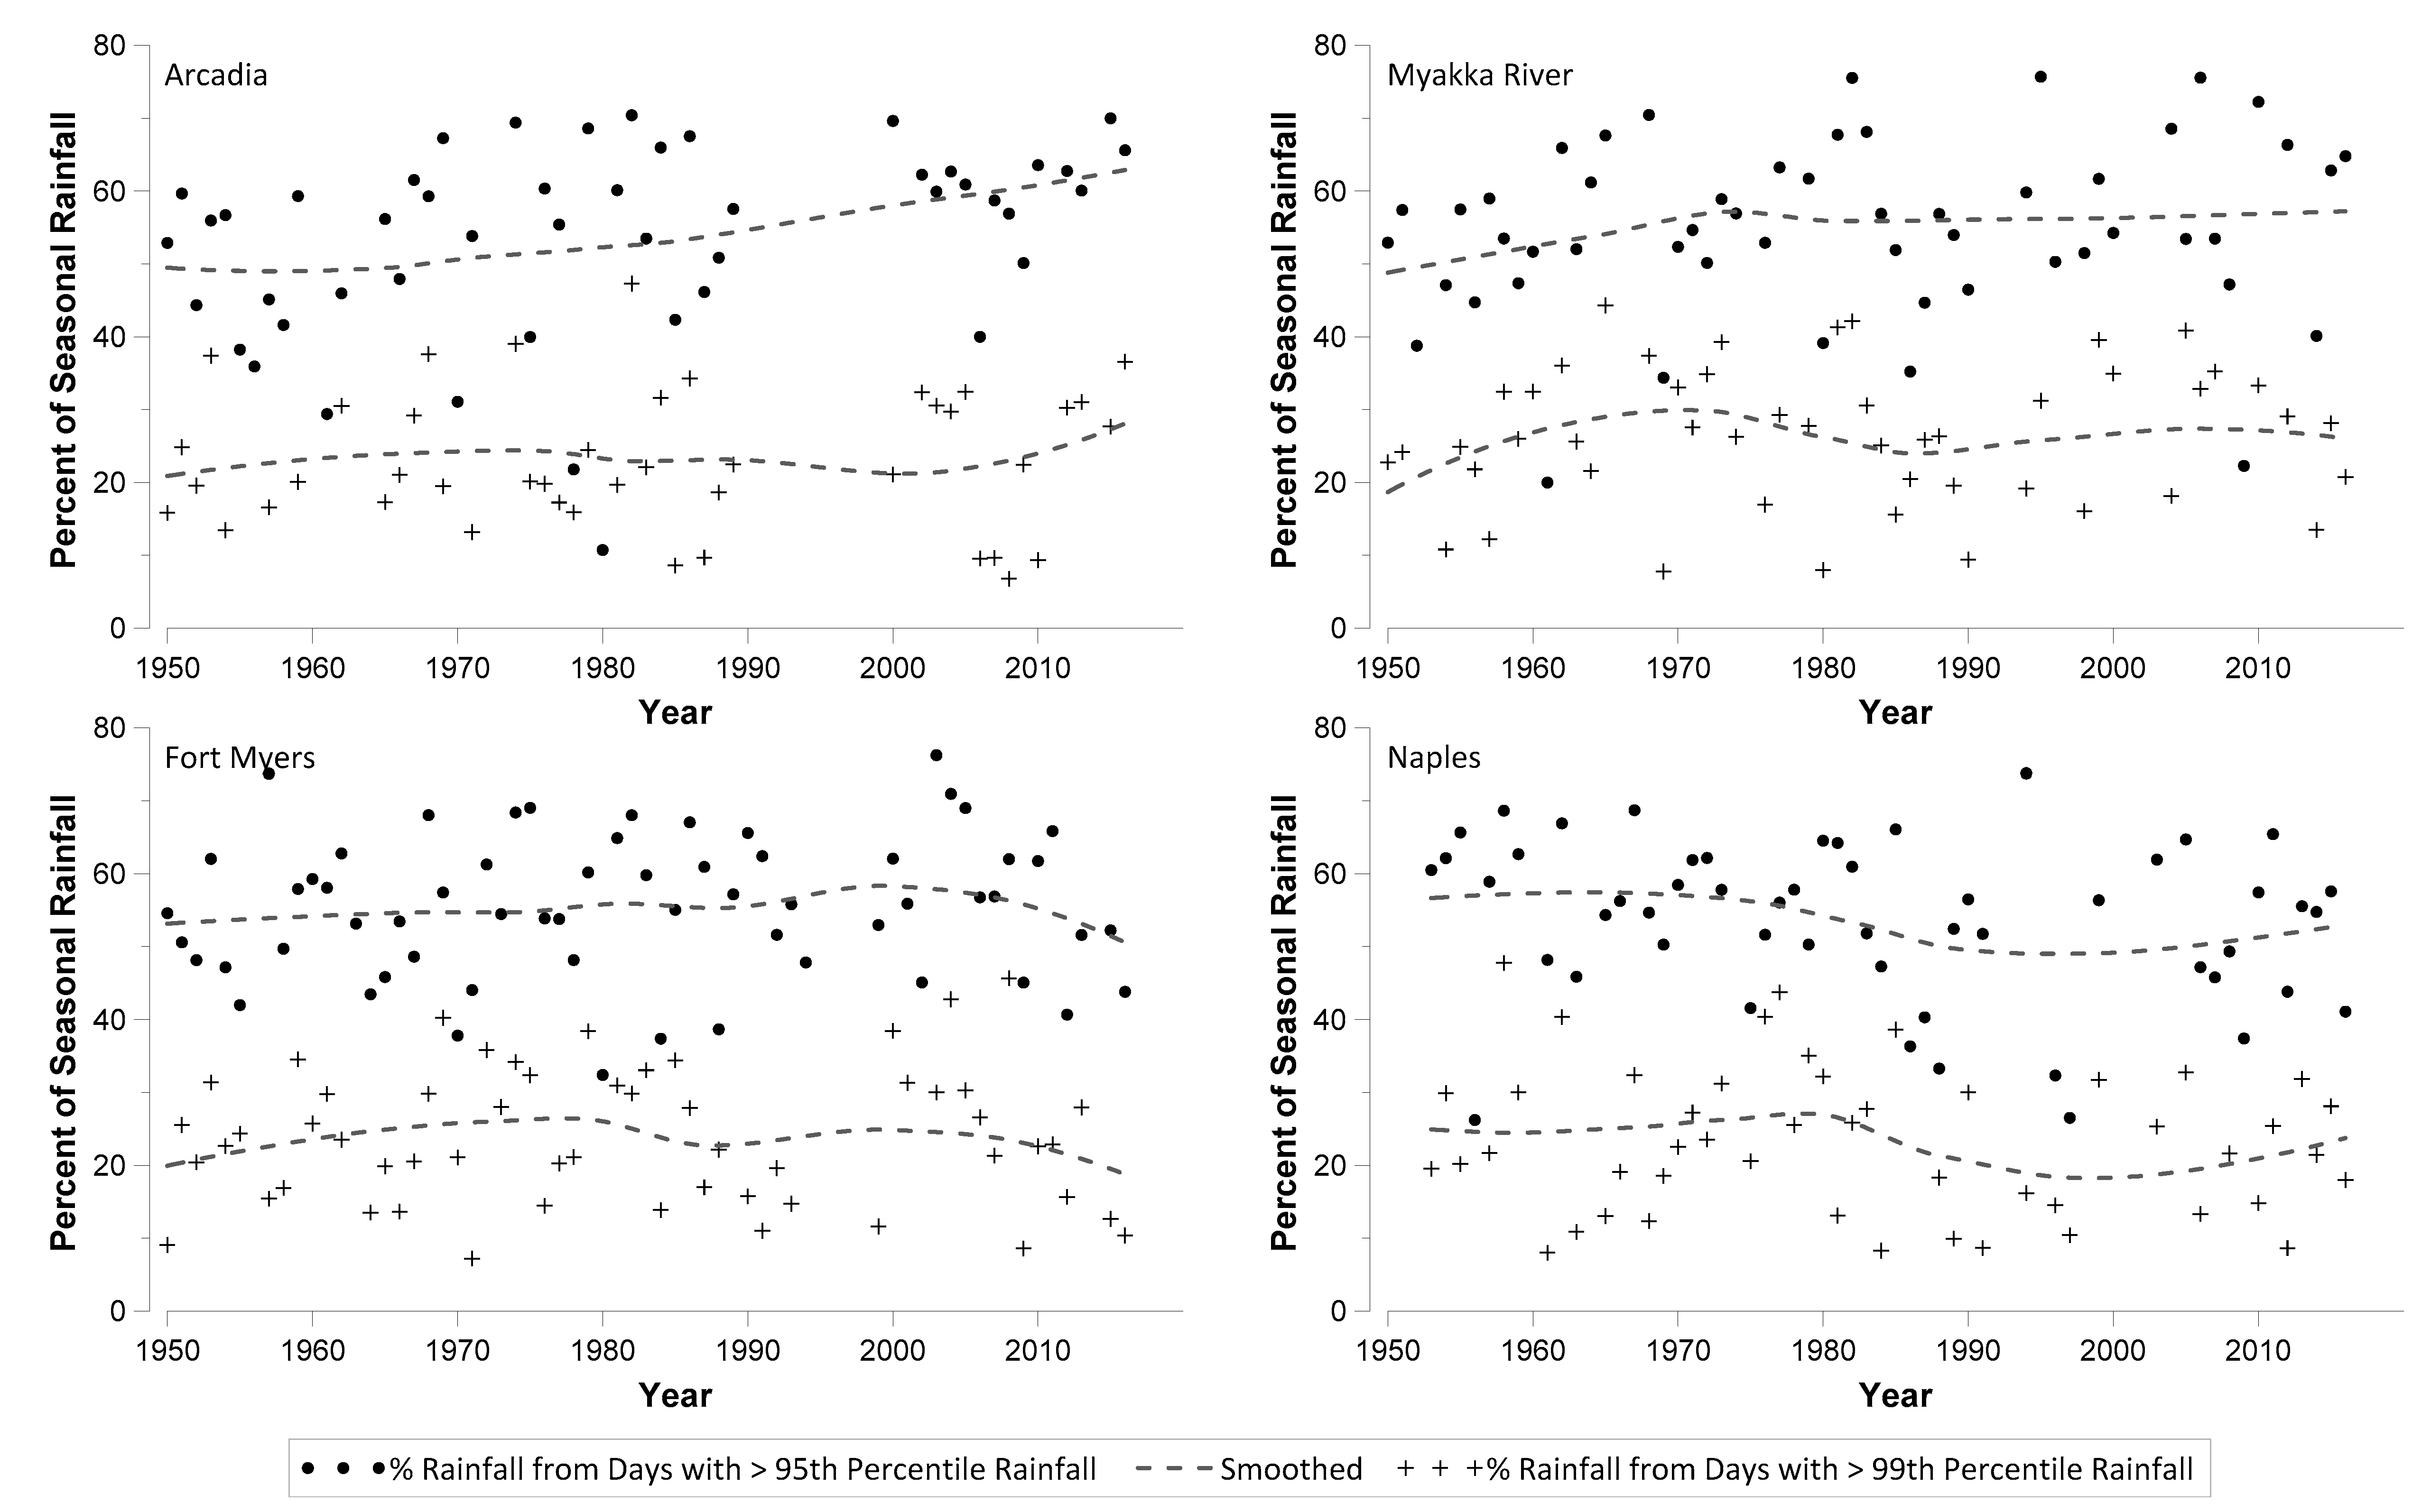
Based on Table 3, the contribution of rainfall from very wet days ranged from 10% in Dry1 at Arcadia to 90% in Dry2 at Myakka River, with regional medians ranging from 51 (Dry1) to 56 (Dry2). The corresponding ranges for rainfall from extremely wet days were 7% in the rainy season at Arcadia and Fort Myers and to 86% in Dry2 at Fort Myers with regional medians ranging from 23% in the Rainy season to 40% in Dry2. Based on Figure 4, the amount of Rainy season rainfall contributed by days in which there was more than the 95th percentile rainfall amounts increased steadily at Arcadia (p = 0.0055) but did not change substantially at the other stations or for the 99th percentile rainfall. In both cases (95th and 99th percentiles), contributions increased significantly with increase in seasonal rainfall (p < 0.0001 to p = 0.026). This implies that more rainfall comes from extreme events during wetter years than it does during years with lower rainfall. Conversely, years in which more days have higher than the 95th or 99th percentile rainfall are generally likely to be overall wetter years.
3.3. Seasonal Patterns
Figure 5 shows total seasonal rainfall in the Rainy and Dry2 seasons for Myakka River and Naples stations. These two stations were selected for the figure as they tended to experience large amounts of rainfall. Based on the figure, a marked increase in Rainy season rainfall was experienced at Naples from about 1990. However, a corresponding decrease was also experienced in Dry2 at this station during the later decades. An increase in Rainy season rainfall was also observed at Myakka River, although not to the same extent as at Naples. A corresponding decrease in Dry2 rainfall was also observed at this station. Significant increases in Rainy season rainfall over time were observed at Fort Myers and Punta Gorda (p = 0.02, 0.03, respectively) while increases at the other stations were not significant. Corresponding declines in Dry2 rainfall were also observed at most stations although only changes at Arcadia were significant (p = 0.04). The patterns in Dry1 were mixed with decreases observed at Fort Myers, Naples, and Punta Gorda and increases at Arcadia and Myakka River, although none of the changes were significant. Further analysis showed significant increases in the number of wet days in a year during the Rainy season at Myakka River (p = 0.006) and Naples (p = 0.0027). With respect to Dry2, only Myakka River had significant change in the number of wet days in a year (increase, p = 0.04). No significant changes were seen in the number of wet days in a year in Dry1.
3.4. Regional Patterns in Seasonal Rainfall
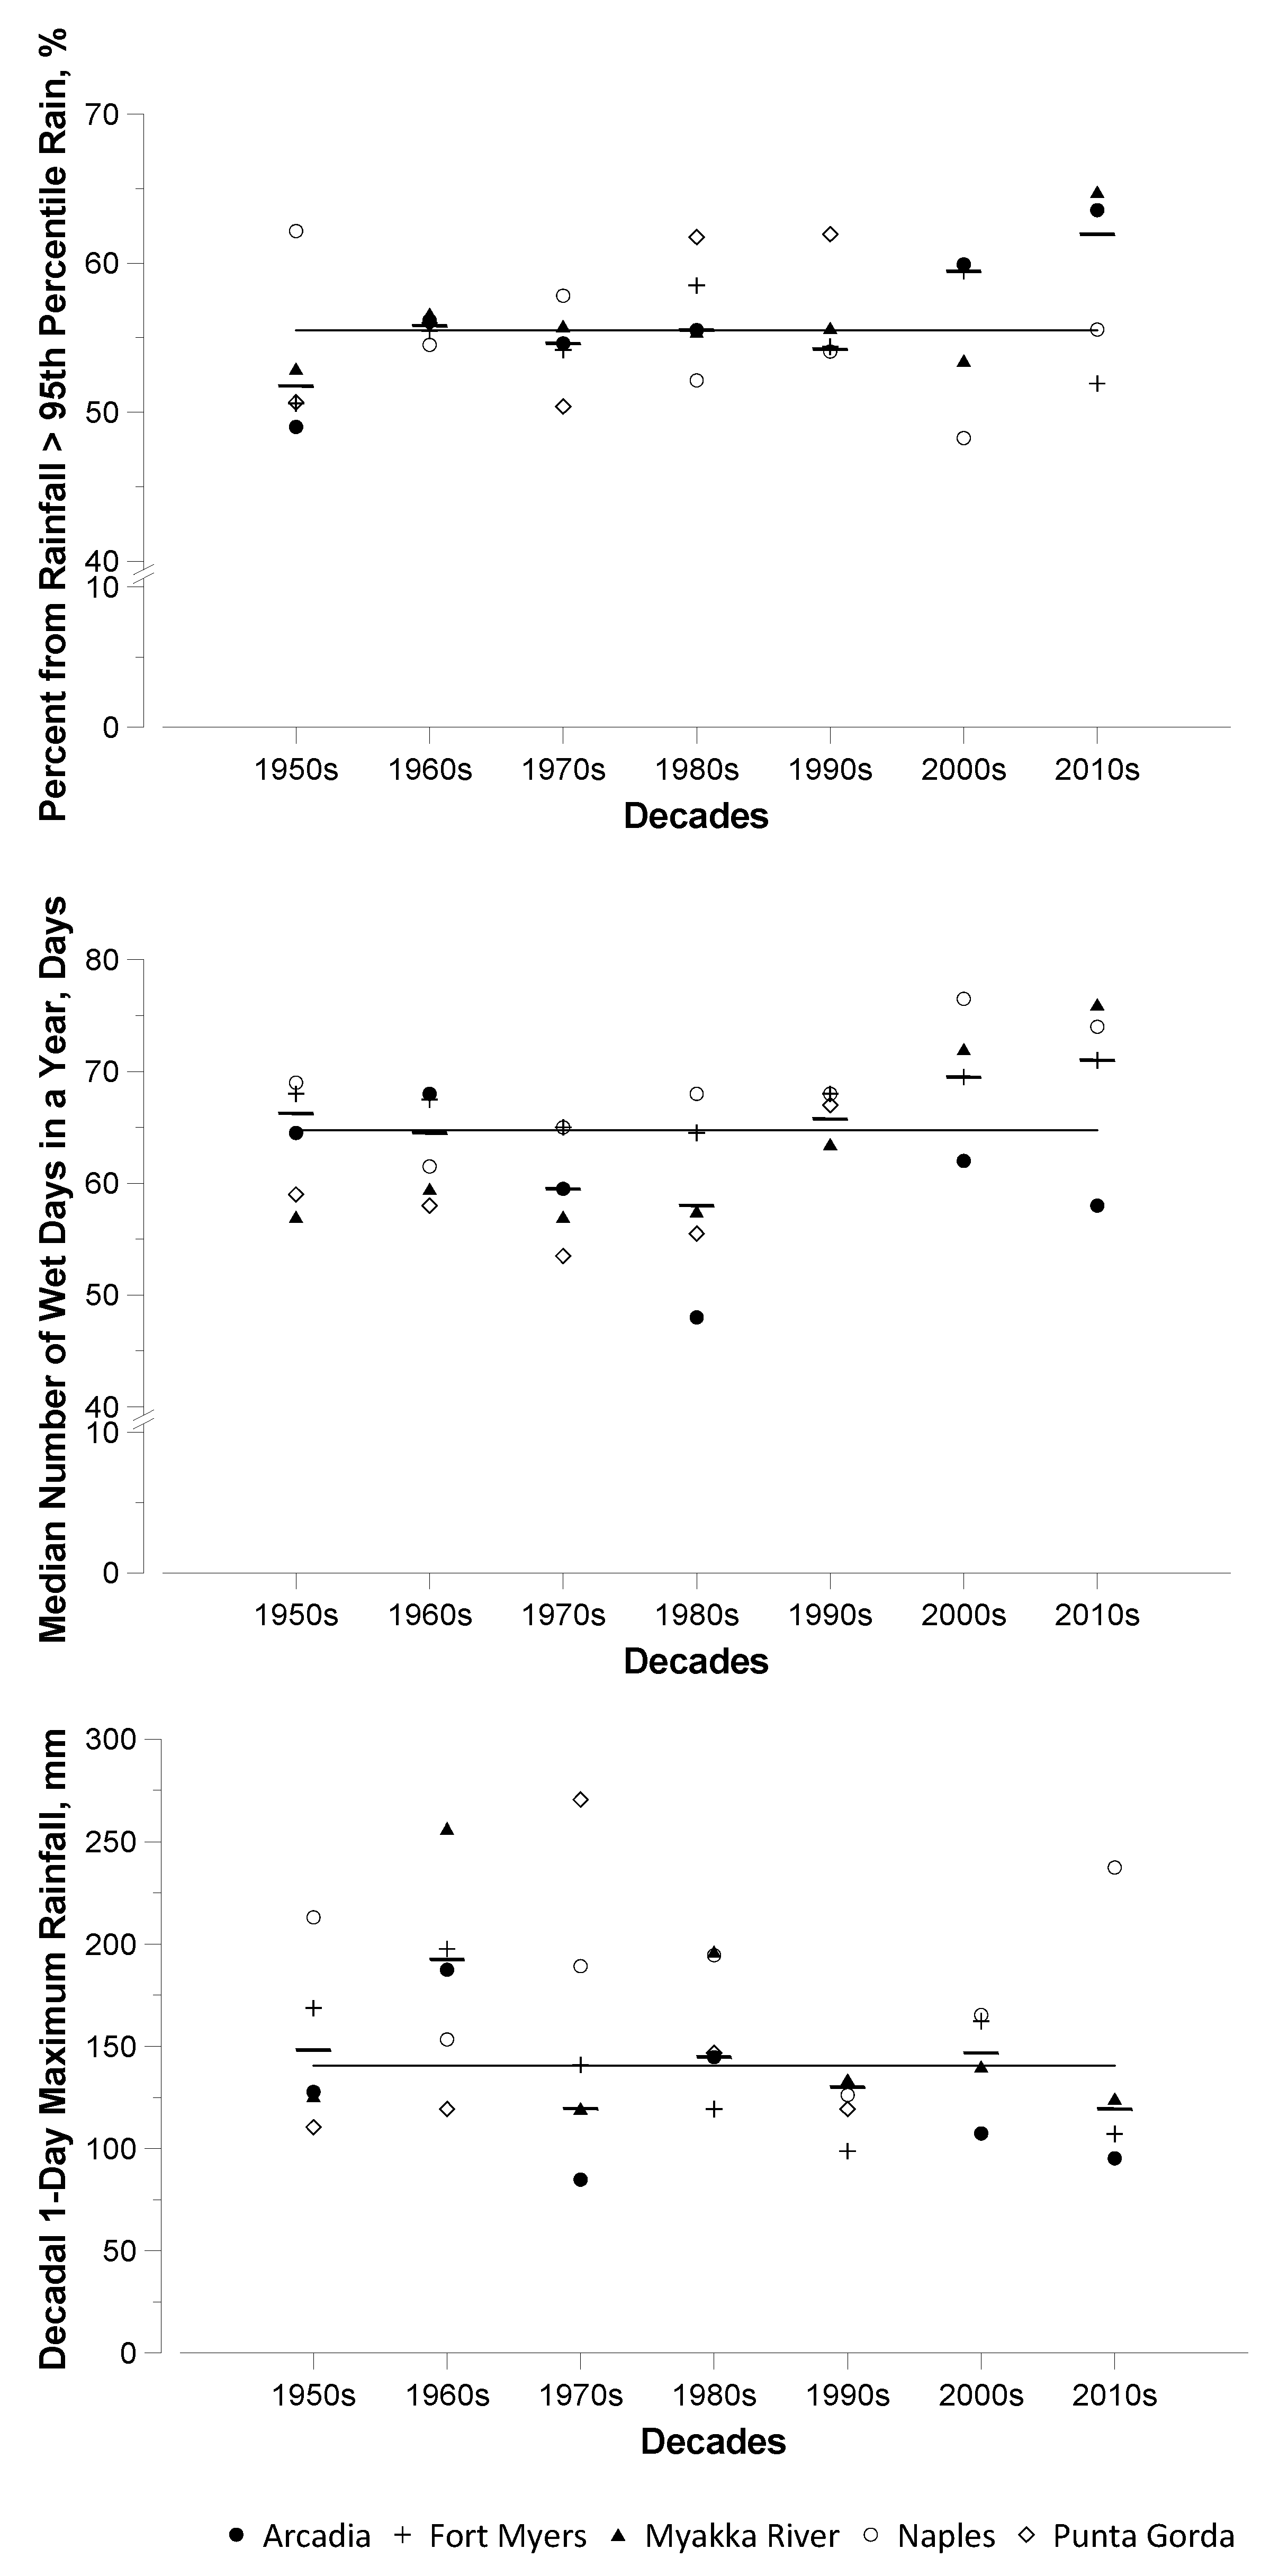
For the Rainy season (Figure 6), the decadal one-day maximum precipitation was high in the 1960s but remained more or less constant during the rest of the decades. This is consistent with other analysis in this study, which showed no significant changes (α = 0.05) in one-day maximum precipitation for the respective stations and across the region. The number of wet days in the (Rainy) season declined during the 1950s to the 1980s then increased dramatically through to the present decade. The amount of rain received from 95th percent rainfall has also experienced increases in recent decades, having remained more or less constant between the 1960s and 1990s. This would imply an increasingly wetter rainy season with increasing contributions from extreme events in some areas, both of which have implications for design and management decision- making. The corresponding (decadal one-day maximum precipitation, number of wet days in the season, amount of rain received from 95th percent rainfall) did not change substantially in either of Dry1 or Dry2.
4. Discussion
In this study, variations in daily indices of daily and seasonal rainfall extremes were examined with a focus on the southwest Florida Gulf coastal zone. From the analysis, Myakka River had the highest mean daily rainfall and also the highest contributions from rainfall exceeding the 95th and 99th percentile thresholds. This station also had the highest rainfall in Dry 1 and Dry 2. For the most part, rainfall occurring on very wet days (rainfall > 25.4 mm, 1 in) accounted for about 50% of the seasonal rainfall in the area regardless of the season, while the impact of rainfall occurring on extremely wet days (rainfall > 25.4 mm, 1 in) was mostly felt in Dry2 accounting for about 40% of rainfall in this season. No significant changes were seen in the maximum one-day rainfall at any of the stations regardless of the time scale. However, there was a significant increase in the number of wet days in the rainy season at Myakka River (p = 0.0062) and Naples (p = 0.0027), and during Dry2 at Myakka River (p = 0.0204). These two stations also experienced significant increases in the number of wet days in a year. Regionally, increases were seen in the number of wet days and contributions from very wet days during the rainy season, suggesting an increasingly wetter season with increased contributions of extreme events during the season, both of which have implications for design and management decision-making.
The ability to assess and predict changes in extreme events is often hampered by lack of consistent historical data [16]. Most of the stations used in this study had long records of historical data—from as early as the 1890s at Fort Myers and Arcadia, and the late 1920s at La Belle. For the U.S. Historical Climatology Network stations, changes in rainfall instrumentation over time have not been significant [17] except in recent years [18]. The datasets undergo a detailed quality assurance/quality control process [18] making them the most reliable datasets for this study. However, the earlier records had a lot of missing data, which reduced their usability. La Belle had very few data for the 1920s, 1990s, and 2000s while data from the 1990s were largely inconsistent at Arcadia. Other than La Belle, the stations had the period between 1950 and 2016 in common, thus this period was used for the analysis. While this approach provided a common basis for comparisons across stations, a number of longer-term trends, that would have been discernible from longer datasets, were not evident. When considered from the 1920s, for example, Fort Myers had a significant decrease in the number of wet days in a year in Dry2 (p = 0.04) while significant decreases were seen in the number of wet days in a year in Dry1 at Arcadia (p = 0.04). Neither trend was evident from the current analysis. The large annual variability across all indices and stations could also have impacted trends given the presence of missing data.
Missing data are fairly common with rainfall data and climate data in general. Some approaches used in dealing with missing data include [19]: Discarding entries for which data are missing and only using those for which all data are available (complete case analysis); and, studying different aspects of the problem with different subsets of the data, depending on what data are necessary for the particular aspect (available case analysis). The former method might result in a much-reduced dataset, depending on the amount of data missing, and/or might result in a bias where the missing values differ systematically from complete values. A drawback with the latter method is that, depending on the problem being addressed, inconsistencies might occur in the results since analyses are based on different subsets of the original data. A commonly used alternative to the aforementioned methods of dealing with missing data, is to impute the missing data [19,20]. A lot of work has been done to develop methods for imputing missing data. These methods are widely used, although there is a limit to how much can reasonably be imputed without introducing undue uncertainties into the resulting dataset. However, consistent information on what constitutes “too much” missing data is generally lacking. Missing data thresholds reported in the literature range from three to five days for a month, and 15 to 60 days for a year, while some studies have considered data with 10% or fewer missing values as acceptable [10,17,21,22]. Other authors have simply stated that stations had “too much missing data” without substantiating the statement [23,24]. A criterion of no more than four missing values in a year is commonly used for analyzing daily extremes [5], thus, this criterion was adopted in this study. For the seasonal analysis, the criterion put forth for monthly data [10] was used.
Another challenge evident in analyzing changes or trends in extreme events is associated with isolating the effects of natural climate phenomena. These phenomena, such as the El Niño−Southern Oscillation (ENSO), which primarily affects winter rainfall [25], and the Atlantic Multidecadal Oscillation which affects total rainfall amounts and the occurrence of hurricanes [26], alone, and in their commingling with anthropogenic influences, could confound results. Such analysis is, however, beyond the scope of this study.
5. Conclusions
Variations in extreme indices for daily and seasonal rainfall were examined with a focus on the southwest Florida Gulf coastal zone. Significant increases were seen in the number of wet days in the Rainy season at Myakka River and Naples and during October–December at Myakka River. These two stations also experienced significant increases in the number of wet days in a year. Such changes in short-term rainfall events provide insights into long-term rainfall patterns. When considered regionally, increases were seen in the number of wet days during the rainy season and in the contribution to rainy season rainfall from very wet days (rainfall > 25.4 mm, 1 in). Results suggest an increasingly wetter rainy season with increasing contributions from extreme events depending on rainfall amounts, both of which have implications for design and management decision-making. For example, storm water and pollutant control practices would need to be designed or redesigned to account for larger runoff volumes resulting from increasingly larger precipitation events. In low-lying areas, landscape management would need to cater for and/or be adapted to handle increased flooding during the rainy season. Methodologies and approaches in this study are applicable in other areas where there is the need to determine patterns and trends in daily and seasonal rainfall extremes.
Funding
This research was funded by USDA National Institute of Food and Agriculture (Project No. IND010639R).
Acknowledgments
Many thanks to Sara Raissa Brito Bezerra for her work in the original organization and preprocessing of the climate data. The author is also grateful for the insights provided by the reviewers.
Conflicts of Interest
The authors declare no conflict of interest. The funders had no role in the design of the study; in the collection, analyses, or interpretation of data; in the writing of the manuscript, and in the decision to publish the results.
References
- U.S. Commission on Ocean Policy. An Ocean Blueprint for the 21st Century; Final Report; US Commission on Ocean Policy: Washington, DC, USA, 2004.
- US Environmental Protection Agency. National Coastal Condition Report IV; US Environmental Protection Agency: Washington, DC, USA, 2012.
- Wilson, M.A.; Farber, S. Chapter 2—Accounting for ecosystem goods and services in coastal estuaries. In The Economic and Market Value of Coasts and Estuaries: What’s at Stake? Pendleton, L.H., Ed.; Restore America’s Estuaries: Arlington, VA, USA, 2009; pp. 14–36. [Google Scholar]
- National Oceanic and Atmospheric Administration. How important is the ocean to our economy? Available online: https://oceanservice.noaa.gov/facts/oceaneconomy.html (accessed on 31 May 2018).
- Klein Tank, A.; Zweirs, F.; Zhang, X. Guidelines on Analysis of Extermes in a Changing Climate in Support of Informed Decisions for Adaptation; World Meterorological Organization: Geneva, Switzerland, 2009. [Google Scholar]
- Zhang, X.; Alexander, L.; Hegerl, G.C.; Jones, P.; Tank, A.K.; Peterson, T.C.; Trewin, B.; Zwiers, F.W. Indices for monitoring changes in extremes based on daily temperature and precipitation data. Wiley Interdiscipl. Rev. Clim. Chang. 2011, 2, 851–870. [Google Scholar] [CrossRef]
- Charlotte Harbor National Estuary Program. Charlotte Harbor Regional Climate Change Vulnerability Assessment. Available online: http://www.Chnep.Org/grantsreceived/cre/vulnerabilityassessment2-19-10.Pdf (accessed on 17 December 2015).
- Obeysekera, J.; Browder, J.; Hornung, L.; Harwell, M.A. The natural south florida system i: Climate, geology, and hydrology. Urban Ecosyst. 1999, 3, 223–244. [Google Scholar] [CrossRef]
- Gitau, M. Long-term seasonality of rainfall in the southwest florida gulf coastal zone. Clim. Res. 2016, 69, 93–105. [Google Scholar] [CrossRef]
- World Meteorological Organization. Meeting of the Commission for Climatology (CCL) Expert Team on Climate Risk and Sectorspecific Climate Indices (ET-CRSCI); World Meterological Organization: Geneva, Switzerland, 2012; p. 41. [Google Scholar]
- Mehan, S.; Guo, T.; Gitau, M.W.; Flanagan, D.C. Comparative study of different stochastic weather generators for long-term climate data simulation. Climate 2017, 5, 26. [Google Scholar] [CrossRef]
- Schär, C.; Ban, N.; Fischer, E.M.; Rajczak, J.; Schmidli, J.; Frei, C.; Giorgi, F.; Karl, T.R.; Kendon, E.J.; Tank, A.M.K. Percentile indices for assessing changes in heavy precipitation events. Clim. Chang. 2016, 137, 201–216. [Google Scholar] [CrossRef] [Green Version]
- Sillmann, J.; Kharin, V.; Zhang, X.; Zwiers, F.; Bronaugh, D. Climate extremes indices in the cmip5 multimodel ensemble: Part 1. Model evaluation in the present climate. J. Geophys. Res. Atmos. 2013, 118, 1716–1733. [Google Scholar] [CrossRef]
- Karl, T.R.; Knight, R.W.; Easterling, D.R.; Quayle, R.G. Indices of climate change for the united states. Bull. Am. Meteorol. Soc. 1996, 77, 279–292. [Google Scholar] [CrossRef]
- Groisman, P.Y.; Knight, R.W.; Easterling, D.R.; Karl, T.R.; Hegerl, G.C.; Razuvaev, V.N. Trends in intense precipitation in the climate record. J. Clim. 2005, 18, 1326–1350. [Google Scholar] [CrossRef]
- Wong, P.P.; Losada, I.J.; Gattuso, J.-P.; Hinkel, J.; Khattabi, A.; McInnes, K.L.; Saito, Y.; Sallenger, A. Coastal systems and low-lying areas. Clim. Chang. 2014, 2104, 361–409. [Google Scholar]
- Kunkel, K.E.; Karl, T.R.; Easterling, D.R. A monte carlo assessment of uncertainties in heavy precipitation frequency variations. J. Hydrometeorol. 2007, 8, 1152–1160. [Google Scholar] [CrossRef]
- Menne, M.J.; Durre, I.; Vose, R.S.; Gleason, B.E.; Houston, T.G. An overview of the global historical climatology network-daily database. J. Atmos. Ocean. Technol. 2012, 29, 897–910. [Google Scholar] [CrossRef]
- Gelman, A.; Hill, J. Missing-data imputation. In Data Analysis Using Regression and Multilevel/Hierarchical Models. Analytical Methods for Social Research; Cambridge University Press: Cambridge, UK, 2006. [Google Scholar]
- Soley-Bori, M. Dealing with Missing Data: Key Assumptions and Methods for Applied Analysis; Boston University School of Public Health, Department of Health Policy and Management: Boston, MA, USA, 2013. [Google Scholar]
- Natural Resources Conservation Service. Wets Tables: Accommodating Missing Temperature and Precipitation Data. Available online: https://www.wcc.nrcs.usda.gov/climate/wets_missing.html (accessed on 28 May 2018).
- Shahid, S. Trends in extreme rainfall events of bangladesh. Theor. Appl. Climatol. 2011, 104, 489–499. [Google Scholar] [CrossRef]
- He, B.; Lü, A.; Wu, J.; Zhao, L.; Liu, M. Drought hazard assessment and spatial characteristics analysis in china. J. Geogr. Sci. 2011, 21, 235–249. [Google Scholar] [CrossRef]
- Kiem, A.; Verdon-Kidd, D. The importance of understanding drivers of hydroclimatic variability for robust flood risk planning in the coastal zone. Australas. J. Water Resour. 2013, 17, 126–134. [Google Scholar] [CrossRef]
- National Oceanic and Atmospheric Administration. South Florida Climate Page. Available online: https://www.weather.gov/mfl/winteroutlookforsouthflorida (accessed on 23 October 2018).
- National Oceanic and Atmospheric Administration. Frequently asked questions about the atlantic multidecadal oscillation. Available online: http://www.aoml.noaa.gov/phod/amo_faq.php (accessed on 12 October 2015).
Figure 1.
Southwest Florida region showing weather station locations. Rivers from northwest to southeast: Mykka River, Peace River, and Caloosahatchee River.
Figure 1.
Southwest Florida region showing weather station locations. Rivers from northwest to southeast: Mykka River, Peace River, and Caloosahatchee River.

Figure 2.
Time series of annual one-day maximum rainfall at stations in the southwest Florida Gulf coastal region. Dashed line shows variations based on the LOWESS smoother (span = 0.75).
Figure 2.
Time series of annual one-day maximum rainfall at stations in the southwest Florida Gulf coastal region. Dashed line shows variations based on the LOWESS smoother (span = 0.75).

Figure 3.
Time series of the number of wet days in a year at stations in the southwest Florida Gulf coastal region. Dashed line shows variations based on the LOWESS smoother (span = 0.75).
Figure 3.
Time series of the number of wet days in a year at stations in the southwest Florida Gulf coastal region. Dashed line shows variations based on the LOWESS smoother (span = 0.75).

Figure 4.
Percentage of Rainy season rainfall contributed by rainfall from days with greater than the 95th percentile rainfall amount (25.4 mm, 1 in) and the 99th percentile rainfall amount (50.8 mm, 2 in) in the southwest Florida Gulf coastal region. Dashed line shows variations based on the LOWESS smoother (span = 0.75).

Figure 5.
Time series of total seasonal rainfall at Naples and Myakka River stations showing patterns for the Rainy season (top) and Dry2 (bottom).
Figure 5.
Time series of total seasonal rainfall at Naples and Myakka River stations showing patterns for the Rainy season (top) and Dry2 (bottom).

Figure 6.
Time evolution of Rainy season rainfall characteristics showing decadal variations across the region. Short horizontal lines: Medians for the respective decades. Solid line represents the median of the data.
Figure 6.
Time evolution of Rainy season rainfall characteristics showing decadal variations across the region. Short horizontal lines: Medians for the respective decades. Solid line represents the median of the data.


Table 1.
Statistical properties of daily rainfall for southwest Florida Gulf coastal zone stations for the period 01/01/1950–12/31/2016.
Table 1.
Statistical properties of daily rainfall for southwest Florida Gulf coastal zone stations for the period 01/01/1950–12/31/2016.
| Stations | Mean | Stdev | IQR | 95th pct | 99th pct | Max |
|---|---|---|---|---|---|---|
| Arcadia | 3.7 | 10.8 | 0.8 | 24.4 | 52.3 | 187.5 |
| Fort Myers | 3.8 | 11.3 | 1.0 | 23.9 | 53.4 | 197.6 |
| Myakka River | 4.0 | 11.6 | 1.3 | 25.4 | 57.2 | 256.5 |
| Naples * | 3.8 | 11.1 | 1.5 | 23.4 | 51.3 | 237.5 |
| Punta Gorda † | 3.5 | 10.8 | 0.8 | 22.9 | 50.8 | 270.5 |
| All | 3.8 | 11.1 | 1.3 | 24.1 | 53.1 | 270.5 |
* Dataset starts on 01/01/1953; † Dataset starts on 01/01/1970. n = 93,503 (All); 17,897 (Arcadia); 22,280 (Fort Myers); 19,361(Myakka River); 19,356 (Naples); and, 14,609 (Punta Gorda).
Table 2.
Seasonal rainfall characteristics for select stations in the southwest Florida Gulf coastal zone covering the period 01/01/1950–12/31/2016.
Table 2.
Seasonal rainfall characteristics for select stations in the southwest Florida Gulf coastal zone covering the period 01/01/1950–12/31/2016.
| Stations | Season | n | 1-Day Max | Median Rainfall, mm | Median NWET, Days | Max # Days > 50.8 mm | Max # Days > 101.6 mm |
|---|---|---|---|---|---|---|---|
| Dry1 | 49 | 159.5 | 312.9 | 28 | 5 | 2 | |
| Arcadia | Dry2 | 49 | 187.5 | 149.1 | 16 | 3 | 1 |
| Rainy | 49 | 187.5 | 837.2 | 61 | 7 | 3 | |
| Dry1 | 61 | 196.9 | 287.3 | 28 | 6 | 2 | |
| Fort Myers | Dry2 | 61 | 156.5 | 146.6 | 17 | 3 | 2 |
| Rainy | 61 | 197.6 | 927.1 | 67 | 8 | 2 | |
| Dry1 | 53 | 156.2 | 358.9 | 26 | 4 | 3 | |
| Myakka River | Dry2 | 53 | 210.8 | 177.3 | 16 | 4 | 1 |
| Rainy | 53 | 256.5 | 894.1 | 60 | 8 | 1 | |
| Dry1 | 53 | 172.0 | 313.9 | 31 | 4 | 2 | |
| Naples * | Dry2 | 53 | 132.1 | 161.0 | 19 | 2 | 1 |
| Rainy | 53 | 237.5 | 916.7 | 68 | 7 | 3 | |
| Dry1 | 40 | 127.5 | 304.8 | 27 | 3 | 1 | |
| Punta Gorda † | Dry2 | 40 | 124.5 | 140.3 | 16 | 3 | 1 |
| Rainy | 40 | 270.5 | 771.4 | 58 | 7 | 2 | |
| Dry1 | 256 | 196.9 | 307.8 | 28 | 6 | 3 | |
| Region | Dry2 | 256 | 210.8 | 155.7 | 17 | 4 | 2 |
| Rainy | 256 | 270.5 | 868.9 | 64 | 8 | 3 |
* Dataset starts on 01/01/1953; † Dataset starts on 01/01/1970.
Table 3.
Contributions to seasonal rainfall from days with greater than 95th percentile and 99th percentile. Rainfall amounts expressed as a percentage of seasonal rainfall.
Table 3.
Contributions to seasonal rainfall from days with greater than 95th percentile and 99th percentile. Rainfall amounts expressed as a percentage of seasonal rainfall.
| % from Days with >95th Percentile | % from Days with >99th Percentile | ||||||
|---|---|---|---|---|---|---|---|
| Stations | Season | Min | Max | Median | Min | Max | Median |
| Dry1 | 10 | 85 | 50 | 10 | 61 | 24 | |
| Arcadia | Dry2 | 20 | 88 | 60 | 16 | 72 | 42 |
| Rainy | 11 | 70 | 57 | 7 | 47 | 21 | |
| Dry1 | 13 | 78 | 49 | 12 | 66 | 34 | |
| Fort Myers | Dry2 | 19 | 86 | 52 | 24 | 86 | 43 |
| Rainy | 32 | 76 | 56 | 7 | 46 | 23 | |
| Dry1 | 20 | 85 | 55 | 9 | 55 | 25 | |
| Myakka River | Dry2 | 15 | 90 | 56 | 19 | 75 | 40 |
| Rainy | 20 | 76 | 54 | 8 | 44 | 26 | |
| Dry1 | 16 | 83 | 50 | 12 | 67 | 25 | |
| Naples* | Dry2 | 14 | 78 | 41 | 18 | 58 | 33 |
| Rainy | 26 | 74 | 56 | 8 | 48 | 22 | |
| Dry1 | 14 | 86 | 48 | 12 | 64 | 32 | |
| Punta Gorda † | Dry2 | 18 | 78 | 51 | 31 | 71 | 46 |
| Rainy | 28 | 78 | 56 | 7 | 55 | 20 | |
| Dry1 | 10 | 86 | 51 | 9 | 67 | 29 | |
| Region | Dry2 | 14 | 90 | 52 | 16 | 86 | 40 |
| Rainy | 11 | 78 | 56 | 7 | 55 | 23 | |
Study period: 01/01/1950–12/31/2016. * Dataset starts on 01/01/1953; † Dataset starts on 01/01/1970.
© 2018 by the author. Licensee MDPI, Basel, Switzerland. This article is an open access article distributed under the terms and conditions of the Creative Commons Attribution (CC BY) license (http://creativecommons.org/licenses/by/4.0/).
Share and Cite
MDPI and ACS Style
Gitau, M.W. Patterns in Indices of Daily and Seasonal Rainfall Extremes: Southwest Florida Gulf Coastal Zone. Climate 2018, 6, 83. https://0-doi-org.brum.beds.ac.uk/10.3390/cli6040083
AMA Style
Gitau MW. Patterns in Indices of Daily and Seasonal Rainfall Extremes: Southwest Florida Gulf Coastal Zone. Climate. 2018; 6(4):83. https://0-doi-org.brum.beds.ac.uk/10.3390/cli6040083
Chicago/Turabian StyleGitau, Margaret W. 2018. "Patterns in Indices of Daily and Seasonal Rainfall Extremes: Southwest Florida Gulf Coastal Zone" Climate 6, no. 4: 83. https://0-doi-org.brum.beds.ac.uk/10.3390/cli6040083
Note that from the first issue of 2016, this journal uses article numbers instead of page numbers. See further details here.