A Novel Multi-Risk Assessment Web-Tool for Evaluating Future Impacts of Global Change in Mountainous Areas


1
BRGM, Risk and Prevention Division, 45060 Orléans, France
2
GeoHyd, 45160 Olivet, France
*
Author to whom correspondence should be addressed.
†
LIVE (Anne Puissant), IPGS (Jean-Philippe Malet), GEODE (Thomas Houet), IRSTEA (Franck Bourrier), PRODIG (Monique Fort), France.
Climate 2018, 6(4), 92; https://0-doi-org.brum.beds.ac.uk/10.3390/cli6040092
Submission received: 6 October 2018
/
Revised: 5 November 2018
/
Accepted: 15 November 2018
/
Published: 21 November 2018
Abstract
:In our study, we present a proactive decision support tool able to compute the impacts of different possible scenarios for territories impacted by mountain risks. The objective of this work was to develop and test various hazard and risk assessment methods, and to implement them into a web-application platform able to show possible risks induced by global change on ecosystems and society. Four case studies were selected for their representativeness: One located in a Pyrenean valley, others in the French Alps. Methodology addressed several points. The first one was on the identification of the impacts of global environmental changes (climatic situations, land use, and socio-economic systems) on identified hazards. The second one was on the analysis of these impacts in terms of vulnerability (e.g., the places and the physical modifications of impacted stakes, as well as levels of perturbation). The third one was on the integration of developed methodologies in a single coherent framework in order to investigate and map indicators of vulnerability. The last one was on the development of a demonstration platform with GIS (Geographic Information System) capabilities and usable on the web. The architecture and the main features of the web-platform are detailed within several cases for which hazard and impact assessments are evaluated for not only past and present, but also future periods. This web-tool, mostly dedicated to stakeholders, has proven its usefulness to test various socio-economical pathways, because multiple scenarios, considered as probable in inhabited valleys, can be benchmarked, analyzed, and compared.
1. Introduction
For the UNISDR (United Nations International Strategy for Disaster Reduction, https://www.unisdr.org/), resilience is the ability of a system, community, or society exposed to hazards to resist, absorb, accommodate to, and recover from the effects of hazards. The resilience of societies, or community resilience, therefore refers to a society’s ability to be prepared for shocks and crises, as well as its ability to overcome them. For example, in societies living with earthquakes, communities have gradually adapted themselves by adopting specific construction standards limiting the damages induced by seismic hazards; in this sense, they have improved their resilience. This ability is mainly determined by the capacity for the social system to organize itself, to learn from past disasters in order to better protect populations and properties in the future [1,2]. These capacities are at the basis of disaster risk reduction strategies, defining in that way the resilience that applies to these socio-ecosystems.
In the whole Earth system, mountains occupy a special place. Their extension in the vertical dimension leads to drastic climatic variations with altitude, for example, temperatures and snow. This feature also generates a large variability in soils characteristics, vegetation species, or land use when going from the high altitude glaciers to the foothills, leading to the development of different socio-economic activities (tourism, forestry and pastoralism, hydro-electricity, and ecosystem resources). The changes in these activities, occurred in the two last centuries, have also modified mountainous landscapes when entering into the “modern era” [3]. Due to climate changes, many mountain areas are now threatened by multiple natural hazards (slides, debris flows, rockfalls, and floods).
Natural hazards are usually examined and managed separately. Only few studies show multiple threats analyzes where the overall hazards and/or risks are assessed jointly, e.g., Reference [4]. When considering such joint analyses, numerous challenges and difficulties arise [5], since multi-risks approaches need to model mountain hazards and exposure of elements in an integrated way while being compliant with observations [6]. The physical processes, mainly governed by hydro-meteorological triggers, increase the pressure on social or natural systems, producing important modifications on the environment. To cope with this situation, short-term proactive adaptation plans are needed [7,8,9]. The Thematic Strategy on Soil Protection of the European Commission [10] and the relative draft Directive–Frame on soil protection [11] consider the risks due to hydro-meteorological hazards as one of the main threats to consider. This is particularly true in mountainous areas where adaptation policies reinforcing risk assessment and risk reduction are proposed.
However, these risk reduction strategies must be elaborated within an approach based on the adaptation of the physical environment on the one hand, and the reduction of economic and social impacts on the other hand. For carrying out each of these two measures, additional research is needed, particularly to understand:
- How the climate change affects mountainous hazards, e.g., slopes stability, rock falls, floods, with a special attention on the different spatial and temporal scales involved in the physical processes;
- How the related risks should evolve with time; actually, early warning systems are designed to measure local climate variability, but it is still complex to identify reliable indicators for assessing risks evolutions on the long terms;
- How the main economic, social, and political stakeholders should interact to propose pertinent adaptation plans and to ensure better communication and appropriateness of strategies for disaster risk reduction.
To address such issues, technical specialists covering physical, social, and economic aspects of the problem, having experiences of mountainous environments and being familiar with perspectives of development of these territories at a different scale must be solicited [12]. Previous works demonstrated the pertinence of mixing these approaches together to advance sharing knowledge, adapting the governance, and reducing natural risks and their related impacts [13,14,15]. The model proposed in our work was specifically design to take into account the particularities of mountainous areas and to implement these multidisciplinary issues. The objective of this work, implemented in the French national project SAMCO (Society Adaptation for coping with Mountain risks in a global change COntext), was to identify key factors (e.g., exposure scenarios, hazard levels, and impacts on stakes at risks) to identify risk management strategies adapted to reduce the possible impacts of global changes, until the 2100 horizon (Figure 1). To fulfill this goal, we proposed a methodological framework able to bring together different scientists working on environmental and social sciences for developing necessary tools able to assess risks in mountainous areas, for the present, but also for future periods. In our approach, all time-varying parameters related to exposure and forcing factors—such as land use and climate evolutions—refer to different scenarios designed by end-users according to their vision of the best socio-economical pathways of their territory. For climate data, we used the IPCC (Intergovernmental Panel on Climate Change) scenarios as input parameters of our hazard assessment models. For social and economic scenarios, different methodological approaches exist to evaluate the possible pathways [16]: Some of them refers to the prospective approach developed by Reference [17] that combine scenario and participative approaches [18], others refers to the companion modelling approach developed and summarized by Reference [19], and the last ones refers to Land Use and Cover Change (LUCC) modelling [20] that combines physical models and scenarios. LUCC modelling was particularly well suited in our cases to design land use/land cover maps, and their evolution. This job was done under the control of stakeholders that participated to the project’s workshops. More static data, like DEM, geology was considered as constant in time. The hazards, vulnerability, and risks layers were then computed and evaluated in terms of impacts on a given place, depending on the scenarios selected.
The final deliverable of the SAMCO project was to design and disseminate the results through a web-platform. As presented in the following, we developed this platform thanks to a web-architecture based on Geographical Information Systems (GIS) and communication technologies, which are able to manage multi-geohazard/risk impact maps referring to the different socio-economical pathways. This web-tool offers to the deciders the possibility to choose between the best strategies improving the resilience of the territory for which they are responsible.
2. Methodology, Design and Implementation of the SAMCO Web-Platform
Many decision support systems and web-based simulation tools are presented in the literature thanks to past research projects. For instance, The SimCLIM platform [21] is dedicated to assess impacts induced by climate change according to different gas emission models. Through this platform, scenarios can be designed at global scale, but they are very restricted in terms of impacts since the variables taken into account are only linked to temperatures and rainfalls. Consequently, the influence of land use, vegetation and geological contexts to evaluate slopes stability are not considered. Forest management is addressed in References [22,23], which provides a structured management process to analyze the challenges and opportunities of managing forests in the face of climate change. An interesting point of these studies concerns how decision makers use their knowledge about climate change scenarios to choose among adaptation options, which is also one of SAMCO’ objectives. From a general point of view, and according to Reference [24], our approach was based on the concept of adaptive management that relies on learning capacities offered to stakeholders, e.g., the capacity to draw the future of their territories, once credible scenarios are designed. To do so, interactive web-tools constitutes a modern and attractive solution. Inspired by above-cited studies, we adapted these approaches on mountainous areas, particularly in integrating and developing impact models dealing with slope stability, rockfalls, and flash floods.
2.1. General Methodology
Following these considerations, the SAMCO platform was designed to map impact key factors identified from selected scenarios and then formalized on the computed risks maps (Figure 2). Thanks to the methodology given by Reference [25], we compute these maps according to climatic conditions, land use/land cover, and demography changes, from regional to local scale and over several periods: Past (1950) and present (2010) times, near future (~2040) and future (~2100). These factors reflect the physical and socio-economic changes in terms of hazard intensity, impacts on buildings, transports, etc. As shown in Table 1, we worked over four test sites, located in the French Pyrenees (Cauterets) and Alps (Ubaye, Queyras and Vars). We considered three different hazards, namely, landslides, rockfalls, and floods. The socio-economic pathways taken into account were “green actions”, “tourism”, “agroenergy”, and “abandonment”, while we referred to two GIEC scenarios: RCP4.5 and RCP8.5. These exposure and forcing factors were chosen because they offer a significant contrast in the resulting maps, which facilitate the stakeholder’s appropriateness and the results analysis. These points are detailed in the following.
The test sites were selected for their interest in terms of risk, Pyrénées and Alps being affected by different land use and climatic contexts. The Cauterets site (1 by 1 km) is located in a forest valley composed of metamorphic and weathered rocks and affected by landslides whose size varies from a few-to-ten thousand cubic meters. The geological context of Ubaye (10 by 10 km) presents callovo-oxfordian sedimentary rocks covered by morainic deposits. These geological conditions produce a “badlands” landscape with a large number of small landslides scattered over the valley’s slopes. In Queyras and Vars (5 by 5 km), the Guil torrent produces debris flows and flash floods due to the complexity of the geology (Dolomitic limestones, lustrous schists, and crystalline rocks) and the fracturing of rocks. The resolution of spatial models was adapted to the size of each site and varied from 1 to 10 m.
The landuse/landcover scenarios: The assessment of future land use/land cover was adapted from Reference [26]. It is addressed through the construction of four prospective socio-economic scenarios up to horizons 2040 and 2100, which are then spatially modeled according to (1) land use and cover changes (LUCC) maps co-constructed with stakeholders. These stakeholders were selected among municipalities, local authorities, consulting companies, and researchers working in the studied areas and interested enough to attend several workshops, as detailed in Reference [26]; (2) fine-scale socio-economic scenarios based on existing national or regional sectorial plans; and (3) the development of a spatially explicit vegetation evolution in mountains areas. Thus far, the type of vegetation constitutes a pertinent input data for computing the hazard models since it controls a part of the slopes’ stability; it also permits to quantify the evolution of hazards according to evolution of land use changes. The four scenarios are defined as follow:
- Green actions: Environmental awareness modifies lifestyles and practices so that green energy, ecology, local agriculture are developing in Europe. Grazing areas continues and wood production increases. Territory becomes a multifunctional area giving a pleasant environment to the population. Grasslands decrease and forest expands a lot with a high reforestation trends. In 2100, 50% of the valley is covered by dense forest;
- Tourism: In some mountain areas where beautiful landscapes are sought, the valorization of outdoor touristic activities are in development and benefit from public supports. Some areas are reopened in order to prevent landscapes from closing. Elsewhere, grassland turns into scrublands or forests. Dense forests increase by 5.2 ha/year;
- Agroenergy: The regions become more and more autonomous preserving national agriculture from international competition. European supports boost the development of pastoralism and green energy, leading to a decreasing of forest areas. Tourism decreases due to a lack of investments;
- Abandonment: Due to the economic competition in Europe and the decreasing of the European financial support for agriculture, importations increase, and local products decline as well as farming activities. Dense forests replace grasslands leading to an occupation rate for forest of around 40% in 2010 and 50% in 2100.
Climate change scenarios: The climate change inputs correspond to two scenarios of emission of greenhouse gases. The simulations were performed with the Green House Gas (GHG) emissions scenarios; RCP (Representative Concentration Pathways) are greenhouse gas concentration trajectories adopted by References [7,8,9]; in this study, we have considered the scenarios RCP 4.5 and RCP 8.5. RCP 4.5 is a scenario that stabilizes radiative forcing at 4.5 W/m2 in the year 2100, with emissions peak around 2040, whereas in RCP 8.5, emissions continue to rise throughout the 21st century. The simulations, available on the portal DRIAS (http://www.drias-climat.fr), were performed with the ALADIN-Climate model of Météo-France. These data were then used to analyze the impact of the climate into the hazards intensity, as described below.
Modeling hazards: The previous exposure (land use/land cover) and triggering (climatic) factors are then introduced within the considered hazard models. For the landslide hazard analysis, ALICE (Assessment of Landslides Induced by Climatic Events) has been used [27,28]. The mechanical model is based on a 2D slope stability analysis, for which the main physical characteristics of the soils and surfaces are quantified. These parameters are integrated in a mathematical equation to calculate a safety factor (SF) for each pixel of the different places covering the whole area [29]. The model also considers the landslide type (rotational or translational) and its dimensions (length and depth). The effect of the vegetation is integrated in the model in two ways: (i) With an additional apparent cohesion of the soil due to root reinforcement of the resistance to shear and (ii) with additional weights on the slices. These modifications affect mostly shallow landslides. The effect of climatic evolution is analyzed with considering the evolution of the daily water table level variations, computed according to the daily meteorological parameters. In this way, it is possible to obtain the distribution of the water table level between a low and a high piezometric level, which might have an influence on the slopes’ stability.
The physical model used for rockfall hazard analysis is Rocky for 3D [30,31,32]. This model simulates the rockfall trajectory in 3D by calculating sequences of parabolic free fall through the air and rebounds on the slope, as well as impacts against trees. Rolling is represented by a sequence of short-distance rebounds. Falling boulders are approximated by spheres, thanks to a hybrid physical/analytical approach. This feature is very useful to consider the contribution of forests for reducing the downward propagation of rocks and for evaluating the protective effect of trees against rockfall hazards. The forest input data for Rocky for 3D are files describing tree density, mean and standard deviation of diameter at breast height in delineated polygons. The percentage of coniferous trees is also a raster file. The effect of climate change is not directly considered on rockfall hazard, but species changes over time due to climate change are integrated in the analysis. However, the effect of global warming on the mechanisms leading to trigger rockfall due to the evolution of precipitation and temperature are complex and are not taken into account in our model.
Concerning floods, geomorphological, geological, and geophysical investigations were carried out to locate and estimate the sedimentary volumes stored in the Queyras catchment area. Following field and mapping works that enabled the identification and characterization of sedimentary stocks, two statistical modeling of sediment thicknesses were proposed. We first estimated the roof of bedrock using polynomial functions, then we analyzed 46 transverse and longitudinal topographic clusters coupled with geological and geomorphologic expertise of superficial formations and underlying layers. The sediment volumes stored in the Queyras catchment area were finally estimated between 0.13 and 0.46 × 10³ m3 [33]. This information was used to determine torrential cones that reveal flood footprints in such areas and to give an estimate of the floods hazard level.
The graphical capabilities of the platform allows the representation of several informative layers as a single map by using transparency options; this feature was used to represent several hazards or layers into a single multi-hazard map.
Modeling impacts: Once all of these hazards have been assessed, the impacts on stakes at risk need to be evaluated. Due to the complexity to solve physically this issue, we preferred to use a more heuristic approach. The potential consequences of the hazards was then analysed using a semi-quantitative region-scale indicator-based method, called the Potential Damage Index (PDI) [34]. The PDI allows estimating the possible damages related to hazards by combining weighted indicators reflecting the exposure of the element at risk for structural, functional, and socio-economic stakes. Three indicators are individually analyzed, representing two direct and one indirect consequences:
- -
- Physical injury to people consisting in any type of mechanical trauma to the body caused by hazards;
- -
- Structural and functional damage to buildings, lifelines and human activities over a relative limited time period;
- -
- Socio-economic impacts to socio-economic activities characterized by possible consequences diffuse in time and possibly far away for the damaging event;
Their sum corresponds to the total potential damage PDI to obtain a map of total consequences due to considered hazards. It has been applied to present and future periods, taking into account the four spatially-explicit scenarios related to land cover and land use evolutions previously presented.
Finally, we provided risk maps by combining both susceptibility/hazard and potential consequence maps resulting from the two previous steps. The risk maps were produced for the past, present and future times (e.g., period 1950, 2010, 2040, and 2011). The classification of hazards and risk levels (low, moderate, and high) are classically computed according to a curve plot showing the proportion of the area considered as susceptible to the proportion of landslide recognized as susceptible on the entire surface.
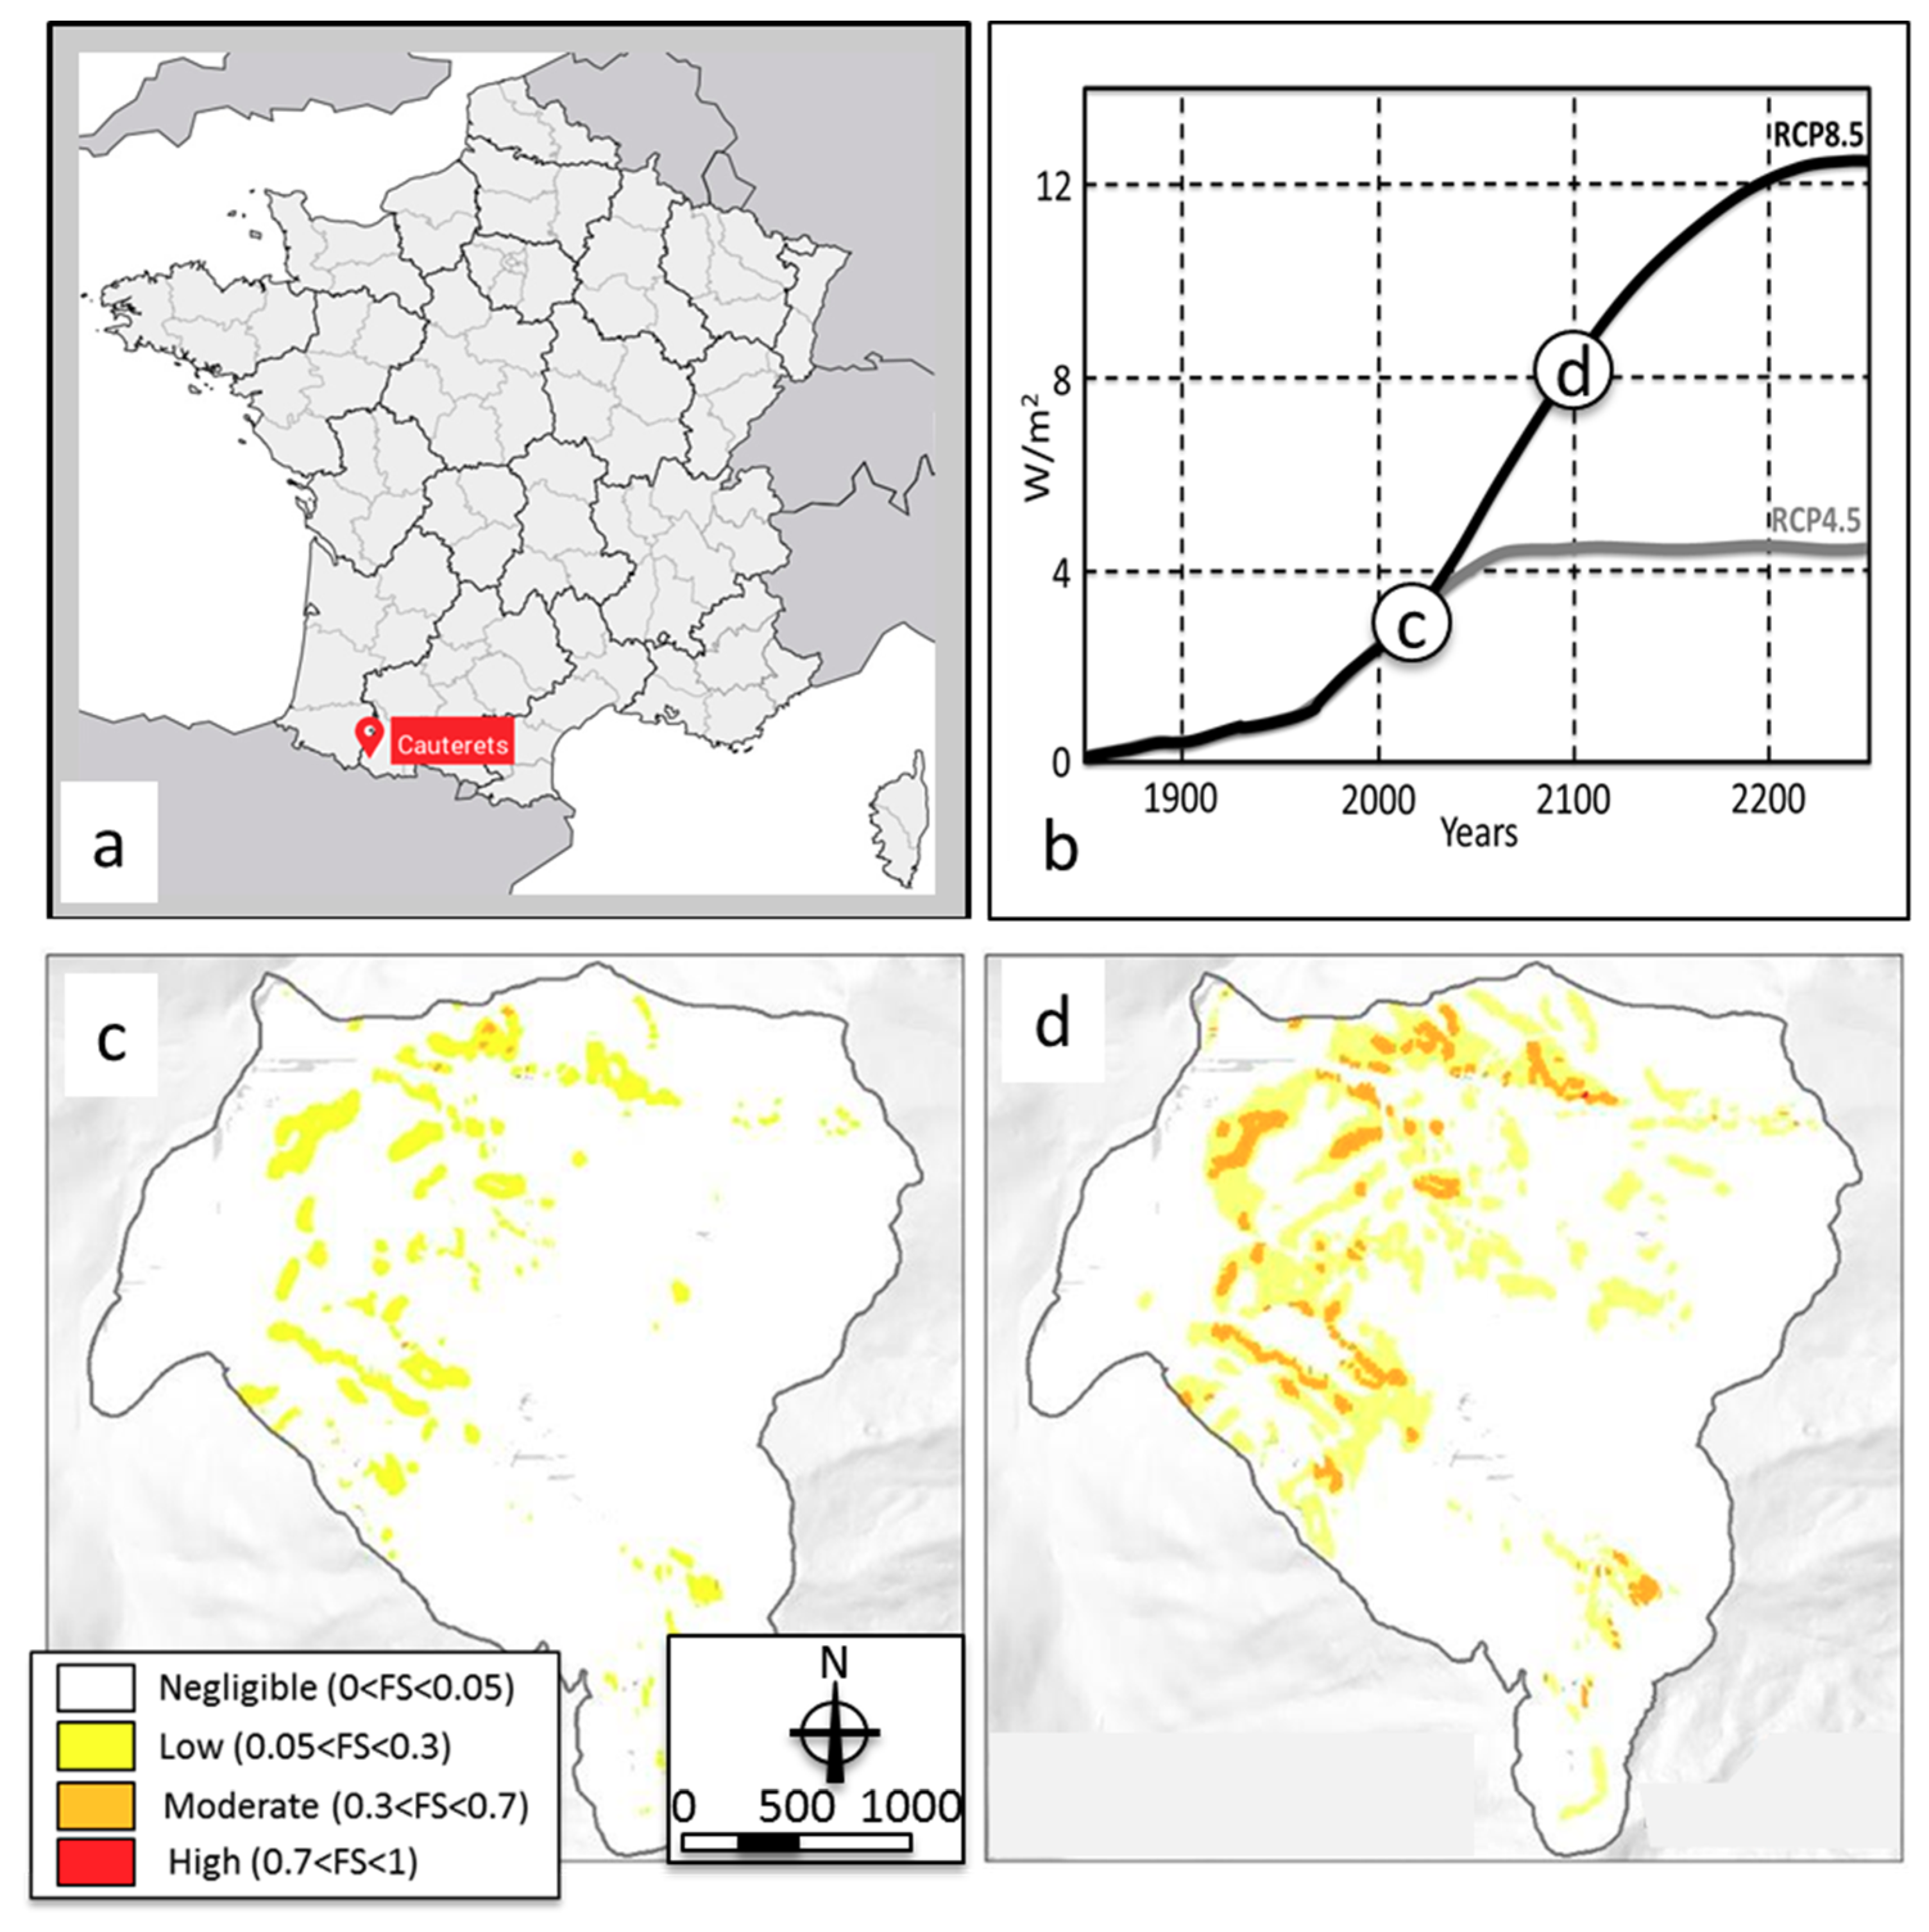
Results allow identifying the geographical areas that are likely to be exposed to risk. For example, Figure 3 shows landslide hazard maps (Figure 3c,d) over the Cauterets site (Figure 3a), for the RCP8.5 climate change scenario taken at present days and at horizon 2100 (Figure 3b). In this last case, around 30% of the area evaluated as low in terms of the probability that the safety factor is below 1, turns to moderate. These changes reveal the high contribution of climate change in the stability of slopes, mainly due to an increase of extreme rainfalls. The advantage of such maps lies in the identification of places where these changes should occur, and the possibility to manage stakes at risk for the local authorities.
2.2. Conceptual Aspects and Architecture
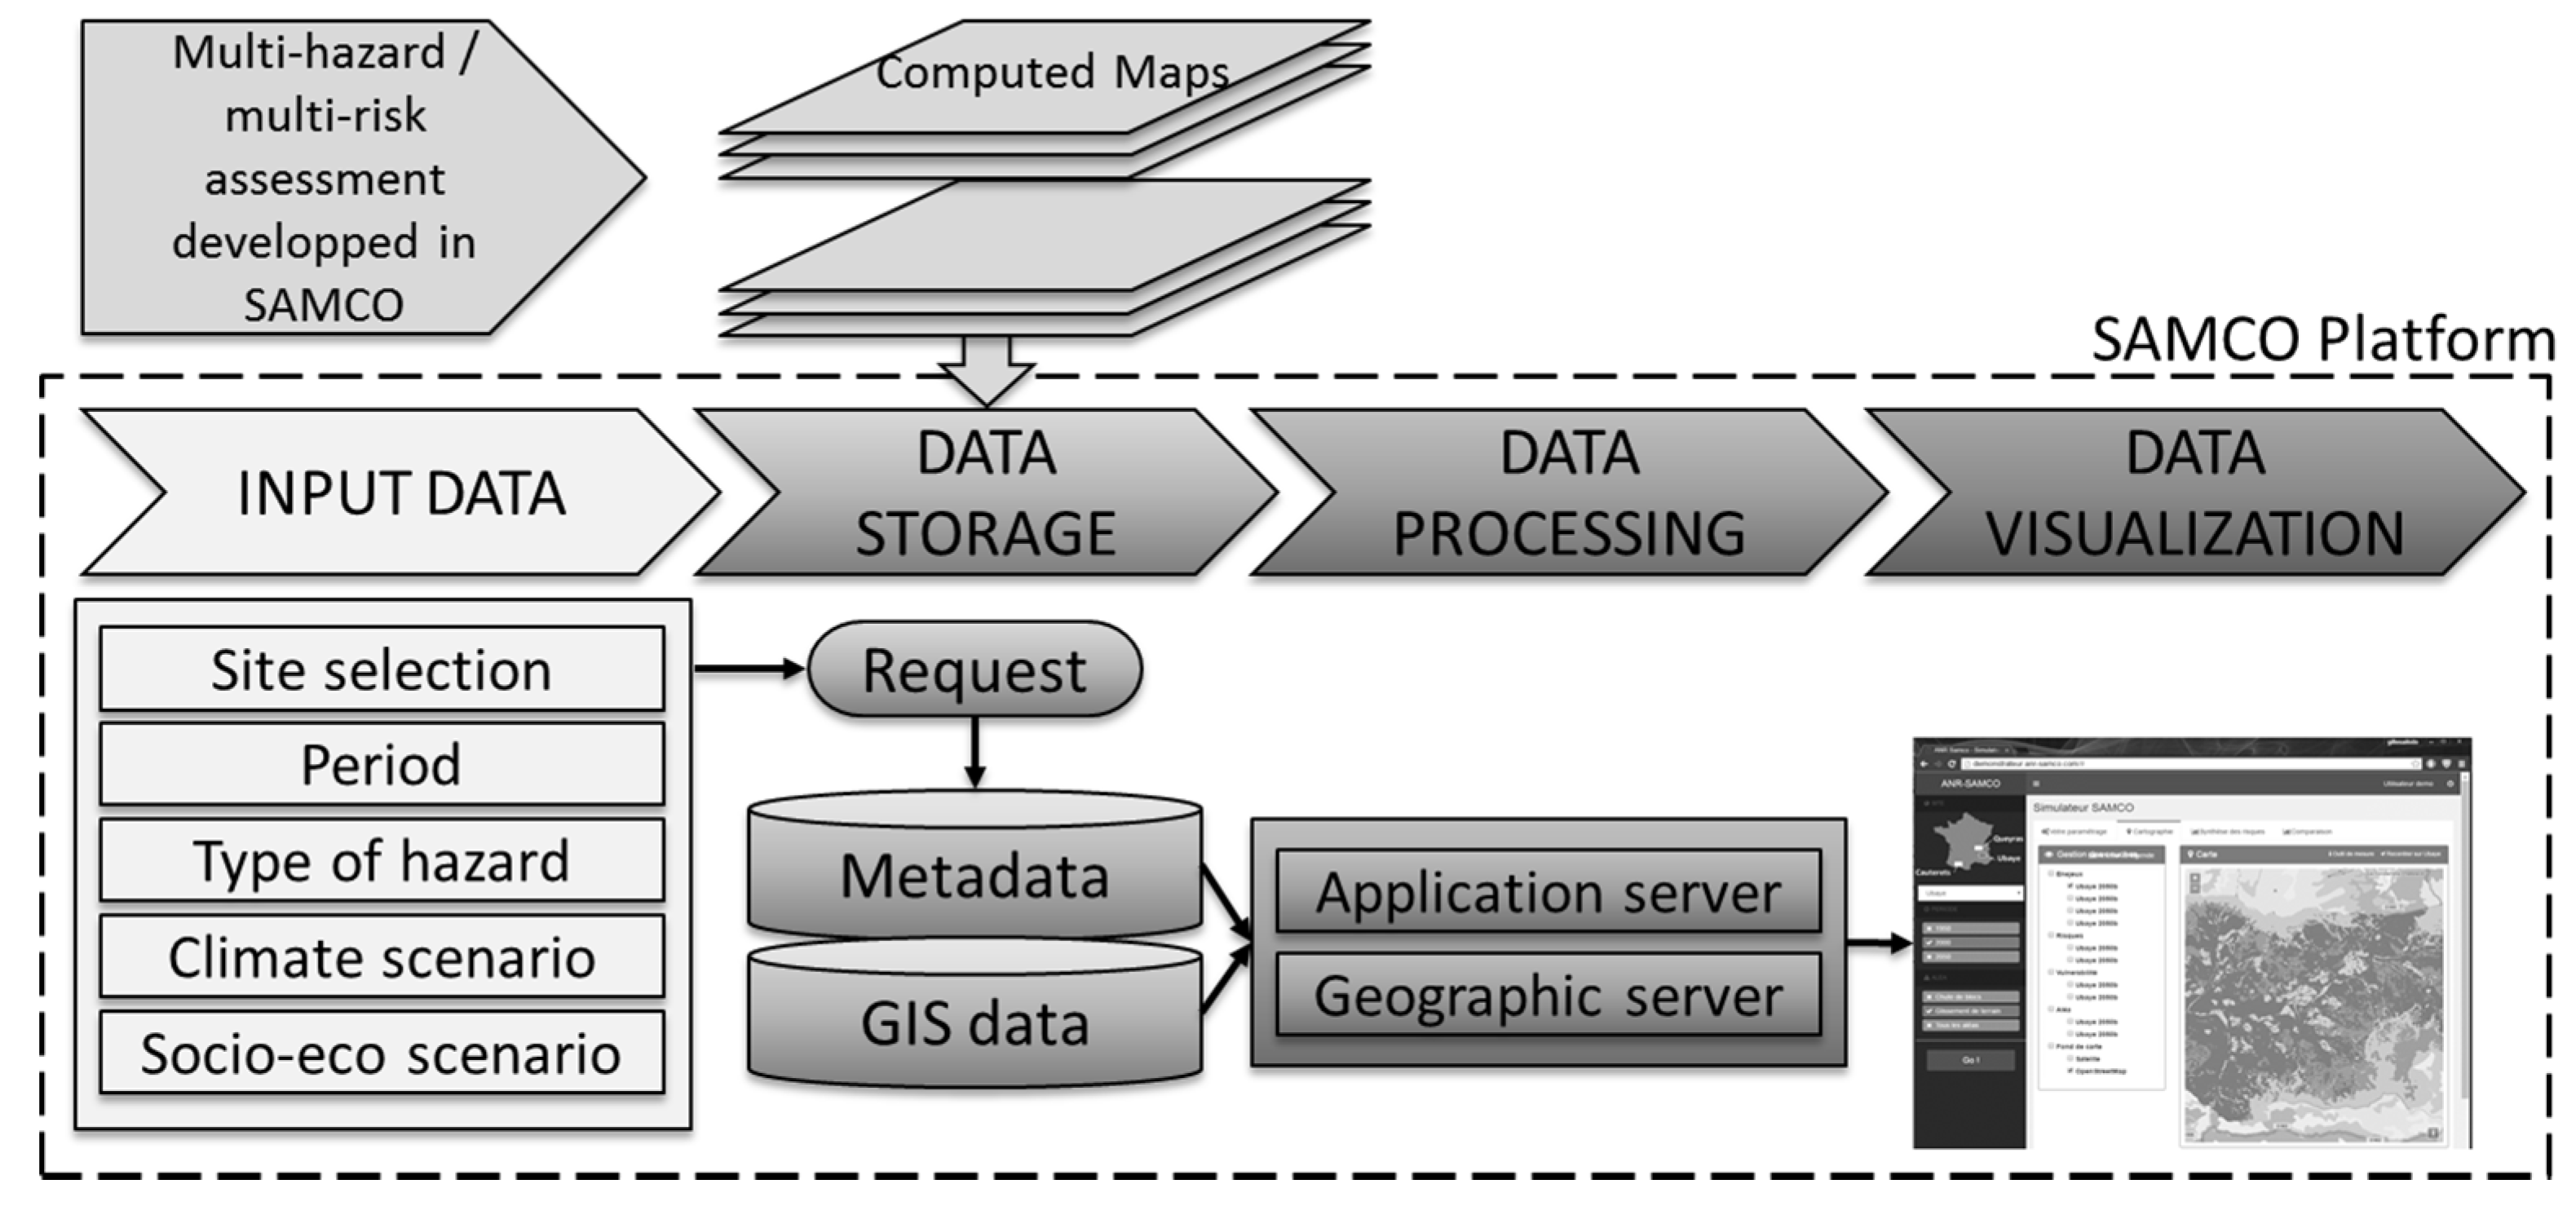
The platform developed in the SAMCO project is able to store and manage a large number of modelling results stored as different categories of maps, e.g., exposure, hazards, and potential damage indexes. All of this information has been computed during the SAMCO project by using the presented hazard/impacts modelling tools and stored in the database, so that they can be searched according to the scenarios criterions and displayed thanks to the web-mapping capability of the platform. Thanks to the web-based interface, the users have the possibility to browse, consult, and analyze these data through clean and user-friendly screens. This platform has been designed from a set of open-source components dedicated to data storage, filtering, browsing, visualizing, and analyzing, as shown in Figure 4. In this architecture, the input data selected by the user correspond to a given scenario for which modelling results have been computed. Results can therefore be visualized as hazard or risk maps. Each scenario constitutes a collection of maps called “simulation” in the database. From a data management point of view, a simulation is described by (i) CSV files that describe the simulation characteristics and (ii) GIS files, composed by vectors and raster layers, which are used to draw the computed map.
All these elements are stored and managed into a PostgreSQL (https://www.postgresql.org/) database. This open-source Relational Database Management System (RDBMS) is one of the most popular solutions available on the market, and is used and maintained by a wide community of data managers. In addition, this RDBMS can manage geographical data thanks to its PostGIS (http://postgis.net/) addon. This capability is a crucial point for the SAMCO platform that has to manage geo-localized rasters.
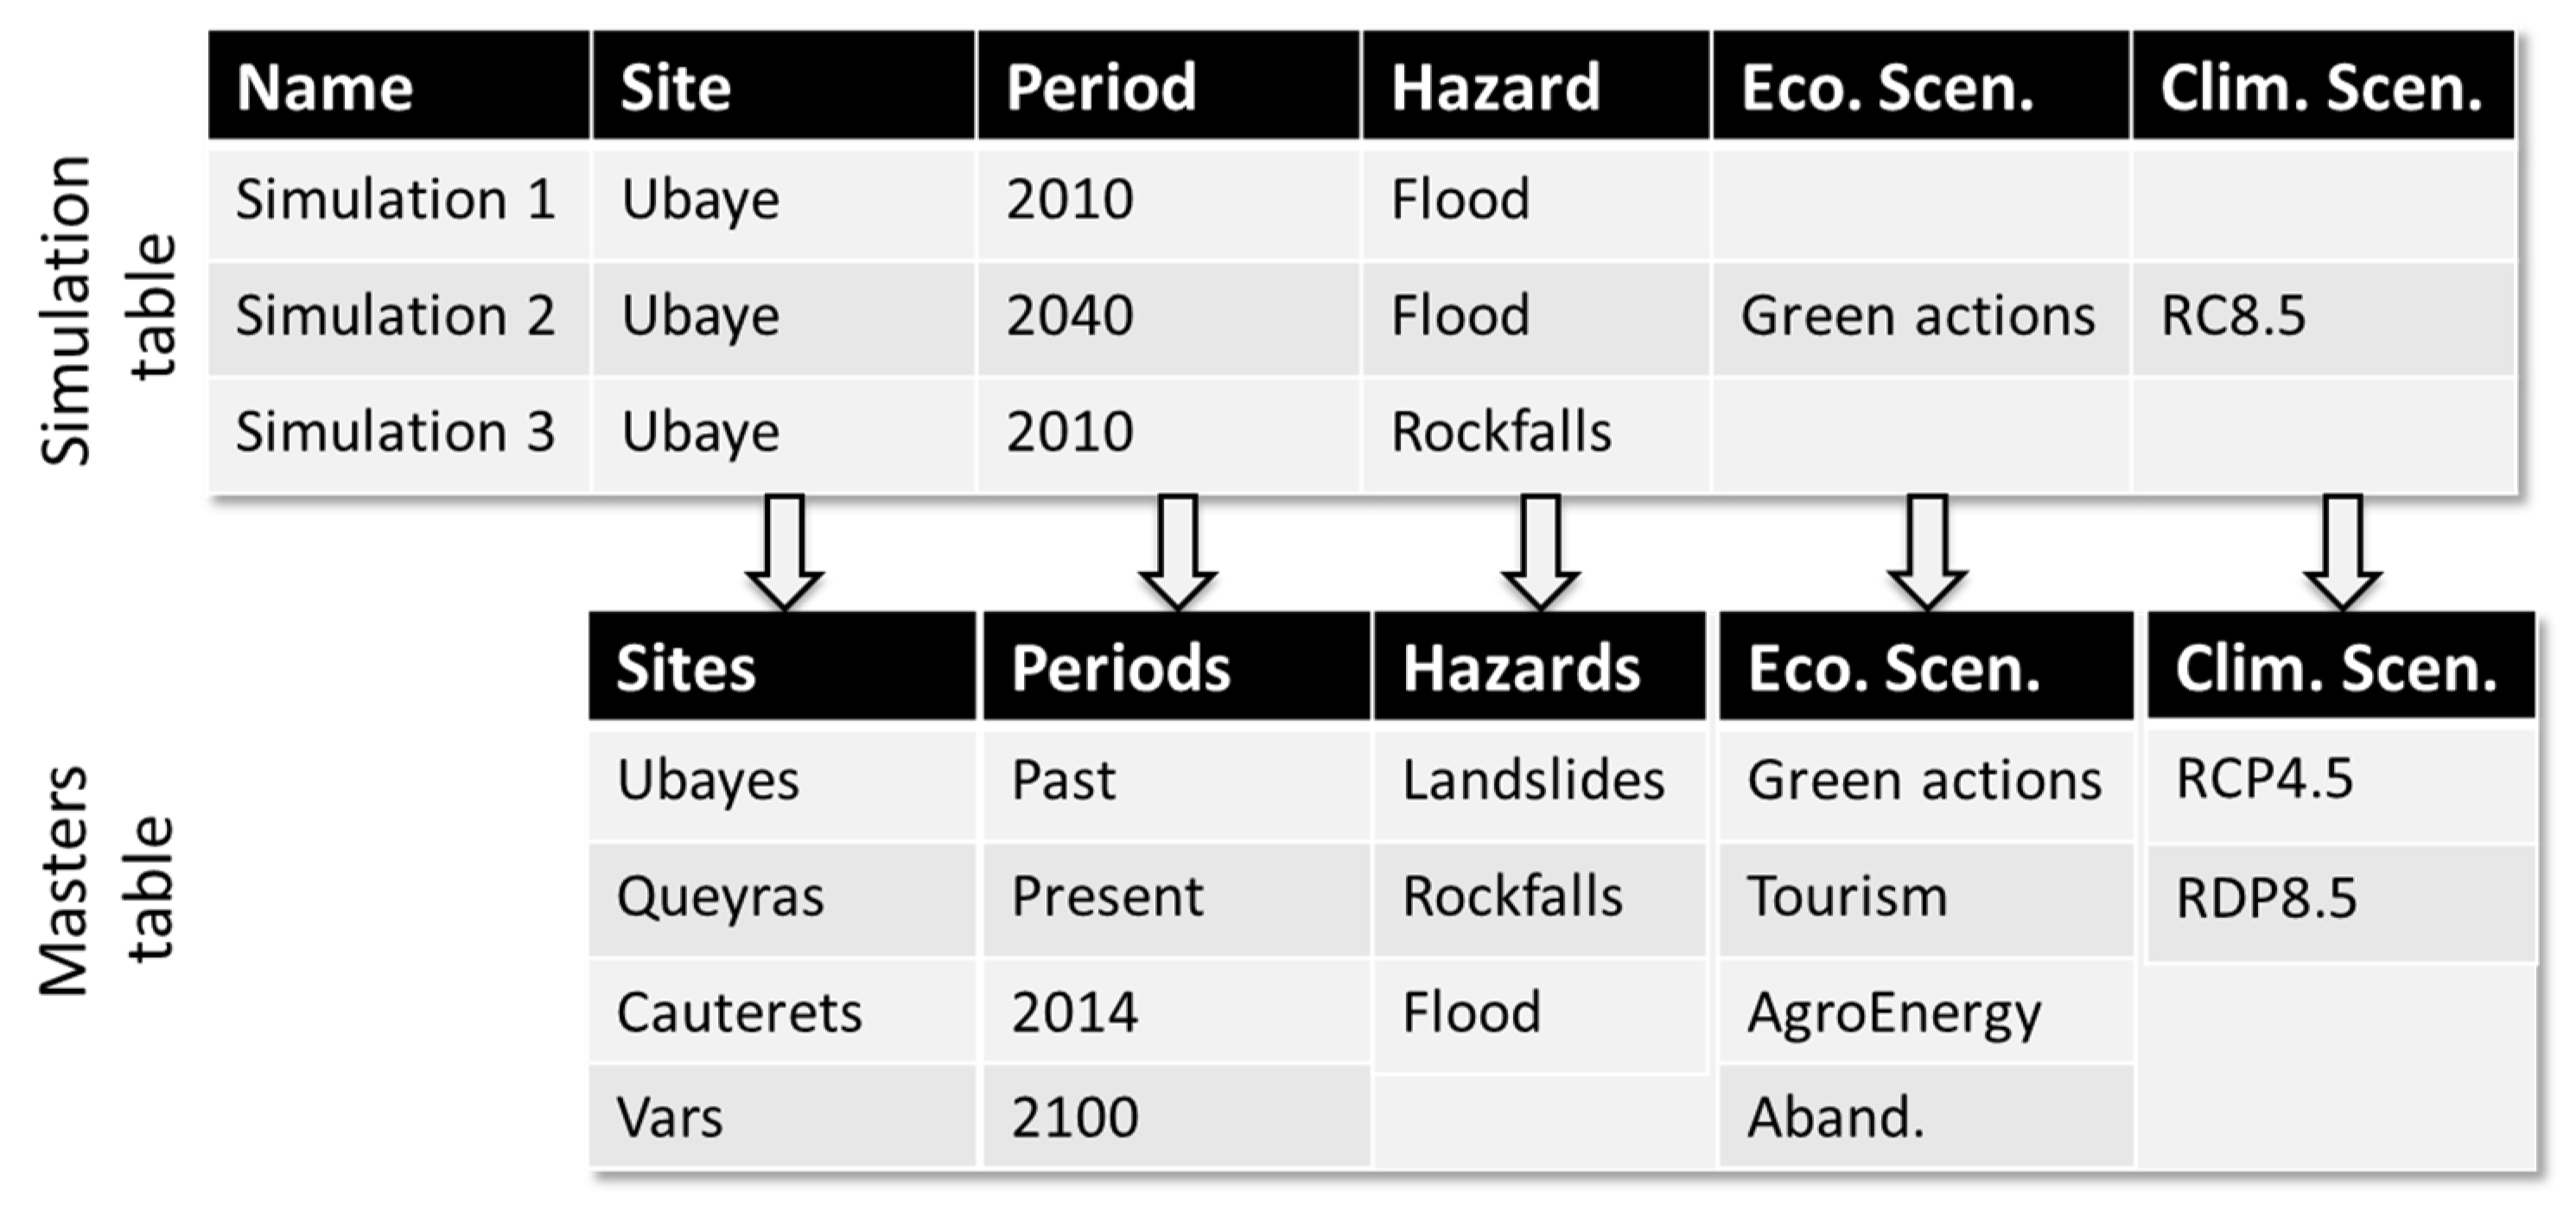
Data are stored according a specific structure dedicated to manage simulations, flexible enough to welcome a large number of test-sites studied within the project (Figure 4). This structure is used to hold a set of records, i.e., the features of a simulation: The spatial extent of the site, the selected period, as well as the hazard maps and climate/socio-economic scenarios considered during the modeling phase. A simulation record is linked to a set of master data tables storing common repository values. Each record is referenced in a secondary table, linked to a collection of master data tables describing the possible values that simulation’s features can take (list of the sites, list of periods, list of hazards, etc.). A record is also connected to repository of GIS layers. With such architecture, simulations cannot share the same set of layers, and avoid any conflict in the simulation management. The tables only store metadata needed to use GIS web services, mostly links to external/internal databases, for example, GIS data stored into the PostGIS area. The filter function the interface provides is based on the information stored in the simulation table, which ensure that all user requests are completely controlled. As an example, shown in Figure 5, in the case of the site “Ubaye”, the possibility for the user to choose a period is restricted to “2040” or “2010” since no simulation is available for the period “1950” or “2100” on that specific site.
2.3. The Web Approach
Finally, the platform is hosted by a web-server offering PHP solutions. Application servers like Apache (https://httpd.apache.org/) or Nginx (https://www.nginx.com/) were benchmarked successfully. On one hand, Apache is a Web server component of the very popular LAMP stack (Linux, Apache, MySQL, PHP) which is quite attractive. On the other hand, Nginx is designed to handle a large number of simultaneous connections. Depending on the number of foreseen users, Apache or Nginx can be used. Their advantages are to be open-source and to be compatible with Windows and Linux operating systems.
To exploit the layers stored in the PostGIS area of the database, a geographic server needs to be activated to generate GIS web services. Our choice fell on GeoServer (http://geoserver.org/), an open source server written in Java that allows users to share and modify geographic data. Designed for interoperability, it publishes data from all major sources of spatial data using open standards. Vector and raster data is thus delivered through WFS (http://www.opengeospatial.org/standards/wfs) and WMS (http://www.opengeospatial.org/standards/wms) services, respectively. For the moment, the GeoServer only provides simulation data computed in the framework of the SAMCO project. Additional GIS layers, i.e., topographic map, road maps, etc, is queried from external servers.
At the end of the chain, the platform implement visualization functionalities. Again, these services are carried out thanks to a PHP code developed by the mean of open source components. We used Laravel (https://laravel.com/ https://github.com/laravel/laravel) for the coding, an open-source web framework written in PHP respecting the model-view-controller principle and fully developed in object-oriented programming. The Bootstrap (http://getbootstrap.com/) framework and the JQuery (https://jquery.com/ https://github.com/jquery/jquery) library take in charge the HTML5 contents and the graphic interface client respectively. Finally, OpenLayers3 (http://openlayers.org/, https://github.com/openlayers/ol3) JavaScript library help in developing the web mapping tools. As a consequence, all these options make the application very responsive and easy to use for stakeholders.
3. Running the SAMCO Web-Platform
The methodological approach was initially developed for elaborating hazard and risk maps for the scenarios set up by the stakeholders. The platform was designed to test these different scenarios and to see the consequence of land use/land cover, socio-economic, and climate changes on the intensity of related impacts. The flexibility of the web application implementing the platform allows the selection of scenarios in terms of input parameters referring to the simulations, i.e., site location, considered hazard, period, etc., as shown in Table 2. Due to a lack of data, some simulations were not computed. It is the case for the sites, Queyras and Vars, where landslides impacts were not assessed. However, thanks to the flexibility of the system, only available simulations are taken into account, so that the user can select the scenario input parameters only for maps existing in the database (Figure 5).
The SAMCO web-application runs online within a cross-platform web-browser. After login, the user can select the different input options: The location of the site to study, the time period, the considered hazard, and the socio-economic and climate scenarios. A series of information are then presented in the main window, divided in four tabs: The first tab summarizes the scenario’s parameters, the second and the third show the computed hazard and risk maps, respectively, and the last one presents comparisons between two hazard or risk maps coming from two different scenarios.
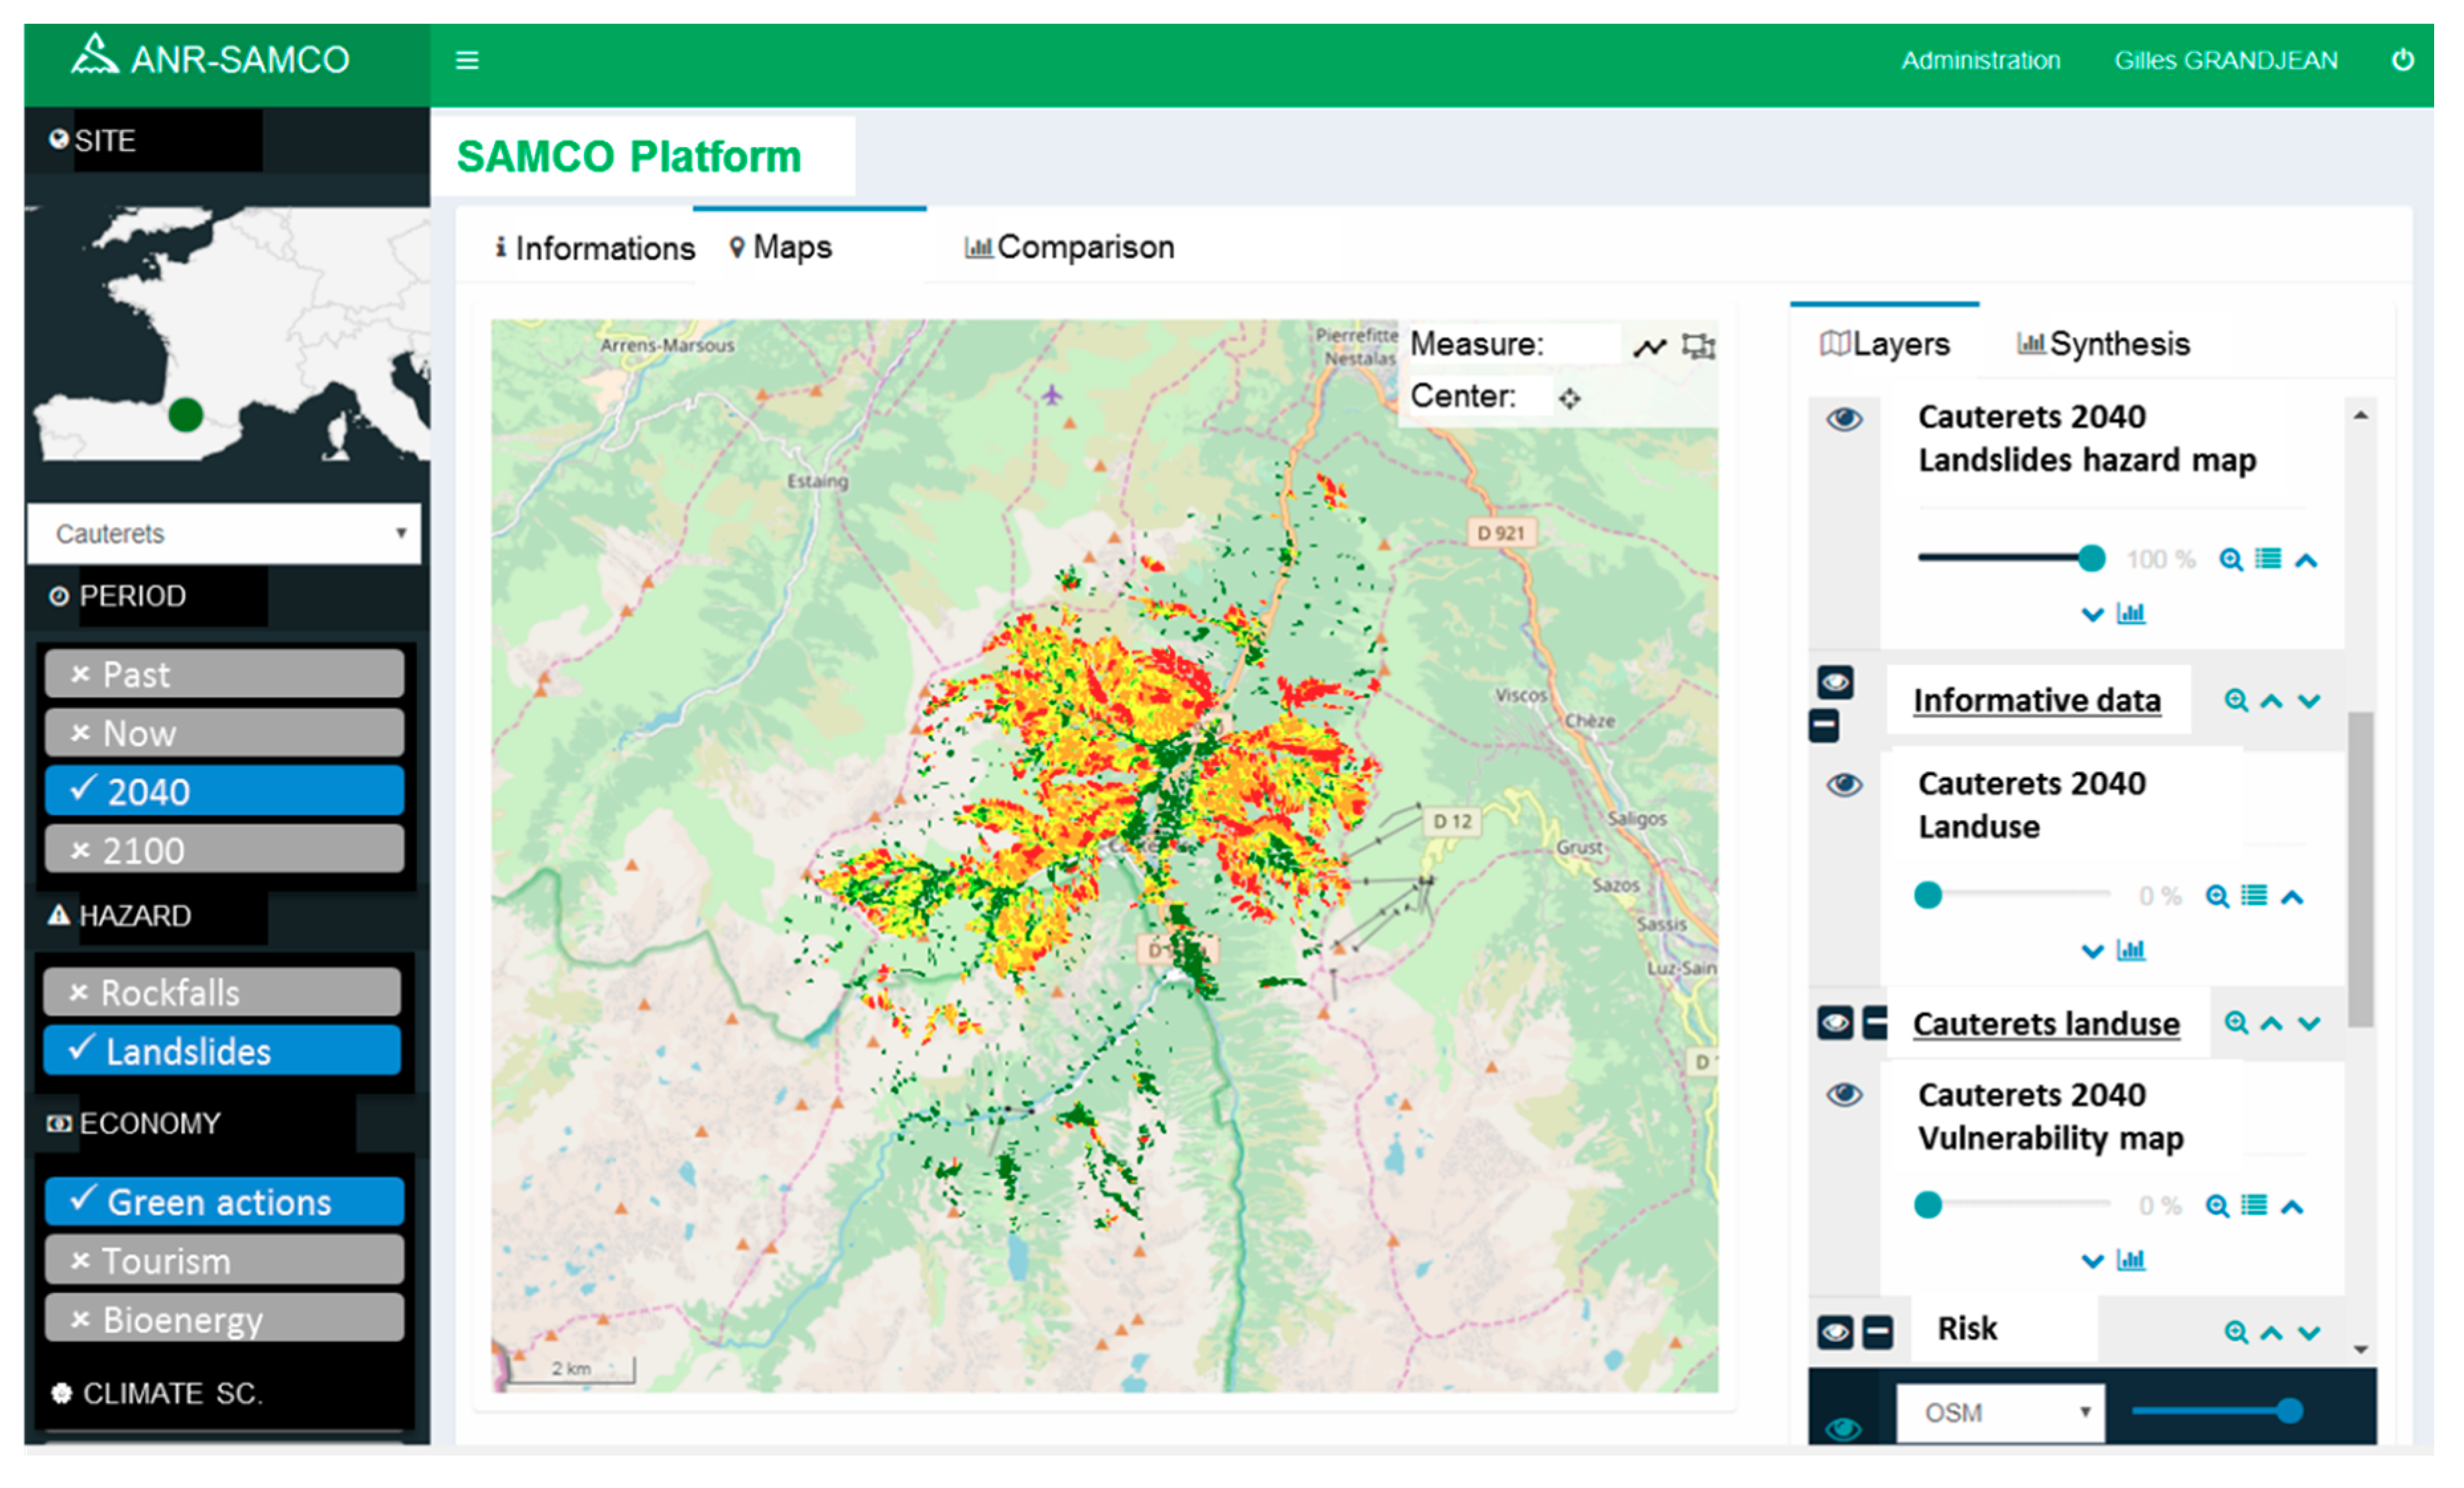
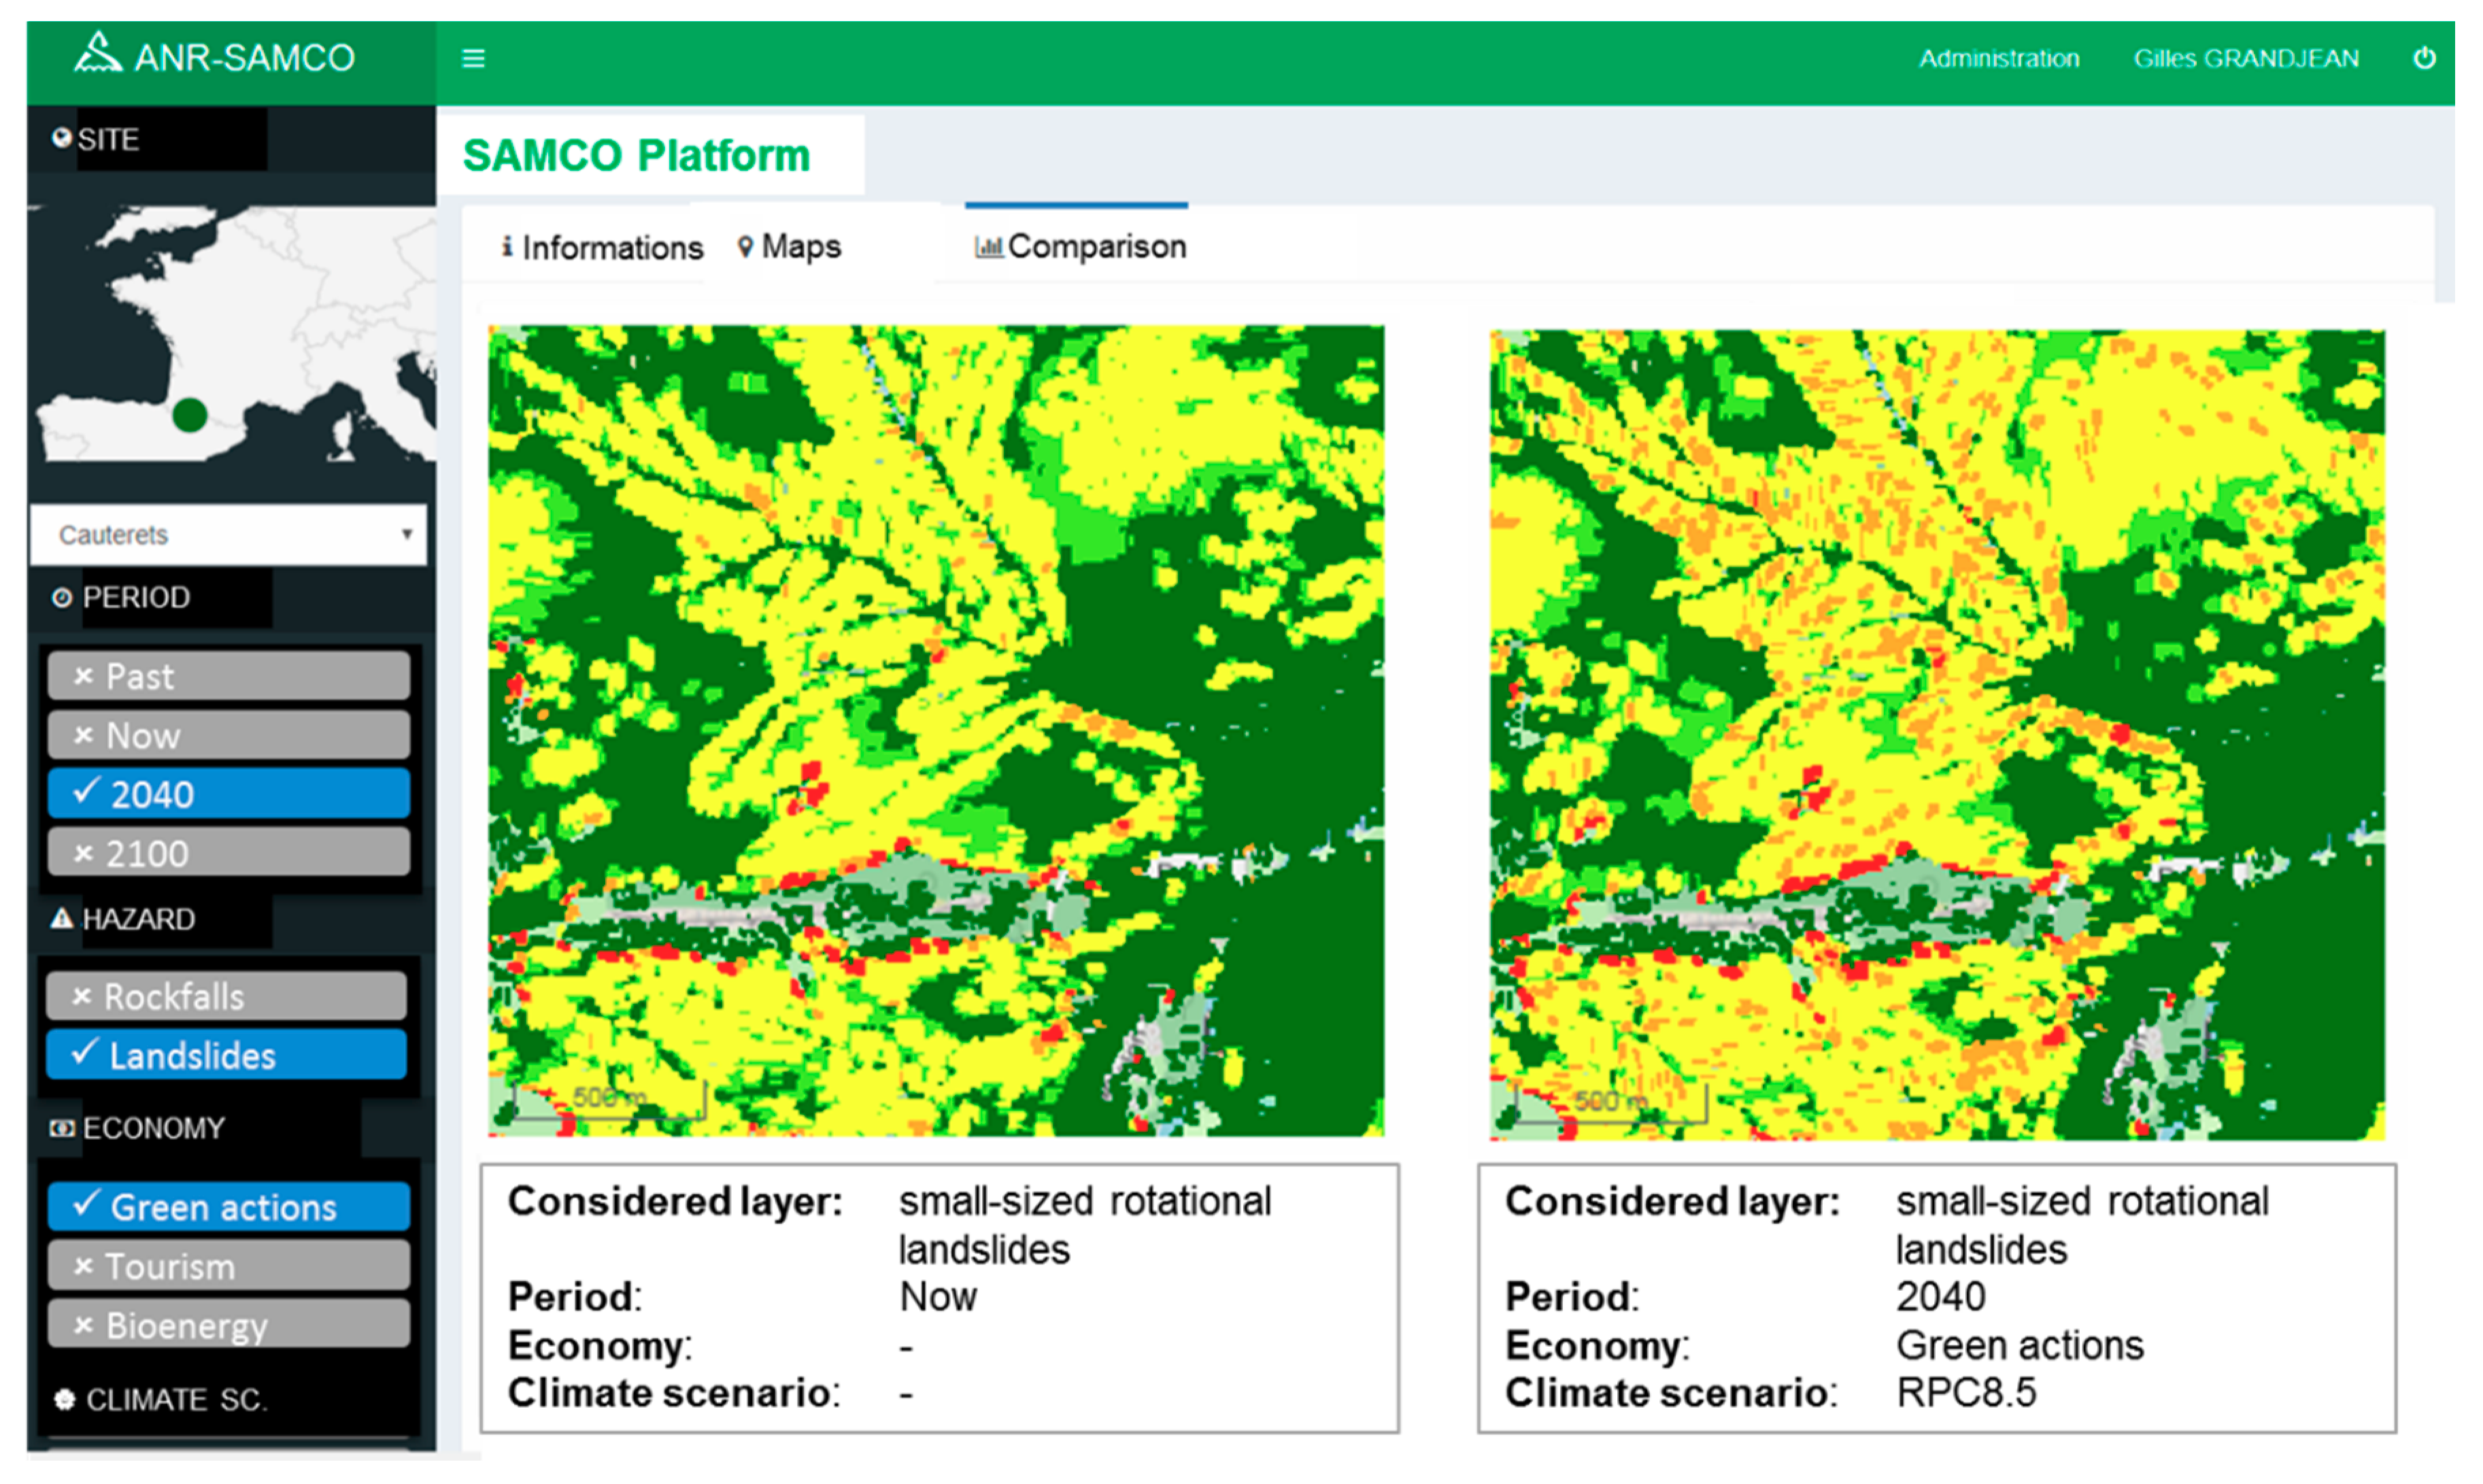
In Figure 6, the user can see a landslide hazard map for the Cauterets site, the period 2040, the scenarios corresponding to “green actions” and to RCP4.5 for what concern the socio-economic and climate evolution, respectively. Figure 7 shows the landslide hazard map of the Cauterets site corresponding to the same socio-economic scenario and a climatic evolution RCP8.5 for the present and the 2040 period. As shown, the modifications in time—between 2010 and 2040—of the land use and the rainfalls intensity/frequency induce an increase of the probability of failure: From 0.05 to 0.3. These results can be explained by an increase of the water content in the soils (or an increase of water-tables level) leading to lower safety factor in several areas of the studied sites, and so higher landslides occurrence. These changes appear particularly on slopes where topography is important and geological conditions favorable to sliding. In the same time, the presence of the forest decreases the probability of sliding events due to the local stability effects of trees’ roots. This is particularly true for shallow landslides and less for deeper ones where sliding surfaces are much more deep that trees’ root. Generally, the stability increases where the forest is developing and where water tables are deeper than the sliding surfaces.
The flexibility of the platform is therefore interesting to test various development strategies of a territory, depending on they favor (or not) the development of forests, they produce new stakes at risks or induce a better water management by hydraulic works. Resulting impacts can therefore be observed immediately as well as their evolution in time.
During the different project’s workshops, the stakeholders were asked to use the platform to test possible scenarios that could occur on their territories. From the feedbacks we got from them we checked the scenarios’ reliability and discussed on the hazards’ impacts. From a general point of view, the platform was positively welcome and discussions about the impacts highlight important points demonstrating its usefulness for constructing a better and more resilient future for the considered valleys.
4. Conclusions
In the framework of the SAMCO project, a set of methodological tools was developed for assessing risk under several prospective scenarios. These scenarios provide indications on the best solutions improving the resilience of valleys coping with global changes. These tools were operated to measure the future impacts of these changes on ecosystems and societies at four representative sites located in Pyrénées and French Alps. The results were implemented in a web-application able to manage scenarios and related computed maps. The scenarios take into account climate changes (RCP4.5 and RCP8.5), but also land use and land cover changes issued from different socio-economic pathways, these ones being co-built within participative workshops involving scientists and local stakeholders. As a consequence, the proposed scenarios from which hazards evolutions are computed are particularly realistic and are in good agreement with the scientific and the stakeholders’ visions.
Based on different hazard and risk assessment models dealing with landslides, rockfalls, and floods, the platform allows also to consider their combination in a multi-hazards approach, the risk being, at the end, evaluated from the potential damage index method.
The web application was developed using different open-source components. PostgreSQL database was used to manage a table referencing the diverse simulations. GeoServer and PHP technologies provide the web capabilities that make the application able to run from different platforms, including PC, tablets, or smartphones. We had a particular attention to the graphic user interface that is very fast and easy to manipulate. Results are shown inside the main windows divided in four tabs dedicated to scenario parameters, hazards, and risk maps and comparisons between two scenarios so that the user can evaluate the impact of its choices on the intensity of hazards and risk in a specific location.
The results and the application were presented to stakeholders and different community of users during the meetings and project’s participative workshops. They were positively welcome since the contents of scenarios and the related results are compliant with real situations. However, some perspectives are already identified to put at stakeholder’s disposal a tool more oriented toward operational purposes. For the moment, the platform only shows data and results coming from complex hazard/risk assessment tools used separately, as an example, see Reference [35]. The next challenge should be, as shown by References [36,37], to numerically implement these modelling tools in the platform so that the computations could be launched on the fly. This option, not easy to implement, needs a direct access to data necessary to run each model, that is not for the moment possible everywhere.
Author Contributions
G.G. was the coordinator of the SAMCO project and worked on the conceptual aspects of the platform, S.B. contributed to computing the Cauterets maps, L.T. developed numerically the platform.
Funding
The SAMCO project was funded by the French Agency of Research (ANR), N°ANR-12-SENV-0004-01 and by the BRGM.
Acknowledgments
The authors would like to thank all collaborators that participate to this project: G.A.F., F.B., F.B., M.F., D.G., T.H., C.L., J.P.M., A.M., D.P., A.P., Y.T. and R.V., and the reviewers that contributed to improve the quality of the paper.
Conflicts of Interest
The authors declare no conflicts of interest.
References
- Klein, R.J.T.; Nicholls, R.J.; Thomalla, F. Resilience to Natural Hazard: How Useful Is This Concept? Environmental Hazards: Amsterdam, The Netherlands, 2004. [Google Scholar]
- Birkmann, J. (Ed.) Measuring Vulnerability to Natural Hazards; United Nations University Press: Tokyo, Japan, 2006. [Google Scholar]
- Huber, U.M.; Bugmann, H.K.M.; Reasoner, M.A. (Eds.) Global Change and Mountain Regions: An Overview of Current Knowledge. In Advances in Global Change Research; Springer: Berlin, Germany, 2005; Volume 23, 650p. [Google Scholar]
- Bründl, M.; Romang, H.; Bischof, N.; Rheinberger, C. The risk concept and its application in natural hazard risk management in Switzerland. Nat. Hazards Earth Syst. Sci. 2009, 9, 801–813. [Google Scholar] [CrossRef] [Green Version]
- Kappes, M.; Malet, J.-P.; Remaître, A.; Horton, P.; Jaboyedoff, M.; Bell, R. Assessment of debris flow susceptibility at medium-scale in the Barcelonnette Basin, France. Nat. Hazards Earth Syst. Sci. 2011, 11, 627–641. [Google Scholar] [CrossRef]
- Gallina, V.; Torresan, S.; Critto, A.; Sperotto, A.; Glade, T.; Marcomini, A. A review of multi-risk methodologies for natural hazards: Consequences and challenges for a climate change impact assessment. J. Environ. Manag. 2016, 168, 123–132. [Google Scholar] [CrossRef] [PubMed]
- Intergovernmental Panel on Climate Change (IPCC). Climate Change 2001: The Scientific Basis; Contribution of Working Group I to the Third Assessment Report of the Intergovernmental Panel on Climate Change; Houghton, J.T., Ding, Y., Griggs, D.J., Noguer, M., van der Linden, P.J., Dai, X., Maskell, K., Johnson, C.A., Eds.; Cambridge University Press: Cambridge, UK; New York, NY, USA, 2001; p. 881. [Google Scholar]
- Intergovernmental Panel on Climate Change (IPCC). Summary for Policymakers. In Climate Change 2007: Impacts, Adaptation and Vulnerability; Parry, M.L., Canziani, O.F., Palutikof, J.P., van der Linden, P.J., Hanson, C.E., Eds.; Cambridge University Press: Cambridge, UK, 2007. [Google Scholar]
- Intergovernmental Panel on Climate Change (IPCC); Stocker, T.F. Climate Change 2013: The Physical Science Basis; Working Group 1 (WG1) Contribution to the Intergovernmental Panel on Climate Change (IPCC) 5th Assessment Report (AR5); Cambridge University Press: Cambridge, UK, 2013. [Google Scholar]
- European Commission (EC). Thematic Strategy for Soil Protection; COM(2006)231 Final; European Commission: Brussels, Belgium, 2006; p. 12. [Google Scholar]
- European Commission (EC). Proposal for a Directive of the European Parliament and of the Council Establishing a Framework for the Protection of Soil and Amending Directive 2004/35/EC; COM(2006)232 Final; European Commission: Brussels, Belgium, 2006; p. 30. [Google Scholar]
- European Commission (EC). A Community Approach on the Prevention of Natural and Man-Made Disasters; COM(2009)82; European Commission: Brussels, Belgium, 2009; p. 9. [Google Scholar]
- Jankowski, P.; Nyerges, T. Geographic Information Systems for Group Decision Making: Towards a Participatory, Geographic Information Science; Taylor and Francis: New York, NY, USA, 2001. [Google Scholar]
- Ivanov, S.V.; Kovalchuk, S.V.; Boukhanovsky, A. Workflow-based collaborative decision support for flood management systems. Procedia Comput. Sci. 2013, 18, 2213–2222. [Google Scholar] [CrossRef]
- Aye, Z.C.; Jaboyedoff, M.; Derron, M.H.; van Westen, C.J. Prototype of a Web-based Participative Decision Support Platform in Natural Hazards and Risk Management. ISPRS Int. J. Geo-Inf. 2015, 4, 1201–1224. [Google Scholar] [CrossRef] [Green Version]
- Gourmelon, F.; Rouan, M.; Lefèvre, J.F.; Rognant, A. Role-Playing game and learning for young people about sustainable development stakes: An experiment in transferring and adapting interdisciplinary scientific knowledge. J. Artif. Soc. Soc. Simul. 2011, 14, 4. [Google Scholar] [CrossRef]
- Allen, W.J. Working together for Environmental Management: The Role of Information Sharing and Collaborative Management. Ph.D. Thesis, Massey University, Palmerston North, New Zealand, 2001. [Google Scholar]
- van Aalst, M.K.; Cannon, T.; Burton, I. Community level adaptation to climate change: The potential role of participatory community risk assessment. Glob. Environ. Chang. 2008, 18, 165–179. [Google Scholar] [CrossRef]
- Simon, C.; Etienne, M. A companion modelling approach applied to forest management planning. Environ. Model. Softw. 2010, 25, 1371–1384. [Google Scholar] [CrossRef]
- Lambin, E.-F.; Geist, H.-J. Land-Use and Land-Cover Change—Local processes and Global impacts. In Global Change—The IGBP Series; Springer: Heidelberg/Berlin, Germany, 2006; 222p. [Google Scholar]
- Warrick, R. SimCLIM: Recent Developments of an Integrated Model for Multi-scale, Risk-based Assessments of Climate Change Impacts and Adaptation, in Australia-New Zealand Society for Ecological Economics. In Proceedings of the 2007 ANZSEE Conference, Noosaville, Queensland, Australia, 3 July 2007. [Google Scholar]
- Yousefpour, R.C.; Temperli, J.B.; Jacobsen, B.J.; Thorsen, H.; Meilby, M.J.; Lexer, M.; Lindner, H.; Bugmann, J.G.; Borges, J.H.N.; Palma, D.; et al. A framework for modeling adaptive forest management and decision making under climate change. Ecol. Soc. 2017, 22, 40. [Google Scholar] [CrossRef]
- Rammer, W.; Schauflinger, C.; Vacik, H.; Palma, J.H.N.; Garcia-Gonzalo, J.; Borges, J.G.; Lexer, M.J. A web-based ToolBox approach to support adaptive forest management under climate change Scandinavian. J. For. Res. 2014, 29, 96–107. [Google Scholar]
- Fabricius, C.; Cundill, G. Learning in adaptive management: Insights from published practice. Ecol. Soc. 2014, 19, 29. [Google Scholar] [CrossRef]
- Moss, R.H.; Edmonds, J.A.; Hibbard, K.A.; Manning, M.R.; Rose, S.K.; van Vuuren, D.P.; Carter, T.R.; Emori, S.; Kainuma, M.; Kram, T.; et al. The next generation of scenarios for climate change research and assessment. Nature 2010, 463, 747–756. [Google Scholar] [CrossRef] [PubMed]
- Houet, T.; Grémont, M.; Vacquié, L.; Forget, Y.; Bourrier, F.; Peltier, A.; Puissant, A.; Bernardie, S.; Grandjean, G. Downscaling scenarios of future land use and land cover changes using a participatory approach: An application to mountain risk assessment in the Pyrenees (France). Reg. Environ. Chang. 2017, 17, 2293–2307. [Google Scholar] [CrossRef]
- Baills, A.; Vandromme, R.; Desramaut, N.; Sedan, O.; Grandjean, G. Changing patterns in climate-driven landslide hazard: An alpine test site. In Proceedings of the Second World Landslides Forum, Rome, Italy, 3–9 October 2011; p. 4. [Google Scholar]
- Bernardie, S.; Vandromme, R.; Mariotti, A.; Houet, T.; Grémont, M.; Grandjean, G.; Bouroullec, I.; Thiery, Y. Estimation of Landslides Activities Evolution Due to Land–Use and Climate Change in a Pyrenean Valley. In Proceedings of the Workshop on World Landslide Forum, WLF 2017: Advancing Culture of Living with Landslides, Ljubljana, Slovenia, 29 May–2 June 2017; pp. 859–867. [Google Scholar]
- Aleotti, P.; Chowdhury, R. Landslide Hazard Assessment: Summary Review and New Perspectives. Bull. Eng. Geol. Environ. 1999, 58, 21–44. [Google Scholar] [CrossRef]
- Dorren, L.K.A.; Berger, F.; Putters, U.S. Real size experiments and 3D simulation of rockfall on forested and non-forested slopes. Nat. Hazards Earth Syst. Sci. 2006, 6, 145–153. [Google Scholar] [CrossRef]
- Bourrier, F.; Dorren, L.K.A.; Nicot, F.; Berger, F.; Darve, F. Toward objective rockfall trajectory modelling using a stochastic rebound algorithm. Geomorphology 2009, 110, 68–79. [Google Scholar] [CrossRef]
- Dorren, L.K.A. Rockyfor3D (v5.2) Revealed—Transparent Description of the Complete 3D Rockfall Model. ecorisQ Paper. 2016. Available online: www.ecorisq.org (accessed on 19 November 2018).
- Carlier, B.; Carlier, G.; Gance, J.; Provost, F.; Lissak, C.; Graff, K.; Viel, V.; Arnaud-Fassetta, G.; Fort, M.; Betard, F.; et al. Spatial distribution and quantification of sediment storages in a “shiny schists” catchment: The Peynin catchment (Queyras, Southern French Alps). Géomorphol. Relief Process. Environ. 2018, 24, 59–76. [Google Scholar] [CrossRef]
- Puissant, I.M.; Van Den Eeckhaut, I.J.-P.; Malet, I.; Maquaire, O. Landslide consequence analysis: A region-scale indicator-based methodology. Landslides 2014, 11, 843–858. [Google Scholar] [CrossRef]
- Giuliani, G.; Peduzzi, P. The PREVIEW Global Risk Data Platform: A geoportal to serve and share global data on risk to natural hazards. Nat. Hazards Earth Syst. Sci. 2011, 11, 53–66. [Google Scholar] [CrossRef] [Green Version]
- Silva, V.; Crowley, H.; Pagani, M.; Monelli, D.; Pinho, R. Development of the Open Quake engine, the Global Earthquake Model’s open-source software for seismic risk assessment. Nat. Hazards 2014, 72, 1409–1427. [Google Scholar] [CrossRef]
- Chen, H.X.; Zhang, S.; Peng, M.; Zhang, L.M. A physically-based multi-hazard risk assessment platform for regional rainfall-induced slope failures and debris flows. Eng. Geol. 2016, 203, 15–29. [Google Scholar] [CrossRef]
Figure 1.
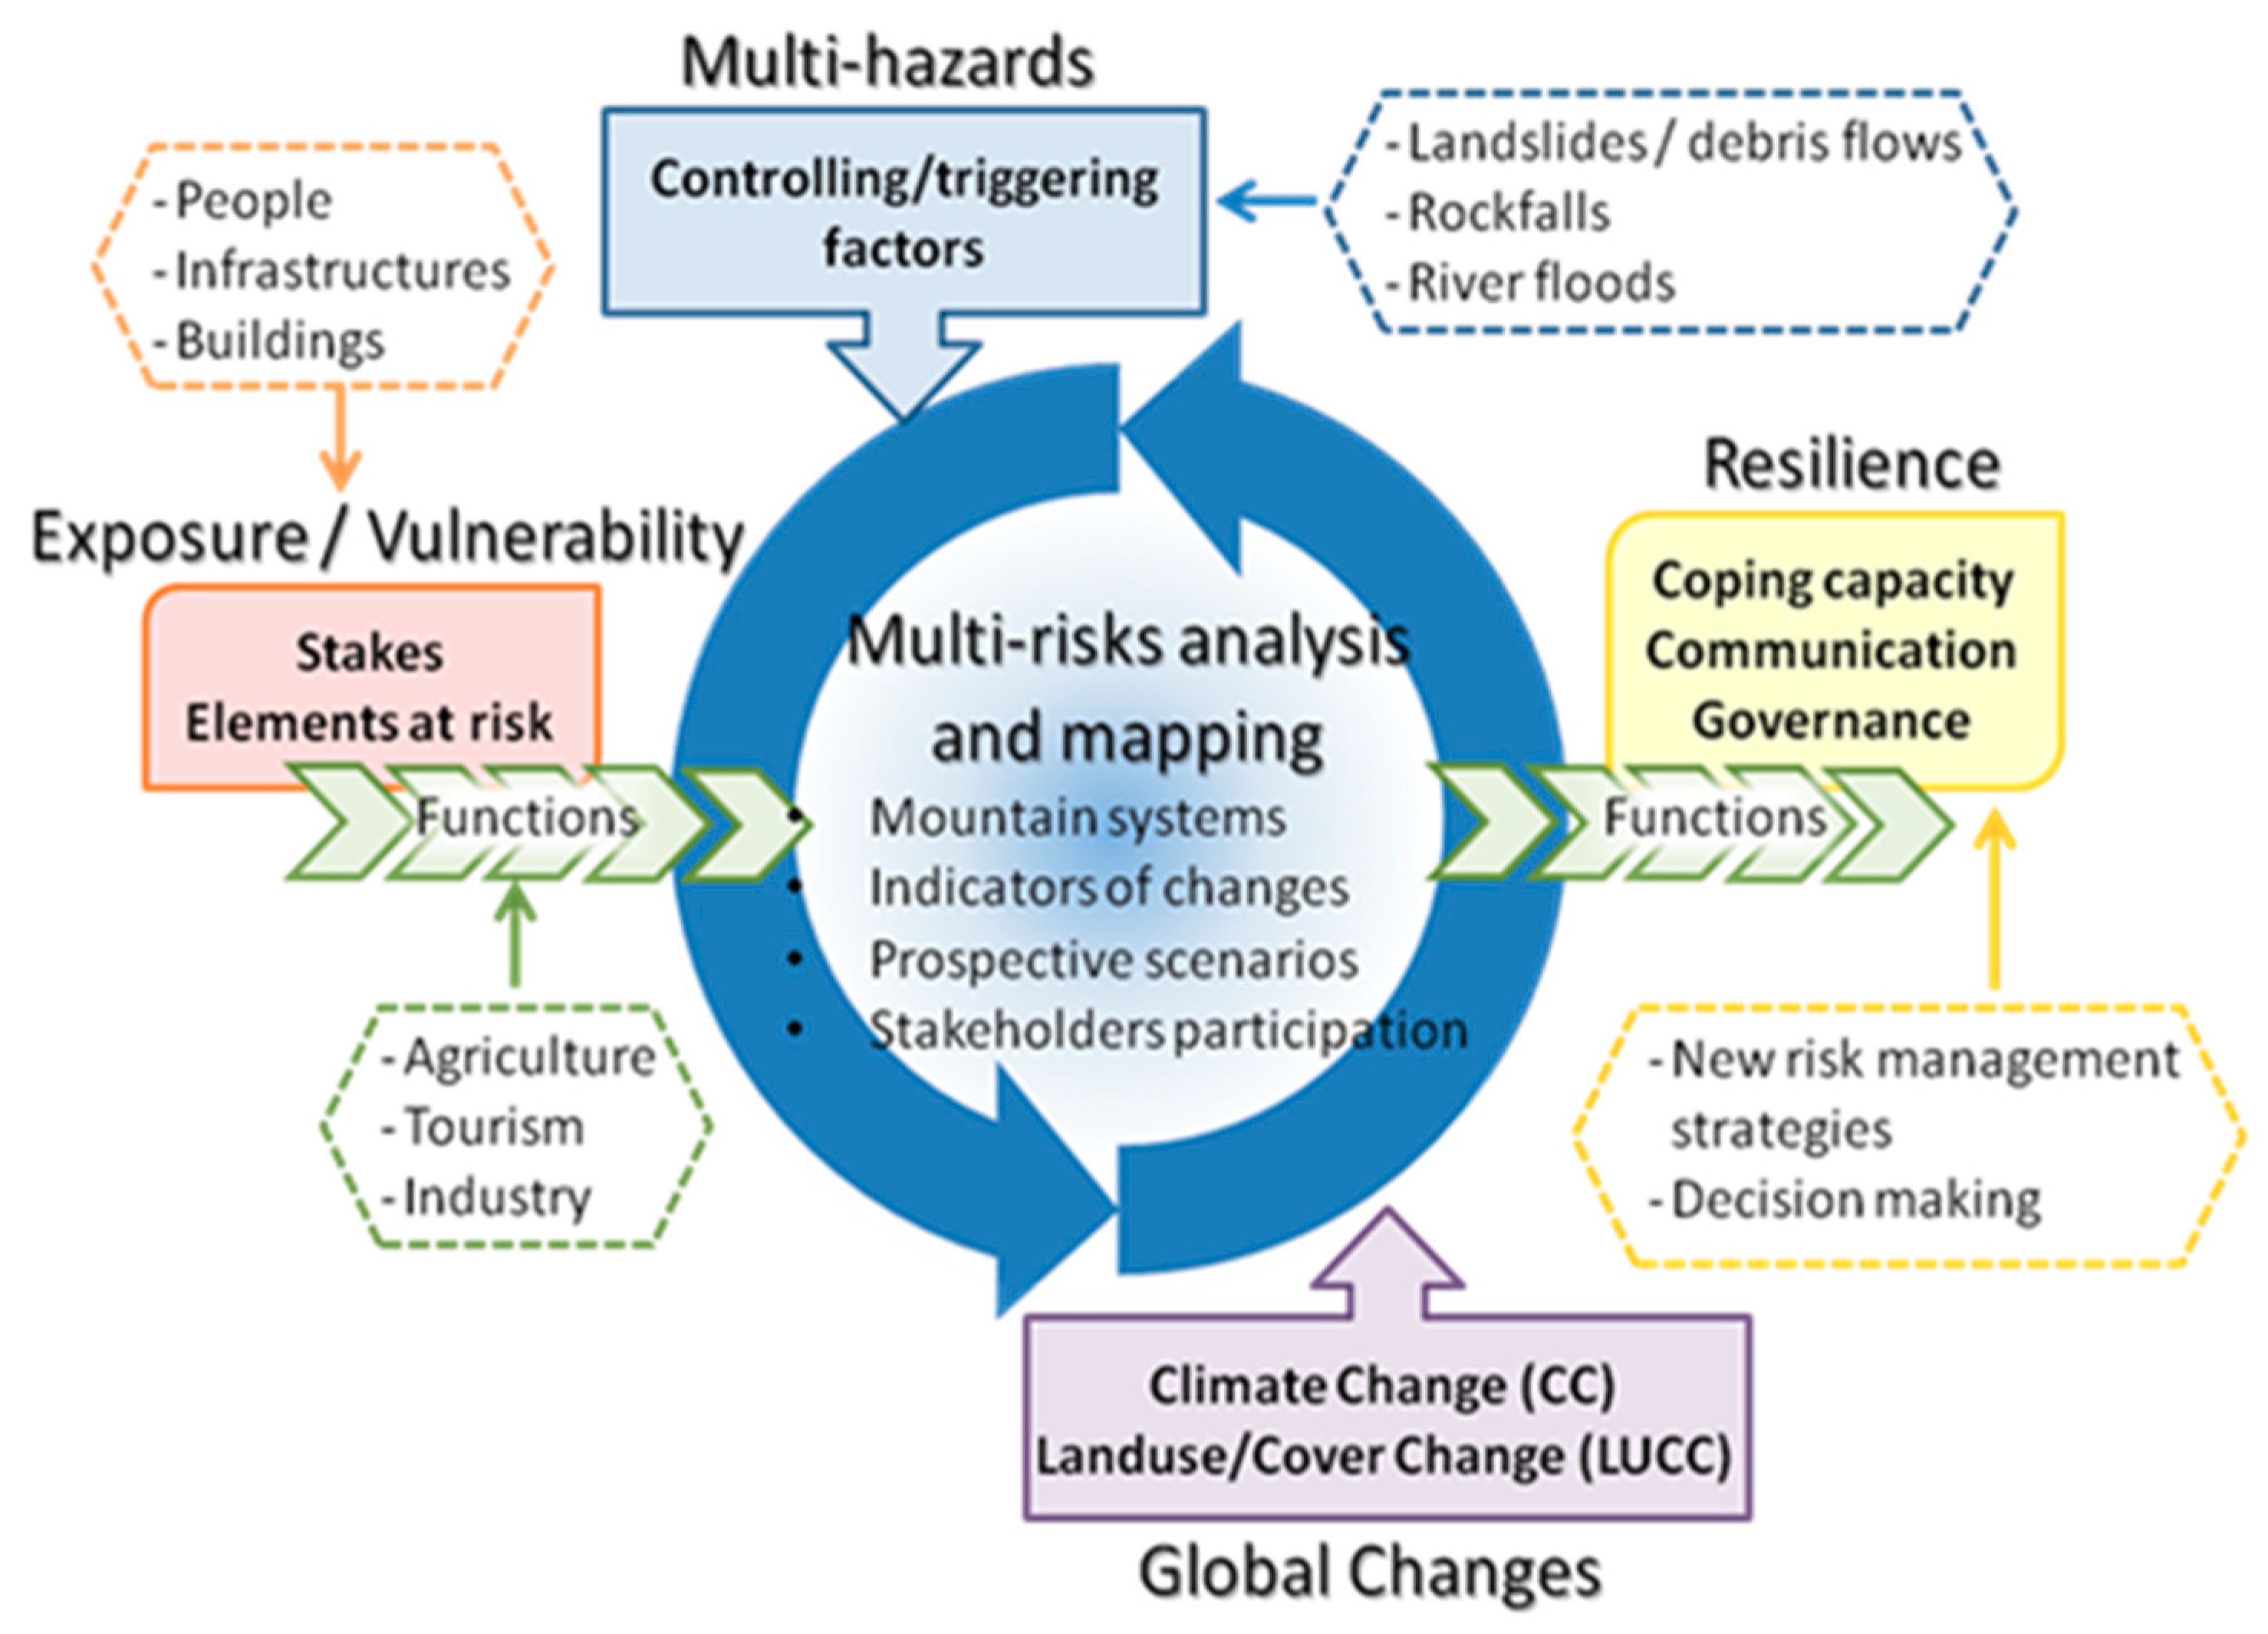
Conceptual approach of the SAMCO (Society Adaptation for coping with Mountain risks in a global change COntext) project. Three aspects are considered (multi-hazards, exposure/vulnerability and resilience) as well as forcing factors like climate change (CC) and land use/cover changes (LUCC), all of them being assessed by the mean of maps socio-economic functions evolution.
Figure 1.
Conceptual approach of the SAMCO (Society Adaptation for coping with Mountain risks in a global change COntext) project. Three aspects are considered (multi-hazards, exposure/vulnerability and resilience) as well as forcing factors like climate change (CC) and land use/cover changes (LUCC), all of them being assessed by the mean of maps socio-economic functions evolution.

Figure 2.
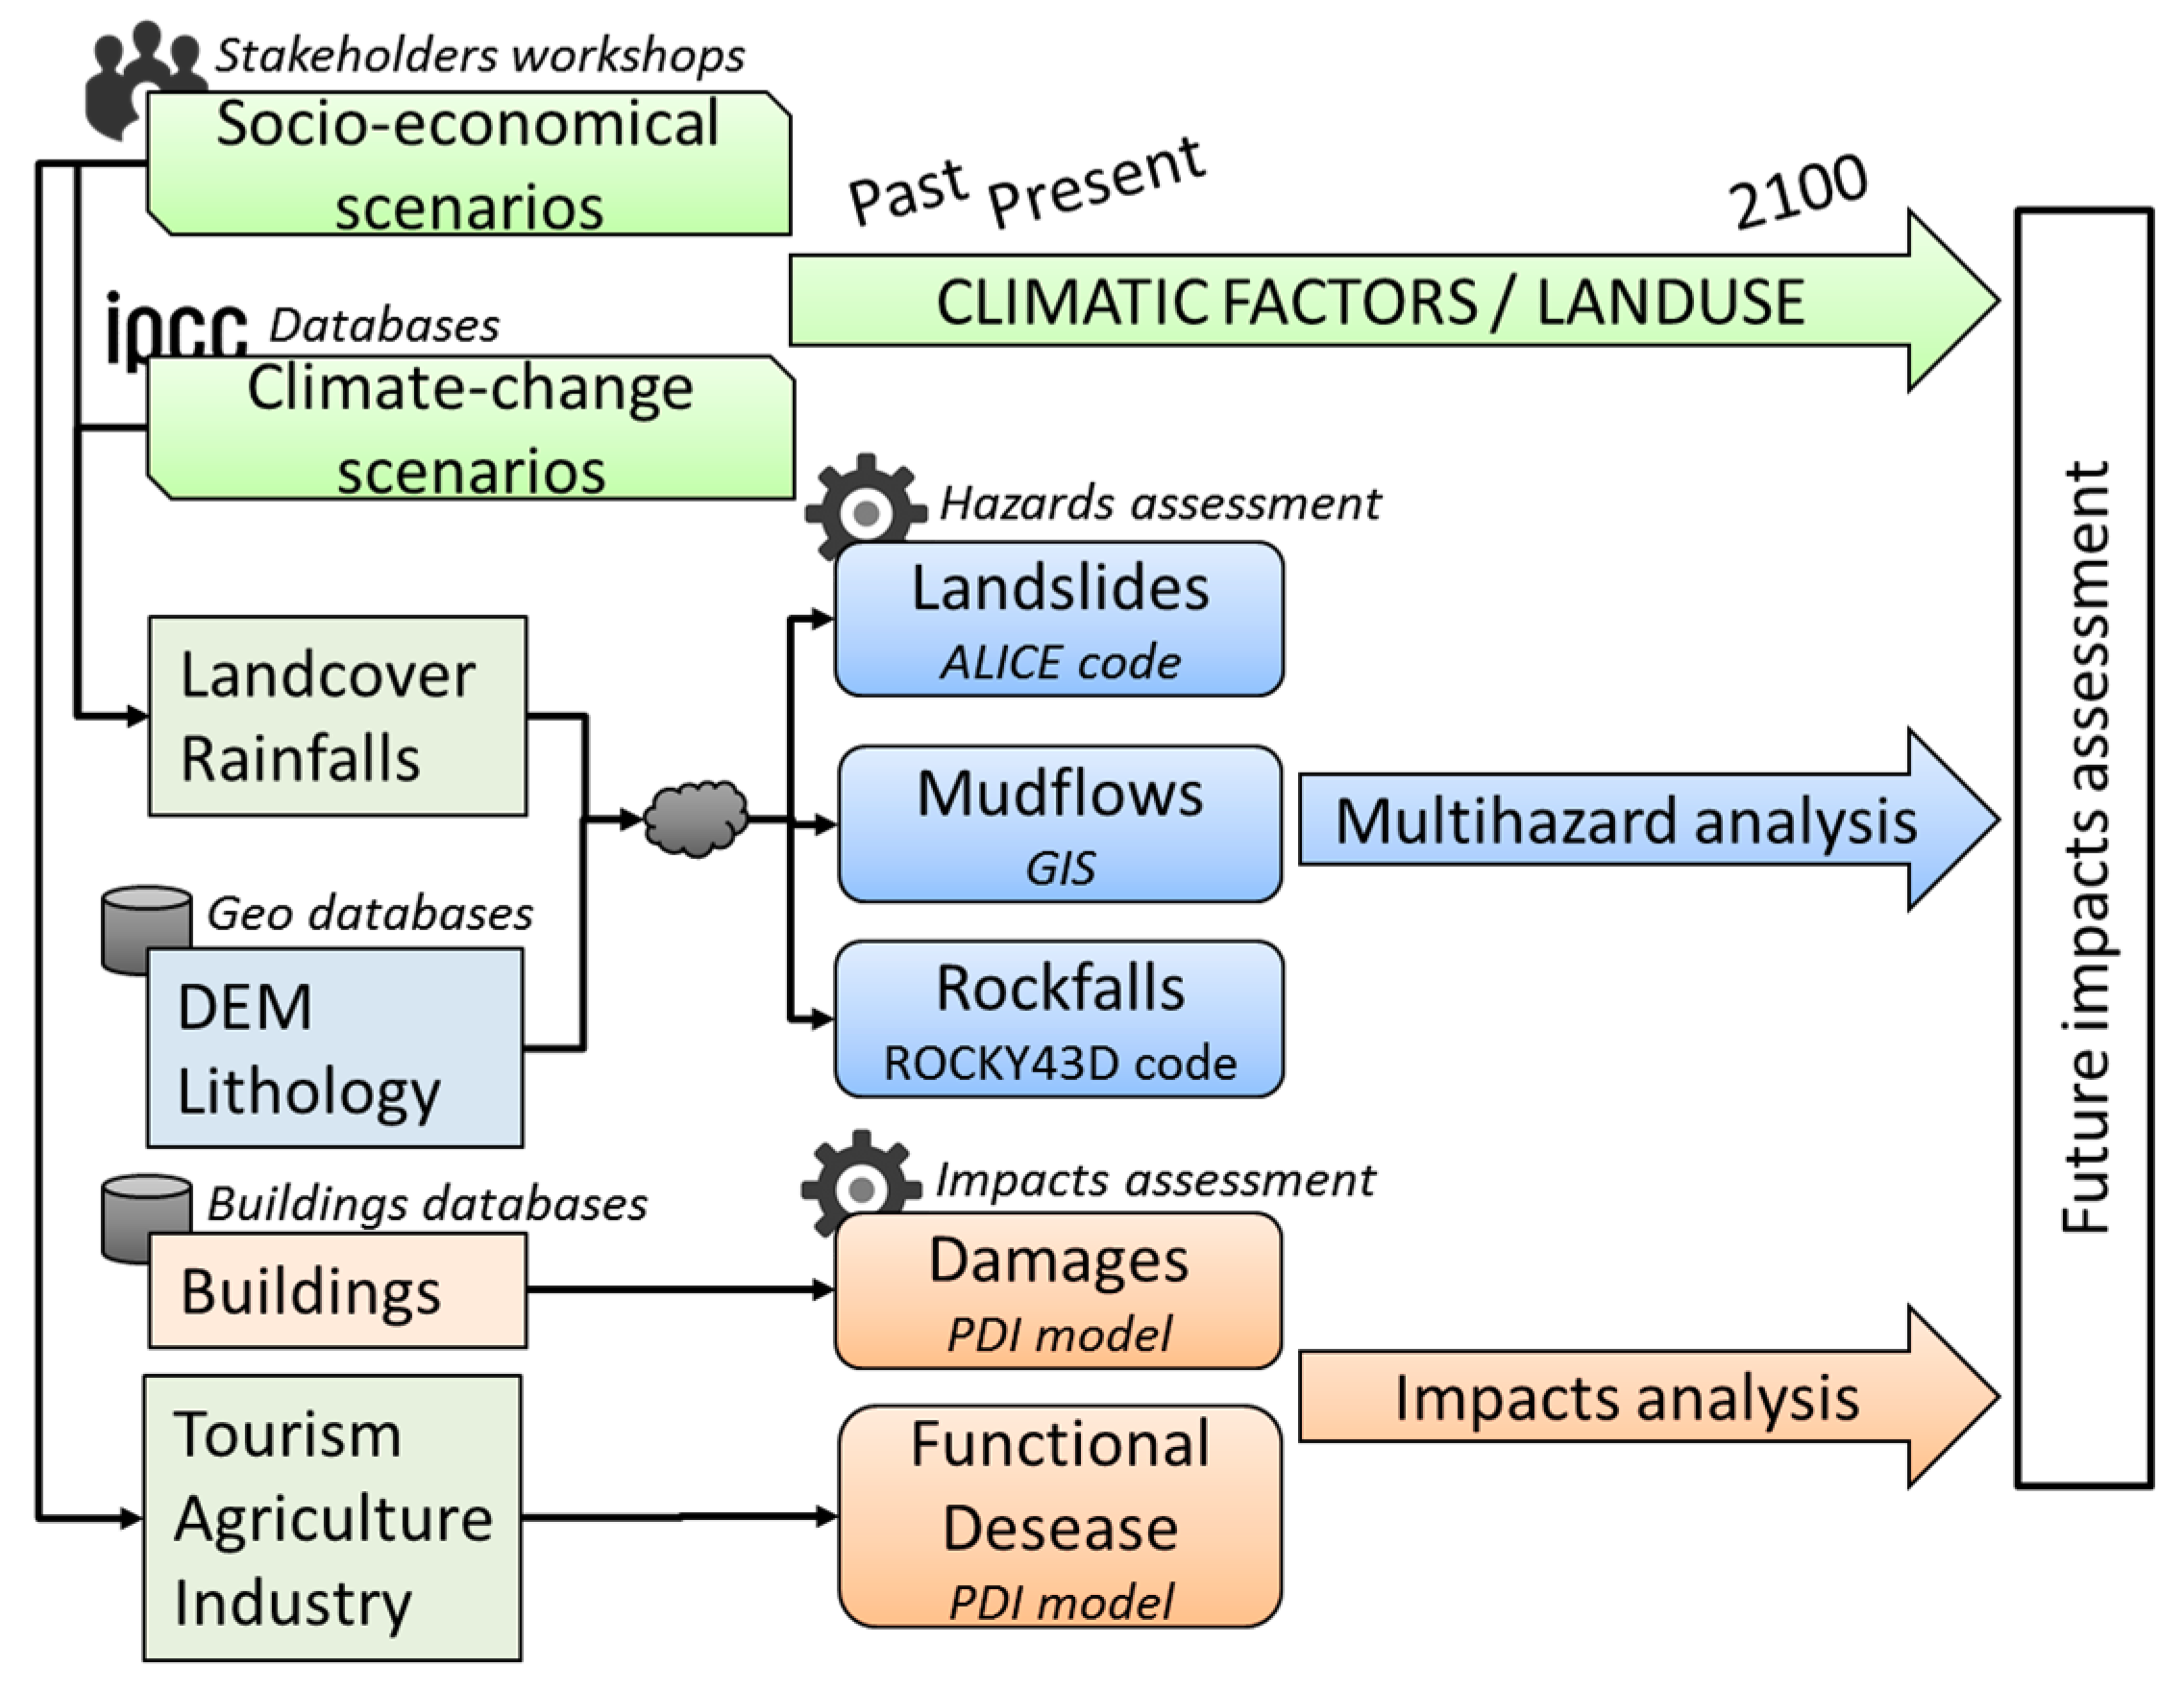
Illustration of the SAMCO methodology: Scenarios are first set up in order to assess the evolution of climate and economics in time. Parameters such as landcover, rainfalls, DEM, lithology, and stakes at risk are considered in different modelling tools to compute multi-hazards maps and impacts.
Figure 2.
Illustration of the SAMCO methodology: Scenarios are first set up in order to assess the evolution of climate and economics in time. Parameters such as landcover, rainfalls, DEM, lithology, and stakes at risk are considered in different modelling tools to compute multi-hazards maps and impacts.

Figure 3.
(a) Location of the Cauterets site; (b) radiative forcing over years for RCP4.5 (grey) and RCP8.5 (black) scenarios; and (c) Landslides hazard maps of the Cauterets site corresponding to a socio-economic scenario “sheeps and woods” at present days (d) and for a climatic evolution according to the RCP8.5 scenario at horizon 2100.

Figure 4.
The SAMCO platform conceptual architecture.

Figure 5.
Data storage example used in the SAMCO simulations.

Figure 6.
“Print screen” of the SAMCO Web-platform showing the landslide hazard map for the scenario: Site = Cauterets, Period = 2040, Hazard = Landslides, Economy = Green actions, climate = RCP4.5 (not visible on the screen).
Figure 6.
“Print screen” of the SAMCO Web-platform showing the landslide hazard map for the scenario: Site = Cauterets, Period = 2040, Hazard = Landslides, Economy = Green actions, climate = RCP4.5 (not visible on the screen).

Figure 7.
“Print screen” of the SAMCO Web-platform showing the landslide hazard map for the scenario: Site = Cauterets, Period = 2040, Hazard = Landslides, Economy = Green actions, climate = RCP8.5 at present days (left) and at horizon 2040 (right). The locations where the landslide hazard level goes from low to moderate are clearly visible.


Table 1.
Methodologies used to assess the landslides, rockfalls, and floods hazards, with related input/output parameters, physical approaches, and bibliographic references.
Table 1.
Methodologies used to assess the landslides, rockfalls, and floods hazards, with related input/output parameters, physical approaches, and bibliographic references.
| Methodology | Landslides | Rockfalls | Floods |
|---|---|---|---|
| ALICE Code | ROCKY43D Code | Heuristic | |
| Input parameters | DEM Cohesion Friction angle Watertable level (from rainfalls) Vegetation Failure length | DEM Rocks density Blocks features Soil roughness Soil type Vegetation features | DEM Geomorphology Field sampling Geophysics |
| Physical model | Limit equilibrium theory | Physical propagation model | GIS Terrain analysis |
| Output parameter | Probability of failure map from safety factor distributions. | Kinetic energy statistics Trajectory information: time, velocity, height, etc. | Sedimentary stocks Vulnerability to floods |
| References | Baills et al., 2012 Bernardie et al., 2017 | Dorren, 2016 Bourrier, 2009 | Carlier et al., 2018 Arnaud-Fassetta et al., 2015 |
Table 2.
Input parameters defining a scenario. All combinations of each parameter were almost considered.
Table 2.
Input parameters defining a scenario. All combinations of each parameter were almost considered.
| Site | Period | Hazard | Scenario for Economy | Scenario for Climate |
|---|---|---|---|---|
| Cauterets | Past (1950) | Landslides | Green actions | RCP4.5 |
| Ubaye | Now (2010) | Rockfalls | Tourism | RCP8.5 |
| Queyras | 2040 | Floods | Agroenergy | |
| Vars | 2100 | Abandonment |
© 2018 by the authors. Licensee MDPI, Basel, Switzerland. This article is an open access article distributed under the terms and conditions of the Creative Commons Attribution (CC BY) license (http://creativecommons.org/licenses/by/4.0/).
Share and Cite
MDPI and ACS Style
Grandjean, G.; Thomas, L.; Bernardie, S.; The SAMCO Team. A Novel Multi-Risk Assessment Web-Tool for Evaluating Future Impacts of Global Change in Mountainous Areas. Climate 2018, 6, 92. https://0-doi-org.brum.beds.ac.uk/10.3390/cli6040092
AMA Style
Grandjean G, Thomas L, Bernardie S, The SAMCO Team. A Novel Multi-Risk Assessment Web-Tool for Evaluating Future Impacts of Global Change in Mountainous Areas. Climate. 2018; 6(4):92. https://0-doi-org.brum.beds.ac.uk/10.3390/cli6040092
Chicago/Turabian StyleGrandjean, Gilles, Loïc Thomas, Séverine Bernardie, and The SAMCO Team. 2018. "A Novel Multi-Risk Assessment Web-Tool for Evaluating Future Impacts of Global Change in Mountainous Areas" Climate 6, no. 4: 92. https://0-doi-org.brum.beds.ac.uk/10.3390/cli6040092
Note that from the first issue of 2016, this journal uses article numbers instead of page numbers. See further details here.