Article

Influence of Green Spaces on Outdoors Thermal Comfort—Structured Experiment in a Mediterranean Climate

Centro de Investigação de Montanha (CIMO), Instituto Politécnico de Bragança, Campus de Santa Apolónia, 5300-253 Bragança, Portugal
*
Author to whom correspondence should be addressed.
Submission received: 17 December 2018 / Revised: 19 January 2019 / Accepted: 22 January 2019 / Published: 26 January 2019

Abstract

:
As a growing part of the global population lives in cities, green spaces are an essential asset for improving quality of life. This study aims to address the role of green spaces in providing favorable thermal comfort conditions for the use of outdoor spaces. The research methodology consisted of a structured experiment where a defined set of individuals from different age groups was exposed to differentiated microclimate conditions. Four nearby locations were considered, ranging from a stone-paved surface without shade to high tree canopy coverage over grass. This experiment took place in three different days in summer and early autumn conditions, with a total of 432 questionnaires. Results show a wide range of thermal sensations found during this experiment, while more favorable thermal sensations were found in shaded locations. To investigate the role of prevailing meteorological and personal conditions on thermal sensations, multinomial logistic regression analysis was applied. Results show the influence of air temperature, global radiation, wind speed, and interviewees’ gender. As meteorological variables were influenced by the diverse contexts found within a close distance inside the studied green space, results from this structured experiment suggest the need for micrometeorological diversity in the local context as a means to promote greater adaptive opportunities for green spaces users.

1. Introduction

About three-quarters of the European population lives in cities [1] facing various environmental stresses including air pollution, noise, and uncomfortable thermal conditions. Urban greening has been widely recognized as a key factor to mitigate the adverse effects of urbanization [2,3,4,5]. However, urban greening may also be associated with multiple negative effects, such as allergies [6], reduced passive pollutant dispersion [7], and undesirable shade [8]. Both the positive and negative effects of green spaces are related to the urban context and the quality of urban design.
Amongst all recognizable benefits from urban greening, the improvement of thermal conditions has been addressed by different studies demonstrating the positive influence of green spaces at multiple levels, including the regional [9], urban (such as the urban heat island) [10,11,12], and microscales [13,14,15,16,17,18,19,20,21,22,23,24].
Green spaces can also provide ideal locations for social interaction and healthy living by different age groups [25,26,27] and as several studies [28,29,30,31,32] suggest, there is a strong relation between microclimatic conditions and the patterns of use of open spaces. Survey studies also show that most users tend to perceive the importance of green spaces in improving the thermal environment [33,34,35], particularly by providing shade during the warmer periods. By understanding human relations with outdoor spaces, relevant suggestions can be provided to urban designers.
Trees influence the thermal environment by providing shade, intercepting radiation with their canopy and reducing surface temperature, followed by heat transference through convection from warmer areas. Additional cooling is provided by the conversion of radiation into latent heat and evapotranspiration [36]. Grass surfaces can also provide a cooler environment, especially when wet [37], although as mentioned by Doick et al. [38], grass surfaces are less effective than trees in cooling the environment.
Urban environments are often complex and offer diverse comfort conditions within short distances [39], as is the case of the differences between green spaces and its surroundings [40], in what is known as the “Park Cool Island” (PCI) effect [22,40,41].
The research trying to address outdoor thermal comfort is complex, as it is driven not only by meteorological conditions but also by the physiological and psychological attributes of individuals, which are not static, as psychological adaptation plays an essential role [42,43]. Consciously or unconsciously, people tend to adapt to local circumstances by modifying their clothing and activity patterns [44,45,46,47], looking to balance the meteorological conditions by improving their personal thermal sensations.
Moreover, people tend to adapt their behavior by visiting different locations and performing diverse activities, choosing spatial attributes that adjust to their thermal and psychological preferences at a given moment [48,49]. They often show preferences for spaces that include vegetation [42,50] and particularly trees [20,30]. This latter option may be the consequence of the cooling effects of trees during the summer in warm climate conditions [31,51].
Several authors [46,49] have tried to establish the relationship between meteorological circumstances and human response through behavior and perception studies. When compared with indoor spaces, outdoor environments offer a particular context, with a differentiated contribution from direct solar radiation as well as higher and more variable air velocities [52].
Due to their subjective nature, perceptions are traditionally addressed by surveys (questionnaires), combined with the assessment of both meteorological site conditions and physiological attributes of the participants [53]. Under this assumption, many studies take place in outdoor spaces (e.g., [29,46,48,54,55,56]), and particularly in parks (e.g., [32,48,49,57]). The common characteristic of most of such studies is the fact that they allow users to act on their own will before interviews. These circumstances lead to variability in study conditions, including both personal and physiological parameters such as clothing and metabolism, respectively, and some psychologically-driven factors, such as perceived control, time exposure, and environmental stimulation, due to multiple adaptation processes (physiological or psychological) [49], thus increasing the chances of finding persons under comfortable conditions.
A different approach to the study of outdoor thermal comfort consists of developing structured experiments, trying to strengthen the control over both physiological and psychological adaptation factors, addressing selected locations, and designing experiments which restrict clothing choices, time exposure, and activity levels, while reducing the variation in such psychological effects as perceived control and environmental stimulation. These structured experiments have rarely been used to address outdoor thermal comfort (with the exception of the studies by Givoni et al. [58]), but are closer to the traditional approach to indoor thermal comfort studies, as is the case of several studies developed by Fanger [59] using pre-established clothing insulation (clo) and metabolic rates (met), and controlled thermal conditions.
Although some general assumptions can be made regarding the relevance of green spaces and vegetation in improving outdoor thermal comfort, there is the need for further studies regarding specific climate contexts [60]. Despite the recent attempt to determine a common Mediterranean Outdoor Comfort Index by Golasi et al. [46,61] and the existence of several studies regarding personal thermal sensations in Mediterranean climate locations [48,55,56,62,63,64], there is still the need for wider recognition of specific thermal comfort conditions, as is the case of the specific warm-summer Mediterranean climate, category Csb under the Köppen–Geiger classification [65].
The aim of this study was to evaluate the role of green spaces in providing favorable thermal comfort conditions for the use of outdoor spaces, with the development of a structured experiment in selected green spaces locations, under summer and early autumn conditions.

2. Materials and Methods
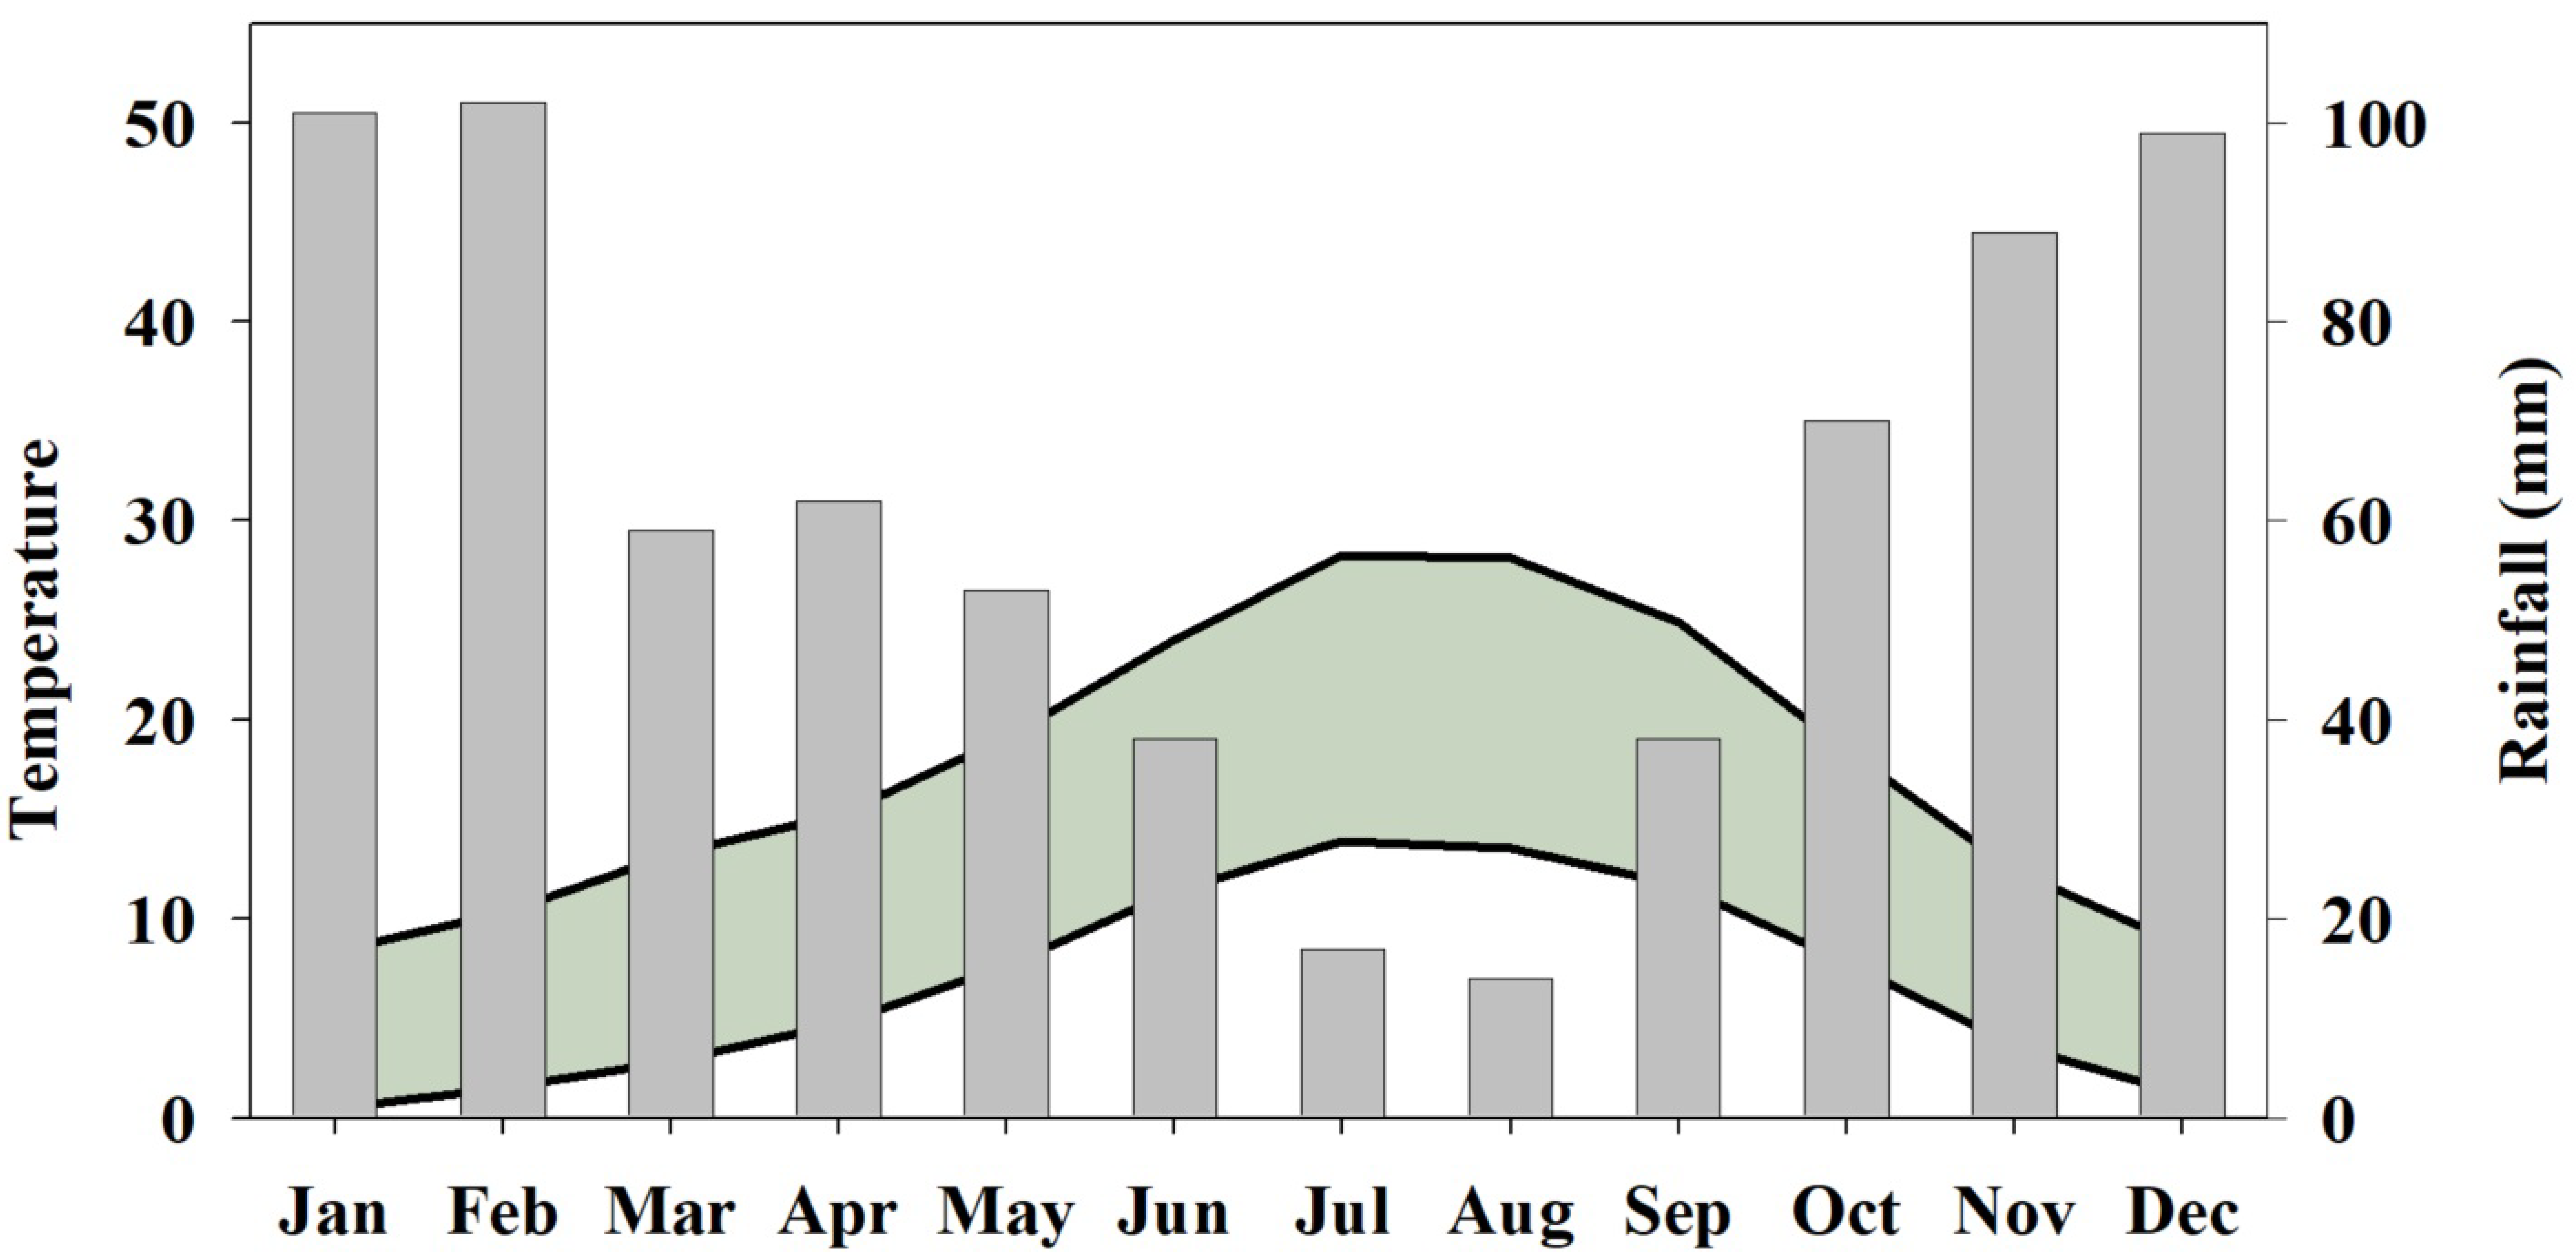
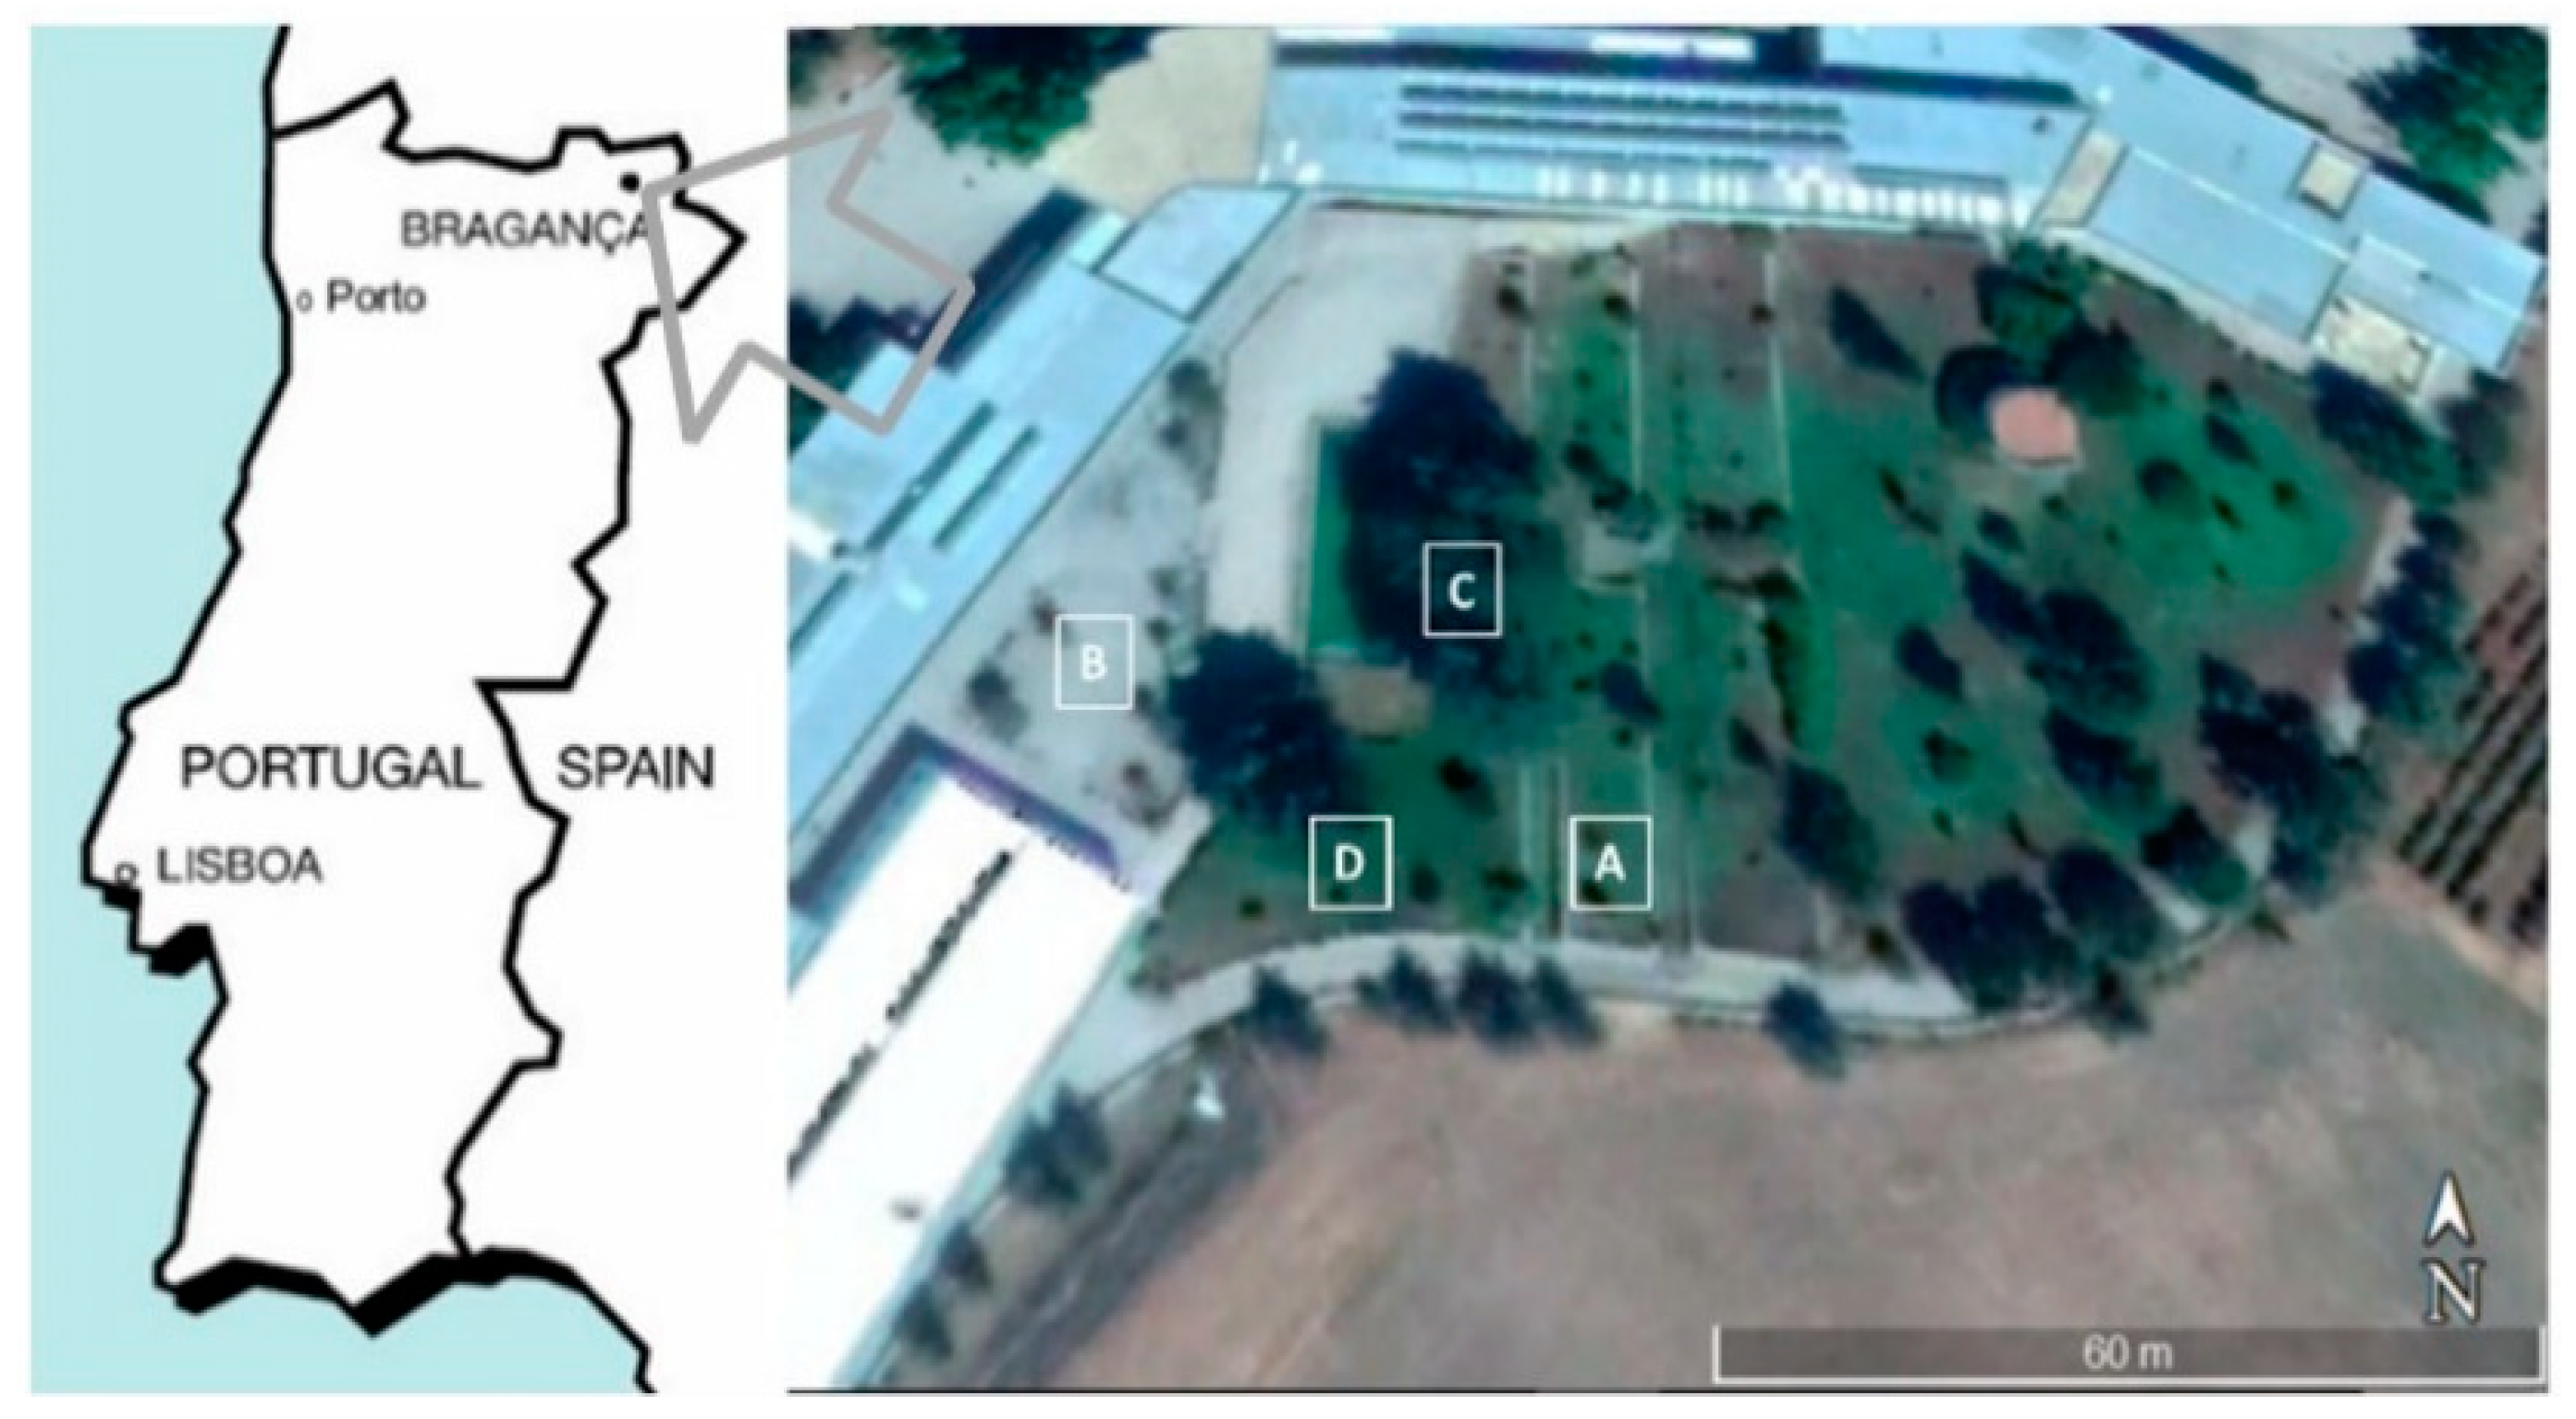
2.1. Study Area

The study area is located in the city of Bragança (41°44′ N, 6°48′ W, 690 m above a.m.s.l.) in the Northeast of Portugal. The structured experiment took place in a garden inside a University Campus (Instituto Politécnico de Bragança).
The climate of Bragança is characterized by an annual precipitation that averages 742 mm, with an irregular distribution through the year. Winter rainfall represents about 60% of the annual total. The annual average maximum and minimum temperatures are 17.6 °C and 6.7 °C, respectively. The monthly climograph of Bragança is shown in Figure 1. The highest monthly average air temperature was reached in July with 21.1 °C (average maximum temperature, 28.3 °C), and the coldest in January with 4.5 °C (average minimum temperature, 0.5 °C). The average relative humidity (RH) during the year ranges from 40% in July to 80% in January.
Meteorological data shows that summers in Bragança are warm and dry and winters are cold and wet, fitting the climatic classification of Köppen–Geiger under category Csb [65].

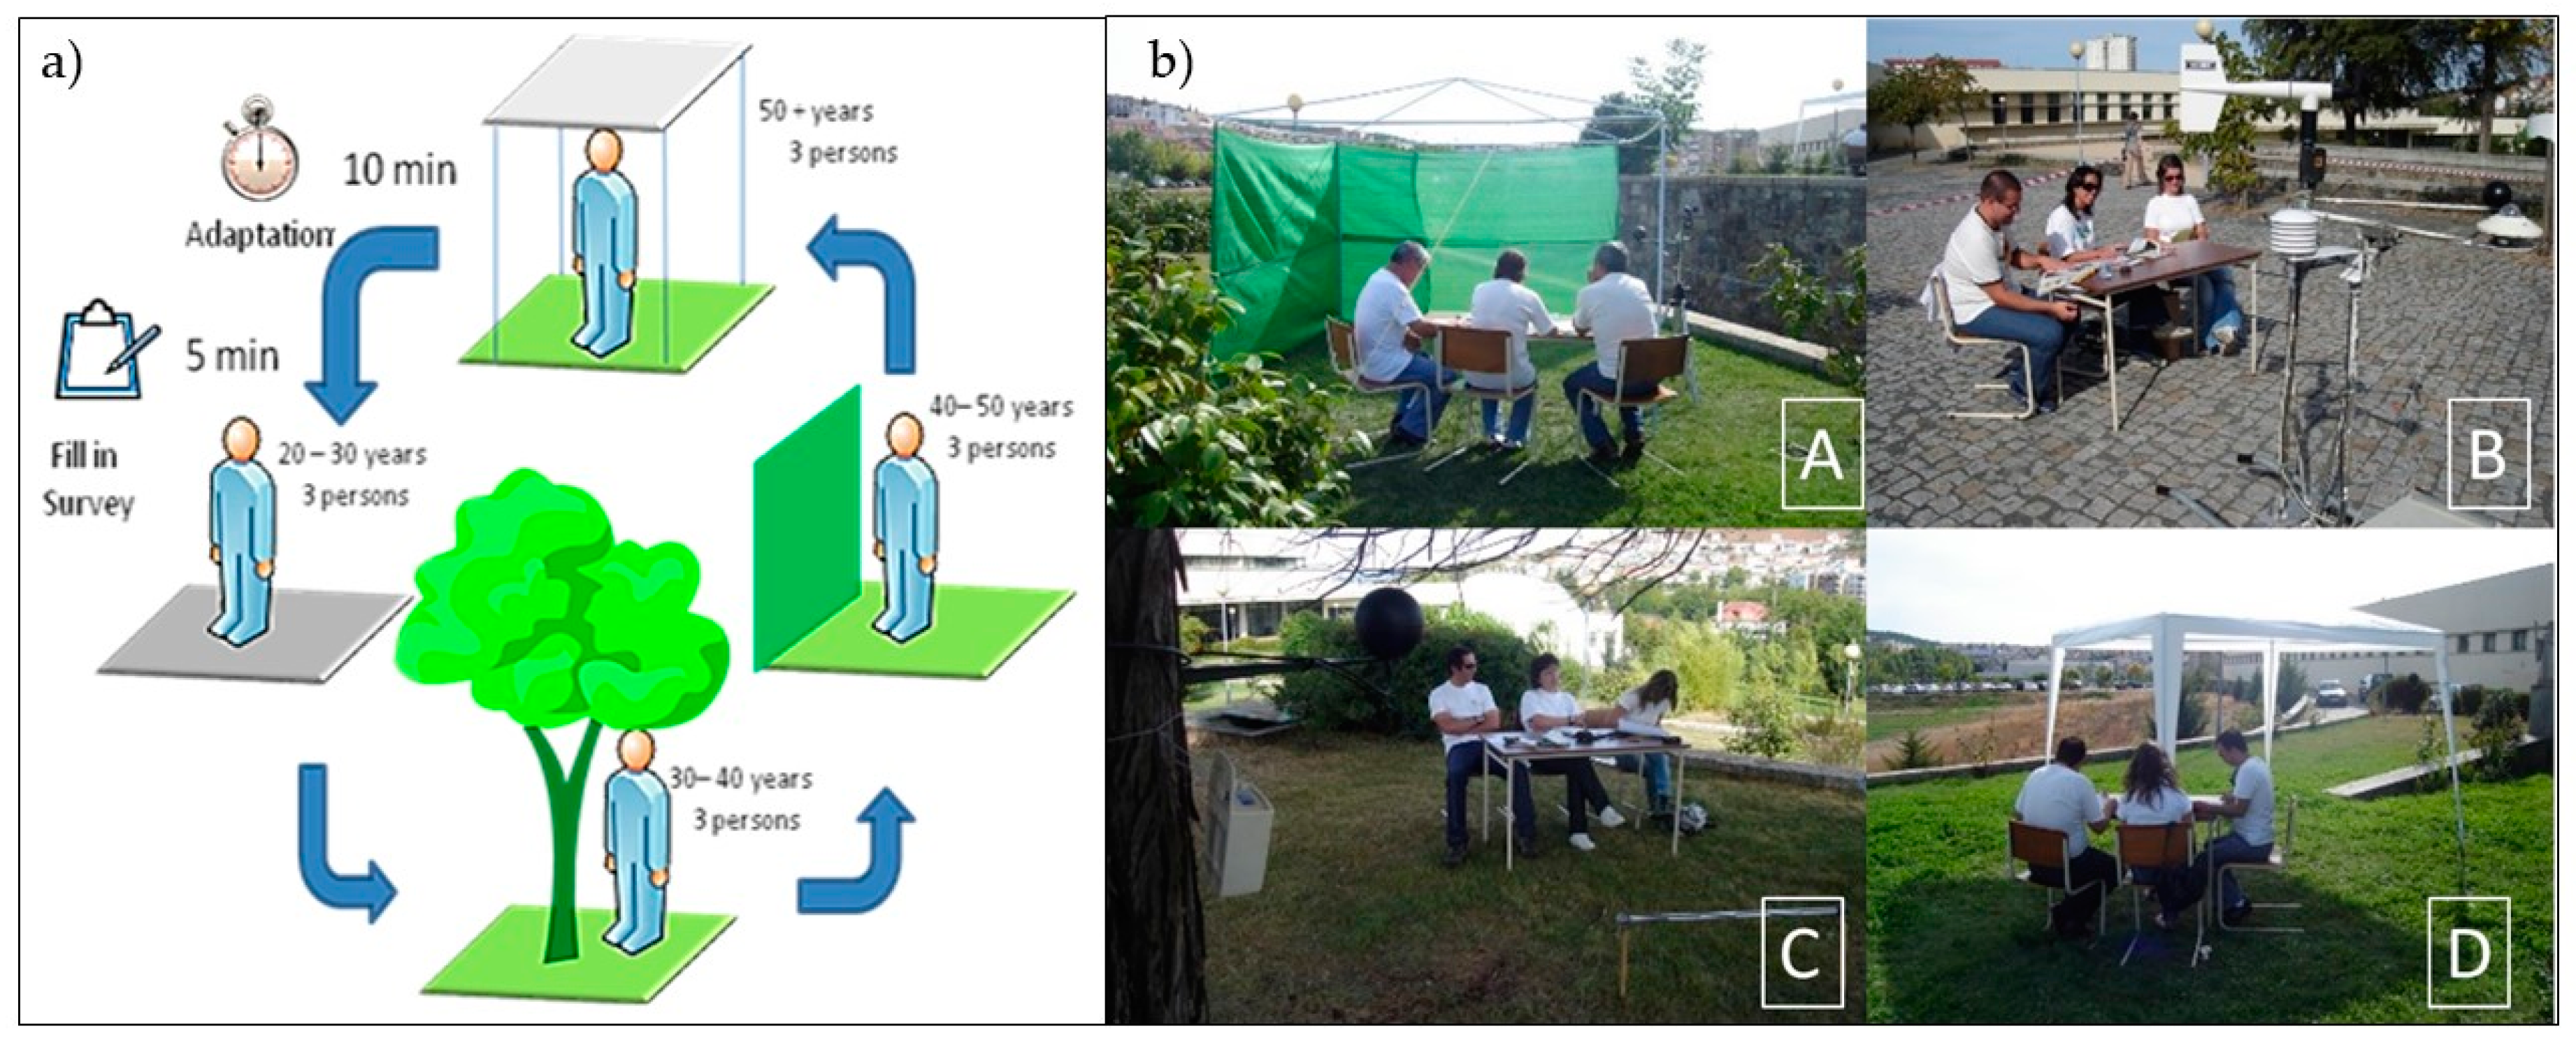
2.2. Research Methodology

This study took place in four different locations within a close distance of no more than 50 m apart from each other, under contrasting conditions, with the objective of evaluating the influence of microclimate variables such as global radiation (St), relative humidity (RH), wind speed (V), air temperature (Ta), and mean radiant temperature (Tmrt) on thermal sensation. The locations had the following conditions (Figure 2 and Figure 3b): (A) over grass, under solar direct radiation and near a wind shelter (WINDSHELT); (B) over stone-paved ground and under direct solar radiation (SUN); (C) over grass under the shade of a tree (Cupressus lusitanica) (TREE); and (D) over grass under artificial shade provided by a tent (TENT).
A total number of 12 persons (six men and six women), grouped into four age groups (20–30, 30–40, 40–50, and 50–60 years) participated in this study, wearing jeans and a white t-shirt (approximately 0.5 clo [66,67]). Each participant filed in a questionnaire assessing individual thermal perceptions. Each age group, with three participants, stayed seated, facing the sun and resting (metabolic rate of 55 to 70 W/m2 [67]) in each location for over 15 min (10 min adjusting to local conditions and five minutes filling in the questionnaire), moving to the next location in a rotation scheme (Figure 3a). After approximately 60 min, every group had gone through the four locations. This procedure took place in three periods during the day, starting in the morning at 09:00 h, again after lunch at 14:00 h, and in the mid-afternoon at 17:00 h. This experiment was repeated in three sunny days during the summer and early fall, in the months of June, July, and October, with 432 questionnaires, 36 for each of the surveyed individuals.
This research combined the application of on-site questionnaires and meteorological data collection. Questionnaires were used to assess subjects’ thermal perceptions taking into consideration the recommendations provided by ISO 10551 [68], including the evaluation of the personal thermal sensation (or personal thermal state) in a symmetrical seven-degree two-pole scale. Other information included respondents’ perspective on existent conditions, such as thermal preference and the perception on wind, radiation and temperature. Measurements of outdoor meteorological data provided simultaneous information on local conditions.

2.3. Meteorological Measurements

The monitoring of meteorological variables took place simultaneously with the users’ perceptions surveys. Multiple sensors were used, according to the specifications in Table 1, to measure meteorological variables (air temperature, relative humidity, wind speed and direction, global solar radiation, and globe temperature) near the survey locations (approximately 120 cm over the ground). Data were collected and averaged using the CR10X datalogger (Campbell Scientific, Logan, UT, USA). The sampling interval was one minute for all the meteorological variables.
The mean radiant temperature (Tmrt) was calculated using the globe temperature and wind speed according to Equation [69]:
T mrt = [ ( t g + 273.15 ) 4 + 1.1 × 10 8 × V 0.6 ε × D 0.4 ( t g t a ) ] 1 4 273.15
where Tg is the globe temperature (°C), Ta is the air temperature (°C), V is the wind speed (m·s−1), ε is the globe emissivity (0.95), and D is the globe diameter (mm). The empirically-derived parameter (1.1 × 10⁸) and the wind exponent (V0.6) together represent the globe’s mean convection coefficient (1.1 × 10⁸V0.6).
The micrometeorological conditions in the four locations were monitored using multiple instrumentation, evaluating simultaneous conditions. The exceptions were: transmitted radiation, measured under the tree shadow with a tube solarimeter (Delta-T Devices) placed over 0.2 m above ground; and wind speed and direction, measured only in two locations: behind a windscreen upstream from a wind barrier (TENT) and in a exposed wind location (SUN) representative of the prevailing wind on all other locations.
Data were analyzed using SPSS statistics 18 [70], including both generic graphic interpretation and multinomial logistic regression analysis. Multinomial logistic regression was applied because it allows for the evaluation of the statistical relation between a dependent categorical variable and multiple independent continuous variables (covariates) or categorical factors (design variables) [71]. SPSS uses the maximum likelihood method to calculate the logistic coefficients for this analysis.

3. Results

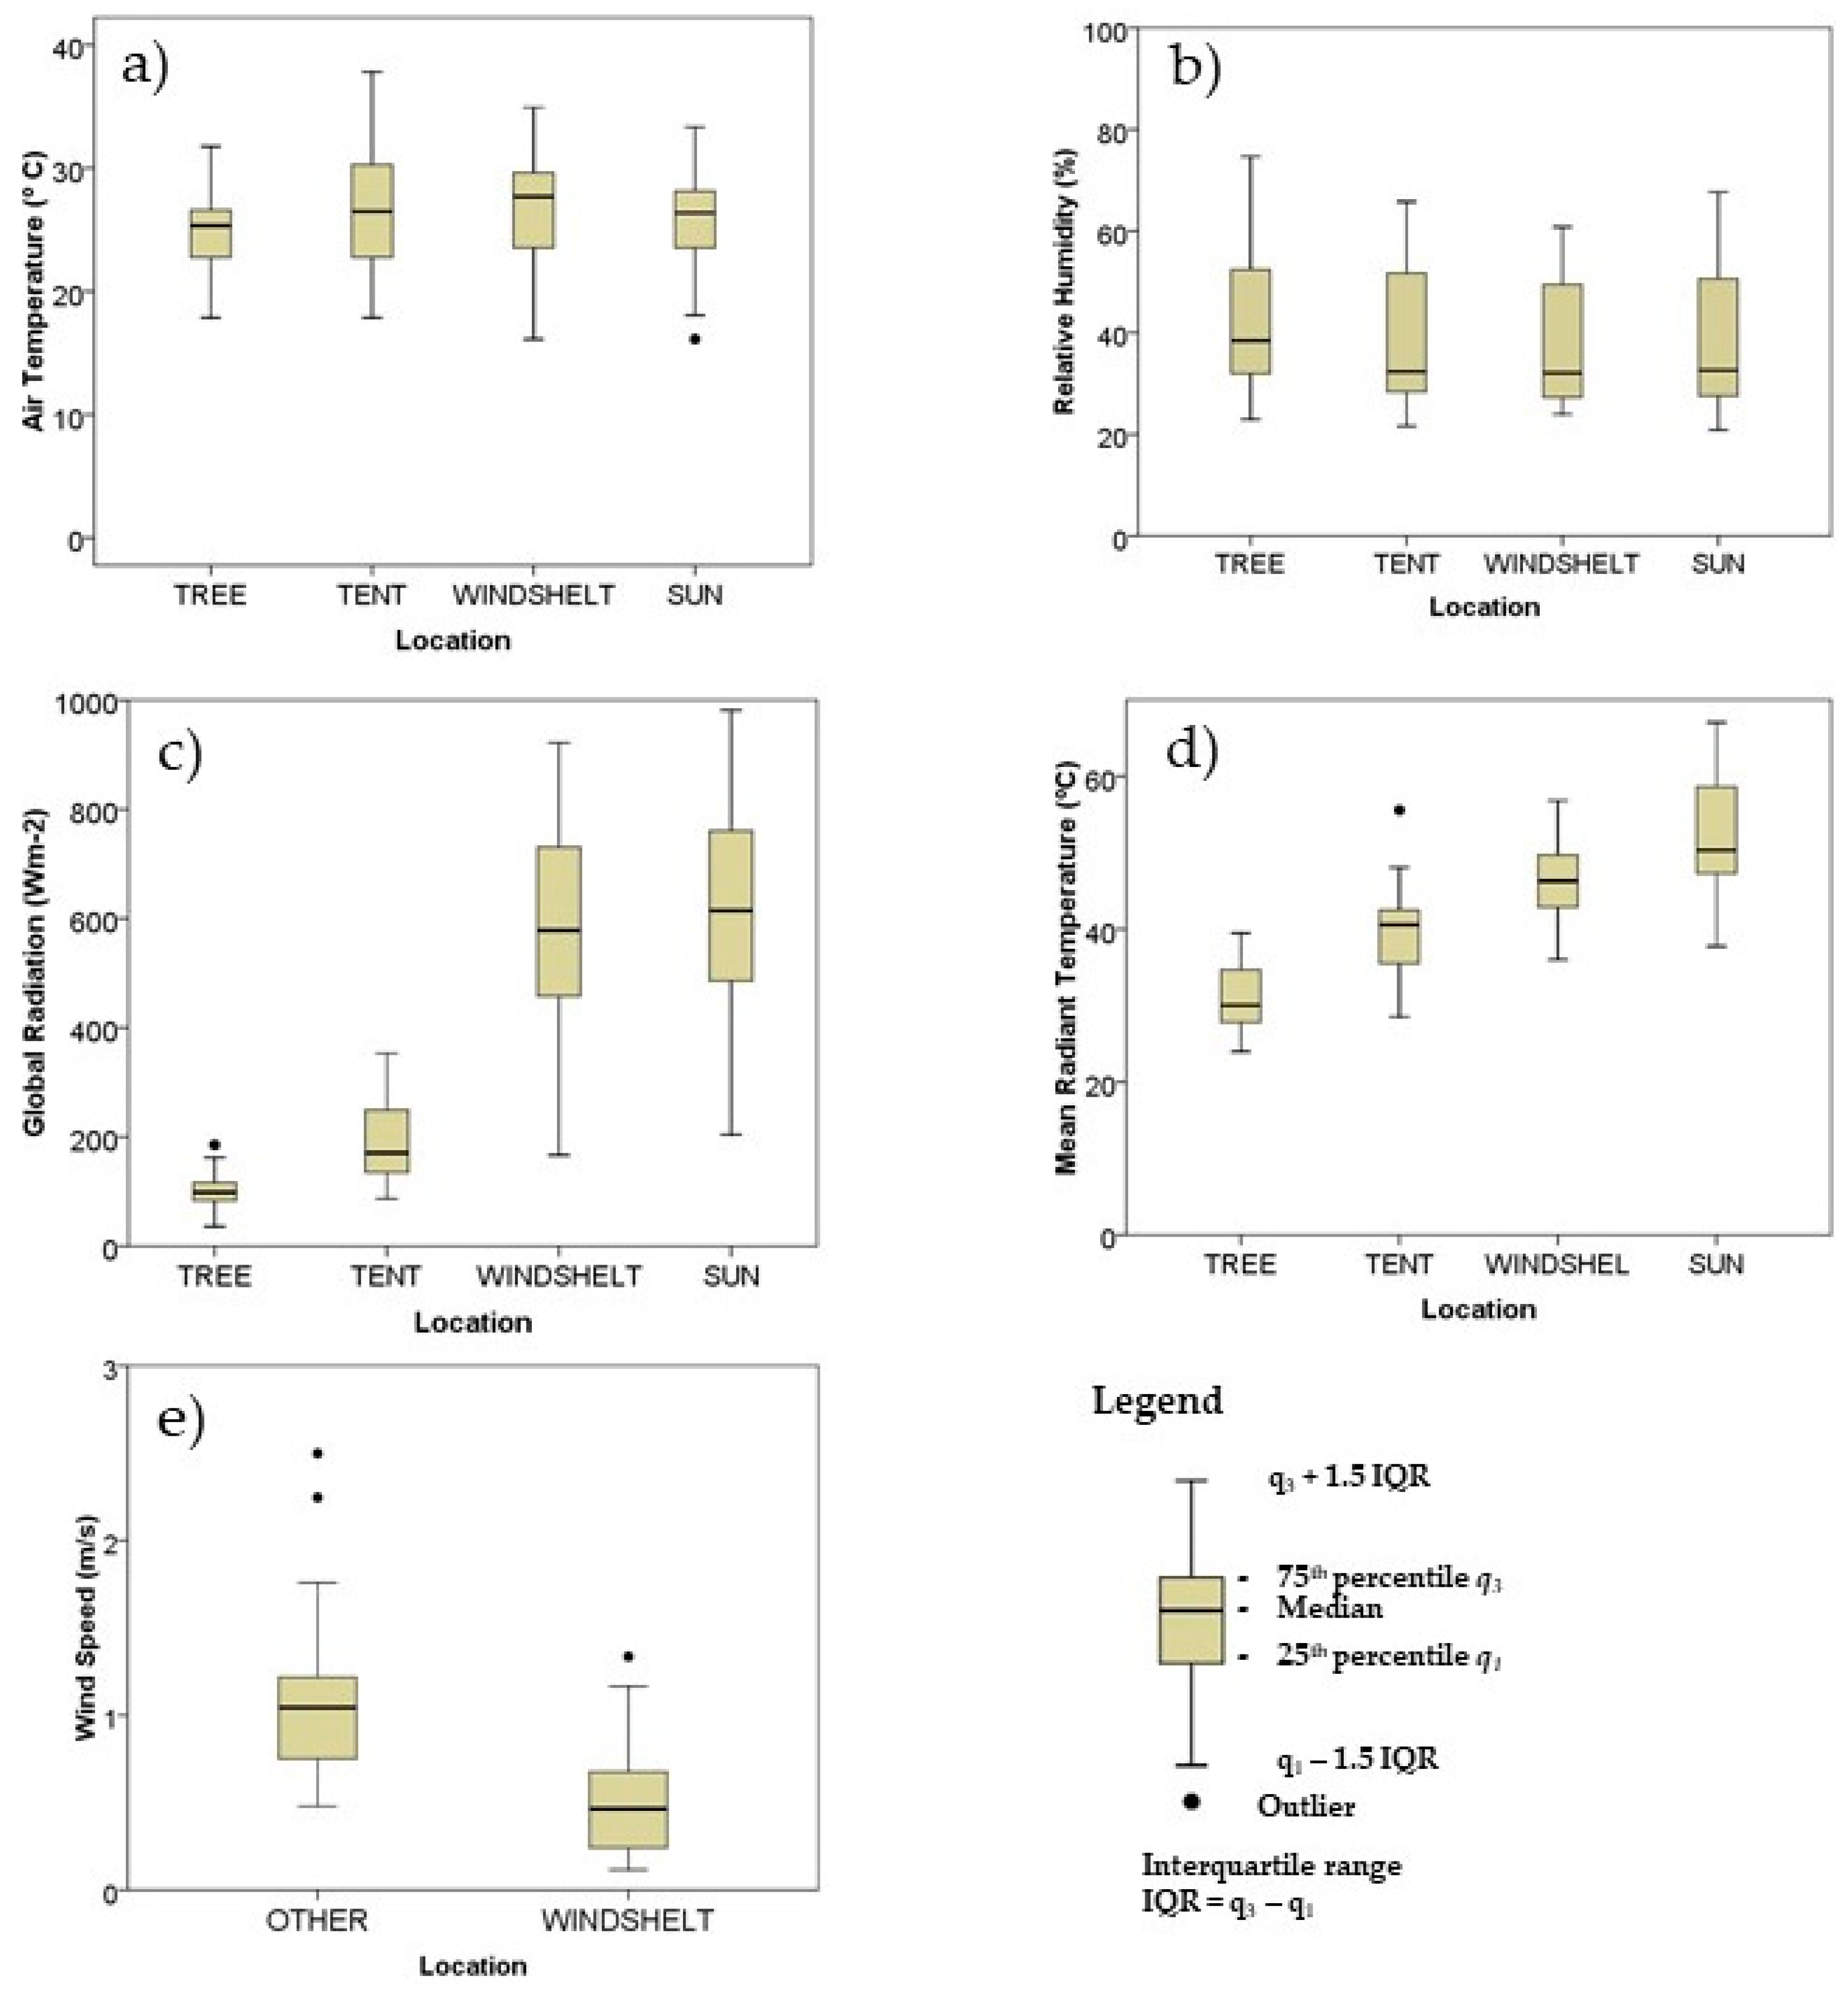
3.1. Meteorological Variables in Different Experimental Locations

The different locations had contrasting meteorological conditions during the study: similar distributions in air temperature (Ta), with higher variations in both TENT and WINDSHELT locations (Figure 4a). Relative humidity (RH) distribution had slightly higher values in the TREE location, despite the similarities among the different locations (Figure 4b). Major differences were found regarding global radiation (St), and shaded locations (TREE and TENT), as expected, had much lower values when compared with sun-exposed locations (WINDSHELT and SUN) (Figure 4c). Mean radiant temperature results show an increase in the intensity of this variable when moving from more vegetated locations (TREE) to sunny paved locations (SUN) (Figure 4d). Finally, wind speed values were lower behind a wind shelter (WINDSHELT) when compared with the reference measurement for other locations (Figure 4e).

3.2. Thermal Comfort on Different Locations

As the participants in the survey were asked to express their personal thermal sensations in a scale ranging from cold (−3) to hot (+3), results show a wide range (Figure 5a), with a large number of answers in the warm side of the scale when compared with cooler personal thermal sensations. Regarding gender, women presented a higher number of responses in the lower personal thermal sensations when compared to men (Figure 5b). When looking at the distribution within the four study locations (Figure 5c), results show a higher number of answers indicating a neutral (0) sensation or slight discomfort (−1, 1) in places under shade, while sun-exposed locations had a higher number of answers at the warm end of the personal thermal sensations scale.

3.3. Influence of Microclimatic and Personal Variables on Personal Thermal Sensations

To address the relation between personal thermal sensations and the meteorological conditions on the different locations, a multinomial logistic regression is applied. The data shows that only females felt Cold (−3), to avoid a quasi-complete separation bias, the corresponding two records were removed from the dataset. Table 2 presents the likelihood ratio test for the best results considering the variables and factors studied in this research (model fitting sig. <0.001; pseudo R-squared measures: Cox and Snell= 0.706; Nagelkerke = 0.734; McFadden = 0.374). These results show an adjustment (p <0.001) for some of the meteorological variables (covariates), namely air temperature (Ta), wind (V), and global radiation (St). From the personal factors tested, including age groups, only gender (GEN), considering a binary condition (0—male and 1—female), had an adjustment in the multinomial logistic regression model.
Table 3 shows the coefficients (B) for independent variables in the logistic regression equations along with other statistical parameters, considering a neutral thermal sensation state (0) as the reference level for the analysis. Results from the significance test (sig. <0.05) show that, with the exception of the cold condition (−3), for each personal thermal sensation there are at least two variables that can explain the differences between such condition and the reference thermal sensation (Neutral). The odds ratio (Exp(B)) is the factor by which the odds of being in the predicted level of the dependent variable are multiplied when the independent variable increases one unit. No effect is expected when the odds ratio equal 1.0, below 1.0 indicates a negative effect, while above 1.0 indicates a positive effect [71].
Finally, Table 4 shows the exponent of the coefficient (Exp.B) that more directly reveals the factor by which the odd ratios of a dependent category will change when the value of the predictor increases by a unit value. For this study, the results show the influence of meteorological variables on thermal sensations in different ways:
-
The increase by one unit in temperature (0.590) and radiation (0.991) means a decrease by 41% and 0.9%, respectively, in the odds of moving from a condition of neutrality (0) towards a cool condition (−2). This result means that the increase in these variables will generate a predicted positive effect on thermal sensation when interviewees mentioned feeling cool (−2).
-
Similarly, the increase by one unit in temperature (0.653) and radiation (0.989) means a decrease by 34.7% and 1.1%, respectively, in the odds of moving from a condition of neutrality (0) towards the slightly cool condition (−1). Again, this result means that the increase in these variables will generate a predicted positive effect on thermal sensation when interviewees mentioned feeling slightly cool (−1).
-
When feeling slightly warm conditions (+1), the increase in temperature (1.107) and solar radiation (1.005) by one unit means an increase by 10.7% and 0.5%, respectively, in the odds of moving from neutral thermal sensation (0) into this category (+1).
-
When in warm conditions (+2), the increase by one unit in temperature (1.157) and radiation (1.010) means an increase by 15.7% and 1%, respectively, in the odds from moving from neutrality (0) into this category (+2). Conversely, the increase by one unit in wind (0.197) means a decrease in 80.3% in the odds of moving from a condition of neutrality (0) towards the warm condition (+2).
-
When in a hot condition (+3), there is a similar pattern, as the increase by one unit in temperature (1.408) and radiation (1.016) means an increase by 40.8% and 1.6%, respectively, in the odds of moving from a neutral thermal sensation (0) and into this condition (+3). Conversely, the increase by one unit in wind (0.066) means a decrease by 93.4%, in the odds of moving from a condition of neutrality (0) towards the hot condition (+3).
Regarding gender, results show that there is a strong relation between gender and negative thermal sensations. Thus, for females, the odds of feeling cool (−2) are 9.53 times higher than the odds for male to have that same thermal sensation, under the same conditions. A similar situation was found for the slightly cool condition (−1), as the odds of being in this condition are 5.9 times larger for females than the odds for males to have that same thermal sensation.

4. Discussion

Results show that under the conditions prevailing during the structured experiment there is a consistent relationship between different meteorological conditions and personal thermal sensations, which in turn correspond to the effects generated by local attributes of the case study locations. Such effects have already been studied in many studies, such as the general park cooling effect provided by tree shade, including reduced temperature [20,22,72,73], radiation [19,31,37,50], and wind speed [74,75,76]. Fewer studies address strategies to improve negative thermal sensations (−3 to −1) often felt during the cooler seasons (such as promoting solar radiation intake) [32,56] to promote a temperature increase or wind speed reduction [56], providing similar interpretations to the results presented in this study.
Differences in personal thermal sensation between males and females have already been identified in multiple studies as described by Wang et al. [77], suggesting that females are more sensible to cooler environments, thus tending to express lower (or cooler) thermal sensations.
Results from this structured experiment came to suggest the need for micrometeorological diversity in the local context, as a means to promote greater adaptive opportunities for green spaces users. Such an interpretation has already been presented by Hirashima et al. [49], who reached this conclusion looking at different behaviors from user of diverse green areas in Belo Horizonte, Brazil, during summer and winter conditions. Tseliu et al. [56] also addressed the need for contrasting conditions taking into consideration the differences between summer and winter conditions in Athens (Greece), identifying different needs for thermal adaptation in those opposing seasons.
As this study could not cover all factors influencing microclimate conditions, additional aspects such as individual adaptation to seasonal conditions and the effects of diverse vegetative treatment [56], as well as different levels of tree shade intensity [31], should be considered in future studies, as they may influence the results in this kind of research.

5. Conclusions

In this study, questionnaire surveys were conducted aiming at addressing the influence of local micrometeorological conditions on thermal comfort, looking at the potential effect of small distance changes inside green spaces and trying to understand their potential for ameliorating thermal conditions during warm sunny days.
Under this research conditions, results on personal thermal sensations show that there were more frequent neutral (0) to slight discomfort (−1, 1) conditions in shaded areas, particularly over grass and under tree cover when compared with sun-exposed locations. Conversely, respondents in sun-exposed locations presented higher levels of dissatisfaction concerning the warmer conditions (+1 to +3). However, during the prevailing meteorological conditions, all locations offered opportunities for thermal comfort or slight dissatisfaction throughout the experiment, thus showing the potential for the study locations to provide comfort while users perform metabolic activities (met) and wear light clothing (clo).
The use of multinomial logistic regression demonstrated the influence of microclimate conditions on personal thermal sensations. Changes in local conditions such a global radiation and wind speed, which could be found within close distance in this study, had an impact on personal thermal sensations. Results suggest the relevance of conditions provided by green spaces (tree shadow and wind penetration) on thermal comfort, but also the need for diversity in green space design, as unshaded areas offer opportunities for increasing solar radiation intake, improving the chances for thermal comfort under cooler temperature conditions, while the shaded areas provide the opposite effect in warmer temperature conditions.
The results from this study only have local validity and may not be applicable to other climate conditions and cultural contexts. This study may help to inform urban and green space designers on the importance of contrasting microclimate conditions within public open spaces, helping to inform the development of adequate design and maintenance practices that may improve thermal comfort and promote the use of outdoor spaces.

Author Contributions

Conceptualization, A.G., A.C.R. and M.F.; Methodology, A.G. and A.C.R.; Validation, M.F.; Formal Analysis, L.N.; Investigation, F.M.; Data Curation, F.M. and L.N.; Writing—Original Draft Preparation, A.G.; Writing—Review and Editing, A.G.; Visualization, A.G.; Supervision, M.F.; Project Administration, M.F.; Funding Acquisition, A.G., A.C.R. and M.F.

Funding

Meteorological equipment acquisition was funded by the National Scientific Foundation of Portugal (FCT) given to project GreenUrbe POCI/AMB/59174/2004.

Acknowledgments

The authors would like to thank the volunteer participants in this research.

Conflicts of Interest

The authors declare no conflict of interest.

References

  1. Nabielek, K.; Hamers, D.; Evers, D. Cities in Europe–Facts and Figures on Cities and Urban Area; Urnan Agenda for EU: Brussels, Belgium, 2016. [Google Scholar]
  2. Nowak, D.J.; Crane, D.E. The Urban Forest Effects (UFORE) Model: Quantifying urban Forest Structure and Functions; Hansen, M., Burk, T., Eds.; Northern Research Station: Newtown Square, PA, USA, 2000. [Google Scholar]
  3. Givoni, B. Impact of Planted Areas on Urban Environmental Quality: A review. Atmos. Environ. Part. B Urban Atmos. 1991, 25, 289–299. [Google Scholar]
  4. Bolund, P.; Hunhammar, S. Ecosystem services in urban areas. Ecol. Econ. 1999, 29, 293–301. [Google Scholar] [CrossRef]
  5. Janhäll, S. Review on urban vegetation and particle air pollution–Deposition and dispersion. Atmos. Environ. 2015, 105, 130–137. [Google Scholar] [CrossRef]
  6. Cariñanos, P.; Casares-Porcel, M. Urban green zones and related pollen allergy: A review. Some guidelines for designing spaces with low allergy impact. Landsc. Urban Plan. 2011, 101, 205–214. [Google Scholar] [CrossRef]
  7. Wang, C.; Li, Q.; Wang, Z.H. Quantifying the impact of urban trees on passive pollutant dispersion using a coupled large-eddy simulation–Lagrangian stochastic model. Build. Environ. 2018, 145, 33–49. [Google Scholar] [CrossRef]
  8. Konarska, J.; Lindberg, F.; Larson, A.; Thorsson, S.; Holmer, B. Transmissivity of solar radiation through crowns of single urban trees—Application for outdoor thermal comfort modelling. Theor. Appl. Clim. 2014, 117, 363–376. [Google Scholar] [CrossRef]
  9. Wang, C.; Wang, Z.H.; Yang, J. Cooling Effect of Urban Trees on the Built Environment of Contiguous United States. Earth’s Futur. 2018, 6, 1066–1081. [Google Scholar] [CrossRef]
  10. Anguluri, R.; Narayanan, P. Role of green space in urban planning: Outlook towards smart cities. Urban For. Urban Green. 2017, 25, 58–65. [Google Scholar] [CrossRef]
  11. Sun, R.; Chen, L. Effects of green space dynamics on urban heat islands: Mitigation and diversification. Ecosyst. Serv. 2017, 23, 38–46. [Google Scholar] [CrossRef]
  12. Van Hove, L.; Jacobs, C.M.J.; Heusinkveld, B.G.; Elbers, J.L.; van Driel, B.L.; Holtslag, A.A.M. Temporal and spatial variability of urban heat island and thermal comfort within the Rotterdam agglomeration. Build. Environ. 2015, 83, 91–103. [Google Scholar] [CrossRef] [Green Version]
  13. Tsiros, I.X.; Hoffman, M.E. Thermal and comfort conditions in a semi-closed rear wooded garden and its adjacent semi-open spaces in a Mediterranean climate (Athens) during summer. Arch. Sci. Rev. 2014, 57, 63–82. [Google Scholar] [CrossRef]
  14. Bowler, D.E.; Buyung-Ali, L.; Knight, T.M.; Pullin, A.S. Urban greening to cool towns and cities: A systematic review of the empirical evidence. Landsc. Urban Plan. 2010, 97, 147–155. [Google Scholar] [CrossRef]
  15. Mitterboeck, M.; Korjenic, A. Analysis for improving the passive cooling of building’s surroundings through the creation of green spaces in the urban built-up area. Energy Build. 2017, 148, 166–181. [Google Scholar] [CrossRef]
  16. Gaitani, N.; Spanou, A.; Saliari, M.; Synfeta, A.; Vassilakopoulou, K.; Papadopoulou, K.; Pavlou, K.; Santamouris, M.; Papaioanou, M.; Lagoudaki, A. Improving the microclimate in urban areas: A case study in the centre of Athens. Build. Serv. Eng. Res. Technol. 2011, 32, 53–71. [Google Scholar] [CrossRef]
  17. Rafiee, A.; Dias, E.; Koomen, E. Local impact of tree volume on nocturnal urban heat island: A case study in Amsterdam. Urban For. Urban Green. 2016, 16, 50–61. [Google Scholar] [CrossRef]
  18. Chatzidimitriou, A.; Yannas, S. Microclimate design for open spaces: Ranking urban design effects on pedestrian thermal comfort in summer. Sustain. Cities Soc. 2016, 26, 27–47. [Google Scholar] [CrossRef]
  19. Takács, Á.; Kiss, M.; Hof, A.; Tanacs, E.; Gulyas, A.; Kantor, M. Microclimate modification by urban shade trees–an integrated approach to aid ecosystem service based decision-making. Procedia Environ. Sci. 2016, 32, 97–109. [Google Scholar] [CrossRef]
  20. Kong, L.; La Lun-Lau, K.; Yuan, C.; Ren, C.; Ng, E. Regulation of outdoor thermal comfort by trees in Hong Kong. Sustain. Cities Soc. 2017, 31, 12–25. [Google Scholar] [CrossRef]
  21. Shashua-Bar, L.; Pearlmutter, D.; Erell, E. The influence of trees and grass on outdoor thermal comfort in a hot-arid environment. Int. J. Clim. 2011, 31, 1498–1506. [Google Scholar] [CrossRef]
  22. Oliveira, S.; Andrade, H.; Vaz, T. The cooling effect of green spaces as a contribution to the mitigation of urban heat: A case study in Lisbon. Build. Environ. 2011, 46, 2186–2194. [Google Scholar] [CrossRef]
  23. Tsilini, V.; Papantinou, S.; Kolokotsa, D.D.; Efpaxia, A.M. Urban gardens as a solution to energy poverty and urban heat island. Sustain. Cities Soc. 2015, 14, 323–333. [Google Scholar]
  24. Zölch, T.; Madespacher, J.; Wamsler, C.; Pauliet, S. Using green infrastructure for urban climate-proofing: An. evaluation of heat mitigation measures at the micro-scale. Urban For. Urban Green. 2016, 20, 305–316. [Google Scholar]
  25. Kuo, F.E.; Faber Taylor, A. A Potential Natural Treatment for Attention-Deficit/Hyperactivity Disorder: Evidence From a National Study. Am. J. Public Health 2004, 94, 1580–1586. [Google Scholar] [CrossRef] [Green Version]
  26. Pretty, J.; Paecock, J.; Sellens, M.; Griffin, M. The mental and physical health outcomes of green exercise. Int. J. Environ. Health Res. 2005, 15, 319–337. [Google Scholar] [CrossRef] [PubMed] [Green Version]
  27. Elmendorf, W. The importance of trees and nature in community: A review of the relative literature. Arboric. Urban For. 2008, 34, 152–156. [Google Scholar]
  28. Nikolopoulou, M.; Lykoudis, S. Thermal comfort in outdoor urban spaces: Analysis across different European countries. Build. Environ. 2006, 41, 1455–1470. [Google Scholar] [CrossRef] [Green Version]
  29. Shooshtarian, S.; Rajagopalan, P.; Wakefield, R. Effect of seasonal changes on usage patterns and behaviours in educational precinct in Melbourne. Urban Clim. 2018, 26, 133–148. [Google Scholar] [CrossRef]
  30. Martinelli, L.; Lin, T.P.; Matzarakis, A. Assessment of the influence of daily shadings pattern on human thermal comfort and attendance in Rome during summer period. Build. Environ. 2015, 92, 30–38. [Google Scholar] [CrossRef]
  31. Lin, T.-P.; Matzarakis, A.; Hwang, R.L. Shading effect on long-term outdoor thermal comfort. Build. Environ. 2010, 45, 213–221. [Google Scholar] [CrossRef]
  32. Chen, L.; Wen, Y.; Zhang, L.; Xiang, W.L. Studies of thermal comfort and space use in an urban park square in cool and cold seasons in Shanghai. Build. Environ. 2015, 94, 644–653. [Google Scholar] [CrossRef]
  33. Jim, C.; Chen, W.Y. Perception and attitude of residents toward urban green spaces in Guangzhou (China). Environ. Manag. 2006, 38, 338–349. [Google Scholar] [CrossRef] [PubMed]
  34. Sanesi, G.; Chiarello, F. Residents and urban green spaces: The case of Bari. Urban For. Urban Green. 2006, 4, 125–134. [Google Scholar] [CrossRef]
  35. Lafortezza, R.; Carrus, G.; Sanesi, G.; Davies, C. Benefits and well-being perceived by people visiting green spaces in periods of heat stress. Urban For. Urban Green. 2009, 8, 97–108. [Google Scholar] [CrossRef]
  36. Taha, H. Urban climates and heat islands: Albedo, evapotranspiration, and anthropogenic heat. Energy Build. 1997, 25, 99–103. [Google Scholar] [CrossRef]
  37. Taleghani, M.; Tenpierk, M.; Dobbelsteen, A.; Sailor, D.J. Heat mitigation strategies in winter and summer: Field measurements in temperate climates. Build. Environ. 2014, 81, 309–319. [Google Scholar] [CrossRef]
  38. Doick, K.J.; Peace, A.; Hutchings, T.R. The role of one large greenspace in mitigating London’s nocturnal urban heat island. Sci. Total Environ. 2014, 493, 662–671. [Google Scholar] [CrossRef] [PubMed]
  39. Stocco, S.; Cantón, M.A.; Correa, E.N. Design of urban green square in dry areas: Thermal performance and comfort. Urban For. Urban Green. 2015, 14, 323–335. [Google Scholar] [CrossRef]
  40. Jansson, C.; Jansson, P.E.; Gustafsson, D. Near surface climate in an urban vegetated park and its surroundings. Theor. Appl. Clim. 2007, 89, 185–193. [Google Scholar] [CrossRef]
  41. Saaroni, H.; Amorim, J.H.; Hiemstra, J.A.; Pearlmutter, D. Urban Green Infrastructure as a tool for urban heat mitigation: Survey of research methodologies and findings across different climatic regions. Urban Clim. 2018, 24, 94–110. [Google Scholar] [CrossRef]
  42. Lenzholzer, S.; Klemm, W.; Vasilikou, C. Qualitative methods to explore thermo-spatial perception in outdoor urban spaces. Urban Clim. 2018, 23, 231–249. [Google Scholar] [CrossRef] [Green Version]
  43. Shooshtarian, S.; Rajagopalan, P.; Sagoo, A. A comprehensive review of thermal adaptive strategies in outdoor spaces. Sustain. Cities Soc. 2018, 41, 647–665. [Google Scholar] [CrossRef]
  44. Thorsson, S.; Lindqvist, M.; Lindqvist, S. Thermal bioclimatic conditions and patterns of behaviour in an urban park in Göteborg, Sweden. Int. J. Biometeorol. 2004, 48, 149–156. [Google Scholar] [CrossRef] [PubMed]
  45. Nikolopoulou, M.; Steemers, K. Thermal comfort and psychological adaptation as a guide for designing urban spaces. Energy Build. 2003, 35, 95–101. [Google Scholar] [CrossRef]
  46. Salata, F.; Golasi, I.; de Lieto Vollaro, R.; de Lieto Vollaro, A. Outdoor thermal comfort in the Mediterranean area. A transversal study in Rome, Italy. Build. Environ. 2016, 96, 46–61. [Google Scholar] [CrossRef]
  47. Elnabawi, M.H.; Hamza, N.; Dudek, S. Thermal perception of outdoor urban spaces in the hot arid region of Cairo, Egypt. Sustain. Cities Soc. 2016, 22, 136–145. [Google Scholar] [CrossRef]
  48. Nikolopoulou, M.; Lykoudis, S. Use of outdoor spaces and microclimate in a Mediterranean urban area. Build. Environ. 2007, 42, 3691–3707. [Google Scholar] [CrossRef] [Green Version]
  49. Da Silveira Hirashima, S.Q.; de Assis, E.S.; Nikolopoulou, M. Daytime thermal comfort in urban spaces: A field study in Brazil. Build. Environ. 2016, 107, 245–253. [Google Scholar] [CrossRef] [Green Version]
  50. Klemm, W.; Heusinkveld, B.G.; Lenzolzer, S.; Jacobs, M.H.; van Hove, B. Psychological and physical impact of urban green spaces on outdoor thermal comfort during summertime in The Netherlands. Build. Environ. 2015, 83, 120–128. [Google Scholar] [CrossRef]
  51. Yang, X.; Zhao, L. Diurnal Thermal Behavior of Pavements, Vegetation, and Water Pond in a Hot-Humid City. Buildings 2016, 6, 2. [Google Scholar] [CrossRef]
  52. Parsons, K. Human Thermal Environments: The Effects of Hot, Moderate and Cold Environments on Human Health, Comfort and Performance; CRC Press: Boca Raton, FL, USA, 2014. [Google Scholar]
  53. Koc, C.B.; Osmond, P.; Peters, A. Evaluating the cooling effects of green infrastructure: A systematic review of methods, indicators and data sources. Sol. Energy 2018, 166, 486–508. [Google Scholar]
  54. Stathopoulos, T.; Wu, H.; Zacharias, J. Outdoor human comfort in an urban climate. Build. Environ. 2004, 39, 297–305. [Google Scholar] [CrossRef]
  55. Oliveira, S.; Andrade, H. An initial assessment of the bioclimatic comfort in an outdoor public space in Lisbon. Int. J. Biometeorol. 2007, 52, 69–84. [Google Scholar] [CrossRef] [PubMed]
  56. Tseliou, A.; Tsiros, I.X.; Nikolopoulou, M. Seasonal differences in thermal sensation in the outdoor urban environment of Mediterranean climates—The example of Athens, Greece. Int. J. Biometeorol. 2017, 61, 1191–1208. [Google Scholar] [CrossRef] [PubMed]
  57. Wang, Y.; Groot, R.; Bakkler, F.; Wortche, H.; Leemans, R. Thermal comfort in urban green spaces: A survey on a Dutch university campus. Int. J. Biometeorol. 2017, 61, 87–101. [Google Scholar] [CrossRef] [PubMed]
  58. Givoni, B.; Noguchi, M.; Sarroni, H.; Pochter, O.; Yaacov, Y.; Feller, N.; Becker, S. Outdoor comfort research issues. Energy Build. 2003, 35, 77–86. [Google Scholar] [CrossRef]
  59. DAmbrosio Alfano, F.R.; Olesen, B.W.; Palella, B.I. Povl Ole Fanger’s impact ten years later. Energy Build. 2017, 152, 243–249. [Google Scholar] [CrossRef]
  60. Hirashima, S.Q.d.S.; Katzschner, A.; Gomes Ferreira, D.; Sad de Assis, E.; Karzschenr, L. Thermal comfort comparison and evaluation in different climates. Urban Clim. 2018, 23, 219–230. [Google Scholar] [CrossRef]
  61. Golasi, I.; Salata, F.; de Lieto Vollaro, E.; Coppi, M. Thermal Perception in the Mediterranean Area: Comparing the Mediterranean Outdoor Comfort Index (MOCI) to Other Outdoor Thermal Comfort Indices. Energies 2016, 9, 550. [Google Scholar] [CrossRef]
  62. Cohen, P.; Potchter, O.; Matzarakis, A. Human thermal perception of Coastal Mediterranean outdoor urban environments. Appl. Geogr. 2013, 37, 1–10. [Google Scholar] [CrossRef]
  63. Andrade, H.; Alcoforado, M.J.; Oliveira, S. Perception of temperature and wind by users of public outdoor spaces: Relationships with weather parameters and personal characteristics. Int. J. Biometeorol. 2011, 55, 665–680. [Google Scholar] [CrossRef]
  64. Tseliou, A.; Tsiros, I.X.; Nikolopoulou, M.; Papadopolous, G. Outdoor thermal sensation in a Mediterranean climate (Athens): The effect of selected microclimatic parameters. Arch. Sci. Rev. 2016, 59, 190–202. [Google Scholar] [CrossRef]
  65. Agencia Estatal de Meterologia y Instituto de Metorologia. Atlas Climático Ibérico/Iberian Climate Atlas; AEM: Madrid, Spain, 2011. [Google Scholar]
  66. International Organization for Standardization. Ergonomics of the Thermal Environment–Estimation of Thermal Insulation and Water Vapour Resistance of a Clothing Ensemble; IOS: Geneva, Switzerland, 2007. [Google Scholar]
  67. International Organization for Standardization. Ergonomics of the Thermal Environment—Determination of Metabolic Rate; BSI Group: London, UK, 2004. [Google Scholar]
  68. International Organization for Standardization. Ergonomics of the Thermal Environment—Assessment of the Influence of the Thermal Environment Using Subjective Judgement Scalesl; BSI Group: London, UK, 2006. [Google Scholar]
  69. International Organization for Standardization. Ergonomics of the Thermal Environment-INSTRUMENTS for Measuring Physical Quantities; ISO: Geneva, Switzerland, 1998. [Google Scholar]
  70. Tyrrell, S. SPSS: Stats Practically Short and Simple; Sidney Tyrrell & Ventus Publishing: Sidney, Australia, 2009. [Google Scholar]
  71. Garson, G. Logistic Regression: Binary and Multinomial (Blue Book Series); Statistical Associates Publishers: Asheboro, NC, USA, 2012. [Google Scholar]
  72. Cohen, P.; Potchter, O.; Matzarakis, M. Daily and seasonal climatic conditions of green urban open spaces in the Mediterranean climate and their impact on human comfort. Build. Environ. 2012, 51, 285–295. [Google Scholar] [CrossRef]
  73. Salata, F.; Golasi, I.; de Lieto Vollaro, E.; Bisegna, F.; Nadrechia, F.; Coppi, M.; Gugliermmetti, F.; de Lietto Vollaro, A. Evaluation of different urban microclimate mitigation strategies through a PMV analysis. Sustainability 2015, 7, 9012–9030. [Google Scholar] [CrossRef]
  74. Hsieh, C.-M.; Jan, F.C.; Zhang, L. A simplified assessment of how tree allocation, wind environment, and shading affect human comfort. Urban For. Urban Green. 2016, 18, 126–137. [Google Scholar] [CrossRef]
  75. Trindade da Silva, F.; Engel de Alvarez, C. An integrated approach for ventilation’s assessment on outdoor thermal comfort. Build. Environ. 2015, 87, 59–71. [Google Scholar] [CrossRef]
  76. Hong, B.; Lin, B. Numerical studies of the outdoor wind environment and thermal comfort at pedestrian level in housing blocks with different building layout patterns and trees arrangement. Renew. Energy 2015, 73, 18–27. [Google Scholar] [CrossRef]
  77. Wang, Z.; de Dear, R.; Luo, M.; Lin, B.; He, Y.; Ghahramani, A. Individual difference in thermal comfort: A literature review. Build. Environ. 2018, 138, 181–193. [Google Scholar] [CrossRef]
Figure 1. Monthly climograph of Bragança city. The gray band is the minimum–maximum temperature range (°C); the vertical bars represent the monthly rainfall (mm).
Climate 07 00020 g001
Figure 2. Location of the city of Bragança (Portugal) and of the structured experiment locations: (A) over grass, under solar direct radiation and near a wind shelter (WINDSHELT); (B) over stone-paved ground and under direct solar radiation (SUN); (C) over grass under the shade of a tree (TREE); and (D) over grass under artificial shade provided by a tent (TENT).
Climate 07 00020 g002
Figure 3. (a) Schematic representation of the structured experiment; (b) Study locations: (A) over grass, under solar direct radiation and near a wind shelter (WINDSHELT); (B) over stone-paved ground and under solar direct radiation (SUN); (C) over grass under the shade of a tree (TREE); and (D) over grass under artificial shade provided by a tent (TENT).
Climate 07 00020 g003
Figure 4. Boxplots for meteorological data in the different locations: (a) Air temperature; (b) Relative humidity; (c) Global radiation; (d) Mean radiant temperature; (e) Wind speed.
Climate 07 00020 g004
Figure 5. Thermal sensations frequency distribution: (a) in all locations; (b) by gender (M: male; F: female); (c) in structured experiment locations.
Climate 07 00020 g005
Table 1. Measured meteorological variables and instruments.
VariableInstrument
Air temperature, TaCampbell Scientific, CS215 and Testo, 175H
Globe temperature, TgCampbell Scientific, 107 Thermistor
Relative humidity, RHCampbell Scientific, CS215 and Testo, 175H
Wind speed, VR.M. Young, 05103
Global solar radiation, StKipp & Zonen, CM6B
Table 2. Influence of each variable on thermal sensation (likelihood ratio tests). GEN: gender; Ta: air temperature; V: wind; St: global radiation.
EffectModel Fitting CriteriaLikelihood Ratio Tests
−2 Log Likelihood of Reduced ModelChi-SquareSig.
Ta957.465169.9920.000
V923.757136.2830.000
St818.59731.1230.000
GEN1132.928345.4540.000
Table 3. Parameter estimation for the multinomial logistic model (using neutrality as reference).
Thermal SensationCoefficient (B)Standard DeviationWaldSig.Exp(B)
Cool
−2
Intercept9.5952.37816.2760.000
Ta−0.5280.11122.5670.0000.590
V0.8290.8320.9920.3192.290
St−0.0090.00310.8440.0010.991
GEN2.2540.64612.1680.0009.530
Slightly Cool
−1
Intercept9.5311.64533.5690.000
Ta−0.4260.07037.5920.0000.653
V0.4440.5040.7730.3791.558
St−0.0110.00224.6880.0000.989
GEN1.7750.42517.4380.0005.900
Slightly Warm
+1
Intercept−4.0870.98817.1260.000
Ta0.1020.03210.0940.0011.107
V−0.6000.3333.2400.0720.549
St0.0050.00132.6080.0001.005
GEN−0.3460.3221.1530.2830.708
Warm
+2
Intercept−7.0281.26131.0350.000
Ta0.1450.03914.0760.0001.157
V−1.6230.41115.5550.0000.197
St0.0100.00182.7260.0001.010
GEN−0.5110.3801.8100.1780.600
Hot
3
Intercept−16.1852.13257.6480.000
Ta0.3420.06329.5230.0001.408
V−2.7120.57522.2100.0000.066
St0.0160.00287.4640.0001.016
GEN−0.3270.5210.3940.5300.721
Table 4. Exponent of the correlation coefficient for the variables with influence on personal thermal sensations, expressed in odd ratios.
Thermal Sensation
Variables−2−1123
Ta0.5900.6531.1071.1571.408
V 0.1970.066
St0.9910.9891.0051.0101.016
GEN9.5305.900

