Climate Change-Induced Impacts on Smallholder Farmers in Selected Districts of Sidama, Southern Ethiopia

Geography & Environmental Studies & PhD Fellow in Development Studies at Institute of Policy & Development Research (IPDR), Hawassa University, Ethiopia. Po Box 05 Hawassa, Ethiopia
Climate 2019, 7(5), 70; https://0-doi-org.brum.beds.ac.uk/10.3390/cli7050070
Submission received: 20 April 2019
/
Revised: 15 May 2019
/
Accepted: 16 May 2019
/
Published: 22 May 2019
(This article belongs to the Special Issue Sustainable Agriculture for Climate Change Adaptation)
Abstract
:Different factors control the types of adaptive strategies and likelihoods of experiencing climate change-induced impacts by smallholder farmers. By using a mixed research method, this study examines the types and determinants of climate change-induced impacts on smallholder rural farmers in drought-prone low lands of Sidama, Southern Ethiopia. Randomly selected (401) households were surveyed on climate change-induced impacts. Longitudinal climatic data were also collected from the Ethiopian National Meteorological Agency to assess the trend of rainfall (RF), temperature and drought incidents. The analyses of the data revealed that RF and temperature had shown decreasing and increasing trends, respectively, during the three decades under consideration (1983–2014). These changes in RF and temperature exposed farmers to climate-related epidemics, drought, harvest loss, and hunger. The logit model results revealed that different factors control the likelihood of exposure to climate change-induced impacts. The findings revealed that literacy level, involving women in family decisions and farmers’ involvement in adaptation planning, reduces the likelihood of exposure to climate change-induced hunger. Therefore, there is a need to work on human capital of the farmers through expanding education, strengthening women’s participation in family decision-making, and by improving public participation in climate change adaptation undertakings to minimize climate change-induced impacts.
1. Introduction
Climate change has emerged as one of the development challenges of the 21st century [1,2]. There is high confidence and agreement among the global scientific community that climate change poses a serious threat to current and future sustainable development. According to the forecasts, climate change-induced impacts will continue to affect people, even if anthropogenic greenhouse gasses emissions stop today [3]. Sub-Saharan Africa (SSA), where smallholder farmers dominate agriculture [4], is one of the global hotspots for climate change-induced impacts [5]. In SSA, agriculture directly employs about 175 million people who cultivate degraded lands where there is no reliable supply of water for irrigation [6]. These smallholder farmers in SSA are among the most vulnerable groups to climate change and variability-induced impacts due to dependency on RF, limited use of irrigation, and weak adaptive capacity. Furthermore, limited human and material capacity, poor infrastructure, fragile environments, political instability, and marginalization contributed to the vulnerability in this region [7,8,9,10]. The case is not different in Ethiopia where smallholder farmers, who produce 90% of the total agricultural yield and own 95% of the total cultivated land [11], suffer from different climate change induced-impacts. Most of these subsistent farmers practice rain-fed traditional farming, use little modern agricultural inputs, and have little surplus to sell in local markets. They are not resilient enough to cope with climate change-induced recurrent shocks and long-term impacts [12,13,14]. Although climate change-induced impacts have been recurrent in Ethiopia and in the study area, little is known about the factors that affect the likelihood of exposure to such impacts in Ethiopia and SSA. Thus, by using mixed research strategy, this study presents the types and determinants of climate change induced-impacts on smallholder rural farmers in drought-prone lowland context.
Climate change induced-impacts refers to effects on natural and human systems due to gradual changes in climate, variations in weather and climatic elements from the average, and that of the impacts of climatic extremes. As IPCC report, climate change-induced impacts refer to impacts on human lives, livelihoods, culture, economies, ecosystems, and material resources due to hazardous climatic events over a period of time [3]. Climate change-induced impacts also include consequences and outcomes of the direct impacts including droughts, hunger, famine, loss of life and property, and sea level rise which can be potential or residual (ibid). The former includes impacts that occur due to a projected change in climate without adaptation. The latter refers to the impacts with adaptation [15]. Therefore, in this research, climate change-induced impacts include the immediate effects as well as outcomes and consequences of the immediate effects on human and natural systems. As global warming increases the likelihood of experiencing severe, persistent, and irreversible impacts on natural and human systems will be stronger [3,16]. Greenhouse gas emissions have adverse effects on biodiversity, ecosystem services, and economic development, which are causing risks for livelihoods and human security [17,18]. The 4th IPCC report argues that …by 2020, between 75 million and 250 million people are projected to be exposed to increased water stress due to climate change [15] (p13). Agricultural crop yield in some African countries could be reduced by 50% by 2020 and this can endanger the existence of many smallholder rural farmers.
Climate change-induced impacts have hampered poverty reduction and sustainable development in the Global South [5,19,20]. This is because most climate-related impacts affect the poor, who are struggling to come out of poverty [21]. Furthermore, livelihood strategies and housing conditions of the poor are more vulnerable to climate change and variability-induced impacts [22,23]. The poor usually have houses made of mud, bamboo, straw, and other inexpensive materials that are the most vulnerable to extreme weather events. The poor also cannot buy climate insurance against climate-related risks. Besides the direct impacts on agriculture-related livelihoods, climate change is also indirectly affecting the health and well-being of the poor through its effect on human and livestock health [24,25]. For example, because of increasing surface temperature, malaria is expected to migrate to higher altitudes and cause further health problems, which affect the poor’s income and productivity. According to the World Health Organization (WHO) estimates, global warming causes about 150,000 deaths per year [26]. RF and temperature variability also result in pests and diseases incidents that affect the quantity and the quality of the crop yield [27]. Besides impacts, social strains caused by increased resource scarcity may lead to greater conflict [5,28], with the poor again being the most likely victims.
Erratic RF and higher temperatures characterize the drought-prone lowlands of Sidama. The area is part of the Great East African Rift Valley (GEARV). Climate change-induced impacts such as drought, crop failure, livestock loss, flooding, and water-borne and related diseases (such as diarrhea and malaria) have been recurrent in this area. The problem worsened in 2016 despite various adaptive strategies of the households, communities, and other actors, including the government. This needed a large-scale emergency relief for about 100,000 people, which is highest in recent documented drought history of the area. Despite a few research works on climate change-induced impacts on smallholder farmers, there is a gap in the literature about factors that control the likelihood of exposure to the impacts. Therefore, the main goal of this study is to identify factors that determine the likelihood of exposure to climate-induced impacts on smallholder rural farmers. Identifying such determinants is important for policy-makers, practitioners, and smallholder farmers to identify leverage points to manage the imminent impacts of climate change in the country and beyond.
2. Climate Change-Induced Impacts in Ethiopia
While agriculture is the backbone of Ethiopia’s economy, it is RF dependent and dominated by smallholder subsistent farmers. About 80% of the Ethiopian population lives in rural areas making drought-prone agriculture as the primary means of livelihood. This figure is much higher than the SSA average, which stood at 63% in the year 2014 [11,29]. Furthermore, agriculture constitutes 40% of the GDP, supports 80% of the total employment, and is a source of 90% of the export in Ethiopia [11,30,31]. Nonetheless, climate change-induced impacts are challenging the roles of agriculture for the overall growth of the country [12]. In the 20th century alone, twelve extreme droughts happened in Ethiopia that hampered the economic development of the country. The drought incidents claimed the lives of hundreds of thousands and affected the livelihoods of over 50 million people [32]. Drought incidents have been increasing in recent decades in the country. Eight major droughts had occurred in the last three decades in Ethiopia: 1984/85 1987/88 1991 1994 1997 2002/03 2010/11, and in 2015/16 [32,33].
Previous studies revealed that climate change and variability had exerted significant impacts on agriculture and the overall economic growth in Ethiopia [32,34,35]. Specifically, climate change-induced impacts have hampered the country’s economic growth and effort to move out of poverty. For instance, it was reported that from 1991–2010, the growth estimates were reduced by 2–9% because of climate change-induced impacts [30]. Under the worst-case scenarios, the economic impacts of climate change may reduce Ethiopia’s GDP by up to 8% [36]. On the other hand, another study on climate change impact on agriculture and related sectors revealed a 10% GDP drop from the target [37]. The same study revealed a widening income inequality that could reach up to 20% due to the effect of climate change. In general, with higher vulnerability, and lesser resilience to climate change-induced impacts, the country is projected to experience a 6% decline in total agricultural output in the coming years [38].
Besides the impacts on the national economy, climate change-induced impacts have been affecting health and livelihood status of smallholder farmers in Ethiopia. Some of these impacts include climate-related epidemics, crop failure, flooding, livestock mortality, shortage of water and pasture, migration, and food aid dependency [2,39,40]. Unsustainable adaptation strategies of the farmers, such as selling assets and charcoal production, have resulted in the degradation of assets, environment degradation, and biodiversity losses. Climate change-induced food and water shortages affect the health, educational, and economic status of the households [8]. For instance, during drought events, children are forced to drop out of the school to participate in such household activities as collecting water and fuel-wood from long distances. Malaria affects labor availability at the household level and increases the health expenses of the family.
3. Data and Methods
3.1. Study Area
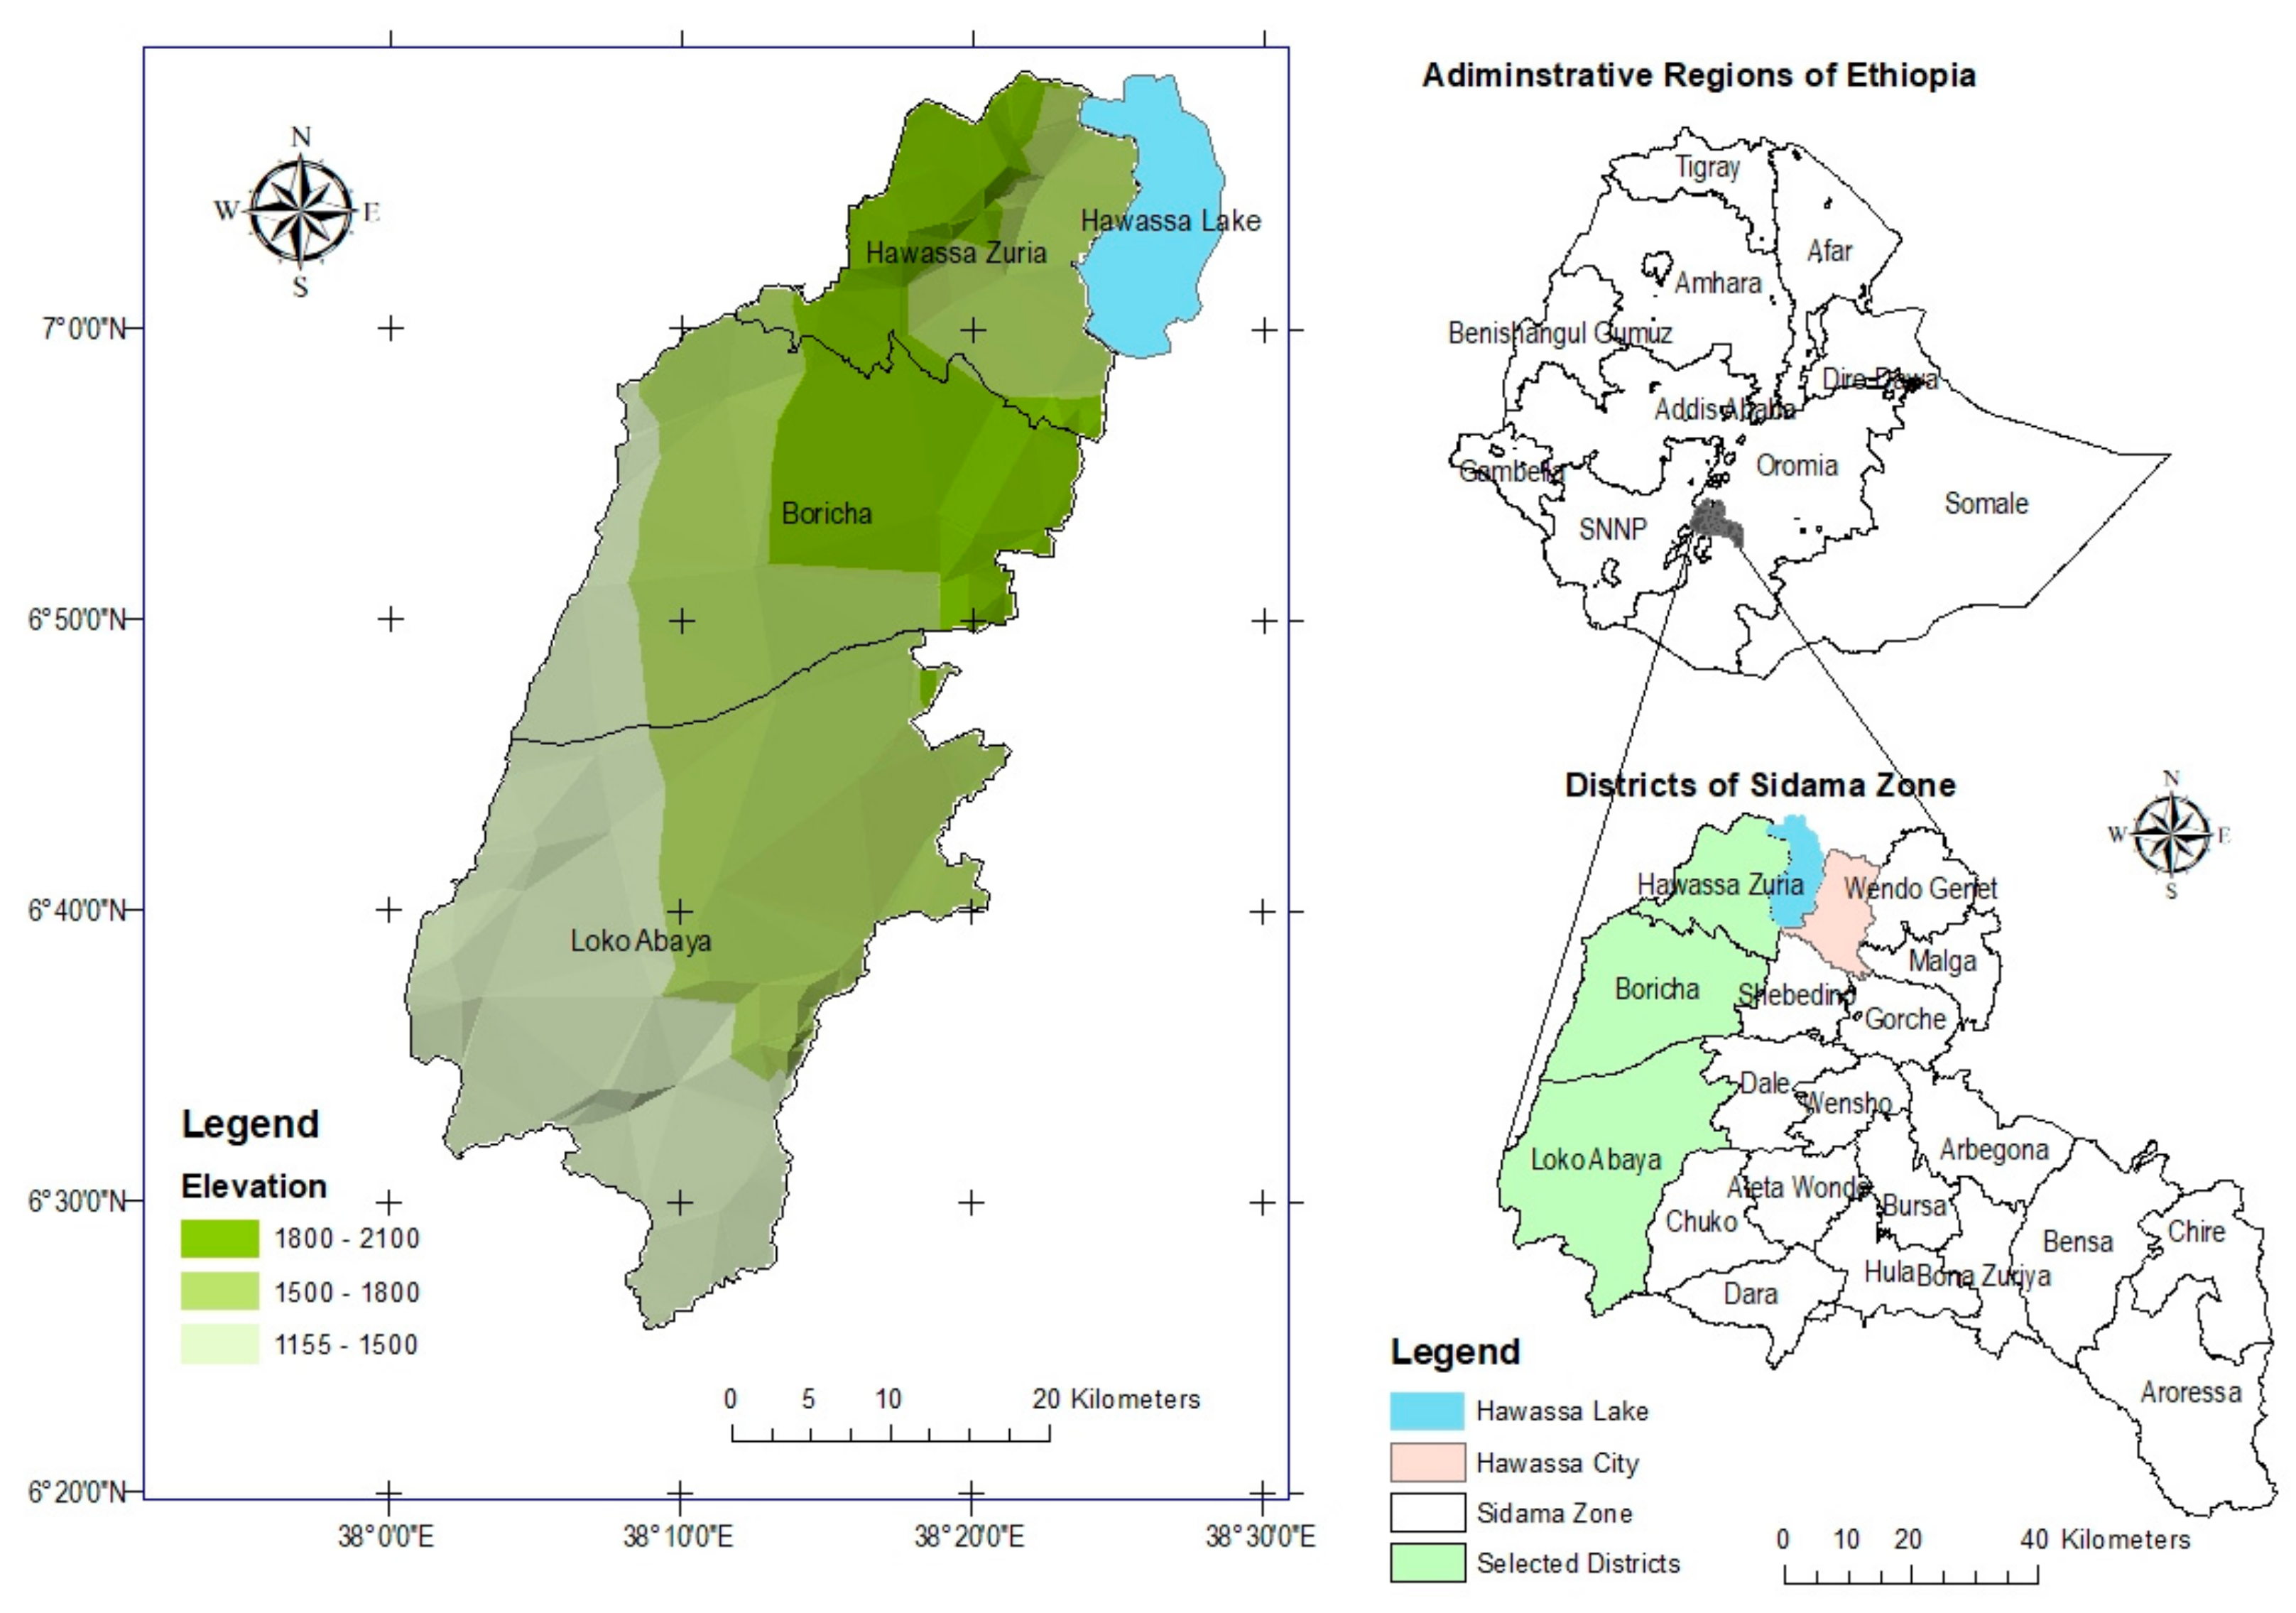
Located in the Horn of Africa, Ethiopia had a population of 94.35 million in 2017, according to the Ethiopian Central Statistical agency. The country has nine regional states and two city administrations. The Southern Nations Nationalities and Peoples’ Regional State (SNNPRS) is one of the nine administrative regions comprising about 20% of the country’s total population and 10% of the land area. The Sidama Administration Zone is one of the 14 administrative zones in the SNNPRS. With a population of 3,677,370 in 2014 [41], it is the most populous zone in the region. The zone is located in the central-eastern part of the region bordered by Oromiya in the North, East, and Southeast, Gedeo Zone in the South, and Wolayita Zone in the west. The zone lies between 6°10′ to 7°05′ North latitude and 38°21′ to 39°11′ East longitude. The total area of the zone is 6981.9 km2 [42].
Three drought-prone districts (Hawassa Zuria, Boricha, and Loka Abaya) were selected for this study (Figure 1). The districts are located in the heart of the East African Rift Valley and they were chosen based on their higher potential risk of exposure to adverse climate change and variability. Variable RF and higher temperatures characterize the districts compared to other districts of the zone. The population of the districts is 576,865 from 113,285 households. About 97% of the population in these districts lives in rural areas where drought-prone agriculture is their source of livelihood. Agro-pastoral communities dominate the southwestern parts of the study area, where climate-related animal diseases are prevalent.
Diverse climate characterizes the drought-prone districts of Sidama Zone. Altitude ranges from 560–2300 meters above sea level and the average annual RF ranges between 700 and 1200 mm. The RF pattern in the area is bimodal, which occurs in the summer and spring seasons. The summer (kiremt) rains last from June to September while the spring (belg) rains usually begin in February and end in late May. Both the kiremt and belg rains are irregular and unpredictable, resulting in frequent losses of harvest and cattle. The region has a bimodal precipitation distribution and high RF variability due to the seasonal progression of the inter-tropical convergence zone (ITCZ), an atmospheric circulation feature often modified by the El Niño–Southern Oscillation (ENSO). Also, there is severe livestock and human diseases (for example, malaria, cholera, and trypanosomiasis) in the area largely due to the inhospitable climate. The perennial Bilate River, which dissects the Wolayita and Sidama Zones, drains the western part of the area. The eastern part lacks perennial rivers, and households largely depend on artificial ponds and hand-dug shallow wells for water for domestic uses and watering livestock. The area experiences severe water shortages when the ponds run out of water during the December–February dry period.
3.2. Data
This study employed a cross-sectional household survey method. Randomly selected 401 rural household heads took part as respondents for the study. The following sampling procedure was applied. Based on their climatic conditions, accessibility, population size, and population density three kebeles from Boricha, two kebeles from Hawassa Zuria, and two kebeles from Loka Abaya districts (a total of seven kebeles) were selected. Accordingly, Hanja Cafa, Haldada Dela, and Korangoge from Boricha district, Muticha Gorbe, and Sala Kore kebeles from Loka Abaya district, and Doyo Cala and Doyo Otilicha kebeles from Hawassa Zuria districts were selected for the study. The ideal sample size was calculated based on the Krejcie and Morgan formula; the maximum sample size at a 95% confidence interval and 5% margin of error for 750,000 people is 382 [43]. Considering attritions of the responses, a 5% contingency (19 HHs) gives 401 households, which were selected from the three districts. The 401 sample size was proportionally distributed based on the number of households in each district. So, 189 HHs from Boricha, 93 HHs from Loka Abaya, and 119 HHs from Hawassa Zuria districts were included for this study. The respondents were household heads who were selected by using systematic random sampling. Female-headed households were also included proportionately in all the districts (Table 1).
The field data collection process took place from April to May 2017 with trained data collectors supervised by the researcher. More data were gathered through focus group discussions, interviews with key informants, and field observation. The study also used RF data collected from the National Meteorological Agency of Ethiopia for the period 1983–2014 to support other data.
The RF data was analyzed by using trend analysis, Mann–Kendall’s rank test, and standard RF anomalies (SRA). The SRA refers to standard RF anomaly and Pi and Pµ represent RF of a given year and the mean RF, respectively. Accordingly, the result helps to classify temperature RF condition into different categories (Table 2).
The collected quantitative data were encoded into STATA software (Version 14.2), and various descriptive and inferential techniques (mean, percent, standard deviation, and logit model) were used to analyze and interpret the results. The logit model analysis was carried out by using the STATA software to identify the determinants of climate change-induced effects on smallholder farmers. The qualitative data were analyzed via systematic thematization to augment the quantitative results.
3.3. Model Specifications
A logit model is a statistical approach used when the dependent variable (DV) is nominal with two or more categories commonly grouped as dummy variables (Table 3). On the other hand, the independent (predictor) variables (IVs) in a logit model can be qualitative (nominal or ordinal level) and interval/ratio level variables. This study used a logit model to identify factors that control the likelihood of households’ exposure to climate change-induced impacts. Climate change-induced impacts considered in this study include the likelihoods to exposure to drought, harvest loss, flooding, and hunger. The exposure to hunger is examined vis-à-vis eighteen socio-economic and institutional s (Table 2). The eighteen dependent variables were selected among other socioeconomic and institutional variables after all the variables were tested to have a relationship with the four dependent variables considered for this study. The logit model showed that the selected eighteen variables have some explanatory power on the dependent variables considered.
Logistic regression involves a linear function:
where Z is a dependent variable and Xi…Xn are explanatory variables.
The logistic regression function is thus, given by:
where is the probability that an event occurs; and the odds in favor of the occurrence are related according to = = .
Thus, odds is defined for an event with probability and the logit is the log of the odds, i.e.;
Model - p(x) = probability of the event occurring at (Y=(x))
A smaller sample size with a large number of predictors creates problems with the analysis, specifically when there are categorical predictors with limited cases in each category. Descriptive statistics were run for each of the predictors to solve the problem. The result showed that all categorical variables have a required number of cases set as a minimum standard [44]. A multicollinearity test was done to check for high intercorrelations among predictor (independent) variables. The test result suggested that the maximum r-value of the independent variables is 0.7, which is within an acceptable limit [44]. The presence of outliers or cases that would not well be explained by the model was also checked to make sure the model fits the data well. The model tried to find out factors that control the HHs likelihood of exposure to climate-induced impacts such as the exposure to the effects of drought, harvest loss, flooding, and hunger in the study area. R2 and adjusted R2 were also used to discuss the amount of variation explained by the independent variables. The former supposes that every independent variable in the model explains the variation in the dependent variable by explaining the variation in percent as if all independent variables in the model affect the dependent variable. On the other hand, the adjusted R2 gives the percentage of variation explained by independent variables that in reality, affect the dependent variable. In this context, it is also called marginal effect after logit.
4. Results and Discussion
4.1. RF Condition and Drought Incidents
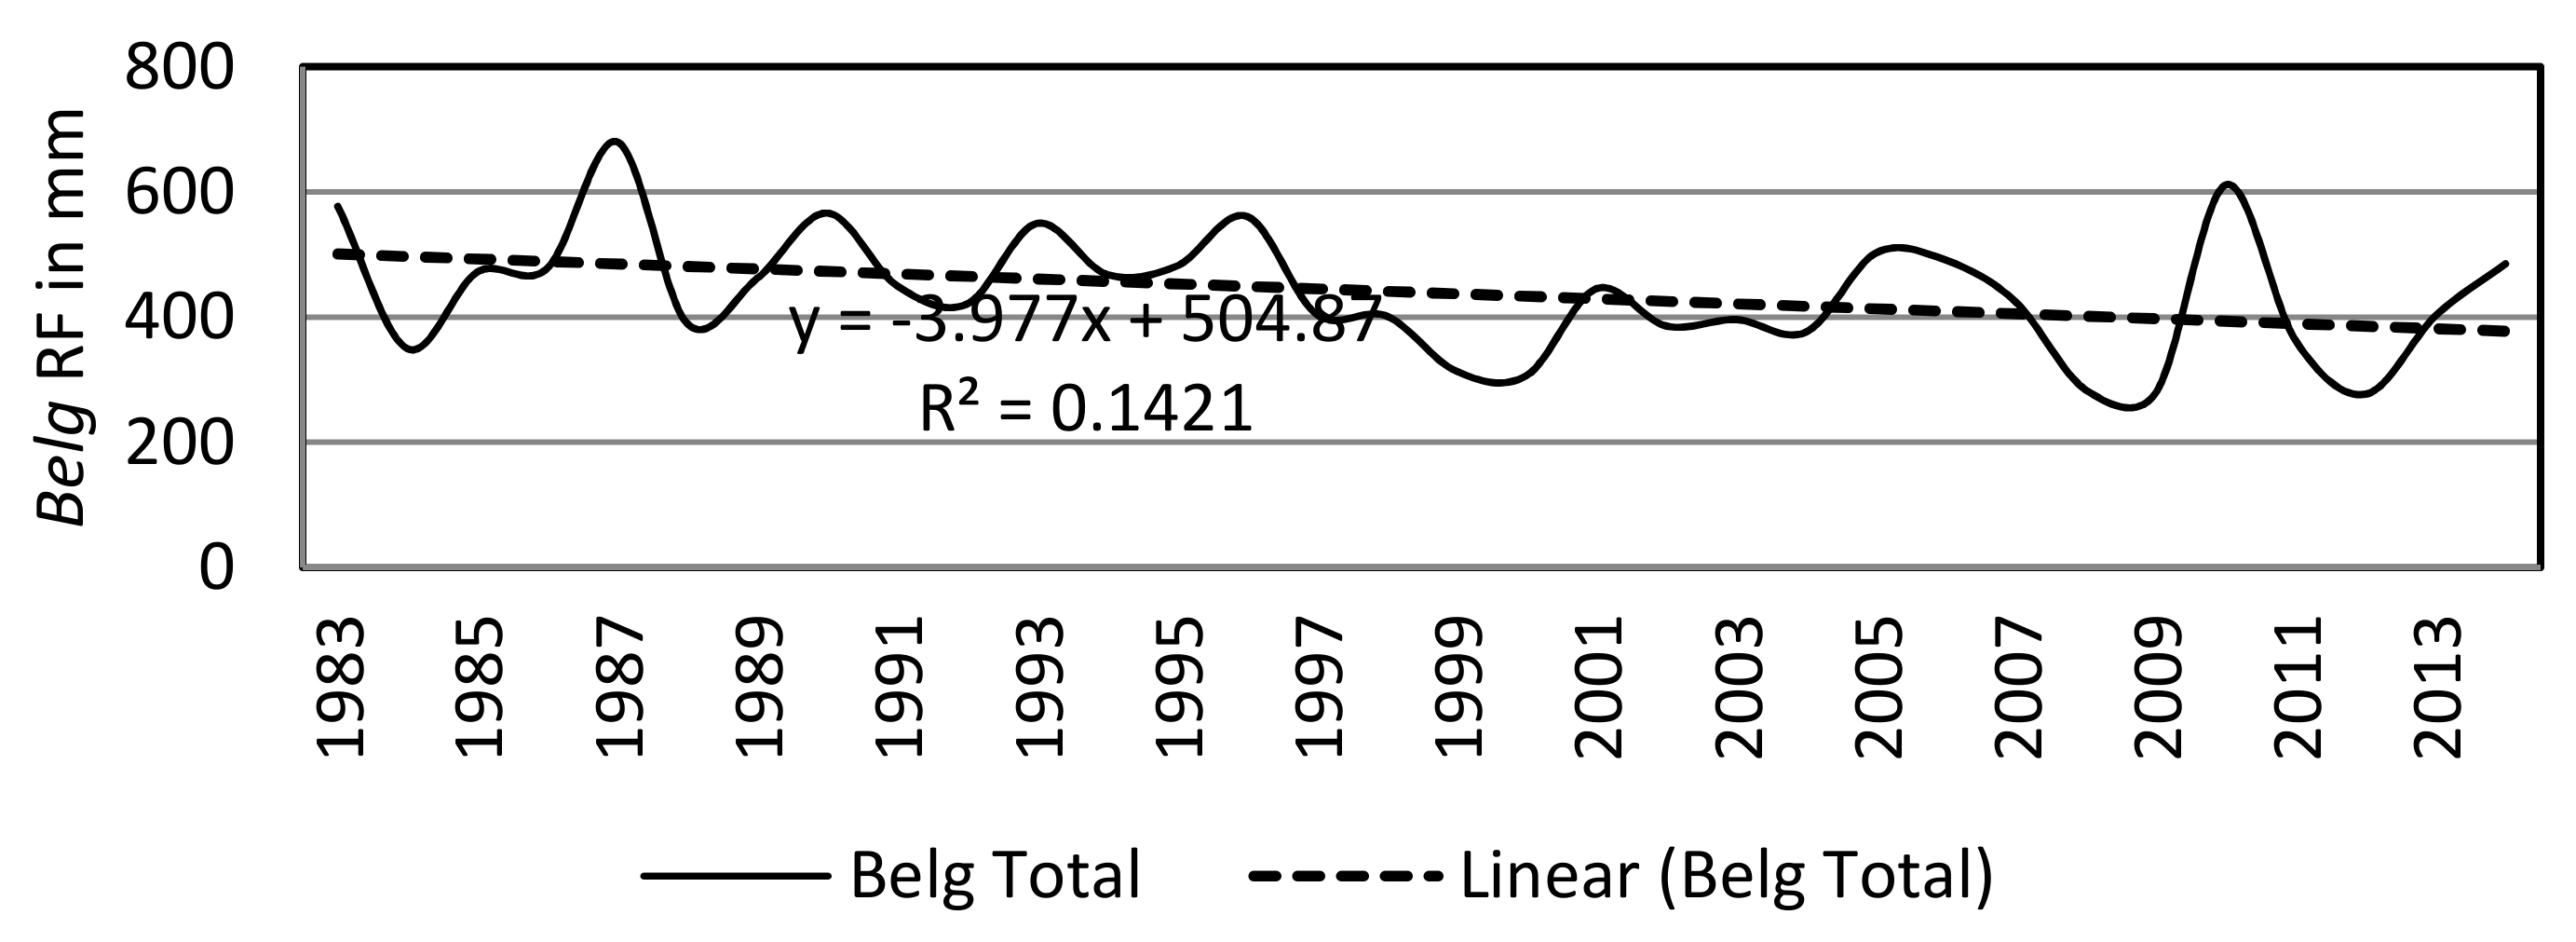
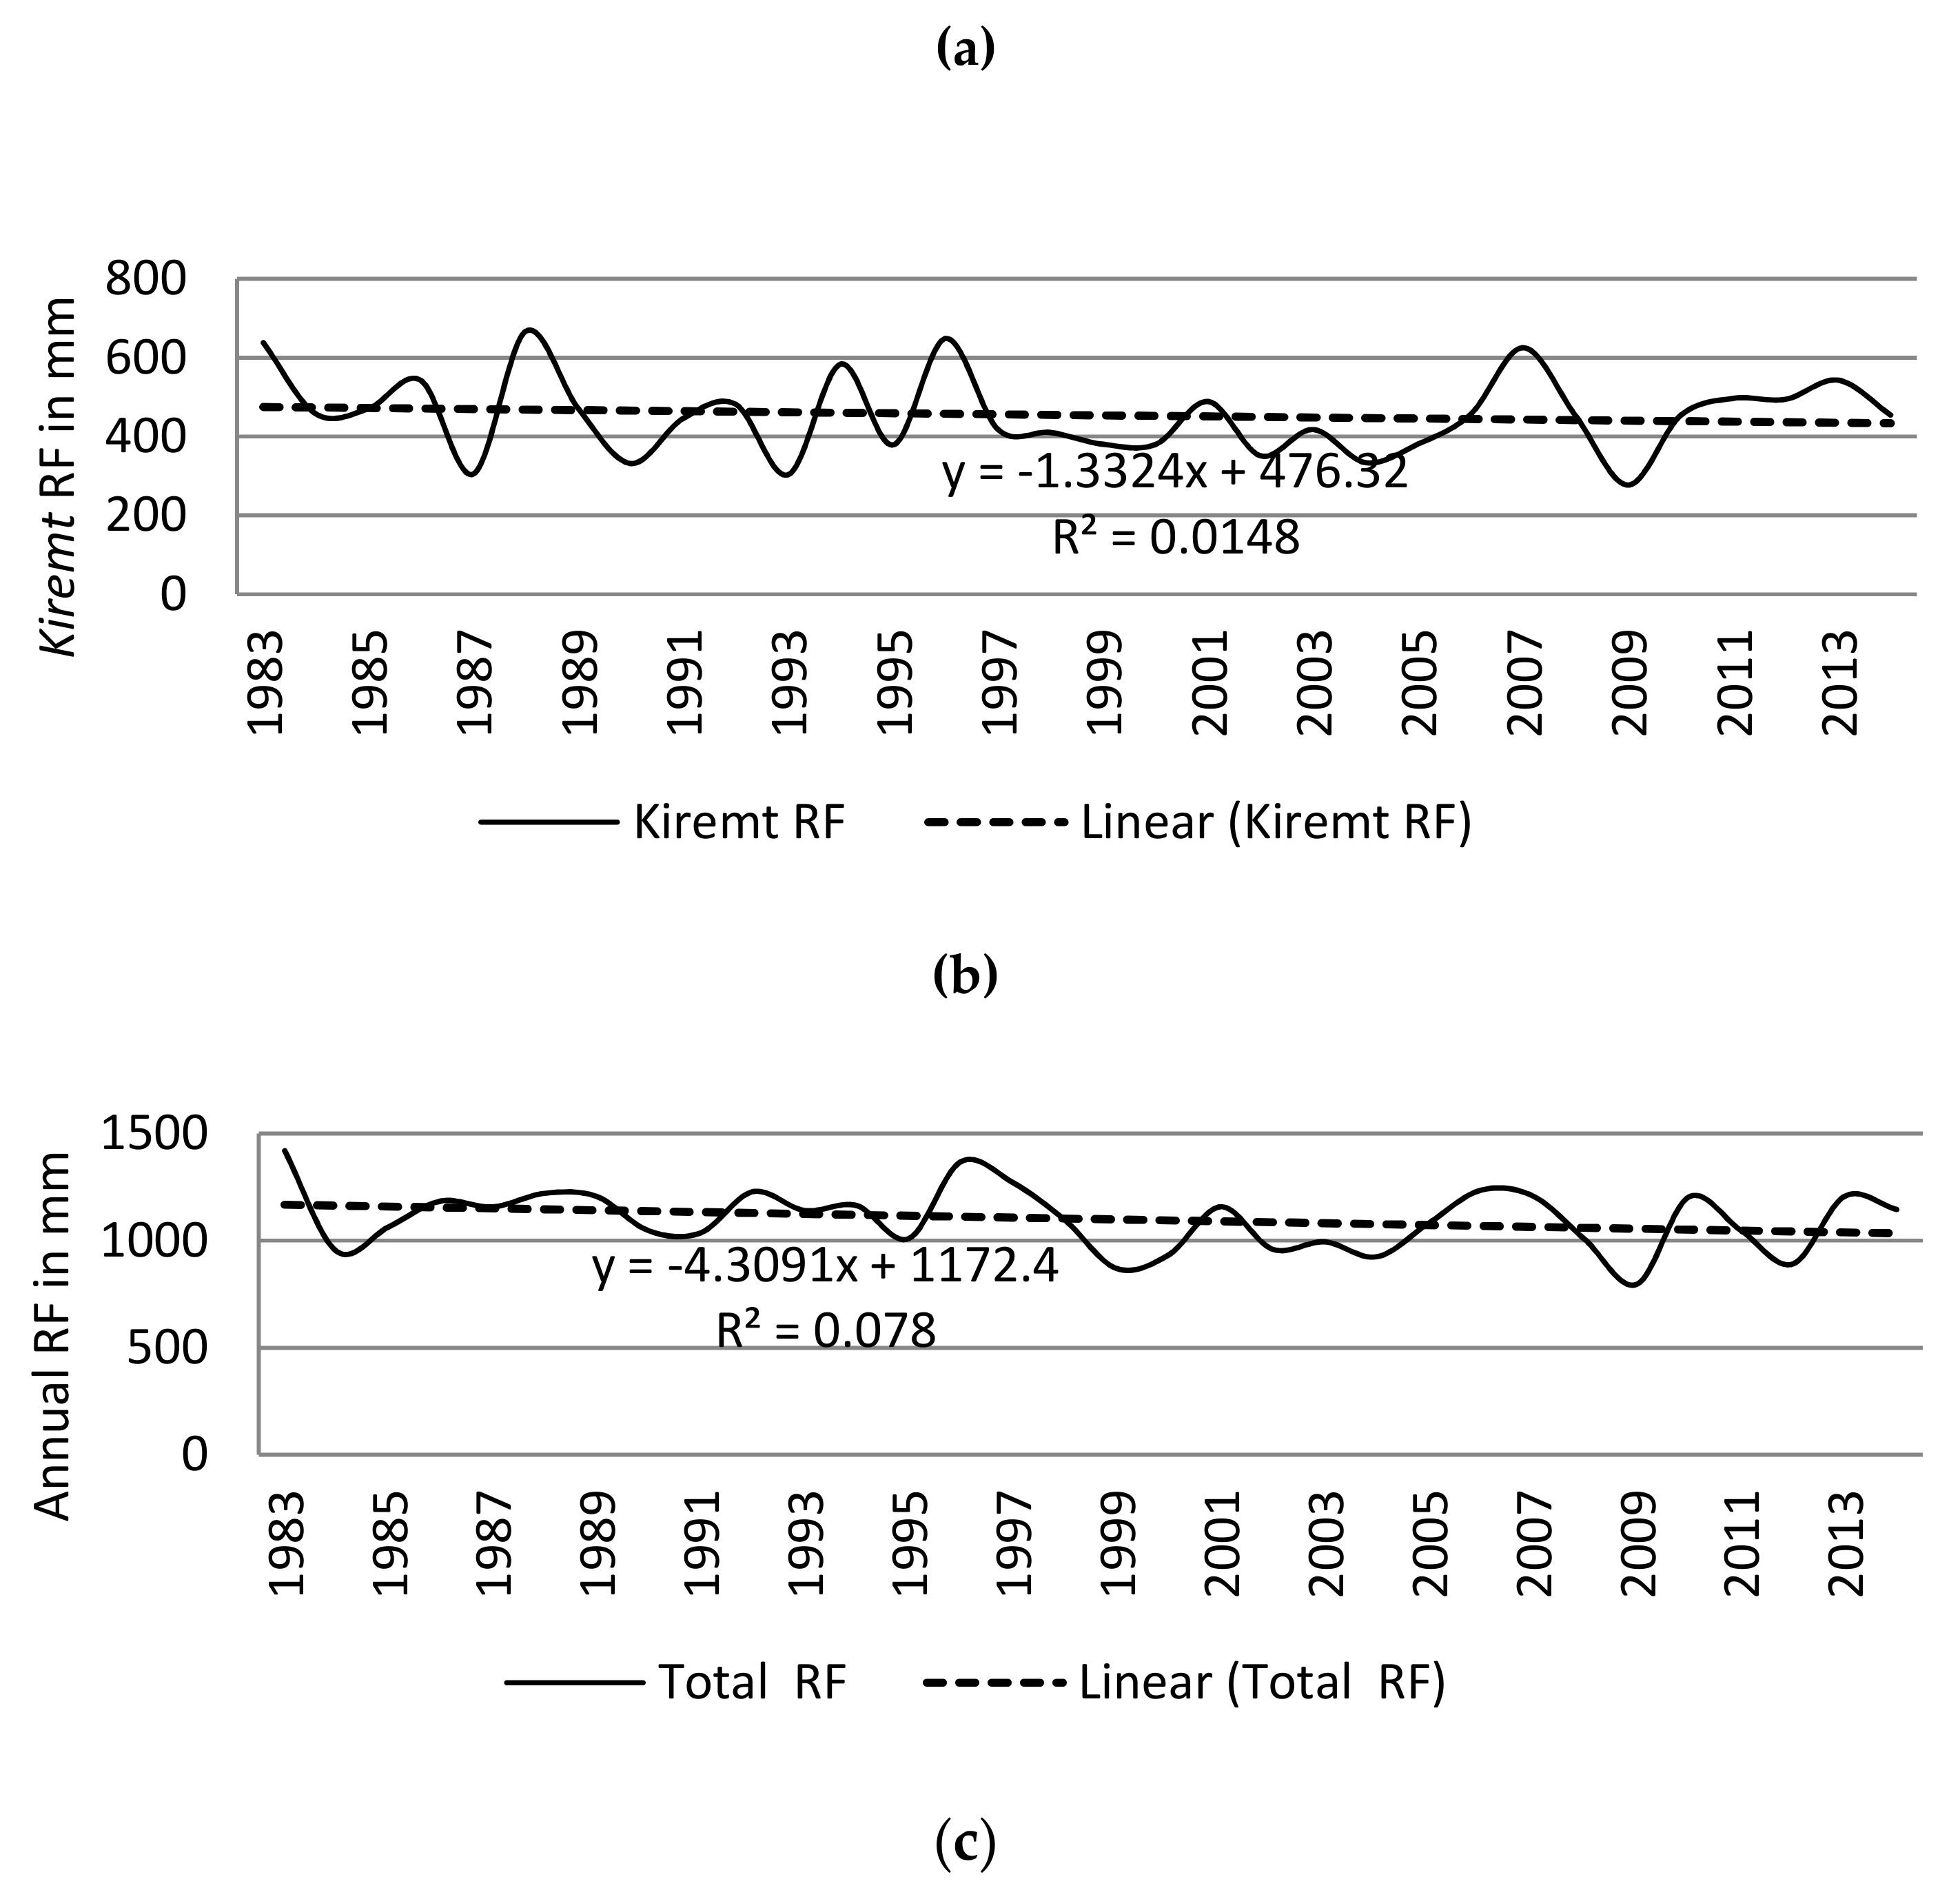
Studies on RF over Ethiopia revealed high variability and drought incidents [32,35,45]. Similarly, the analyses of RF data have shown declining RF trends and incidents of drought during the years under consideration (1983–2014). Annual and growing season (belg and kiremt) RF amounts had shown declining trends in the study area. The belg season (February, March, April, and May) RF accounts for 40% of the annual RF in the study area. It is an important season not only to grow short-growing season crops, but also it provides water for livestock and helps the growth of pasture. Though the current study does not check daily RF data of the growing seasons, the experts and focus group discussion participants reported that problems related to its onset, duration, and offset have serious consequence on food security in the study area. However, despite its huge role for livelihood security, it has shown a significant (p ≤ 0.05) declining trend in the last three decades (Figure 2a, Table 3). The kiremt season (June, July, August, and September) is the main rain growing season in the study area which accounts for 41% of the total annual RF. Kiremt RF has also shown a declining trend over the years under consideration (Figure 2b), though the trend is not statistically significant (Table 3). The trend analysis of annual RF data has also revealed a declining trend, though the result is statistically insignificant (Table 3). The annual RF had varied from its average amount, which amounts to 1100 mm. The year 2009 was the driest year among the years under consideration with the annual amount of 796.37 mm. The years 1984, 1999, 2000, 2002, 2003, 2004, and 2009 were the drier with annual RF of 950.44 mm, 870.1 mm, 934.02 mm, 960.09 mm, 994.71 mm, and 925.08 mm, respectively.
The years 1983 and 1996 were the wettest years with annual RF amounts of 1420.42 mm and 1368.41 mm, respectively (Figure 3). On the other hand, the analysis of minimum, maximum, and mean monthly temperature had shown increasing trends, all of which are statistically significant
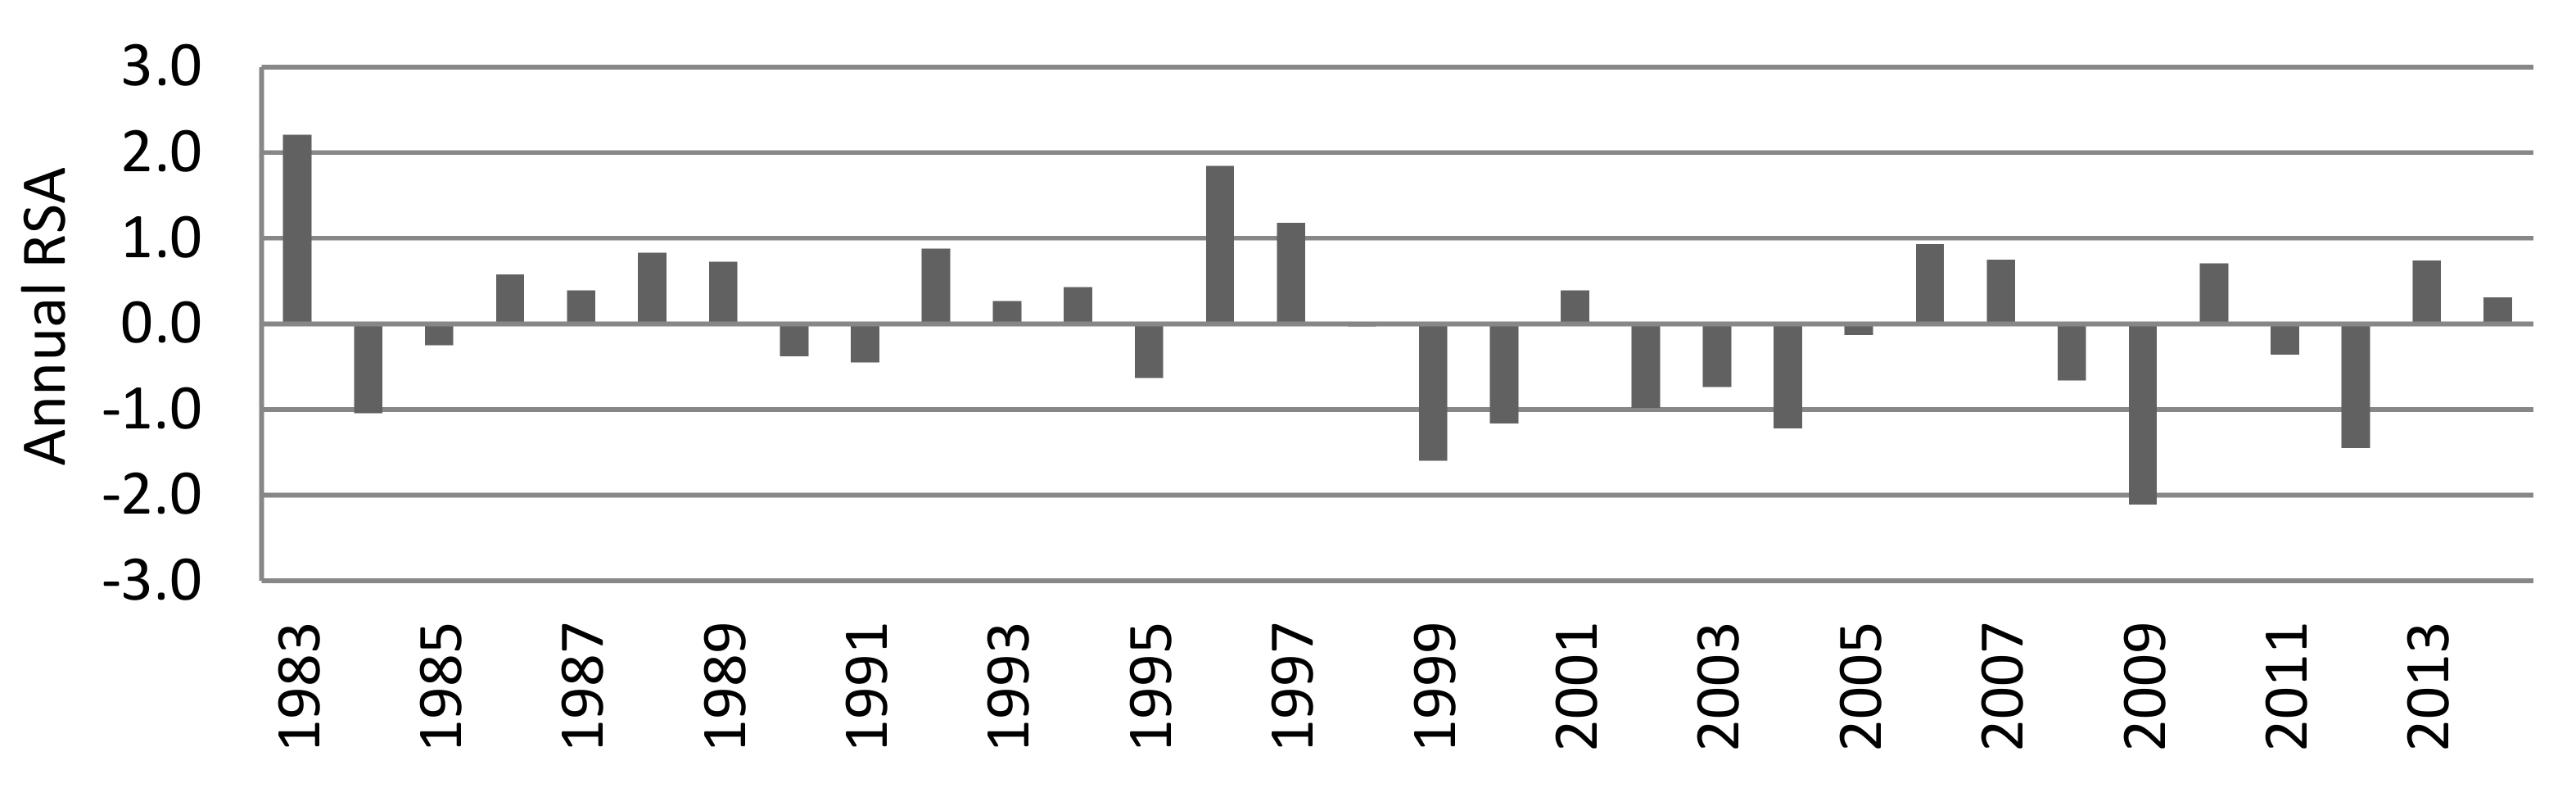
The RF Standard Anomalies (RSA) helps to estimate the extent of drought based on the RF data [46] (Table 4).
The analysis of annual RSA pointed out seven droughts incidents of different extent during the three decades under consideration. The year 2009 with annual SRA value of −2.11 was the driest year in the last three decades, which coincides with the 2009/10 extreme drought all over the country. The years 1999 and 2012 were also years of severe drought in the study area with SRA vales of −1.6 and −1.45, respectively. The other four moderate drought years were in 1984 (SRA = −1.04) 2000 (SRA = −1.16) 2002 (SRA = −0.98), and 2004 (SRA = −1.22) (Figure 3).
4.2. Types of Climate Change-Induced Impacts
Drought and flooding are the most common climate change variability-induced risks in Ethiopia [2,39,47]. The findings of this study nevertheless revealed other climate change-induced impacts that are recurrent in the study area. The common ones include climate-induced seasonal epidemics, drought, harvest loss, flooding, hunger, migration, and school dropout [48].
4.2.1. Climate Change and Variability Related Epidemics
Climate change-related epidemics globally claim over 150,000 lives per year [26]. Studies on the health impact of anthropogenic climate change show that climate change is affecting human health. Diseases such as cardiovascular mortality, respiratory illnesses, water-related contagious diseases, and malnutrition are directly or indirectly associated with climate change [24,26,27,28,29,30,31,32,33,34,35,36,37,38,39,40,41,42,43,44,45,46,47,48,49,50]. Malaria, cholera, and animal diseases were the major climate change and variability induced epidemics reported by the HHs in the study area. Of the total respondents asked about the incidence of malaria in their locality, 46% (n = 183) said that they had suffered from a malaria epidemic in their family. Malaria has been the most prevalent disease in the study area and its prevalence increases in the wet season from May to November. During wet seasons, the availability of moisture creates a conducive environment for mosquitos to breed and spread, such as those places left open to harvest rainwater.
On the other hand, thirty-five percent (n = 138) of the households reported cholera incidences. Water supply coverage in the study area has been marginal because of poor hydro-geological conditions and limited resources to improve water supply coverage. Water scarcity forces people to use untreated water for domestic consumptions. Key informants in Boricha district said that such incidences usually happen during water-scarce seasons where families resort to using unsafe water for domestic consumptions. Diarrheal diseases incidents are very common during the dry season (from December to March) affecting health and household labor availability in the area. Twenty-one percent (n = 85) of the study participants also reported the prevalence of animal diseases. The problem is more acute for agro-pastoral communities living in the western parts of the study area, especially in Loka Abaya district. Some HHS also reported the prevalence of animal diseases, such as trypanosomiasis. It affects animal farming in the study area. About 21% (n = 81) of respondents reported that they had experienced climate change-related livestock diseases. Trypanosomiasis is one of the tropical livestock diseases, which has widely spread all over the SSA [51,52]. The World Health Organization (WHO) has also pointed out that climate change induced animal diseases are affecting cattle header Maasai pastoralist communities living in Tanzania and Kenya [53].
4.2.2. Drought
Drought is a climatic condition, which occurs when there is a RF below its normal pattern for a long period of time [54]. Drought has happened in the study area every year since 2000, compelling large-scale relief intervention by government and international donors. A prolonged delay or a total absence of the rains during the two growing seasons (belg and kiremt) adversely affects crop and livestock productivity. About 84% (n = 336) of the households interviewed reported to have suffered from drought-related effects in the last ten years. During the dry season, pastoral household members travel eight to ten hours every other day to water their livestock at the Hawassa Lake or Bilate River. Such long-distance trekking undoubtedly hinders household heads or other family members from devoting enough time to other livelihoods and, therefore, incurring further economic losses. To support the farmers’ drought incident experience with the RF data, the researchers carried out RSA analysis. The result pointed out decreasing annual, summer, and spring RF amounts for the years under consideration. The SRA results pointed out that seven drought events of different extent occurred in the study area of which one was extreme, two were severe, and four were moderate (Figure 3). The incidence of drought had increased in the study area because 88% of the drought happened in the last fifteen years of the three decades.
4.2.3. Harvest Loss
Climate change-induced harvest loss due to rainfall shortages in the growing season is one reason for food insecurity in developing countries [55]. There had been harvest losses because of climate change in the study area. This happened due to the shortage of RF during the growing season. Out of 401 HHs interviewed, eighty-two percent (n = 329) said that they have experienced harvest losses in the last ten years. The farmers in the study area practice a mixed livelihood: crop cultivation and animal husbandry. When drought occurs, the productivity of both suffers. The exception is for enset crop. Because of its biological characteristics, enset has strong drought resistance capacity and has a strong link with animal husbandry. The mixed livelihoods are dependent on RF since there are no small-scale irrigation projects in the study area. During the drought years when animal pasture/grass is scarce, farmers fed their cattle enset (false banana). This alternative is less feasible nowadays because of the scarcity of animal dung, which is a critical fertilizer to grow enset. As a result, as the number of cattle owned by households dwindles, enset production also declines. Thus, climate change is affecting the mixed (crop cultivation and animal husbandry) rural livelihood by degrading its natural connection.
4.2.4. Flooding
Climate change-induced flooding is one of the impacts of climate change, which has vast economic and social consequences. It has been occurring in Ethiopia for years inflicting heavy social and economic costs [56]. Flooding during rainy seasons is one of the primary climate-induced effects in the study area. Of the 402 households asked about their exposure to flooding, 74% (n = 297) said that flooding had affected them in the last ten years. Most parts of the study area, especially the western part, have suffered from devastating flooding due to the seasonal overflow of the Bilat River. On the other hand, since the area is located in lower elevations, there are run-offs from the surrounding highlands that destroy terraces built to control soil erosion. Also, several gullies occurred because of heavy rain that has affected the landscape as noted by the researcher during field visits. Flooding during rainy seasons causes property and harvest loss incurring a significant economic cost to the farmers. The social and economic effects mentioned by households include loss of human lives and livestock, property damages, destruction of crops, water-borne diseases, and soil erosion.
4.2.5. Climate Change-Induced Hunger
Famine is a condition where people lack food for a longer period whereas hunger is a seasonal lack of food because of natural or human-made causes. Hunger becomes famine when it persists and affects many people [57]. RF shortage is one of the main reasons for famine and hunger in SSA [4,5]. Of the 401 respondents included in this study, 77% (n = 309) did experience hunger in the last ten years. Data collected from the Sidama Zone Agriculture and Natural Resources Management Department show that climate change-induced hunger did happen in the three districts in the previous fifteen years. Many people received emergency food aid in 2000, 2004, 2009, and 2016. These years coincide with the years of lower SRA discussed in part 4.1. According to key informants, signs of hunger include a delayed start of rain during rainy seasons (belg or kiremt) or its absence during critical sowing seasons. Both affect crop and livestock productivity and food security.
4.3. Determinants of Climate Change-Induced Impacts on Smallholder Farmers
4.3.1. Determinants of Exposure to the Effects of Drought
The result of the logit model shows that several reasons decide the likelihood of exposure to the effects of drought in the study area. The model is statistically significant for the determinants of drought (N = 357, Chi2 = 59.99, p = 0.0000). The pseudo R2 and adjusted R2 (after marginal effect) values for this category of explanatory variables are 18.56% and 88.83%, respectively (Table 5). Out of the explanatory variables considered in the model, educational status, growing enset, membership in 1 to 5 groups, and being head in 1 to 5 groups affect the exposure to the effects of drought. Besides, the use of chemical fertilizer and the participation of women in family decision-making are found to be the main determinants of exposure to the effects of climate change-induced drought. Specifically, the findings show that a one year increase in schooling decreases the likelihood of being affected by drought by 10% (at p < 0.05 level).
Growing enset is another determinant of climate change-induced drought. Households who grow enset are 111.3% less likely to experience the effects of drought than those without enset at p < 0.05 level (Table 5). Enset (false banana) is a perennial crop known for its drought-resistant nature and is wildly used as a staple food in the most southern part of Ethiopia [58,59]). Enset is important for the local economy because its products, locally called waasa and bu’la, are sold in markets and are a source of income. Its roots, leaves, and stem are also used to feed animals during drought years. The Peasant Association (Kebele Administration) is the lowest administrative unit in Ethiopia that is accountable to the district (district) administration. Locally, households are organized in small groups of five households known as the 1 to 5 group. The government designed it without having local farmers say in its formation. The government widely uses this group for economic, political, and social purposes. Of the total 402 households involved in this study, 60% (n = 242) were members in the 1 to 5 group organization and the remaining 40% (n = 160) were not. On the other hand, 11% (n = 42) were serving as group leaders. There is widespread debate and controversies on the merits and demerits of such grouping. However, the purpose here is as a social organization, to what extent being a member or a leader in 1 to 5 groups is related to the likelihood of facing climate change-induced impacts?
The model revealed that being a member or having a position in the 1 to 5 groups affects the likelihood of exposure to climate change-induced drought. Being a member of the group increases the likelihood of exposure to drought effects by 120.2% (at p < 0.01 level). On the other hand, having a position of leadership of a group decreases the exposure to climate change-induced drought by 149.7% at p < 0.01 level (Table 5). A further investigation on the socio-economic status of the 1 to 5 group heads pointed out that they are were individuals with a better resource base. Furthermore, the group heads have more decision making power on resources owned by the community. On the other hand, the members of these groups were poor farmers who joined the group to get government support. Despite the claims of the government to support the poor organized in the groups, the members were most vulnerable compared with others. Also, the model examined agricultural technology use and the likelihood of exposure to climate change-induced impacts. The results of the model show that except for improved animal fodder, other agricultural technologies did not decrease the likelihood of exposure to climate change-induced impacts. Using chemical fertilizers (Urea and NPS) increases the possibility of experiencing the effects of drought and harvest losses. It increases the likelihood of experiencing drought effects by 150.4% (at p < 0.01 level). This is contrary to the claims of government officials who argue using chemical fertilizers as rewarding for farmers. Interviews with farmers revealed that when RF onset is late, the application of chemical fertilizers is calamitous to farmers because the fertilizers wilt the crops in their early stages. Thus, applying chemical fertilizers during drought seasons increases their likelihood of exposure to the effects of drought. Moreover, those farmers who use chemical fertilizers are more likely to experience bankruptcy during drought years for they have to pay back the fertilizer loan, which is expensive according to key informants. Thus, the debt and risks associated with borrowing in precarious situations are found to be factors for the higher vulnerability of farmers.
4.3.2. Determinants of Facing Harvest Loss
The logit model results show that several factors affect the possibility of exposure to harvest loss in the study area. The model is statistically significant for the determinants of harvest loss (N = 358, Chi2 = 85.78, p = 0.0000). The pseudo R2 and adjusted R2 values are 24.44% and 87.75%, respectively (Table 5). Among the explanatory variables, membership and headship in 1 to 5 groups, PSNP, and animal fodder control the likelihood of experiencing harvest loss. Also, the use of chemical fertilizer controls the likelihood of harvest loss. The PSNP is a social protection program that government instruments in drought-prone and food insecure areas of Ethiopia. Because of the widespread food insecurity, the government has been carrying out the PSNP in the study area. It aids vulnerable farmers in cash and kind in the study area. Of the sampled households, 29% (n = 114) were PSNP beneficiaries, whereas the remaining were not. The results of the model revealed that HHs supported by the program are less likely to experience the effects of harvest loss by 91.9% (at p < 0.01 level) than the non-users of the program. Like the case of drought exposure, membership in the 1 to 5 group increases the possibility of facing a harvest loss by 159.8% (at p < 0.01 level). On the contrary, bearing the leadership position in the 1 to 5 group reduces the likelihood of exposure to harvest loss by 200% (at p < 0.01 level). One of the challenges for farmers during the drought season is the lack of pasture and water for their livestock. To solve the problem, the government has introduced a plant species that farmers grow to feed their livestock. Farmers call it animal fodder in the study area. The logit model analysis shows that the use of this improved animal fodder reduces the likelihood of facing harvest loss. Farmers who use improved animal fodder are 81.6% less likely to experience harvest loss than the non-users (at p < 0.1 level). This is because, without the fodder, farmers use crops to feed livestock. Using chemical fertilizers in crop fields increases the chance of experiencing harvest loss. Farmers who apply chemical fertilizers in their crop field are 37% more likely to experience harvest loss during a drought season because crops wilt under inadequate rain conditions (Table 5).
4.3.3. Determinants of Exposure to the Effects of Flooding
Flooding is one of the climate change-induced impacts experienced by the HHs in the study area. The model is statistically significant for the determinants of experiencing flooding (N = 357, Chi2 = 39.62.78, p = 0.0958). The pseudo R2 and adjusted R2 values of the model are 9.58% and 75.7%, respectively (Table 5). Among the variables considered, land use right certificate, being a beneficiary of PSNP, and membership in the 1 to 5 groups are the determinants of exposure to flooding. Also, taking part in climate change adaptation decisions affects exposure to climate change-induced flooding (Table 5). Land use right certificate affects the likelihood of experiencing climate change-induced impacts. The likelihood of facing flooding decreases by 64.5% for farmers who have land ownership certificate. This result is statistically significant (at p < 0.1 level). This is because farmers with a land use right certificate have a stronger landownership feeling than those without and this encourages farmers to carry out different soil and water conservation practices. Households with larger landholding size are less likely to experience flooding than HHs with a smaller landholding size. A unit increase in landholding size decreases the likelihood of experiencing flooding by 43.9% (at p < 0.05). Being a PSNP beneficiary also decreases the likelihood of facing climate change-induced flooding by 92.3% (at p < 0.01 level). On the other hand, membership in the 1 to 5 groups controls the likelihood of exposure to flooding impacts. Being a member in 1 to 5 group decreases the chance of experiencing flooding impacts by 85.2% (at p < 0.01 level). Participation in climate change adaptation decisions at the local level is also relevant. Farmers who take part in local level decision-making are 52% less likely to experience climate change induced flooding impacts than the non-participants (Table 5). The incident of flooding is common for low-lying areas, but the model did not consider topography and is a limitation of the model.
4.3.4. Determinants of Facing Hunger
Climate change and variability-induced hunger are one of the impacts experienced by the HHs in the study area, especially during drought periods. The model is statistically significant for the determinants of experiencing hunger by the HHs (N = 357, Chi2 = 82.49, p = 0.0000). The pseudo R2 and adjusted R2 values are 21.18% % and 83.25%, respectively (Table 5). The logit model result identified sex, educational status, farmland size, membership, and headship in the 1 to 5 groups as determinants of exposure to hunger. Besides, the use of improved animal fodder, chemical fertilizer, and improved seed variety also control the chance of exposure to hunger. Furthermore, female participation in family decision making also decides the likelihood of exposure to change-induced hunger. The sex of the household head is associated with the likelihood of facing climate-induced impacts; being a male household head decreases the chance of exposure to hunger by 55.9% (at p < 0.1 level). This means female-headed HHs are more vulnerable to the exposure of hunger than the male counterpart. This is due to issues related to access to and control over resources owned by the family and the community.
On the other hand, a unit increase in education decreases the likelihood of facing hunger by 11.6% (at p < 0.01 level). This suggests the role of education in minimizing the impacts of climate change induced hunger. Household’s total farm size also lowers the chance of facing hunger. A unit increase in farm size reduces the likelihood of facing hunger by 57.1% (at p < 0.01 level). This means as land holding size decreases, farmers become more vulnerable to climate change-induced hunger. Like the case of exposure to drought, membership in the 1 to 5 groups increases the likelihood of exposure to hunger. The likelihood of facing hunger increases by 147.5% for members in 1 to 5 group and decreases by 142.7% for the heads of the group (at p < 0.01 levels). Using improved animal fodder decreases the likelihood of experiencing hunger. Users of improved animal fodder are 88.7% less likely to face climate change-induced hunger than non-users (at p < 0.1 level). Women’s involvement in family decision-making such as selling assets and renting out lands affects the likelihood of exposure to hunger. It reduces the chance of experiencing climate change-induced hunger by 101.5% (at p < 0.01 level). The use of chemical fertilizers and drought-resistant varieties also affects the possibility of experiencing climate change-induced hunger. Using these inputs increases the chance of experiencing hunger by 142.9% and 69.7%, respectively (Table 5). Key informants’ interviews to justify the reasons behind these findings suggested the use of chemical fertilizer and improved seed varieties is disadvantageous for farmers. This is because farmers who use agricultural inputs usually get them in the form of a loan. The farmers have to sell their assets to pay back the debt since there is no surplus produce to sell in the market during drought years. This further degrades their asset base, exposing them to food security.
5. Conclusions
The analyses of data collected from different sources have shown that RF had been scarce, erratic and declining from time to time, exposing rained smallholder farmers to various climate change-induced impacts. Annual and growing season (belg and kiremt) RF had shown a declining trend in the study area. The analysis annual RSA has shown that the study area had experienced seven droughts of different extent during the three decades (1983–2014) under consideration. The monthly minimum, maximum, and average temperature had increased over the years under consideration, all of which are statistically significant. These changes in climatic variables resulted in climate change-induced epidemics, drought, harvest losses, flooding, and hunger.
The logit model results have shown that different several socio-economic and institutional factors control the likelihood of exposure to the impacts. The likelihood of exposure to the effects of drought is controlled by the educational status of the HH head, growing enset, and membership in the 1 to 5 groups. Furthermore, leadership in 1 to 5 groups, use of chemical fertilizers, and female involvement in family decision-making are other determinants. Furthermore, membership and headship in the 1 to 5 groups, being the beneficiary of the PSNP, the use of improved animal fodder, and the use of chemical fertilizer affect the likelihood of exposure to harvest loss. On the other hand, land use right certificate, participation in the PSNP, membership in the 1 to 5 groups, and participation in climate change adaptation decisions are determinants of climate change-induced flooding. Moreover, the logit model has identified that sex, educational status, farmland size, and membership and headship in the 1 to 5 groups affect the likelihood of experiencing climate change-induced hunger. Besides, the use of improved animal fodder, chemical fertilizers, and improved seed variety also control the likelihood of exposure to climate change-induced hunger. Participation of women in family decision-making also reduces climate change-induced hunger.
Climate change and variability-induced impacts are widely available in the study area despite various adaptive strategies of the government and the households. Government policies on education, female empowerment, land use right certification, and participation of the households in adaptation decisions can help to minimize climate change-induced impacts. The empirical literature also suggests that working on human capital is key to successful livelihood diversification [60,61,62]. In this regard, education (both formal and informal) and skills training need to be emphasized. On the contrary, organizing farmers into 1 to 5 groups contributed positively only in minimizing the incidence of flooding. Memberships in such organization did not help to reduce the possibility of facing the effects of drought, harvest loss, and hunger. Thus, the government needs to reform such organizations in a manner that they can contribute to lessening climate change impelled impacts. Besides, the supplies of agricultural inputs (improved seed varieties and chemical fertilizers) specifically during drought years increased the likelihood of exposure to climate change-induced impacts. Therefore, there is a need to build human capital through expanding education, strengthening female participation in family decision-making, and improve public participation in climate change adaptation undertakings to manage climate change-induced impacts sustainably.
Funding
This research received some funding from the NORHED-DEG Project of Norad in Hawassa University. The author is grateful for the financial support.
Acknowledgments
I would like to thank Tesfaye Semela and Sintayehu Hailu for commenting and shaping the statistical model used in the study. I also thank Girma Kebede for commenting the first draft of the article.
Conflicts of Interest
The author declares no conflicts of interest.
References
- O’Brien, K.L.; Leichenko, R.M. Double exposure: Assessing the impacts of climate change within the context of economic globalization. Glob. Environ. Chang. 2000, 10, 221–232. [Google Scholar] [CrossRef]
- Bewket, W.; Radeny, M.A.O.; Mungai, C. Agricultural Adaptation and Institutional Responses to Climate Change Vulnerability in Ethiopia; CGIAR Research Program on Climate Change, Agriculture and Food Security (CCAFS): Copenhagen, Denmark, 2015. [Google Scholar]
- IPCC. Climate Change 2014: Synthesis Report; Contribution of Working Groups I, II and III to the Fifth Assessment Report of the Intergovernmental Panel on Climate Change; Pachauri, R.K., Meyer, L.A., Eds.; IPCC: Geneva, Switzerland, 2014; p. 151. [Google Scholar]
- Kotir, J.H. Climate change and variability in Sub-Saharan Africa: A review of current and future trends and impacts on agriculture and food security. Environ. Dev. Sustain. 2011, 13, 587–605. [Google Scholar] [CrossRef]
- Adeniyi, P.A. Climate change induced hunger and poverty in Africa. J. Glob. Biosci. 2016, 5, 3711–3724. [Google Scholar]
- AGRA (Alliance for a Green Revolution in Africa Change). Smallholder Agriculture in Sub-Saharan Africa; AGRA: Nairobi, Kenya, 2014. [Google Scholar]
- Adger, W.N.; Huq, S.; Brown, K.; Conway, D.; Hulme, M. Adaptation to climate change in the developing world. Prog. Dev. Stud. 2003, 3, 179–195. [Google Scholar] [CrossRef]
- Morton, J.F. The impact of climate change on smallholder and subsistence agriculture. Proc. Natl. Acad. Sci. USA 2007, 104, 19680–19685. [Google Scholar] [CrossRef] [PubMed] [Green Version]
- Schlenker, W.; Lobell, D.B. Robust negative impacts of climate change on African agriculture. Environ. Res. Lett. 2010, 5, 014010. [Google Scholar] [CrossRef]
- FAO. Agriculture in Sub-Saharan Africa: Prospects and challenges for the next decade. In Agricultural Outlook 2016–2025; FAO: Rome, Italy, 2016. [Google Scholar]
- MoA. The Federal Democratic Republic of Ethiopia. Agriculture Sector Programme of Plan on Adaptation to Climate Change; Technical Working Group: Addis Ababa, Ethiopia, 2011. [Google Scholar]
- World Bank. Measuring the Economic Impact of Climate Change on Ethiopian Agriculture: Ricardian Approach; The World Bank: Washington, DC, USA, 2007. [Google Scholar]
- Senbeta, A.F.; Olsson, J.A. Climate Change Impact on Livelihood, Vulnerability and Coping, Mechanisms: A Case Study of West-Arsi Zone, Ethiopia. Unpublished MA Thesis, Lund University, Lund, Sweden, 2009. [Google Scholar]
- Tafesse, A.; Ayele, G.; Ketema, M.; Geta, E. Adaptation to climate change and variability in eastern Ethiopia. J. Econ. Sustain. Dev. 2013, 4, 91–103. [Google Scholar]
- IPCC. Climate Change 2007—The Physical Science Basis: Working Group I Contribution to the Fourth Assessment Report of the IPCC; Solomon, S., Qin, D., Manning, M., Averyt, K., Marquis, M., Eds.; Cambridge University Press: Cambridge, UK, 2007. [Google Scholar]
- IPCC. Climate Change IPCC Third Assessment Report. Intergovernmental Panel on Climate Change; IPCC Secretariat: Geneva, Switzerland, 2001. [Google Scholar]
- Cooper, P.J.M.; Dimes, J.; Rao, K.P.C.; Shapiro, B.; Shiferaw, B.; Twomlow, S. Coping better with current climatic variability in the rain-fed farming systems of sub-Saharan Africa: An essential first step in adapting to future climate change? Agric. Ecosyst. Environ. 2008, 126, 24–35. [Google Scholar] [CrossRef] [Green Version]
- Shiferaw, B.; Tesfaye, K.; Kassie, M.; Abate, T.; Prasanna, B.M.; Menkir, A. Managing vulnerability to drought and enhancing livelihood resilience in sub-Saharan Africa: Technological, institutional and policy options. Weather Clim. Extrem. 2014, 3, 67–79. [Google Scholar] [CrossRef] [Green Version]
- Mertz, O.; Halsnæs, K.; Olesen, J.E.; Rasmussen, K. Adaptation to climate change in developing countries. Environ. Manag. 2009, 43, 743–752. [Google Scholar] [CrossRef] [PubMed]
- Ravindranath, N.H.; Sathaye, J.A. Climate change and developing countries. In Climate Change and Developing Countries; Springer: Dordrecht, The Netherlands, 2002; pp. 247–265. [Google Scholar]
- Mendelsohn, R.; Dinar, A.; Williams, L. The distributional impact of climate change on rich and poor countries. Environ. Dev. Econ. 2006, 11, 159–178. [Google Scholar] [CrossRef] [Green Version]
- Carter, M.R.; Little, P.D.; Mogues, T.; Negatu, W. Poverty traps and natural disasters in Ethiopia and Honduras. World Dev. 2007, 35, 835–856. [Google Scholar] [CrossRef]
- Ribot, J. Vulnerability does not fall from the sky: Toward multiscale, pro-poor climate policy. Soc. Dimens. Clim. Chang. Equity Vulnerability A Warm. World 2010, 2, 47–74. [Google Scholar]
- McMichael, A.J. Global Climate Change and Health: An Old Story Writ Large. Climate Change and Human Health: Risks and Responses; World Health Organization: Geneva, Switzerland, 2003. [Google Scholar]
- Kjellstrom, T. Climate change, direct heat exposure, health and well-being in low and middle-income countries. Glob. Health Action 2009, 2. [Google Scholar] [CrossRef]
- Patz, J.A.; Campbell-Lendrum, D.; Holloway, T.; Foley, J.A. Impact of regional climate change on human health. Nature 2005, 438, 310. [Google Scholar] [CrossRef]
- Rosenzweig, C.; Iglesias, A.; Yang, X.B.; Epstein, P.R.; Chivian, E. Climate change and extreme weather events; implications for food production, plant diseases, and pests. Glob. Chang. Hum. Health 2001, 2, 90–104. [Google Scholar] [CrossRef]
- Nordás, R.; Gleditsch, N.P. Climate change and conflict. Political Geogr. 2007, 26, 627–638. [Google Scholar] [CrossRef]
- UN-DESA. World Urbanization Prospects, the 2014. Population Division, Department of Economic and Social Affairs 2014; United Nations Secretariat: New York, NY, USA, 2014. [Google Scholar]
- Asaminew, A.E. Climate Change, Growth and Poverty in Ethiopia. The Robert S. Strauss Center for International Security and Law; The University of Texas at Austin: Austin, TX, USA, 2013. [Google Scholar]
- Evangelista, P.; Young, N.; Burnett, J. How will climate change spatially affect agriculture production in Ethiopia? Case studies of important cereal crops. Clim. Chang. 2013, 119, 855–873. [Google Scholar] [CrossRef]
- Mersha, A.A.; van Laerhoven, F. The interplay between planned and autonomous adaptation in response to climate change: Insights from rural Ethiopia. World Dev. 2018, 107, 87–97. [Google Scholar] [CrossRef]
- Seleshi, Y.; Zanke, U. Recent changes in RF and rainy days in Ethiopia. Int. J. Climatol. 2004, 24, 973–983. [Google Scholar] [CrossRef]
- Adem, A.; Bewket, W. A Climate Change Country Assessment Report for Ethiopia. Submitted to Forum for Environment; Epsilon International R&D: Addis Ababa, Ethiopia, 2011. [Google Scholar]
- Adnew, M.; Bewket, W. Variability and trends in RF amount and extreme event indices in the Omo-Ghibe River Basin, Ethiopia. Reg. Environ. Chang. 2014, 14, 799–810. [Google Scholar]
- Yalew, A.W.; Hirte, G.; Lotze-Campen, H.; Tscharaktschiew, S. Economic Effects of Climate Change in Developing Countries: Economy-Wide and Regional Analysis for Ethiopia; Center of Public and International Economics: Dresdon, Germany, 2017. [Google Scholar]
- Mideksa, T.K. Economic and distributional impacts of climate change: The case of Ethiopia. Glob. Environ. Chang. 2010, 20, 278–286. [Google Scholar] [CrossRef]
- Kreft, S.; Eckstein, D.; Dorsch, L.; Fischer, L. Global Climate Risk Index 2016: Who Suffers Most from Extreme Weather Events? Weather-related Loss Events in 2014 and 1995 to 2014; Germanwatch: Bonn, Germany, 2015. [Google Scholar]
- Bewket, W. Climate change perceptions and adaptive responses of smallholder farmers in central highlands of Ethiopia. Int. J. Environ. Stud. 2012, 69, 507–523. [Google Scholar] [CrossRef]
- Atinkut, B.; Mebrat, A. Determinants of farmers choice of adaptation to climate variability in Dera district, south Gondar zone, Ethiopia. Environ. Syst. Res. 2016, 5, 6. [Google Scholar] [CrossRef]
- SNNPRS-BoFED. Annual Abstract SNNPRS Bureau of Finance and Economic Development Annual Statistical Abstract. 2003 E.C. Data Collection—Dissemination Core Process; SNNPRS-BoFED: Hawassa, Ethiopia, 2015. [Google Scholar]
- SZBoFED. Sidama Zone Socio-Economic Profile. Sidama Zone Finance and Economic Development Department; SZBoFED: Hawassa, Ethiopia, 2007. [Google Scholar]
- Krejcie, R.V.; Morgan, D.W. Determining sample size for research activities. Educ. Psychol. Meas. 1970, 30, 607–610. [Google Scholar] [CrossRef]
- Pallant, J. SPSS Survival Manual: A Step by Step Guide to Data Analysis Using SPSS for Windows (Versions 10 and 11): SPSS Student Version 11.0 for Windows; Open University Press: Milton Keynes, UK, 2001. [Google Scholar]
- Bewket, W.; Conway, D. A note on the temporal and spatial variability of RF in the drought-prone Amhara region of Ethiopia. Int. J. Climatol. 2007, 27, 1467–1477. [Google Scholar] [CrossRef]
- Janowiak, J.E.; Ropelewski, C.F.; Halpert, M.S. The precipitation anomaly classification: A method for monitoring regional precipitation deficiency and excess on a global scale. J. Clim. Appl. Meteorol. 1986, 25, 565–574. [Google Scholar] [CrossRef]
- Arragaw, A.; Bewket, W. Smallholder farmers’ coping and adaptation strategies to climate change and variability in the central highlands of Ethiopia. Local Environ. 2017, 22, 825–839. [Google Scholar]
- Tafesse, M. An Assessment of Domestic Water Supply Status of Rural Household in Selecting Kebeles of Boricha District, Sidaama Zone, Southern Ethiopia. Unpublished Master’s Thesis, Addis Ababa University, Addis Ababa, Ethiopia, 2009. [Google Scholar]
- Haines, A.; Kovats, R.S.; Campbell-Lendrum, D.; Corvalán, C. Climate change and human health: Impacts, vulnerability and public health. Public Health 2006, 120, 585–596. [Google Scholar] [CrossRef]
- McMichael, C.; Barnett, J.; McMichael, A.J. An ill wind? Climate change, migration, and health. Environ. Health Perspect. 2012, 120, 646–654. [Google Scholar] [CrossRef] [PubMed]
- Allsopp, R. Options for vector control against trypanosomiasis in Africa. Trends Parasitol. 2001, 17, 15–19. [Google Scholar] [CrossRef]
- Hotez, P.J.; Kamath, A. Neglected tropical diseases in sub-Saharan Africa: Review of their prevalence, distribution, and disease burden. PLoS Negl. Trop. Dis. 2009, 3, e412. [Google Scholar] [CrossRef]
- Kissui, B.M. Livestock predation by lions, leopards, spotted hyenas, and their vulnerability to retaliatory killing in the Maasai steppe, Tanzania. Anim. Conserv. 2008, 11, 422–432. [Google Scholar] [CrossRef]
- Philander, S.G. Encyclopedia of Global Warming and Climate Change: AE; Sage Publishers: Thousand Oaks, CA, USA, 2008. [Google Scholar]
- Wheeler, T.; Von Braun, J. Climate change impacts on global food security. Science 2013, 341, 508–513. [Google Scholar] [CrossRef]
- MoWR and NMA. Climate Change National Adaptation Programme of Action (NAPA) of Ethiopia. National Meteorological Services Agency, Ministry of Water Resources; Federal Democratic Republic of Ethiopia: Addis Ababa, Ethiopia, 2007. [Google Scholar]
- Ayalew, M. What Is Food Security and Famine and Hunger. Using Science against Famine: Food Security, Famine Early Warning, and El Nino; National Center for Atmospheric Research: Boulder, CO, USA, 1997; pp. 1–8. [Google Scholar]
- Tsegaye, A.; Struik, P.C. Analysis of enset (Ensete ventricosum) indigenous production methods and farm-based biodiversity in major enset-growing regions of southern Ethiopia. Exp. Agric. 2002, 38, 291–315. [Google Scholar] [CrossRef]
- Tesfaye, B.; Lüdders, P. Diversity and distribution patterns of enset landraces in Sidama, Southern Ethiopia. Genet. Resour. Crop Evol. 2003, 50, 359–371. [Google Scholar] [CrossRef]
- Ellis, F. Rural Livelihood Diversity in Developing Countries: Evidence and Policy Implications; Overseas Development Institute: London, UK, 1999. [Google Scholar]
- Eneyew, A. Determinants of livelihood diversification in pastoral societies of southern Ethiopia. J. Agric. Biodivers. Res. 2012, 1, 43–52. [Google Scholar]
- Adepoju, A.O.; Obayelu, O.A. Livelihood diversification and welfare of rural households in Ondo State, Nigeria. J. Dev. Agric. Econ. 2013, 31, 482–489. [Google Scholar]
Figure 1.
The geographic location of the study area.

Figure 2.
Rainfall trend in the study area (1983–2014). Source: Own computation from Ethiopian National Meteorological Agency data.
Figure 2.
Rainfall trend in the study area (1983–2014). Source: Own computation from Ethiopian National Meteorological Agency data.


Figure 3.
Annual RF standard anomalies in the study area (1983–2014).

Source: Own computation from Ethiopian National Meteorological Agency data.

Table 1.
Distribution of rural population and sampled households (HHs) in selected districts.
| District Name | Total Rural Population | Total HHs | Kebele Name | Sampled HHs | Total |
|---|---|---|---|---|---|
| Boricha | 299,175 | 58,823 | Hanja Cafa | 66 | 189 |
| Haldada Dela | 66 | ||||
| Korangoge | 57 | ||||
| Loka Abaya | 122,445 | 25,278 | Muticha Gorbe | 36 | 93 |
| Sala Kore | 58 | ||||
| Hawassa Zuriya | 155,245 | 29,184 | Doyo Chala | 53 | 119 |
| Doyo Otilicho | 66 | ||||
| TOTAL | 576,865 | 113,285 | 401(143) | 401 |
( ) female headed HHs. Source: Own compilation from SNNPRS, BoFED 2015.
Table 2.
Variables description.
| S.N | Variables | Variable Type | Description | Code |
|---|---|---|---|---|
| 1 | Sex | Explanatory | Sex of the HHs head | continuous |
| 2 | Family size | Explanatory | Number of HH members | continuous |
| 3 | Educational status | Explanatory | HHs head no. of years in school) | continuous |
| 4 | Total land size | Explanatory | Size of land in hectare | continuous |
| 5 | Land use certificate | Explanatory | I have land use right certificate | 1) yes 0) no |
| 6 | PSNP beneficiary | Explanatory | Beneficiary of PSNP support | 1) yes 0) no |
| 7 | Produce enset | Explanatory | Produce enset crop | 1) yes 0) no |
| 8 | Membership in 1 to 5 | Explanatory | Membership in 1 to 5 | 1) yes 0) no |
| 9 | Head of 1 to 5 | Explanatory | Head of 1 to 5 | 1) yes 0) no |
| 10 | Communal grazing land | Explanatory | Communal grazing land | 1) yes 0) no |
| 11 | Communal water pond | Explanatory | Communal water ponds | 1) yes 0) no |
| 12 | Drought resistant variety | Explanatory | Drought resistant crop variety | 1) yes 0) no |
| 13 | Fertilizer/urea/NPS | Explanatory | Fertilizer/urea/NPS | 1) yes 0) no |
| 14 | Training on climate change | Explanatory | Get trained on climate change adaptation | 1) yes 0) no |
| 15 | Early warning information | Explanatory | Get early climate change induced information | 1) yes 0) no |
| 16 | Improved animal fodder | Explanatory | Use improved animal fodder | 1) yes 0) no |
| 17 | HHs participation in adaptive decision | Explanatory | HHs participation in climate decision making | 1) yes 0) no |
| 18 | Women participation in HHs decision | Explanatory | Women participation in HHs decision making | 1) yes 0) no |
| 19 | Drought | Dependent | Exposure to the effects of drought | 1) yes 0) no |
| 20 | Harvest loss | Dependent | Experienced harvest loss | 1) yes 0) no |
| 21 | Flooding | Dependent | Affected by flooding | 1) yes 0) no |
| 22 | Famine | Dependent | Experienced hunger | 1) yes 0) no |
1. Productive Safety Net Program is a government program being implemented in the study area to support poor and vulnerable people. 2. Are groups of 5 people organized by government and used for political, economic, and social purposes. 3. Drought resistant varieties are plant seeds that are supplied by the government and can grow in moisture stress conditions. 4. Urea and NPS are the two types of chemical fertilizers supplied to farmers by the government (usually in loan) NPS refers to Nitrogen-Phosphoric fertilizer containing Sulphur. 5. Improved animal fodder is a plant species (supplied by the government) that is used as a forage to feed animals during a shortage of pasture. 6. HHS are members of a family living in a house.
Table 3.
Mann–Kendall’s rank test result for inter-annual rainfall (RF).
| Coefficicnt | n | Winter RF | Spring RF | Summer RF | Annual RF |
|---|---|---|---|---|---|
| Correlation Coefficient | 1.000 | 0.117 | 0270 * | −0.020 | −0.161 |
| Sig. (2-tailed) | 0.347 | 0.030 | 0.871 | 0.195 | |
| N | 32 | 32 | 32 | 32 | 32 |
* Correlation is significant at the 0.05 level (2-tailed).
Table 4.
Drought severity index based on standard rainfall anomalies (SRA).
| Anomaly | Temperature | RF |
|---|---|---|
| <−1.65 | Extremely hot | Extreme drought |
| −1.65 to −1.28 | Severe hot | Severe drought |
| −1.28 to −0.84 | Moderate hot | Moderate drought |
| >−0.84 | Cool | No drought |
Source: Janowiak et al. 1986.
Table 5.
Marginal effects due to independent variables (the coefficients table).
| Variables | Drought | Lost Harvest | Flooding | Hunger |
|---|---|---|---|---|
| Sex | −0.244 | −0.370 | −0.179 | −0.559 |
| (0.360) | (0.355) | (0.278) | (0.327) * | |
| Land certificate | 0.468 | 0.100 | −0.645 | −0.273 |
| (0.424) | (0.448) | (0.379) * | (0.417) | |
| Family size | 0.026 | 0.063 | 0.009 | 0.021 |
| (0.080) | (0.087) | (0.063) | (0.073) | |
| Educational status | −0.100 | −0.030 | 0.069 | −0.116 |
| (0.048) ** | (0.051) | (0.042) | (0.045) *** | |
| Total land size | −0.095 | −0.202 | −0.439 | −0.571 |
| (0.160) | (0.172) | (0.181) ** | (0.209) *** | |
| PSNP beneficiary | 0.003 | −0.919 | −0.923 | −0.004 |
| (0.393) | (0.354) *** | (0.308) *** | (0.358) | |
| Do you produce enset? | −1.113 | −0.636 | −0.209 | 0.094 |
| (0.497) ** | (0.455) | (0.338) | (0.365) | |
| Weather early warning information | 0.176 | 0.436 | −0.155 | 0.108 |
| (0.327) | (0.326) | (0.268) | (0.295) | |
| Climate change adaptation training | 0.202 | 0.127 | −0.262 | 0.232 |
| (0.355) | (0.350) | (0.283) | (0.318) | |
| Membership in 1 to 5 | 1.202 | 1.598 | −0.852 | 1.475 |
| (0.380) *** | (0.387) *** | (0.301) *** | (0.343) *** | |
| Head of 1 to 5 | −1.497 | −2.000 | 0.719 | −1.427 |
| (0.510) *** | (0.515) *** | (0.486) | (0.482) *** | |
| Grazing land | 0.857 | 0.406 | 0.134 | 0.958 |
| (0.648) | (0.604) | (0.477) | (0.599) | |
| Water pond | 1.022 | 1.434 | 0.289 | 1.070 |
| (0.865) | (0.869) * | (0.542) | (0.870) | |
| Improved animal fodder | −0.761 | −0.816 | −0.597 | −0.887 |
| (0.521) | (0.480) * | (0.409) | (0.488) * | |
| Fertilizer/urea/NPS | 1.504 | 1.041 | 0.075 | 1.429 |
| (0.534) *** | (0.531) ** | (0.506) | (0.506) *** | |
| Drought resistant crop variety | 0.437 | −0.151 | 0.268 | 0.687 |
| (0.420) | (0.396) | (0.327) | (0.392) * | |
| Women participation in family decision making | −1.089 | −0.350 | −0.020 | −1.015 |
| (0.419) *** | (0.370) | (0.295) | (0.360) *** | |
| Participation in adaptation decision | −0.135 | −0.007 | −0.529 | −0.043 |
| (0.408) | (0.396) | (0.305) * | (0.360) | |
| N | 357 | 358 | 357 | 357 |
| Chi2 | 59.99 | 85.78 | 39.62 | 82.49 |
| P | 0.0000 | 0.0000 | 0.0024 | 0.0000 |
| Pseudo R2 | 0.1856 | 0.2444 | 0.0958 | 0.2118 |
| Adjusted R2 (Marginal effect after logit) | 0.8883 | 0.8775 | 0.7570 | 0.8325 |
* p < 0.1; ** p < 0.05; *** p < 0.01; (SE) = standard error.
© 2019 by the author. Licensee MDPI, Basel, Switzerland. This article is an open access article distributed under the terms and conditions of the Creative Commons Attribution (CC BY) license (http://creativecommons.org/licenses/by/4.0/).
Share and Cite
MDPI and ACS Style
Matewos, T. Climate Change-Induced Impacts on Smallholder Farmers in Selected Districts of Sidama, Southern Ethiopia. Climate 2019, 7, 70. https://0-doi-org.brum.beds.ac.uk/10.3390/cli7050070
AMA Style
Matewos T. Climate Change-Induced Impacts on Smallholder Farmers in Selected Districts of Sidama, Southern Ethiopia. Climate. 2019; 7(5):70. https://0-doi-org.brum.beds.ac.uk/10.3390/cli7050070
Chicago/Turabian StyleMatewos, Tafesse. 2019. "Climate Change-Induced Impacts on Smallholder Farmers in Selected Districts of Sidama, Southern Ethiopia" Climate 7, no. 5: 70. https://0-doi-org.brum.beds.ac.uk/10.3390/cli7050070
Note that from the first issue of 2016, this journal uses article numbers instead of page numbers. See further details here.