Effects of Combined CO2 and O3 Exposures on Net CO2 Assimilation and Biomass Allocation in Seedlings of the Late-Successional Fagus Crenata

 , , and
Abstract
:1. Introduction
2. Material and Methods
2.1. Experimental Design
2.2. Plant Materials
2.3. Gas-Exchange Measurements
2.4. Chlorophyll Fluorescence Measurements
2.5. Leaf Characteristics
2.6. Growth Measurements
2.7. Statistical Analysis
3. Results
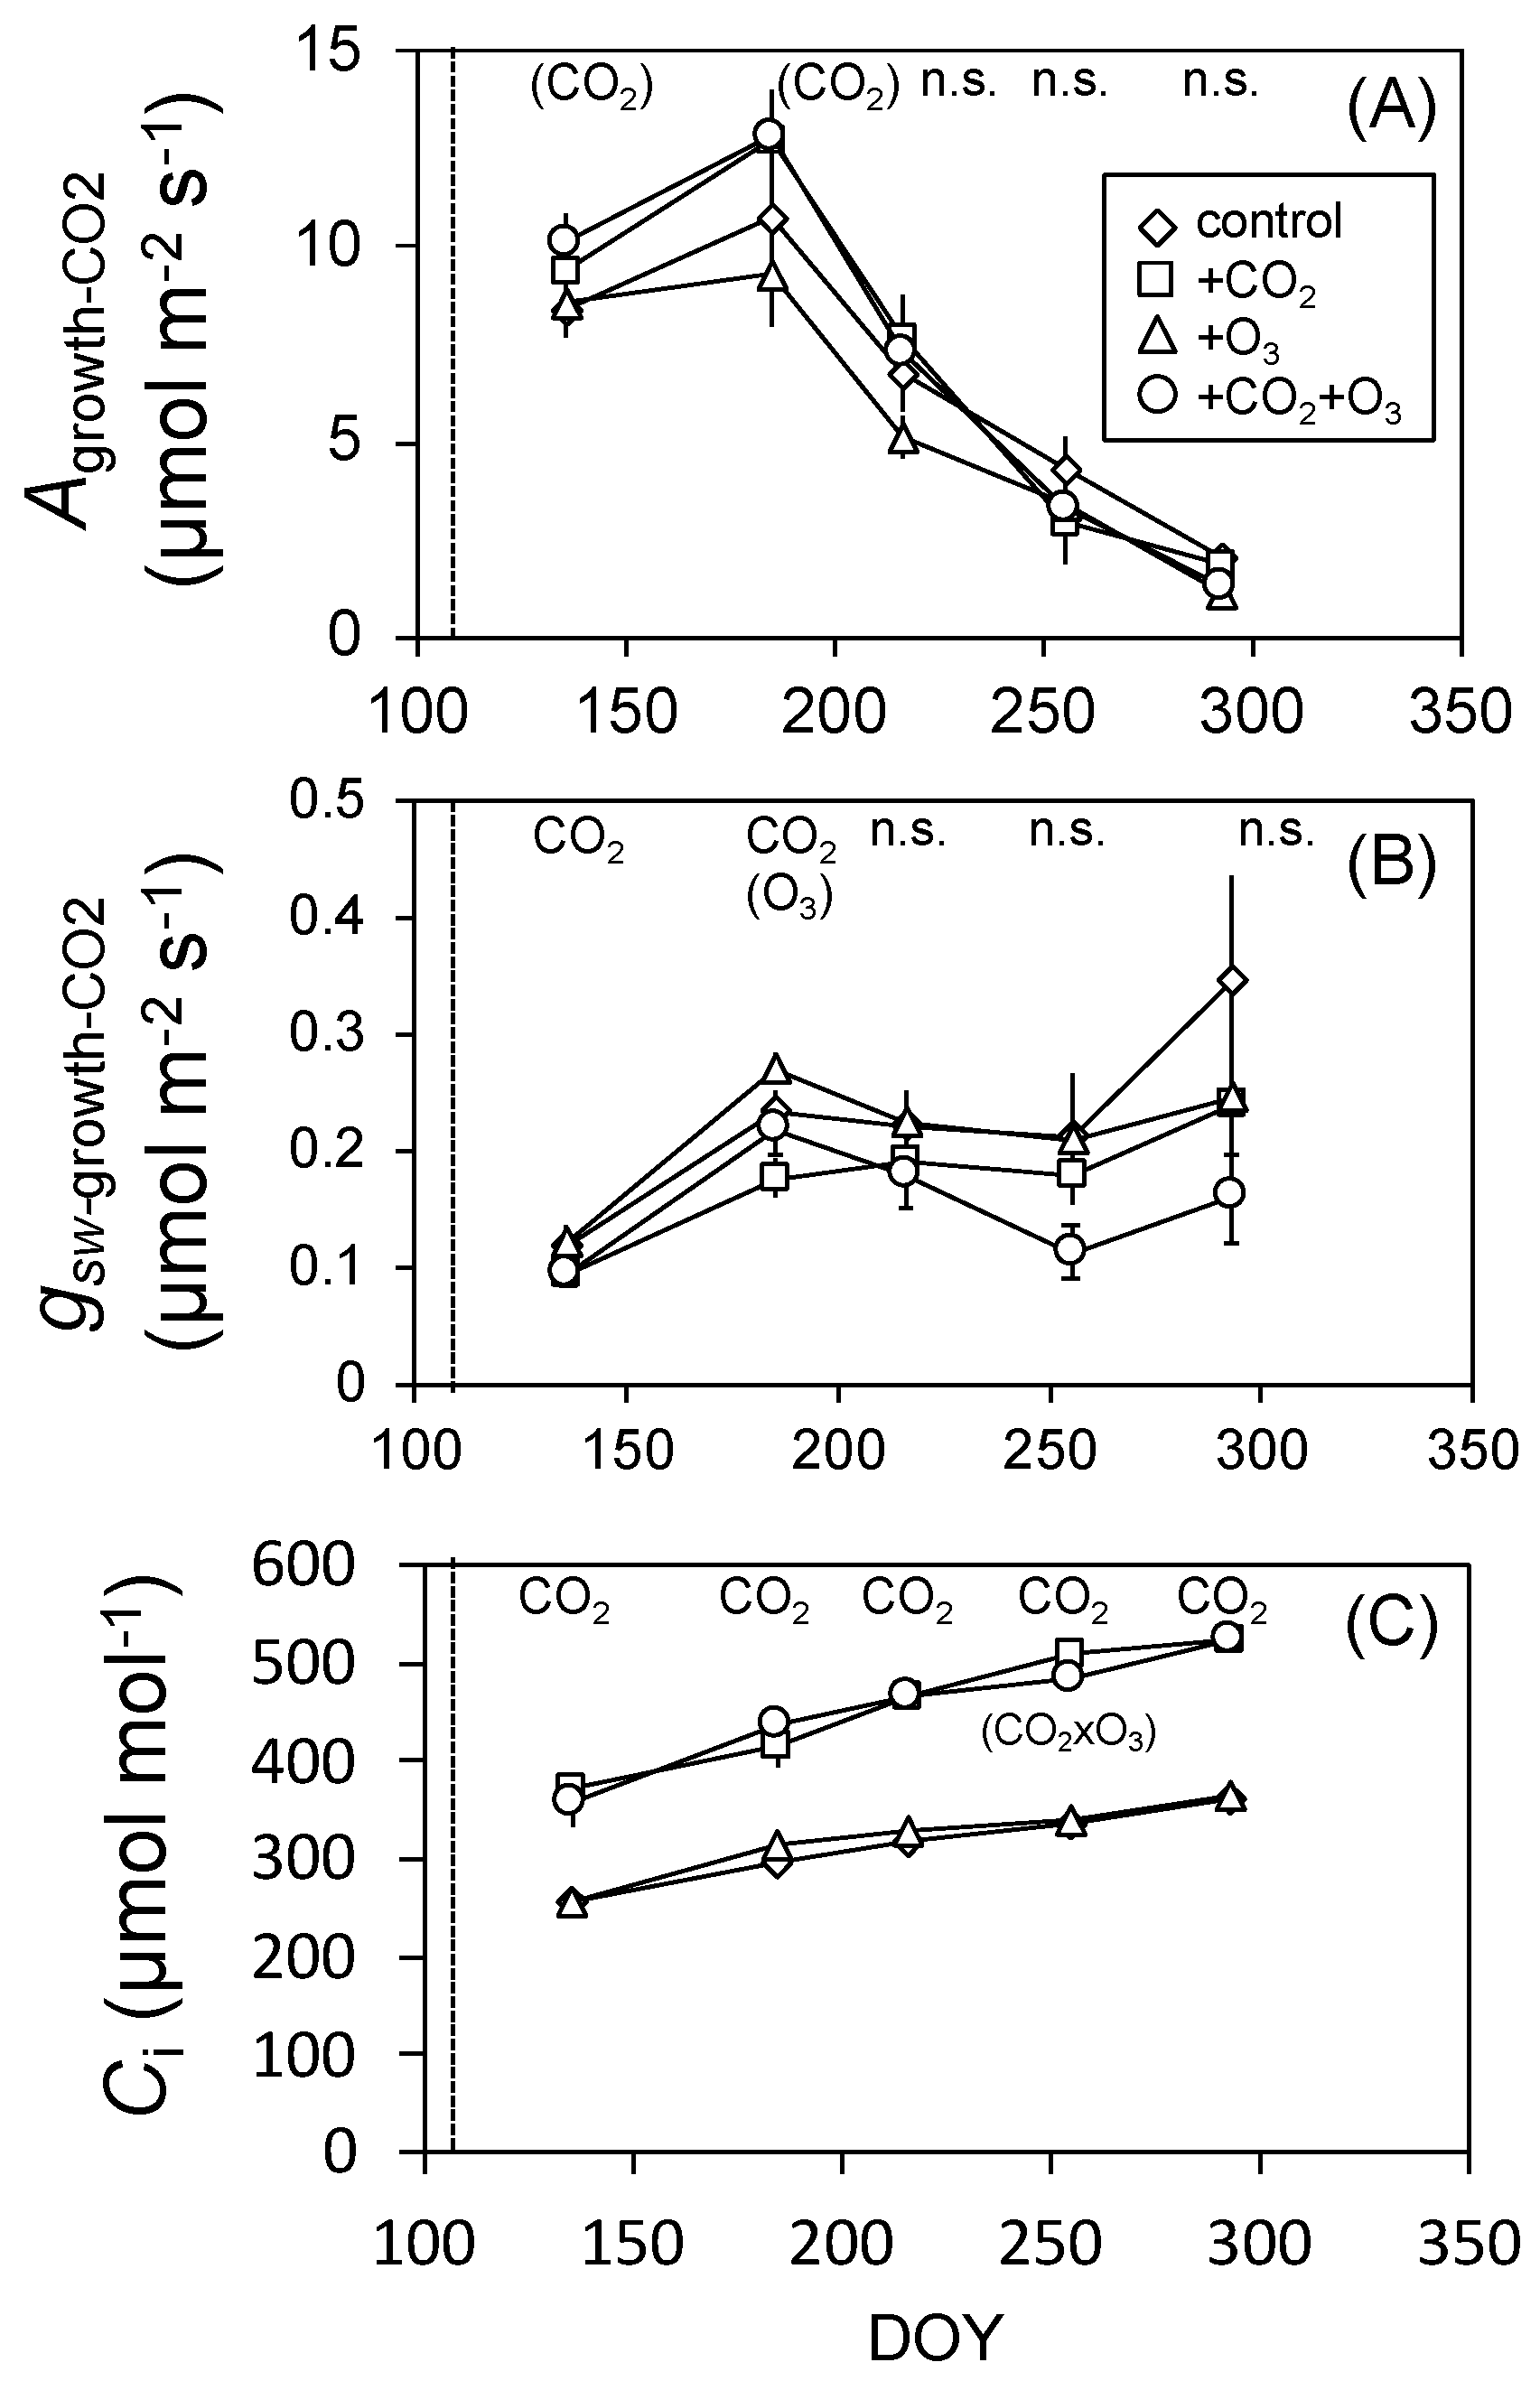
3.1. Photosynthesis
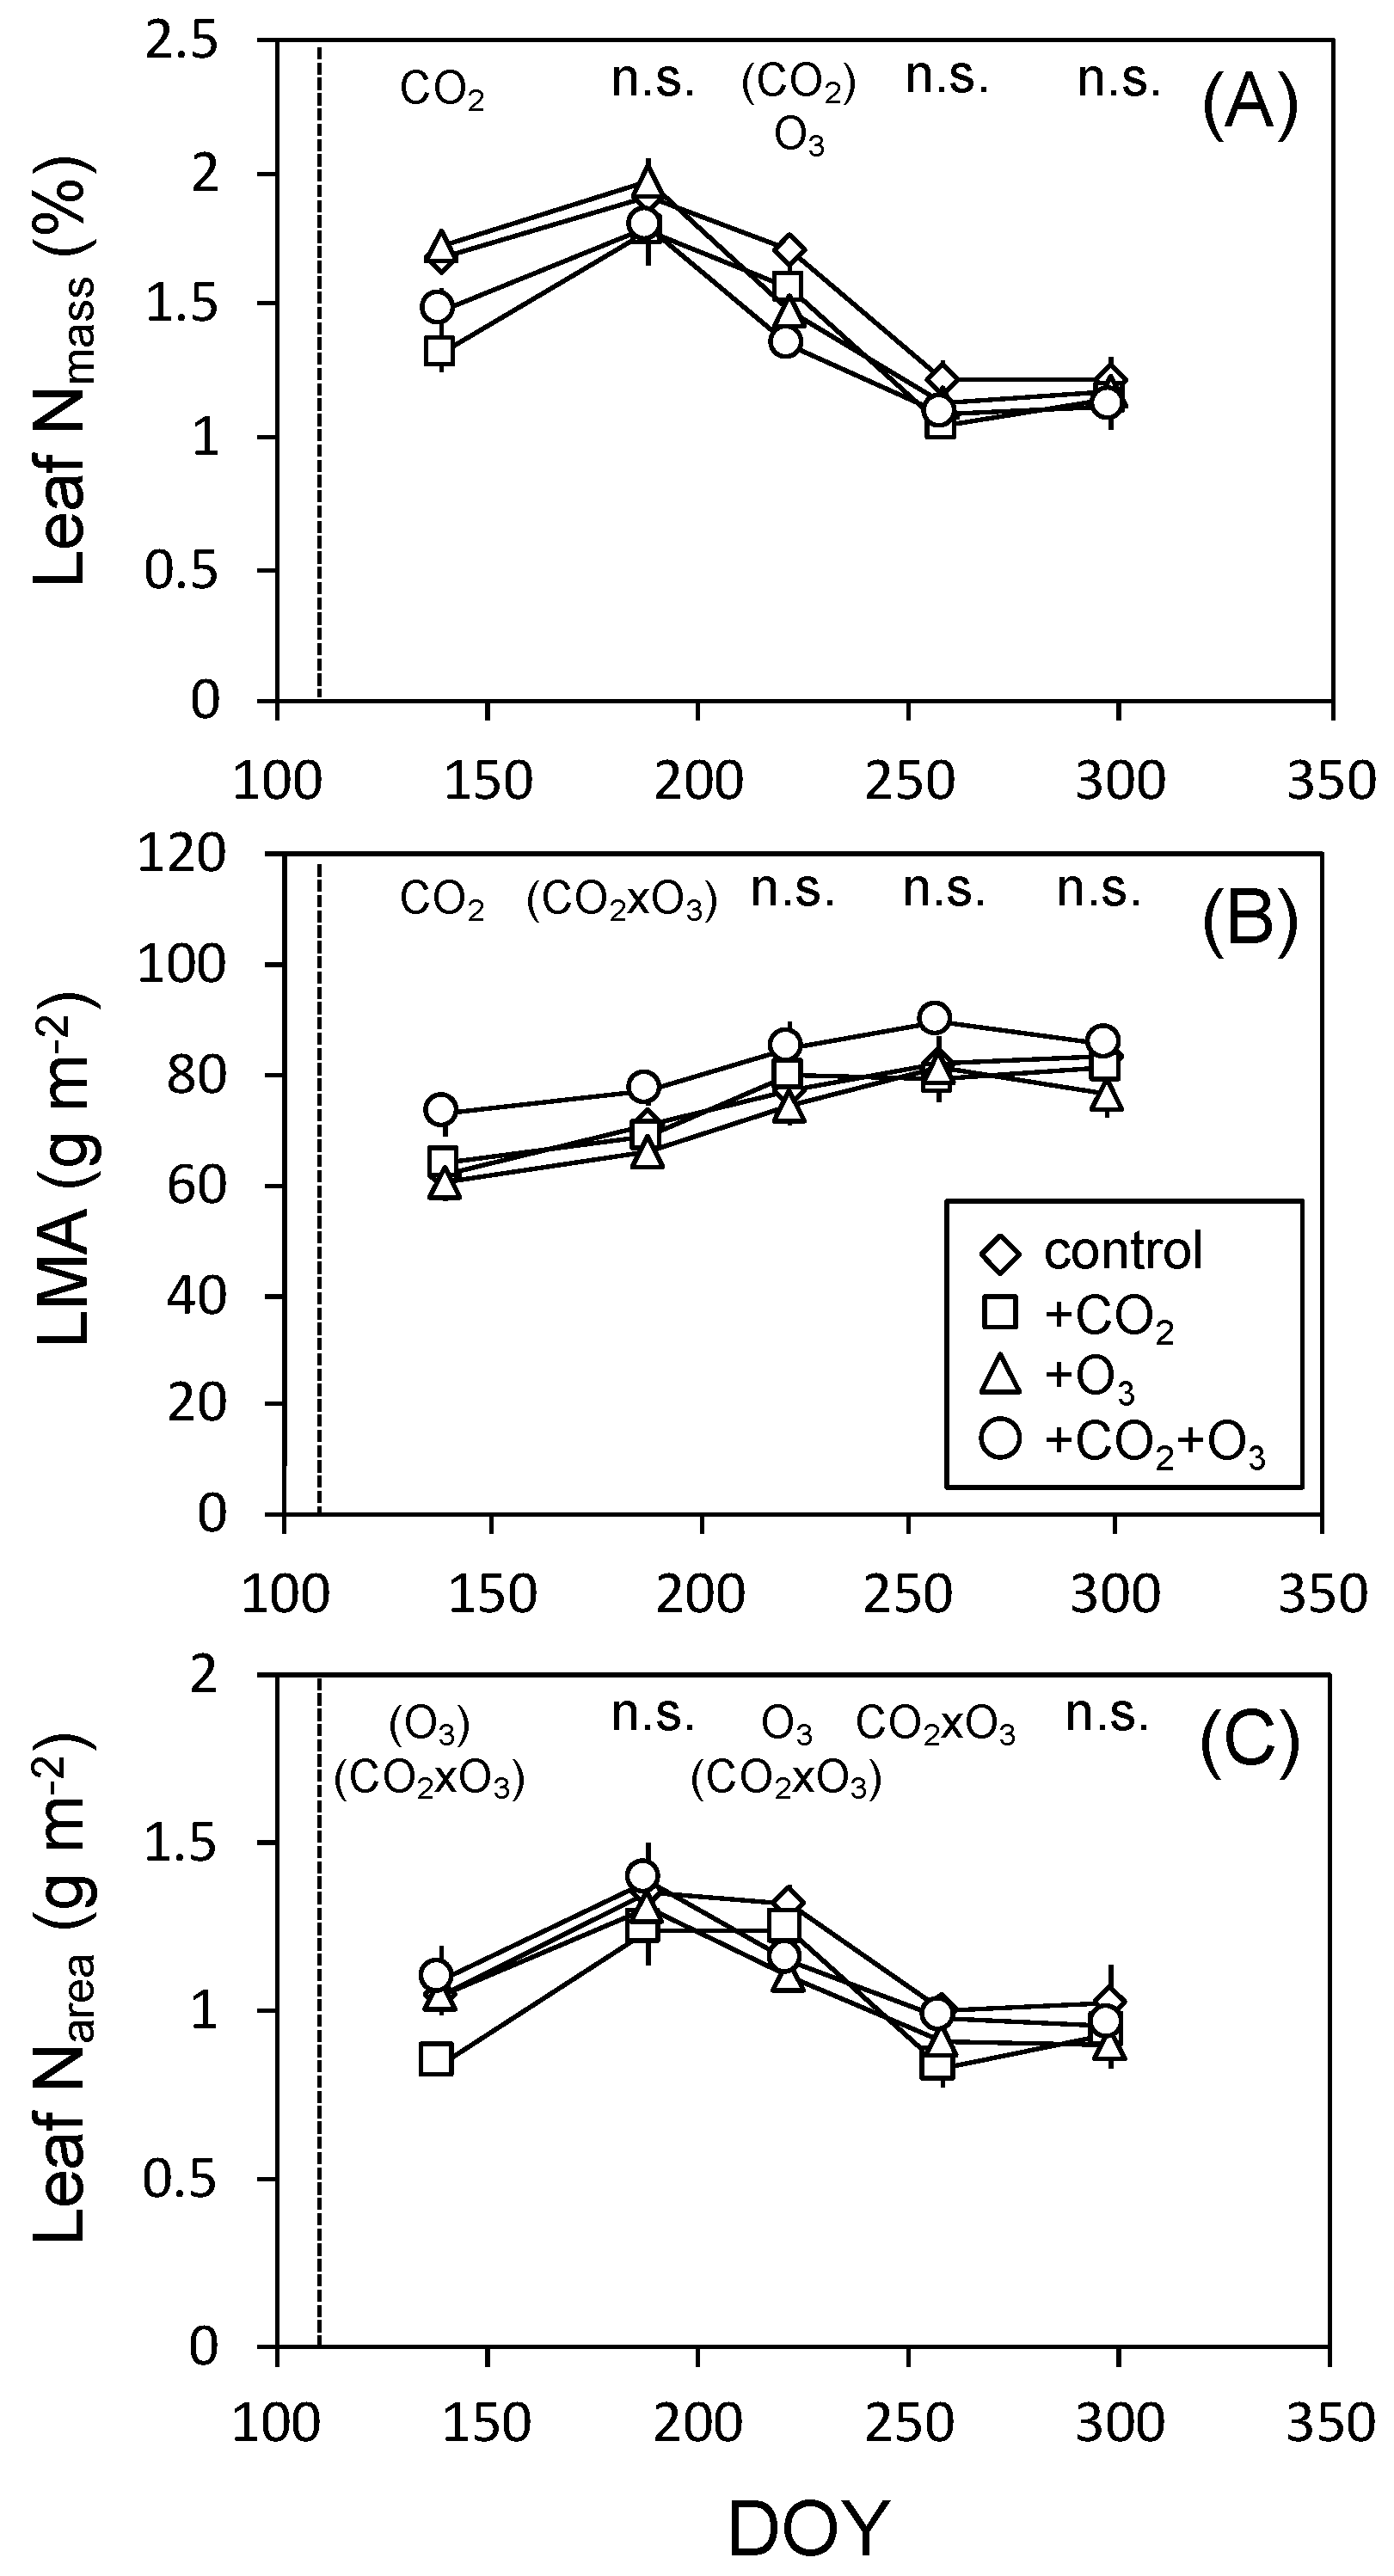
3.2. Leaf Characteristics
3.3. Plant Biomass
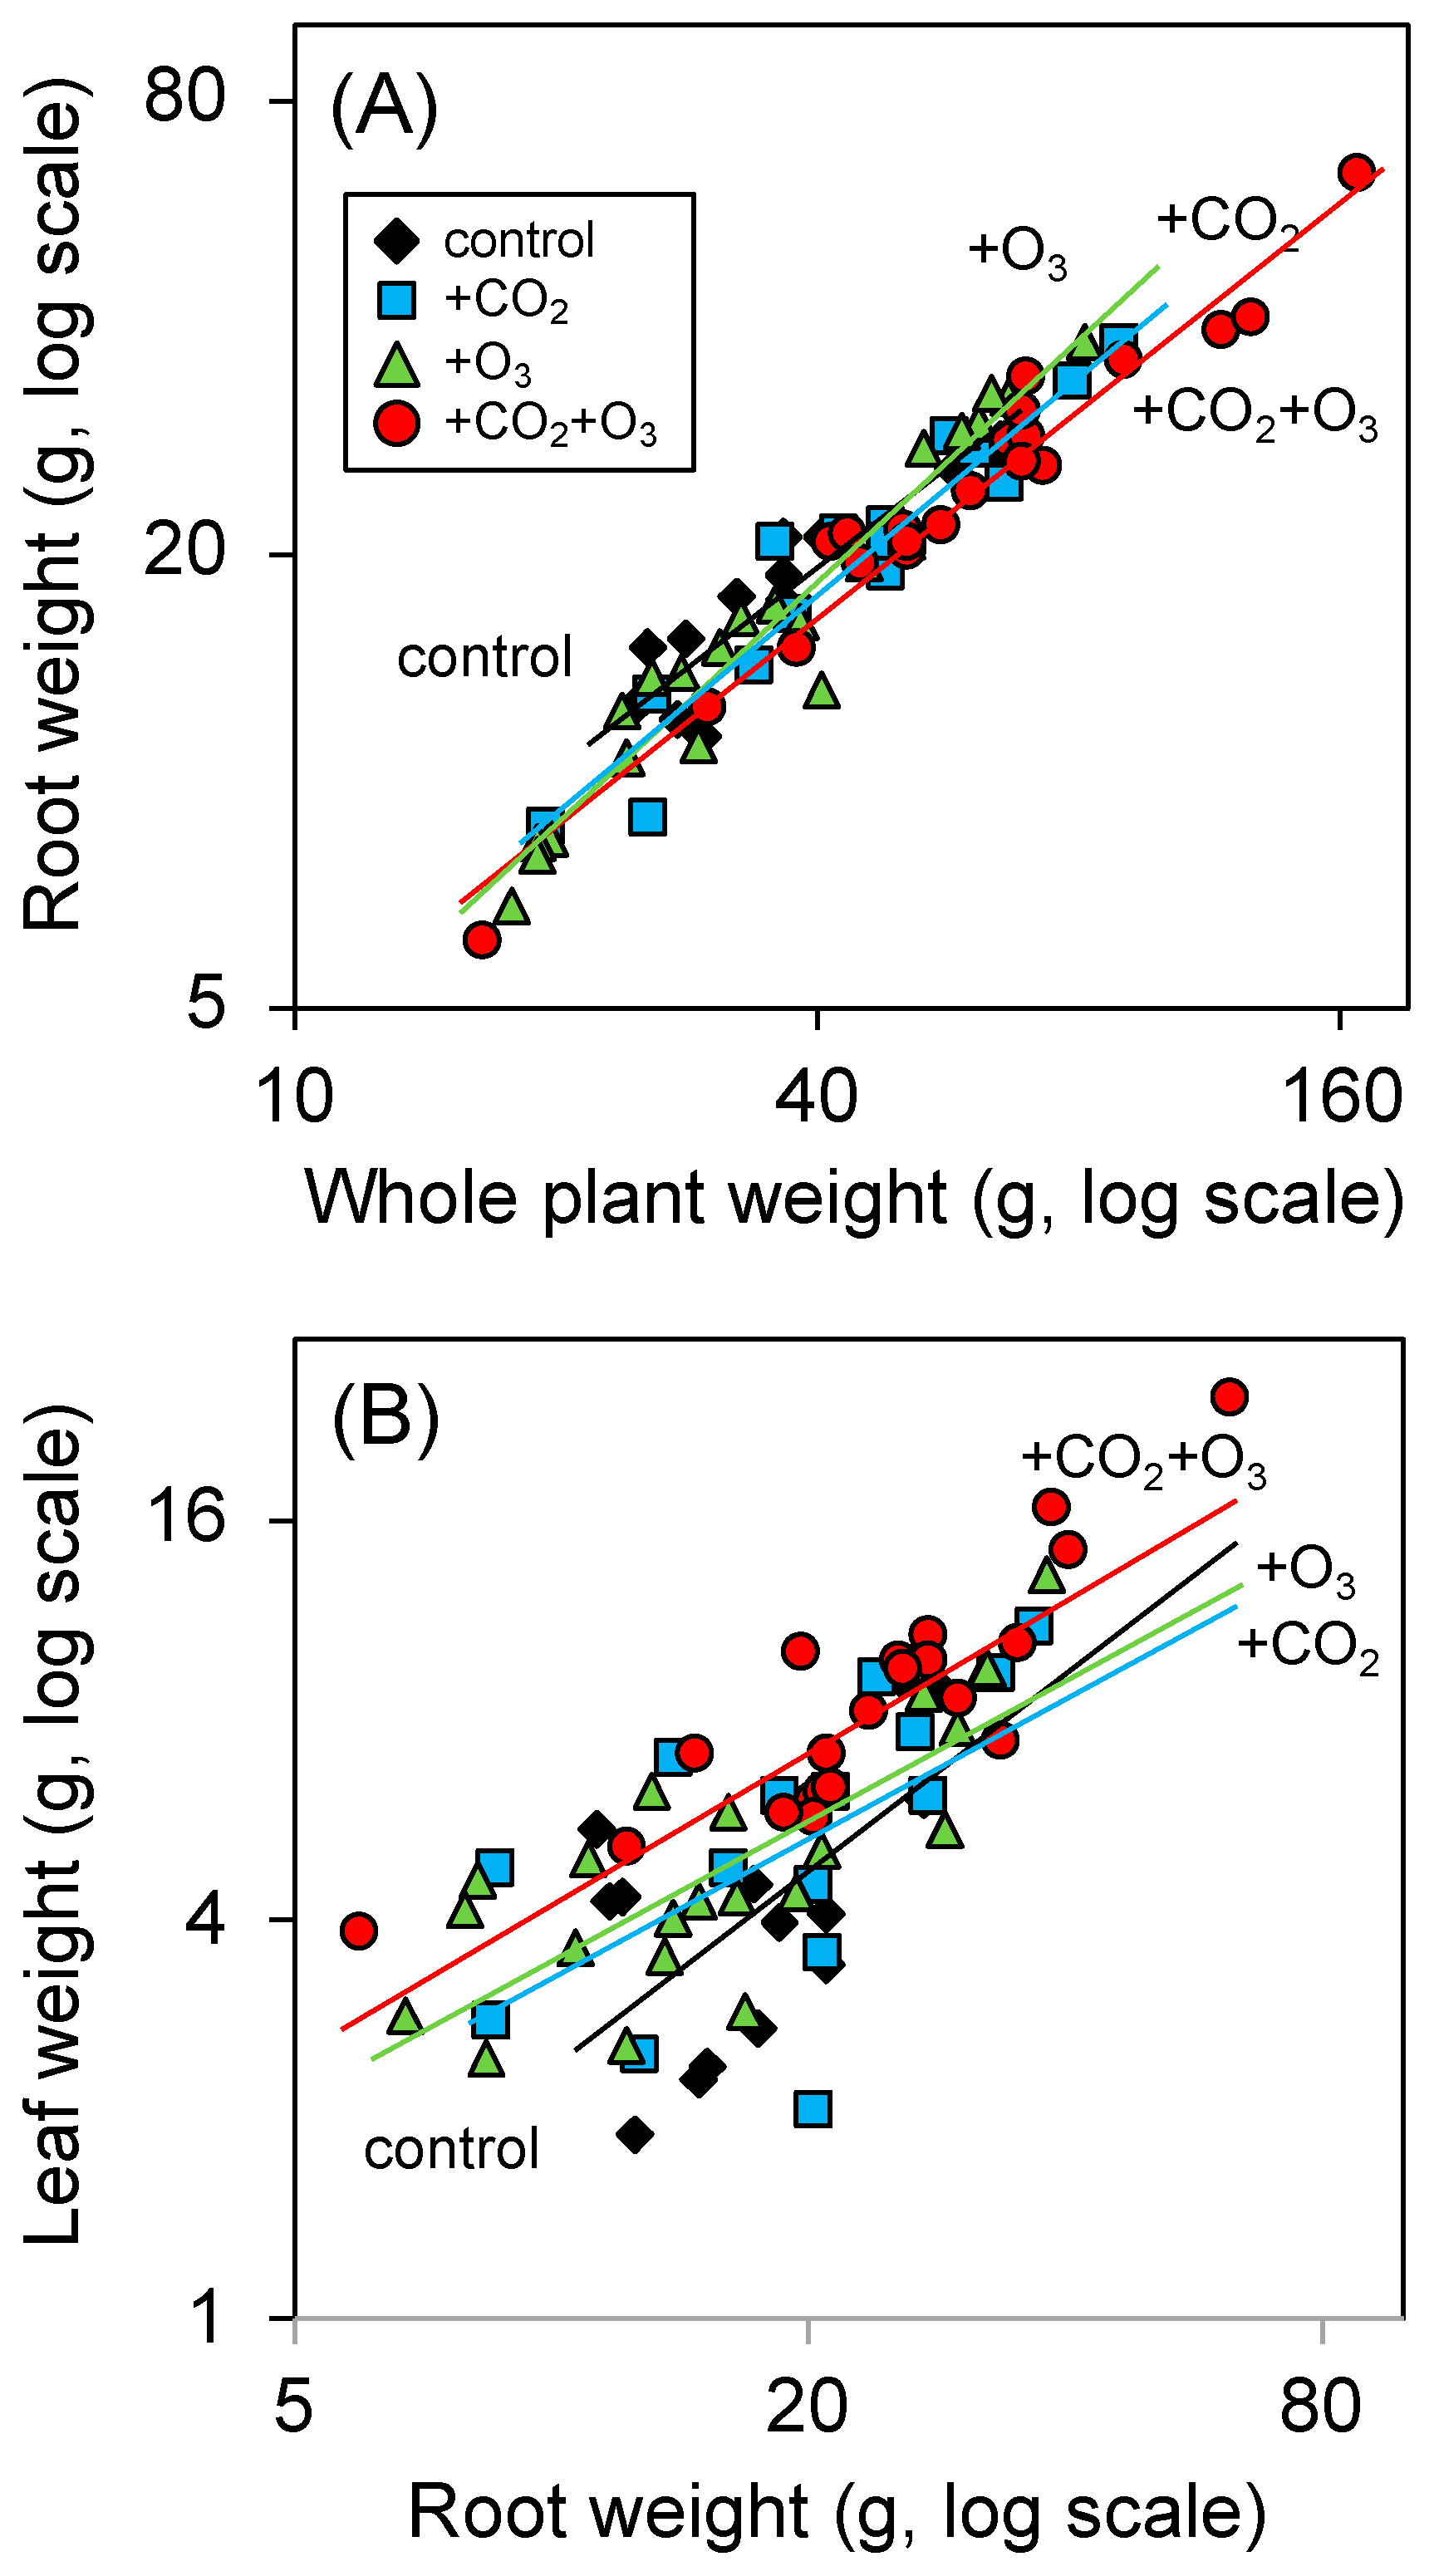
3.4. Biomass Allocation
4. Discussion
5. Conclusions
Author Contributions
Funding
Acknowledgments
Conflicts of Interest
References
- Chen, Z.; Shang, H.; Cao, J.; Yu, H. Effects of ambient ozone concentrations on contents of nonstructural carbohydrates in Phoebe bournei and Pinus massoniana seedlings in subtropical China. Water Air Soil Pollut. 2015, 226, 310–317. [Google Scholar] [CrossRef]
- Dentener, F.; Stevenson, D.; Ellingsen, K.; van Noije, T.; Schultz, M.; Amann, M.; Atherton, C.; Bell, N.; Bergmann, D.; Bey, I.; et al. The global atmospheric environment for the next generation. Environ. Sci. Technol. 2006, 40, 3586–3594. [Google Scholar] [CrossRef] [PubMed]
- Feng, Z.; Büker, P.; Pleijel, H.; Emberson, L.; Karlsson, P.E.; Uddling, J. A unifying explanation for variation in ozone sensitivity among woody plants. Glob. Chang. Biol. 2018, 24, 78–84. [Google Scholar] [CrossRef] [PubMed]
- IPCC. Climate Change 2013: The Physical Science Basis; Stocker, T.F., Qin, D., Plattner, G.-K., Tignor, M., Allen, S.K., Boschung, J., Nauels, A., Xia, Y., Bex, B., Midgley, P.M., Eds.; Contribution of Working Group I to the Fifth Assessment Report of the Intergovernmental Panel on Climate Change; Cambridge University Press: Cambridge, UK, 2013. [Google Scholar]
- Monks, P.S.; Archibald, A.T.; Colette, A.; Cooper, O.; Coyle, M.; Derwent, R.; Fowler, D.; Granier, C.; Law, K.S.; Mills, G.E.; et al. Tropospheric ozone and its precursors from the urban to the global scale from air quality to short-lived climate forcer. Atmos. Chem. Phys. 2015, 15, 8889–8973. [Google Scholar] [CrossRef] [Green Version]
- Ashmore, M.R. Assessing the future global impacts of ozone on vegetation. Plant Cell Environ. 2005, 28, 949–964. [Google Scholar] [CrossRef]
- Karnosky, D.F.; Pregitzer, K.S.; Zak, D.R.; Kubiske, M.E.; Hendrey, G.R.; Weinstein, D.; Nosal, M.; Percy, K.E. Scaling ozone responses of forest trees to the ecosystem level in a changing climate. Plant Cell Environ. 2005, 28, 965–981. [Google Scholar] [CrossRef] [Green Version]
- Lindroth, R.L. Atmospheric change, plant secondary metabolites and ecological interactions. In The Ecology of Plant Secondary Metabolites: From Genes to Global Progresses; Iason, G.R., Dick, M., Hartley, S.E., Eds.; Cambridge University Press: Cambridge, UK, 2012; pp. 120–153. [Google Scholar]
- Wittig, V.E.; Ainsworth, E.A.; Naidu, S.L.; Karnosky, D.F.; Long, S.P. Quantifying the impact of current and future tropospheric ozone on tree biomass, growth, physiology and biochemistry: A quantitative meta-analysis. Glob. Chang. Biol. 2009, 15, 396–424. [Google Scholar] [CrossRef]
- Ainsworth, E.A.; Davey, P.A.; Hymus, G.J.; Osborne, C.P.; Roger, A.; Blum, H.; Nösberger, J.; Long, S.P. Is stimulation of leaf photosynthesis by elevated carbon dioxide concentration maintained in the long term? A test with Lolium perenne grow for 10 years at two nitrogen fertilization levels under Free Air CO2 Enrichment (FACE). Plant Cell Environ. 2003, 26, 705–714. [Google Scholar] [CrossRef]
- Davey, P.A.; Olcer, H.; Zakhleniuk, O.; Bernacchi, C.J.; Calfapietra, C.; Long, S.P.; Raines, C.A. Can fast-growing plantation trees escape biochemical down-regulation of photosynthesis when grown throughout their complete production cycle in the open air under elevated carbon dioxide? Plant Cell Environ. 2006, 29, 1235–1244. [Google Scholar] [CrossRef]
- Zak, D.R.; Pregitzer, K.S.; Kubiske, M.E.; Burton, A.J. Forest productivity under elevated CO2 and O3: Positive feedbacks to soil N cycling sustain decade-long net primary productivity enhancement by CO2. Ecol. Lett. 2011, 14, 1220–1226. [Google Scholar] [CrossRef]
- Norby, R.J.; Warren, J.M.; Iversen, C.M.; Medlyn, B.E.; McMurtrie, R.E. CO2 enhancement of forest productivity constrained by limited nitrogen availability. Proc. Natl. Acad. Sci. USA 2010, 107, 19368–19373. [Google Scholar] [CrossRef] [PubMed]
- Sigurdsson, B.D.; Medhurst, J.L.; Wallin, G.; Eggertsson, O.; Linder, S. Growth of mature boreal Norway spruce was not affected by elevated [CO2] and/or air temperature unless nutrient availability was improved. Tree Physiol. 2013, 33, 1192–1205. [Google Scholar] [CrossRef] [PubMed]
- Li, P.; Calatayud, V.; Gao, F.; Uddling, J.; Feng, Z. Differences in ozone sensitivity among woody species are related to leaf morphology and antioxidant levels. Tree Physiol. 2016, 36, 1105–1116. [Google Scholar] [CrossRef] [PubMed] [Green Version]
- Matyssek, R.; Sandermann, H. Impact of ozone on trees: An ecophysiological perspective. Prog. Bot. 2003, 64, 349–404. [Google Scholar]
- Matyssek, R.; Wieser, G.; Ceulemans, R.; Rennenberg, H.; Pretzsch, H.; Haberer, K.; Low, M.; Nunn, A.J.; Werner, H.; Wipfler, P.; et al. Enhanced ozone strongly reduces carbon sink strength of adult beech (Fagus sylvatica)-Resume from the free-air fumigation study at Kranzberg forest. Environ. Pollut. 2010, 158, 2527–2532. [Google Scholar] [CrossRef] [PubMed]
- Pretzsch, H.; Dieler, J.; Matyssek, R.; Wipfler, P. Tree and stand growth of mature Norway spruce and European beech under long-term ozone fumigation. Environ. Pollut. 2010, 158, 1061–1070. [Google Scholar] [CrossRef]
- Ritter, W.; Andersen, C.P.; Matyssek, R.; Grams, T.E.E. Carbon flux to woody tissues in a beech/spruce forest during summer and in response to chronic O3 exposure. Biogeosciences 2011, 8, 3127–3138. [Google Scholar] [CrossRef]
- Sitch, S.; Cox, P.M.; Collins, W.J.; Huntingford, C. Indirect radiative forcing of climate change through ozone effects on the land-carbon sink. Nature 2007, 448, 791–795. [Google Scholar] [CrossRef] [PubMed]
- Grams, T.E.E.; Anegg, S.; Haberle, K.; Langebartlet, C.; Matyssek, R. Interactions of chronic exposure to elevated CO2 and O3 level in the photosynthetic light and dark reactions of European beech (Fagus sylvatica). New Phytol. 1999, 144, 95–107. [Google Scholar] [CrossRef]
- Percy, K.E.; Nosal, M.; Heilman, W.; Dann, T.; Sobre, J.; Legge, A.H.; Karnosky, D.F. New exposure-based metric approach for evaluating O3 risk to North American aspen forests. Environ. Pollut. 2007, 147, 554–566. [Google Scholar] [CrossRef]
- Volk, M.; Bungener, P.; Contat, F.; Montani, M.; Fuhrer, J. Grassland yield declined by a quarter in 5 years of free-air ozone fumigation. Glob. Chang. Biol. 2006, 12, 74–83. [Google Scholar] [CrossRef]
- Cao, J.; Chen, Z.; Yu, H.; Shang, H. Differential responses in non-structural carbohydrates of Machilus ichangensis Rehd. et Wils. and Taxus wallichiana Zucc. Var. chinensis (Pilg.) florin seedlings to elevated Ozone. Forests 2017, 8, 323–334. [Google Scholar]
- Chen, Z.; Cao, J.; Yu, H.; Shang, H. Effects of elevated ozone levels on photosynthesis, biomass and non-structural carbohydrates of Phoebe bournei and Phoebe zhennan in subtropical China. Front. Plant Sci. 2018, 9, 1764–1772. [Google Scholar] [CrossRef] [PubMed]
- Agathokleous, E.; Saitanis, C.J.; Wang, X.; Watanabe, M.; Koike, T. A review study on past 40 years of research on effects of tropospheric O3 on belowground structure, functioning, and processes of trees: A linkage with potential ecological implications. Water Air Soil Pollut. 2016, 227, 33. [Google Scholar] [CrossRef]
- Feng, Z.; Li, P. Effects of ozone on Chinese trees. In Air Pollution Impacts on Plants in East Asia; Springer Japan: Tokyo, Japan, 2017; pp. 195–219. [Google Scholar]
- Karlsson, P.E.; Uddling, J.; Skärby, L.; Wallin, G.; Sell-dén, G. Impact of ozone on the growth of birch (Betula pendula) saplings. Environ. Pollut. 2003, 124, 485–495. [Google Scholar] [CrossRef]
- Oksanen, E.; Rousi, M. Differences of Betula origins in ozone sensitivity based on open-field experiment over two growing seasons. Can. J. For. Res. 2001, 31, 804–811. [Google Scholar] [CrossRef]
- Winkler, B.; Fleischmann, F.; Gayler, S.; Scherb, H.; Matyssek, R.; Grams, T.E.E. Do chronic aboveground O3 exposure and belowground pathogen stress affect growth and belowground biomass partitioning of juvenile beech trees (Fagus sylvatica L.)? Plant Soil 2009, 323, 31–44. [Google Scholar] [CrossRef]
- Ainsworth, E.A. Understanding and improving global crop response to ozone pollution. Plant J. 2017, 90, 886–897. [Google Scholar] [CrossRef] [PubMed]
- Li, P.; DeMarco, A.; Feng, Z.Z.; Anav, A.; Zhou, D.J.; Paoletti, E. Nationwide ground-level ozone measurements in China suggest serious risks to forests. Environ. Pollut. 2018, 237, 803–813. [Google Scholar] [CrossRef]
- King, J.S.; Liu, L.; Aspinwall, M.J. Tree and forest responses to interacting elevated atmospheric CO2 and tropospheric O3: A synthesis of experimental evidence. In Climate Change, Air Pollution and Global Challenges: Understanding Solutions from Forest Research; Matyssek, R., Clarke, N., Cudlin, P., Mikkelsen, T.N., Tuovinen, J.-P., Wieser, G., Paoletti, E., Eds.; Elsevier Physical Sciences Series; Elsevier: San Diego, CA, USA, 2013; Volume 13, pp. 179–208. [Google Scholar]
- Feng, Z.Z.; Tang, H.Y.; Uddling, J.; Pleijel, H.; Kobayashi, K.; Zhu, J.G.; Oue, H.; Guo, W.S. A stomatal ozone flux-response relationship to assess ozone-induced yield loss of winter wheat in subtropical China. Environ. Pollut. 2012, 164, 16–23. [Google Scholar] [CrossRef]
- Hoshika, Y.; Katata, G.; Deushi, M.; Watanabe, M.; Koike, T.; Paoletti, E. Ozone-induced stomatal sluggishness changes carbon and water balance of temperate deciduous forests. Sci. Rep. 2015, 5, 9871. [Google Scholar] [CrossRef] [PubMed]
- Bader, M.K.F.; Leuzinger, S.; Sonja, G.; Keel, S.G.; Rolf, T.W.; Siegwolf, R.T.W.; Hagedorn, F.; Schleppi, P.; Körner, C. Central European hardwood trees in a high-CO2 future: Synthesis of an 8-year forest canopy CO2 enrichment project. J. Ecol. 2013, 101, 1509–1519. [Google Scholar] [CrossRef]
- Knepp, R.G.; Hamilton, J.G.; Mohan, J.E.; Zangerl, A.R.; Berenbaum, M.R.; DeLucia, E.H. Elevated CO2 reduces leaf damage by insect herbivores in a forest community. New Phytol. 2005, 167, 207–218. [Google Scholar] [CrossRef] [PubMed]
- Koike, T.; Watanabe, M.; Watanabe, Y.; Agathokleous, E.; Eguchi, N.; Takagi, K.; Satoh, F.; Kitaoka, S.; Funada, R. Ecophysiology of deciduous trees native to northeast Asia grown under FACE (Free Air CO2 Enrichment). J. Agric. Meteorol. 2015, 71, 174–184. [Google Scholar] [CrossRef]
- Norby, R.J.; Zak, D.R. Ecological lessons from free-air CO2 enrichment (FACE) experiments. Annu. Rev. Ecol. Evol. Syst. 2011, 42, 181–203. [Google Scholar] [CrossRef]
- Matyssek, R.; Kozovits, A.R.; Wieser, G.; King, J.; Rennenberg, H. Woody-plant ecosystems under climate change and air pollution-response consistencies across zonobiomes? Tree Physiol. 2017, 37, 706–732. [Google Scholar] [CrossRef]
- Hiraoka, Y.; Iki, T.; Nose, M.; Tobita, H.; Tazaki, K.; Watanabe, A.; Fujisawa, I.; Kitao, M. Species characteristics and intraspecific variation in growth and photosynthesis of Cryptomeria japonica under elevated O3 and CO2. Tree Physiol. 2017, 37, 1–11. [Google Scholar] [CrossRef]
- Hoshika, Y.; Watanabe, M.; Inada, N.; Koike, T. Ozone-induced stomatal sluggishness develops progressively in Siebold’s beech (Fagus crenata). Environ. Pollut. 2012, 166, 152–156. [Google Scholar] [CrossRef]
- Koike, T.; Kawaguchi, K.; Hoshika, Y.; Kita, K.; Watanabe, M.; Mao, Q.; Inada, N. Growth and photosynthetic responses of cuttings of a hybrid larch (Larix gmelinii var. japonica x L. kaempferi) to elevated ozone and/or carbon dioxide. Asian J. Atmos. Environ. 2012, 6, 104–110. [Google Scholar]
- Kitao, M.; Tobita, H.; Kitaoka, S.; Harayama, H.; Yazaki, K.; Komatsu, M.; Agathokleous, E.; Koike, T. Light Energy Partitioning under Various Environmental Stresses Combined with Elevated CO2 in Three Deciduous Broadleaf Tree Species in Japan. Climate 2019, 7, 79. [Google Scholar] [CrossRef]
- Kitao, M.; Komatsu, M.; Yazaki, K.; Kitaoka, S.; Tobita, H. Growth overcompensation against O3 exposure in two Japanese oak species, Quercus mongolica var. crispula and Quercus serrata, grown under elevated CO2. Environ. Pollut. 2015, 206, 133–141. [Google Scholar] [PubMed]
- Watanabe, M.; Yamaguchi, M.U.; Koike, T.; Izuta, T. Effects of ozone on Japanese trees. In Air Pollution Impacts on Plants in East Asia; Springer Japan: Tokyo, Japan, 2017; pp. 73–100. [Google Scholar]
- Yamaguchi, M.; Watanabe, M.; Matsumura, H.; Kohno, Y.; Izuta, T. Experimental studies on the effects of ozone on growth and photosynthetic activity of Japanese forest tree species. Asian J. Atmos. Environ. 2011, 5, 65–78. [Google Scholar] [CrossRef]
- Nakashizuka, T.; Iida, S. Composition, dynamics and disturbance regime of temperate deciduous forests in Monsoon Asia. Vegetation 1995, 121, 23–30. [Google Scholar] [CrossRef]
- Kitao, M.; Yasuda, Y.; Kominami, Y.; Yamanoi, K.; Komatsu, M.; Miyama, T.; Mizoguchi, Y.; Kitaoka, S.; Yazaki, K.; Tobita, H.; et al. Increased phytotoxic O3 dose accelerates autumn senescence in an O3-sensitive beech forest even under the present-level O3. Sci. Rep. 2016, 6, 32549. [Google Scholar] [CrossRef]
- Watanabe, M.; Yamaguchi, M.U.; Koike, T.; Izuta, T. Growth and photosynthetic response of Fagus crenata seedlings to ozone and/or elevated carbon dioxide. Landsc. Ecol. Eng. 2010, 6, 181–190. [Google Scholar] [CrossRef]
- Matsumura, H.; Mikami, C.; Sakai, Y.; Murayama, K.; Izuta, T.; Yonekura, T.; Miwa, M.; Kohno, Y. Impact of elevated O3 and/or CO2 on growth of Betula platyphylla, Betula ermanii, Fagus crenata, Pinus densiflora and Cryptomeria japonica seedlings. J. Agric. Meteorol. 2005, 60, 1121–1124. [Google Scholar] [CrossRef]
- Watanabe, M.; Hoshika, Y.; Koike, T.; Izuta, T. Combined effects of ozone and other environmental factors on Japanese trees. In Air Pollution Impacts on Plants in East Asia; Springer Japan: Tokyo, Japan, 2017; pp. 101–110. [Google Scholar]
- Kikuzawa, K. Leaf survival of woody plant in deciduous broad-leaved forests. 1. Tall trees. Can. J. Bot. 1983, 61, 2133–2139. [Google Scholar] [CrossRef]
- Erbs, M.; Fangmeier, A. A chamberless field exposure system for ozone enrichment of short vegetation. Environ. Pollut. 2005, 133, 91–102. [Google Scholar] [CrossRef]
- Farquhar, G.D.; von Caemmerer, S.; Berry, J.A. A biochemical model of photosynthetic acclimation in leaves of C3 species. Planta 1980, 149, 78–90. [Google Scholar] [CrossRef]
- Bernacchi, C.J.; Singsaas, E.L.; Pimentel, C.; Portis, A.R.; Long, S.P. Improved temperature response functions for models of Rubisco-limited photosynthesis. Plant Cell Environ. 2001, 24, 253–259. [Google Scholar] [CrossRef]
- Schreiber, U.; Bilger, W.; Neubauer, C. Chlorophyll fluorescence as a nonintrusive indicator for rapid assessment of in vivo photosynthesis. In Ecophysiology of Photosynthesis; Schulze, E.-D., Caldwell, M.M., Eds.; Springer: Berlin/Heidelberg, Germany, 1994; pp. 49–70. [Google Scholar]
- Sokal, R.R.; Rohlf, F.J. Biometry, 4th ed.; WH Freeman & Co: New York, NY, USA, 2011; p. 960. [Google Scholar]
- Atkin, O.K.; Bloomfield, K.J.; Reich, P.B.; Tjoelker, M.G.; Asner, G.P.; Bonal, D.; Bönisch, G.; Bradford, M.G.; Cernusak, L.A.; Cosio, E.G.; et al. Global variability in leaf respiration in relation to climate, plant functional types and leaf traits. New Phytol. 2015, 206, 614–636. [Google Scholar] [CrossRef] [PubMed] [Green Version]
- Warton, D.I.; Duursma, R.A.; Falster, D.S.; Taskinen, S. smart 3- an R package for estimation an inference about allometric lines. Methods Ecol. Evol. 2012, 3, 257–259. [Google Scholar] [CrossRef]
- R Core Team. R: A Language and Environment for Statistical Computing; R Foundation for Statistical Computing: Vienna, Austria, 2015; Available online: http://www.R-project.org/ (accessed on 3 March 2016).
- Agathokleous, E.; Watanabe, M.; Eguchi, N.; Nakaji, T.; Satoh, F.; Koike, T. Root production of Fagus crenata blume saplings grown in two soils and exposed to elevated CO2 concentration: An 11-year free-air-CO2 enrichment (FACE) experiment in northern Japan. Water Air Soil Pollut. 2016, 227, 187. [Google Scholar] [CrossRef]
- Tobita, H.; Uemura, A.; Kitao, M.; Kitaoka, S.; Maruyama, Y.; Utsugi, H. Effects of elevated atmospheric carbon dioxide, soil nutrients and water conditions on photosynthetic and growth responses of Alnus hirsuta. Funct. Plant Biol. 2011, 38, 702–710. [Google Scholar] [CrossRef]
- Karonen, M.; Ossipov, V.; Ossipova, S.; Kapari, L.; Loponen, J.; Matsumura, H.; Kohno, Y.; Mikami, C.; Sakai, Y.; Izuta, T.; et al. Effects of elevated carbon dioxide and ozone on foliar proanthocyanidins in Betula platyphylla, Betula ermanii, and Fagus crenata seedlings. J. Chem. Ecol. 2006, 32, 1445–1458. [Google Scholar] [CrossRef] [PubMed]
- Landolt, W.; Buhlmann, U.; Bleuler, P.; Bucher, J.B. Ozone exposure-response relationships for biomass and root/shoot ratio of beech (Fagus sylvatica), ash (Fraxinus excelsior), Norway spruce (Picea abies) and Scot pine (Pinus sylvestris). Environ. Pollut. 2000, 109, 473–478. [Google Scholar] [CrossRef]
- Matyssek, R.; Bytnerowicz, A.; Karlsson, P.E.; Paoletti, E.; Sanz, M.; Schaub, M.; Wieser, G. Promoting the O3 flux concept for European forest trees. Environ. Pollut. 2007, 146, 587–607. [Google Scholar] [CrossRef]
- Nikolova, P.S.; Andersen, C.P.; Blaschke, H.; Matyssek, R.; Häberle, K.H. Belowground effects of enhanced tropospheric ozone and drought in a beech/spruce forest (Fagus sylvatica L./Picea abies [L.] Karst). Environ. Pollut. 2010, 158, 1071–1078. [Google Scholar] [CrossRef]
- Anderson, C.P.; Ritter, W.; Gregg, J.; Matyssek, R.; Grams, T.E.E. Below-ground carbon allocation in mature beech and spruce trees following long-term, experimentally enhanced O3 exposure in Southern Germany. Environ. Pollut. 2010, 158, 2604–2609. [Google Scholar] [CrossRef]
- Kinose, Y.; Fukamachi, Y.; Okabe, S.; Hiroshima, H.; Watanabe, M.; Izuta, T. Nutrient supply to soil offsets the ozone-induced growth reduction in Fagus crenata seedlings. Trees 2017, 31, 259–272. [Google Scholar] [CrossRef]
- Watanabea, M.; Okabea, S.; Kinosea, Y.; Hiroshimaa, H.; Izuta, T. Effects of ozone on soil respiration rate of Siebold’s beech seedlings grown under different soil nutrient conditions. J. Agric. Meteorol. 2019, 75, 39–46. [Google Scholar] [CrossRef]
- Kolb, T.E.; Matyssek, R. Limitation and perspectives about scaling ozone impacts in trees. Environ. Pollut. 2001, 115, 373–393. [Google Scholar] [CrossRef]
- Watanabe, M.; Hoshika, Y.; Koike, T. Photosynthetic responses of Monarch birch seedlings to differing timing of free air ozone fumigation. J. Plant Res. 2014, 127, 339–345. [Google Scholar] [CrossRef] [PubMed]


| Treatments | Agrowth-CO2 (µmol m−2 s−1) | gsw-growth-CO2 (µmol m−2 s−1) | Vcmax25 (µmol m−2 s−1) | Predawn-Fv/Fm | ||
|---|---|---|---|---|---|---|
| (May) | (July) | (May) | (July) | (August) | (October) | |
| Control | 8.4 ± 0.8 | 10.8 ± 1.6 | 0.12 ± 0.01 | 0.23 ± 0.02 | 30.1 ± 3.5 | 0.76 ± 0.01 |
| +CO2 | 9.4 ± 0.3 | 12.7 ± 1.3 | 0.09 ± 0.01 | 0.18 ± 0.02 | 23.0 ± 2.1 | 0.78 ± 0.01 |
| +O3 | 8.6 ± 0.6 | 9.3 ± 1.4 | 0.12 ± 0.01 | 0.27 ± 0.01 | 21.9 ± 2.0 | 0.65 ± 0.04 |
| +CO2+O3 | 10.1 ± 0.7 | 12.9 ± 1.1 | 0.09 ± 0.01 | 0.22 ± 0.02 | 22.2 ± 2.8 | 0.72± 0.01 |
| Effect | ||||||
| CO2 (F1,8) | 3.7 n.s. | 4.0 n.s. | 6.34 * | 8.94 * | 1.65 n.s. | 0.08 n.s. |
| O3 (F1,8) | 0.5 n.s. | 0.2 n.s. | 0.05 n.s. | 4.90 n.s. | 2.86 n.s. | 2.97 n.s. |
| CO2 × O3 (F1,8) | 0.2 n.s. | 0.3 n.s. | 0.00 n.s. | 0.01 n.s. | 1.93 n.s. | 0.03 n.s. |
| Treatments | Total | Leaf | Current Shoot | Stem and Shoot | Root |
|---|---|---|---|---|---|
| Control | 43.3 ± 9.6 | 5.5 ± 1.5 | 8.8 ± 3.2 | 8.7 ± 1.3 | 20.3 ± 3.7 |
| +CO2 | 45.4 ± 6.4 | 5.3 ± 1.3 | 10.0 ± 2.6 | 10.2 ± 1.6 | 19.9 ± 2.2 |
| +O3 | 39.2 ± 0.7 | 5.4 ± 0.5 | 6.9 ± 0.3 | 8.9 ± 1.2 | 18.0 ± 0.9 |
| +CO2+O3 | 67.1 ± 1.3 | 9.2 ± 0.4 | 16.4 ± 0.6 | 15.1 ± 1.3 | 26.4 ± 0.8 |
| Effect | |||||
| CO2 (F1,8) | 6.6 * | 3.1 n.s. | 6.5 * | 7.8 * | 3.2 n.s. |
| O3 (F1,8) | 2.3 n.s. | 3.4 n.s. | 1.2 n.s. | 3.5 n.s. | 0.9 n.s. |
| CO2 × O3 (F1,8) | 4.9 n.s. | 3.8 n.s. | 3.9 n.s. | 2.9 n.s. | 3.8 n.s. |
| Treatments | LWR | CSWR | SWR | RWR | S:R Ratio | L:R Ratio |
|---|---|---|---|---|---|---|
| Control | 0.12 ± 0.01 | 0.19 ± 0.03 | 0.21 ± 0.02 | 0.48 ± 0.02 | 1.12 ± 0.09 | 0.26 ± 0.04 |
| +CO2 | 0.12 ± 0.02 | 0.21 ± 0.03 | 0.23 ± 0.03 | 0.44 ± 0.02 | 1.30 ± 0.11 | 0.26 ± 0.04 |
| +O3 | 0.14 ± 0.01 | 0.18 ± 0.00 | 0.23 ± 0.03 | 0.45 ± 0.02 | 1.25 ± 0.13 | 0.30 ± 0.02 |
| +CO2+O3 | 0.14 ± 0.01 | 0.24 ± 0.01 | 0.21 ± 0.01 | 0.41 ± 0.01 | 1.50 ± 0.06 | 0.35 ± 0.02 |
| Effect | ||||||
| CO2 (F1,8) | 0.01 n.s. | 2.84 n.s. | 0.03 n.s. | 4.07 n.s. | 4.52 n.s. | 0.82 n.s. |
| O3 (F1,8) | 3.37 n.s. | 0.09 n.s. | 0.01 n.s. | 2.24 n.s. | 2.65 n.s. | 4.57 n.s. |
| CO2 × O3 (F1,8) | 0.05 n.s. | 0.82 n.s. | 0.65 n.s. | 0.08 n.s. | 0.18 n.s. | 0.91 n.s. |
| Response | Whole Plant Weight | Leaf Weight | ||||||
|---|---|---|---|---|---|---|---|---|
| Bivariate | Root Weight | Root Weight | ||||||
| H0 NO. 1: no difference in slope (p-value) | ||||||||
| 0.231 | 0.114 | |||||||
| Treatment | Control | +CO2 | +O3 | +CO2+O3 | Control | +CO2 | +O3 | +CO2+O3 |
| n | 15 | 15 | 22 | 21 | 15 | 15 | 22 | 21 |
| r2 | 0.859 | 0.917 | 0.946 | 0.952 | 0.393 | 0.367 | 0.626 | 0.751 |
| p-value | <0.0001 | <0.0001 | <0.0001 | <0.0001 | 0.012 | 0.017 | <0.0001 | <0.0001 |
| Slope | 0.961 | 1.018 | 1.107 | 0.952 | 1.579 | 1.152 | 0.891 | 0.887 |
| Slope CI_high | 1.202 | 1.208 | 1.233 | 1.058 | 2.480 | 1.826 | 1.180 | 1.125 |
| Slope CI_Low | 0.768 | 0.858 | 0.993 | 0.857 | 1.006 | 0.727 | 0.672 | 0.700 |
| Intercept | −0.257 | −0.392 | −0.509 | −0.315 | −0.592 | −0.766 | −0.385 | −0.304 |
| H0 NO. 2: no difference in elevation (p-value) | ||||||||
| 0.0002 | 0.009 | |||||||
| Intercepts for a common slope | −0.343 | −0.387 | −0.368 | −0.427 | −0.592 | −0.544 | −0.492 | −0.431 |
| Pairwise comparison (where relationship significant) | ||||||||
| a | ab | a | b | b | b | ab | a | |
| H0 NO. 3: no difference in ’shift’ (p-value) | ||||||||
| 0.015 | 0.002 | |||||||
© 2019 by the authors. Licensee MDPI, Basel, Switzerland. This article is an open access article distributed under the terms and conditions of the Creative Commons Attribution (CC BY) license (http://creativecommons.org/licenses/by/4.0/).
Share and Cite
Tobita, H.; Komatsu, M.; Harayama, H.; Yazaki, K.; Kitaoka, S.; Kitao, M. Effects of Combined CO2 and O3 Exposures on Net CO2 Assimilation and Biomass Allocation in Seedlings of the Late-Successional Fagus Crenata. Climate 2019, 7, 117. https://0-doi-org.brum.beds.ac.uk/10.3390/cli7100117
Tobita H, Komatsu M, Harayama H, Yazaki K, Kitaoka S, Kitao M. Effects of Combined CO2 and O3 Exposures on Net CO2 Assimilation and Biomass Allocation in Seedlings of the Late-Successional Fagus Crenata. Climate. 2019; 7(10):117. https://0-doi-org.brum.beds.ac.uk/10.3390/cli7100117
Chicago/Turabian StyleTobita, Hiroyuki, Masabumi Komatsu, Hisanori Harayama, Kenichi Yazaki, Satoshi Kitaoka, and Mitsutoshi Kitao. 2019. "Effects of Combined CO2 and O3 Exposures on Net CO2 Assimilation and Biomass Allocation in Seedlings of the Late-Successional Fagus Crenata" Climate 7, no. 10: 117. https://0-doi-org.brum.beds.ac.uk/10.3390/cli7100117