Excess Mortality in England during the 2019 Summer Heatwaves

1
Department of Geography, Loughborough University, Loughborough, Leicestershire LE11 3TU, UK
2
Center for Environmental Policy, Imperial College London, London SW7 2AZ, UK
*
Author to whom correspondence should be addressed.
Climate 2021, 9(1), 14; https://0-doi-org.brum.beds.ac.uk/10.3390/cli9010014
Submission received: 11 December 2020
/
Revised: 8 January 2021
/
Accepted: 10 January 2021
/
Published: 14 January 2021
Abstract
:There is increasing evidence that rising temperatures and heatwaves in the United Kingdom are associated with an increase in heat-related mortality. However, the Public Health England (PHE) Heatwave mortality monitoring reports, which use provisional death registrations to estimate heat-related mortality in England during heatwaves, have not yet been evaluated. This study aims to retrospectively quantify the impact of heatwaves on mortality during the 2019 summer period using daily death occurrences. Second, using the same method, it quantifies the heat-related mortality for the 2018 and 2017 heatwave periods. Last, it compares the results to the estimated excess deaths for the same period in the PHE Heatwave mortality monitoring reports. The number of cumulative excess deaths during the summer 2019 heatwaves were minimal (161) and were substantially lower than during the summer 2018 heatwaves (1700 deaths) and summer 2017 heatwaves (1489 deaths). All findings were at variance with the PHE Heatwave mortality monitoring reports which estimated cumulative excess deaths to be 892, 863 and 778 during the heatwave periods of 2019, 2018 and 2017, respectively. Issues are identified in the use of provisional death registrations for mortality monitoring and the reduced reliability of the Office for National Statistics (ONS) daily death occurrences database before 2019. These findings may identify more reliable ways to monitor heat mortality during heatwaves in the future.
1. Introduction
Record-breaking extremes over the last century are five-times higher than expected [1] and are driven by anthropogenic, greenhouse gas emissions [2]. So far, the global climate has warmed by around 1 °C since pre-industrial conditions, and the Intergovernmental Panel on Climate Change’s high-emission scenario projects an average increase in global mean surface temperature between 2.6 °C and 4.8 °C by 2100 relative to 1986–2005 [3,4]. The Paris Agreement aims to limit the temperature increase to 1.5 °C [5], however, two-thirds of the “allowable” cumulative carbon dioxide emissions to stay below the 2 °C target have already been used [6,7]. In addition, there is a high probability that the planet is already committed to average warmings over land exceeding 1.5 °C [8]. Warming rates over land will be higher than warming rates over oceans [8], which will expose human populations to higher heat stress than the average global temperature rise suggests [9].
Global [10,11] and European heatwaves are projected to increase [12,13]. One-third of the world’s population is currently exposed to heat stress [14]. The impact of this on the European population will be greater than any other weather-related hazard exacerbated by climate change [15]. An increased frequency of temperatures exceeding 35 °C in the southeast and 30 °C in the north of England [16] are expected. Days above 40 °C currently have a return time of 100–300 years, however, this could decline to a return time of 3.5 years by 2100 if greenhouse gas emissions are not reduced [17]. Anthropogenic causes are central [18,19], making the record-breaking summer temperatures of 2018 around 30-times more likely [20]. Whilst the UK’s maritime climate is self-regulating, hot extremes are more frequent and intense in the UK [21].
The summer of 2019 was the Northern Hemisphere’s warmest meteorological summer since records began in 1880, tied with 2016 [22]. Heatwaves peaked over northern and central Europe [9]. In the UK, a new all-time record, measured at Cambridge University Botanic Garden on 25 July (38.7 °C), occurred during one of the three heatwaves that year from 28 to 30 June, 21 to 28 July and 23 to 29 August 2019 [23]. Again, these are linked to climate change [24]. Atmospheric ‘blocking events’ [8] are potentially due to the slowing down of midlatitude summer circulation [8]. In 2019, these events induced intense advections of hot air from Northern Africa to Europe [24]. These resulted in high daytime heat loads and heatwave conditions in the UK [24], though other mechanisms have been proposed [25].
Health impacts are predicted to increase with heatwaves [26,27]. Thousands of people have died in the recent UK heatwaves [28,29]. Unlike cold weather, the rise in mortality caused by warm weather occurs rapidly [30]. As a result, there are relatively more impacts occurring during the first 1 to 2 days [31,32]. Heatwaves affect the health of those who are vulnerable [33]. Outcomes range from dehydration to death [26]. The highest vulnerability is in the elderly with pre-existing medical conditions, such as cardiovascular diseases and respiratory illnesses [34], although children [35] and other age groups can be affected, particularly in hot countries [36].
Heat-related mortality occurs under environmental conditions where the human body is unable to maintain a stable core body temperature near 37 °C [37]. This core body temperature varies minimally between individuals and does not adapt to local climate [37]. Critically, the human skin temperature must be regulated at 35 °C or below as the skin must be cooler than body core for the effective conduction of metabolic heat to the skin [38]. Sustained skin temperatures above 35 °C cause hyperthermia, which can be lethal if skin temperatures reach 37–38 °C [39]. This vulnerability is a function of humans’ upper physiological limit to heat, which sets an upper limit to the adaptation levels of humans to future climate-change impacts [40].
In response to the 2003 European heatwaves which exceeded 70,000 deaths [41], the Department of Health in England set up the Heatwave Plan for England (HPE), which is updated yearly to integrate learning from the previous summer [30]. It provides guidance to the National Health Service (NHS) and local authorities [30]. HPE’s Heat-Health Watch alert system operates between 1 June and 15 September. The Met Office issues alerts which correspond to the level of risk of a heatwave and trigger a range of short-term protective measures [30,42]. Level 1 is the default setting, indicating that the preparedness programme is in operation. Level 2 indicates that a heatwave has been forecasted, and an alert and readiness status is set. Level 3 signifies that heatwave action has been activated. Finally, level 4 declares that an emergency response has been implemented [30].
The PHE Heatwave mortality monitoring report is based on the cumulative excess deaths during a heatwave [23]. It uses data from the provisional figures on deaths registered in England and Wales and is calculated using the upper 2 z-score threshold after correcting the ONS data for reporting delays using the standardised EuroMOMO algorithm [43]. The ONS data used in the PHE reports are broken down into age groups and regional areas, which are only available from the weekly registered deaths database [44] and not the daily death occurrence database [45]. The PHE report calculates heat-related mortality by subtracting the expected deaths (based on a 5-year average) from the registered deaths using temperature as a heat stress measure. Other studies have used a variety of heat stress measures, such as humidity, wind speed, atmospheric pressure and solar radiation. However, a single temperature measure continues to be the usual proxy for thermal discomfort [46,47,48].
As the impact of heat on mortality varies each year, an annual retrospective look at the heat-mortality relationship is useful. Previous studies on excess mortality in the UK have used death registration data from the ONS Quarterly Mortality database [28,29,32,49]. However, between 2001–2018, the median time between death occurrence and registration in England and Wales has increased from 2 to 5 days [50]. There has also been a sharp rise from 8.7% to 14.5% in deaths registered 1 to 2 weeks late and a rise of 1.8% in death registered 2 to 3 weeks late [50]. These increasing delays in death registrations suggest that the use of death registrations as a source of death data is problematic. Despite this, there are scant studies using daily death occurrences, even though they are recognised as being more reliable and can be related to other factors such as climate [51].
Historically, data on daily death occurrences from the ONS Quarterly Mortality database have been problematic because extraction has been fixed to ensure datasets have a similar extraction date [51]. However, this meant that the data were frozen in time and were too unreliable for use in studies. However, from April 2019, this statistical limitation was removed to ensure the data would be more up to date [51]. With this came the discovery of the impact of fixing the extraction date on the mortality data, as the wholesale update of daily death occurrences on the ONS Quarterly Mortality database (post-April–June 2019) revealed significant discrepancies. For instance, the death occurrence on 30 June 2018 was changed from 1149 in the Quarterly Mortality database of Q3 2018 to 1230 in the Quarterly Mortality database of Q3 2019, a discrepancy of 81 deaths [48]. This has revealed a gap in the existing knowledge as an analysis of the heat-temperature relationship using reliable daily death occurrence data has yet to be undertaken. In order to contribute to filling this gap, this paper sought to evaluate the impact of the 2019 heatwaves on mortality and compare this impact to the impact of the heatwaves of 2017 and 2018 on mortality using these hitherto unavailable data.
The need for this study is particularly pertinent, as a report evaluating the Heatwave Plan for England concluded:
“There is no evidence that general summertime relationships between temperature and mortality…have changed substantially in the years since the introduction of the first HWP in 2004.”[52] (p. 1).
This is problematic as the report did not evaluate the PHE Heatwave mortality monitoring reports.
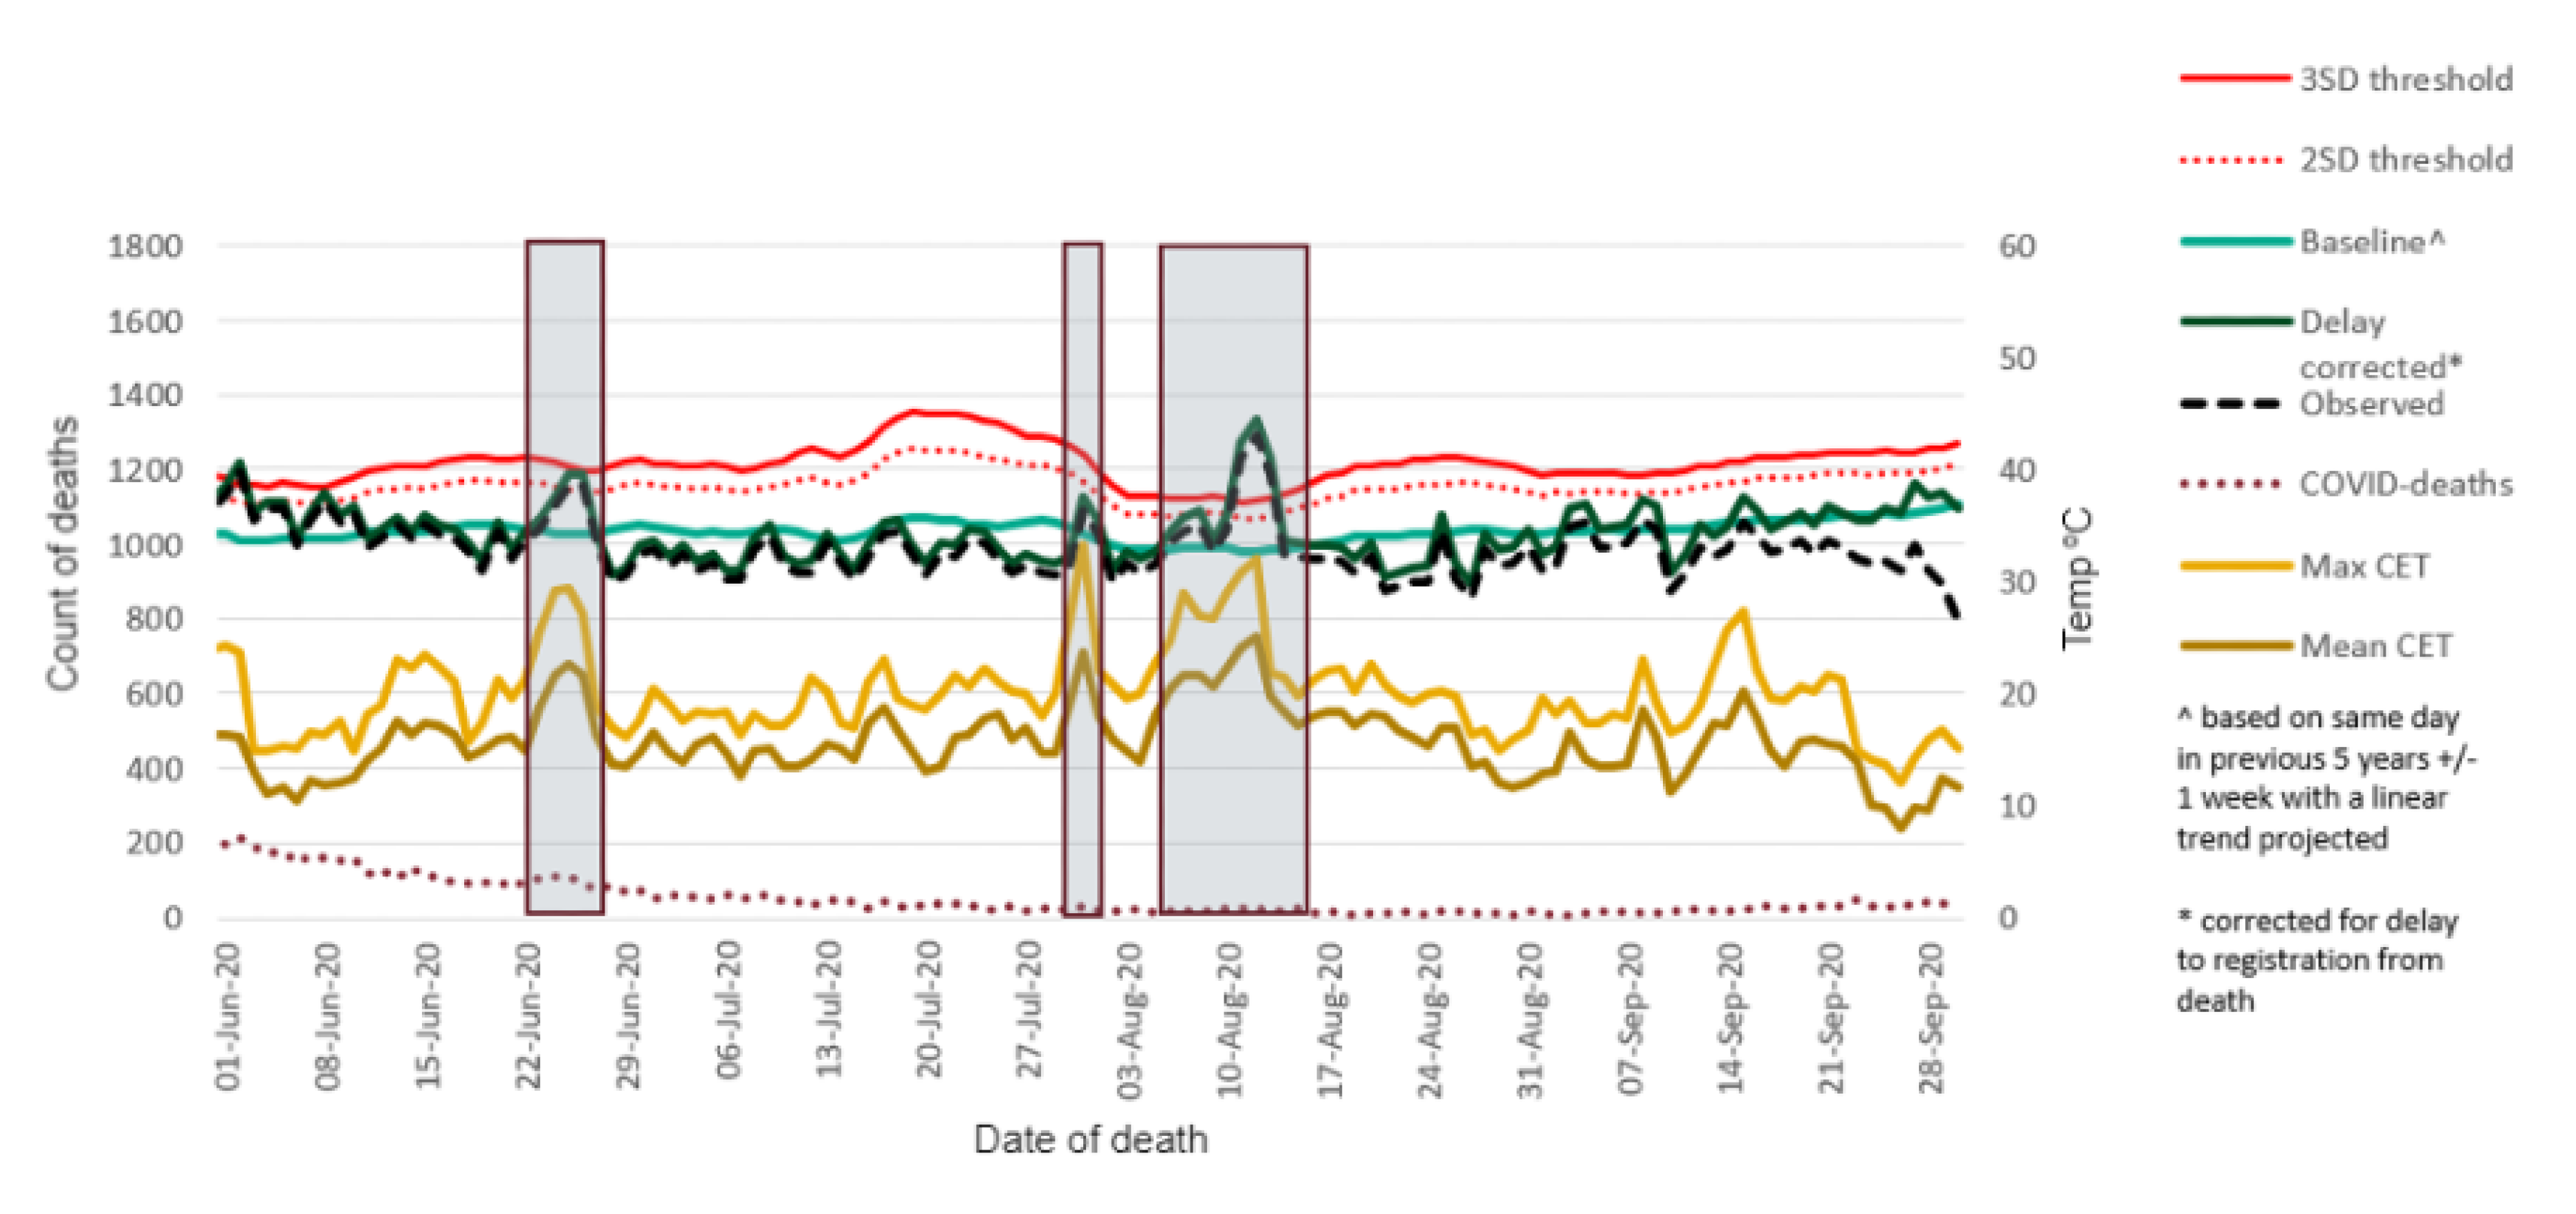
Equally, this study is timely for two other reasons. First, the last study into the impact of heatwaves on mortality focused on the 2013 heatwaves [28], even though 2017 and 2018 were 2 of the hottest 10 years in the UK and collectively had 6 heatwave periods [17]. The reason for that is likely to be that the PHE Mortality Monitoring report was commissioned to undertake this task. However, these reports have not yet been independently evaluated. Second, the significance of this paper is heightened due to the impact of COVID-19 on mortality rates. Both COVID-19 and heat-related mortality impact similar groups, such as the elderly and those with cardiovascular and respiratory disease [53]. Thus, the distinction between deaths attributable to heat and COVID-19 is likely to be problematic. The complexity of the figure published for the 2020 PHE Heatwave mortality monitoring report bears witness to this (Figure 1) [23]. In addition, the report uses a different methodology, making a retrospective analysis based on these data difficult (PHE 2020a).
An analysis of the heat-temperature relationship using the recently corrected daily death occurrence data from the ONS Quarterly Mortality has not yet been undertaken. To fill this gap, the objectives of this study are threefold. First, we aim to determine the excess death attributable to the three heatwaves in 2019 relative to the 5-year average. Second, we aim to compare heat-mortality deaths during the 2019 summer period to those during the heatwaves in 2017 and 2018. Third, we aim to compare the excess daily death occurrences found in this study to the excess registered deaths in the PHE Heatwave mortality monitoring reports of 2017, 2018 and 2019.
2. Materials and Methods
2.1. Study Period
The definition of a study period corresponds with the definition used by the Heatwave Plan of England [30]. Accordingly, the study period coincides with the period of summer preparedness and long-term planning, 1 June to 15 September, which coincides with the 4 hottest months. The study periods for the years 2017, 2018 and 2019 are analysed.
2.2. Heatwave Definition
The definition of a heatwave corresponds with the definition used by the Heatwave Plan for England, which defines it as a period of days when:
- (a)
- The Met Office issue a Level 3 heatwave alert in any part of the country, or
- (b)
- The mean Central England Temperature (CET) is greater than 20 °C
Plus 1 day before and after the days identified through (a) and (b) above.
The day before helps to include the impact linked to the initial increase in temperature, and the day after helps to capture the delay from temperature to impact on mortality [28].
2.3. Temperature
Outdoor mean temperatures were used as an indicator of exposure as air conditioning in private homes is uncommon in the UK. Mean temperatures were used rather than maximum or minimum temperatures as they are a better predictor of mortality [48].
The daily CET from 1 June to 15 September, for the years 2014 to 2019, were extracted from the CET daily series database [54]. The latter is the weighted mean temperature derived from the mean of 3 observing stations (Lancashire, London and Bristol), which covers a roughly triangular area and is corrected for a small effect of urban warming [55]. It is kept up to date by the Climate Data Monitoring section of the Hadley Centre, Met Office.
2.4. Data Sources
The mortality data were extracted from the Quarter Mortality database of the ONS for the daily occurrence deaths in England occurring from 1 June to 15 September for the period 2012 to 2019. These data were found in the Q2 and Q3 Quarterly Mortality 2012 to 2019 database [48]. As found in the literature review, death occurrences were more date-specific than death registrations for the purpose of relating the mortality data to other factors such as weather patterns [51]. All datasets exclude non-residents and deaths with an unknown day of death [51].
2.5. Generalised Additive Model
A generalised additive modelling approach was used to describe the relations in the time-series data. We assumed that there was a Poisson distribution and used temperature as the main independent variable. The same method was used to identify excess deaths for each heatwave in 2017, 2018 and 2019.
To implement the additive hazard method, excess mortality was assessed as the number of death occurrences (‘observed mortality’) minus the expected mortality [28]. Expected mortality represents the all-cause mortality of the general population based on the assumption that the heat-related mortality is negligible compared to the overall mortality in the general population [56]. Thus, the expected mortality was found by calculating the average number of deaths on the same date over the previous 5 years [57].
The expected mortality was then used to find the excess mortality for each heatwave in 2017, 2018 and 2019. To do this, the number of death occurrences for each heatwave in each year was treated as a Poisson variable. Next, the 95% confidence limits for the Poisson variable were subtracted from the expected mortality to obtain confidence limits for the excess mortality. Tables were then drawn up to display the findings and compare them to the findings in the 2017, 2018 and 2019 PHE Heatwave mortality monitoring reports.
The generalised additive model is considered to be the most effective and applicable model to investigate the overall impact of environmental exposures, such as temperature, which vary over time [58,59]. It has also been used in other studies to calculate heat-related mortality in UK even though it points to correlation rather than causation [28,29,32,49]. It is recognised that higher temperatures may not be the sole or direct cause of death, and other studies have traced the impact of covariates and confounders, such as humidity and wind speed, which contribute to heat stress. That said, this study focused on a single variable, replicating the model used by the PHE Heatwave mortality monitoring reports. Thus, the model, whilst somewhat utilitarian, interprets excess mortality as the extra deaths beyond the expected number for each day of a heatwave [60].
Tables were produced to compare the findings to the excess mortality given in the 2017, 2018 and 2019 PHE Heatwave Mortality Monitoring reports.
2.6. Time-Series Graph
A time-series graph was plotted for 2019 showing the data for death occurrences from all causes, expected deaths, the daily mean and the maximum CET over the study period. The 7-day moving average for the 2019 death occurrence data was also shown to smooth the data.
2.7. Excess Mortality Graphs for the Whole Summer Period
Graphs showing excess deaths across the summer periods for 2017 to 2019 were used to identify the variability in temperatures across the study period. Excess deaths for the entire summer period for 2017, 2018 and 2019 were found using the same generalised additive model.
3. Results
The summer period of 2019 saw three heatwaves, with two defined by virtue of Level 3 heatwave alerts issued by the Met Office and one heatwave defined from the mean CET when the CET was greater than 20 °C [17,28].
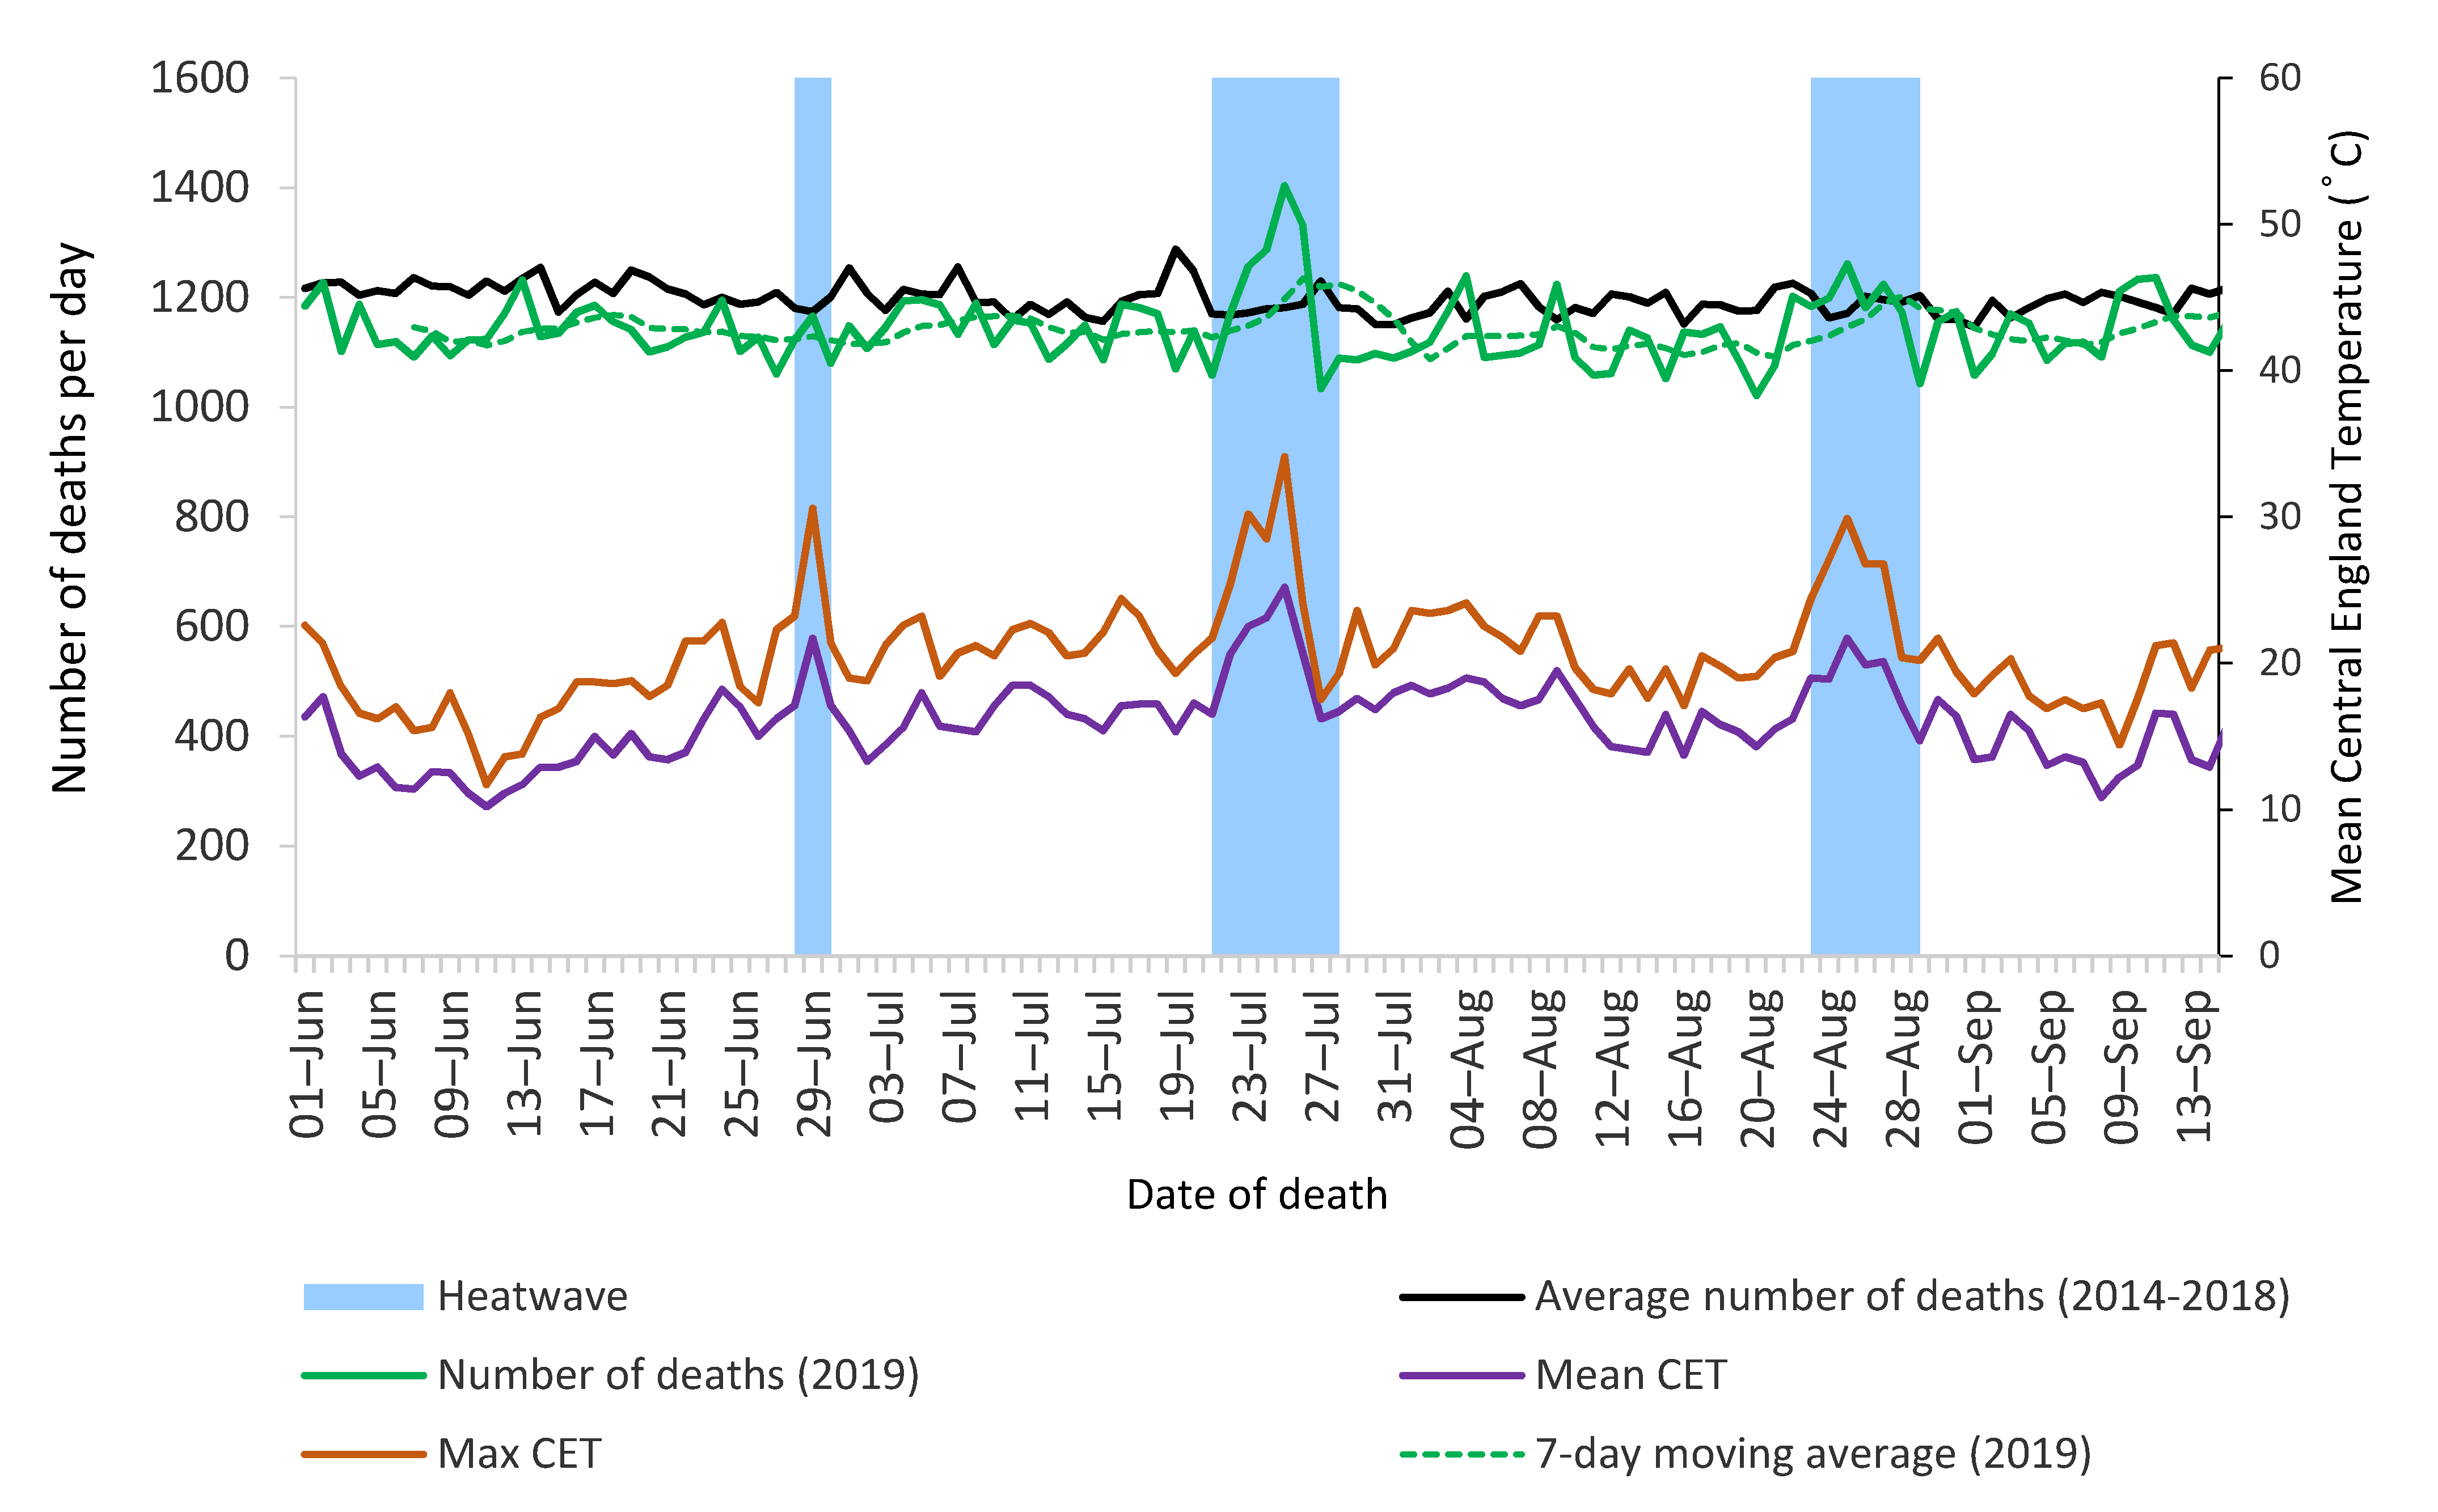
During the brief heatwave from 28 to 30 June, a peak mean CET of 30.6 °C was observed on 29 June 2019 (Figure 2). Following the additive hazard model, excess mortality was estimated by subtracting expected mortality from observed mortality. The total number of deaths for the 3-day period was below the 5-year average for 2014 to 2018. Thus, there were no excess deaths during this period (95% confidence interval (CI) −508 to 134) (Table 1). The wide confidence interval suggests this finding has a low statistical significance. The Summer 2019 PHE Heatwave mortality monitoring report also detected that there were no excess deaths for this period [23].
During the longer heatwave from 21 to 28 July, a peak mean CET of 34.1 °C was observed on 25 July 2019 which recorded 222 excess deaths, the highest number for any heatwave day in 2019 (Figure 2).
It is clear from the figure that the relationship between mortality and temperature is nonlinear with the typical V shape [61,62].
However, cumulatively during that heatwave period, there was only an excess of 161 deaths (95% CI −751 to 1053) (Table 1). This figure represents the mortality that is directly or indirectly related to the heatwave. Thus, based on background mortality for the same period during 2013–2018, we would have expected 161 fewer deaths for this period had the heatwave not happened. However, the large interval width again suggests that the finding is not statistically significant. Nonetheless, the finding of 161 excess deaths was three-times lower than the excess deaths (572) detected in the 2019 Heatwave mortality monitoring report [23].
During the final heatwave from 23 to 29 August, a peak mean CET of 29.9 °C was observed on 25 August which recorded 90 excess deaths, the highest for that heatwave. However, the cumulative number of deaths for the entire 7-day period was below the 5-year average for 2014 to 2018, resulting in no overall excess death figure during this heatwave. In contrast, the PHE Heatwave mortality monitoring report estimated 320 excess deaths during this heatwave.
Accordingly, the total impact on the mortality of the Summer 2019 heatwaves was estimated to be 161 excess deaths, which was 731 deaths less than the total 892 excess deaths estimated in the 2019 PHE Heatwave mortality monitoring report. Acknowledging the statistical limitations to these findings, there is a clear disparity.
The excess deaths measured for the 2018 heatwaves were equally revealing (Table 2). In contrast to the finding of 161 excess deaths during the 2019 heatwaves, the analysis of the 2018 heatwaves, using the same methods, resulted in a higher cumulative excess death total of 1700 (Table 2). This was broken down over 4 heatwave periods, spanning 31 days in total, with the highest number of excess deaths during the third heatwave period, 21–29 July, when there were 645 excess deaths (95% CI −508 to 374). The other 3 heatwaves recorded 362, 458 and 235 excess deaths for the heatwave periods of 25–27 June, 30 June–10 July and 2–9 August, respectively. The finding of 1700 excess deaths for the entire summer period is 837 deaths higher than the estimated 863 excess deaths in the summer 2018 Heatwave mortality monitoring report. Thus, the PHE Heatwave mortality monitoring reports overestimated excess deaths by 731 in 2019 but underestimated excess deaths by 837 in 2018 (although statistical significance was again problematic) (Table 2).
Repeating the same process for the heatwaves in 2017, the total number of excess deaths over the 2 heatwaves was 1489 (Table 3). This was broken down over 2 heatwave periods, spanning only 10 days in total. The first heatwave period, 17–23 June, had 1113 excess deaths (95% CI −508 to 374), which was the highest number for a single heatwave across the 2017–2019 summer periods (Table 1, Table 2 and Table 3). The second heatwave period, 5–7 July, recorded 376 deaths (95% CI 196–556). Across the entire summer period, the finding of 1489 excess deaths is 711 deaths excess deaths higher than the estimated 778 deaths in the summer 2017 PHE Heatwave mortality monitoring report.
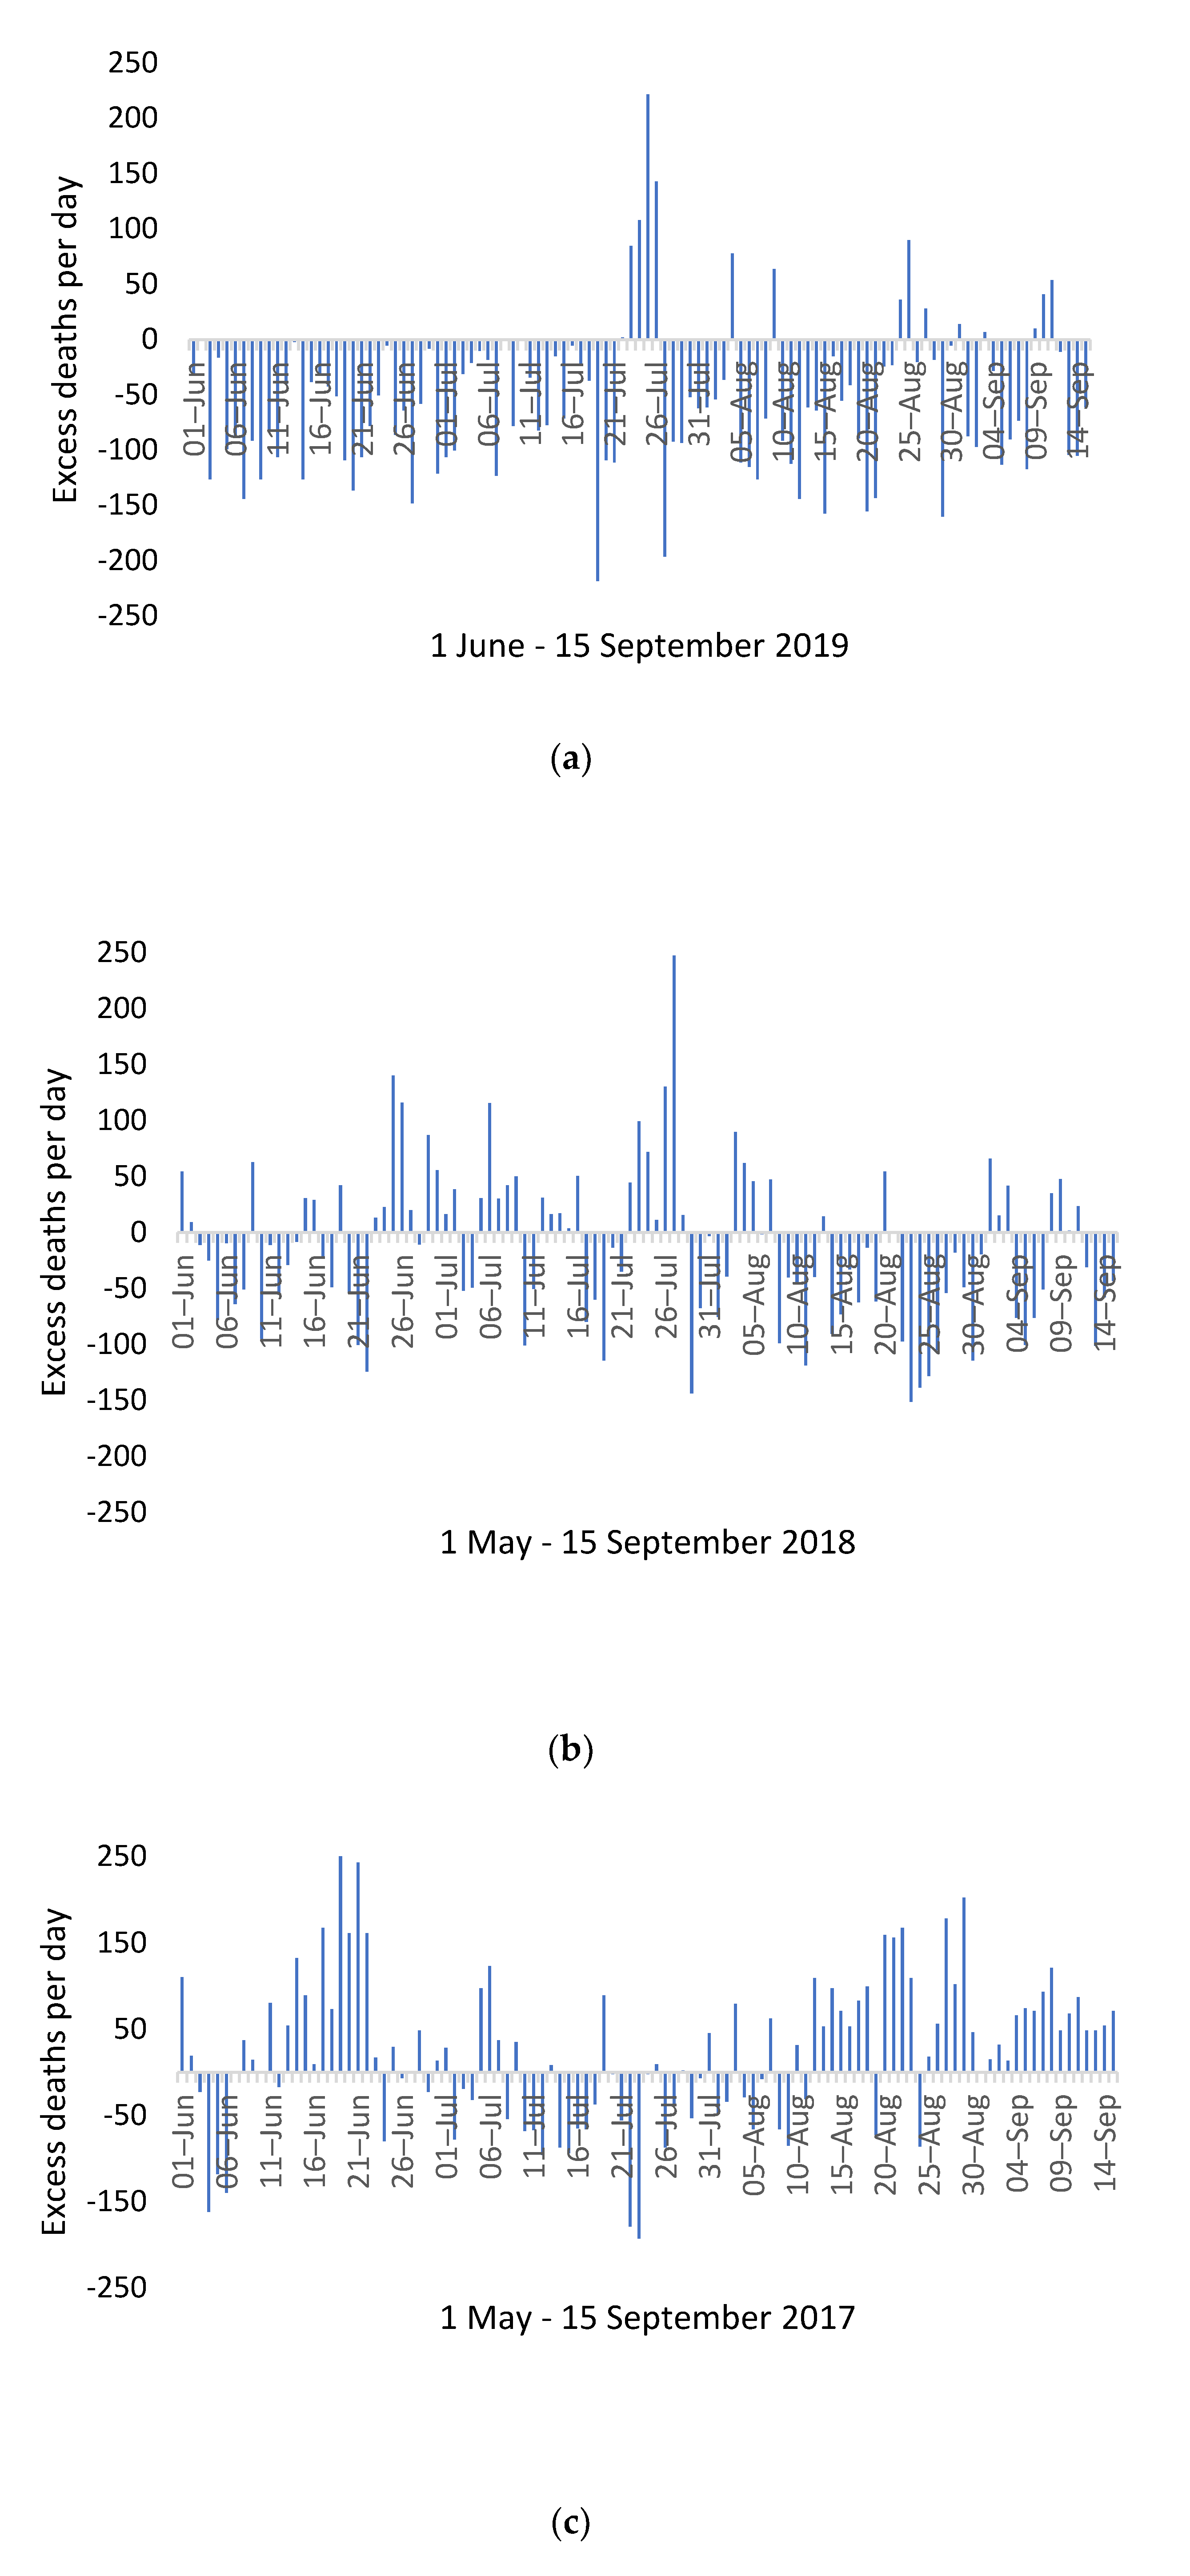
The overall pattern of excess deaths across the 2019 summer period is distinctive to the patterns of excess deaths for the 2018 and 2017 summer periods (Table 4; Figure 3). The total number of death occurrences in 2019 (122,257) was substantially lower than the expected deaths (128,087), which is indicated by the large number of excess deaths shown in Figure 3a. Likewise, the total number of death occurrences over the 2018 summer period (126,115) was also lower than the number of expected deaths (126,155). However, as shown in Figure 3b, the summer 2018 period was the closest to the expected values out of the 3 years. Last, the total number of death occurrences over the 2017 summer period (129,998) was significantly higher than the expected deaths (126,059), resulting in an excess death total of 3939 for the entire summer period.
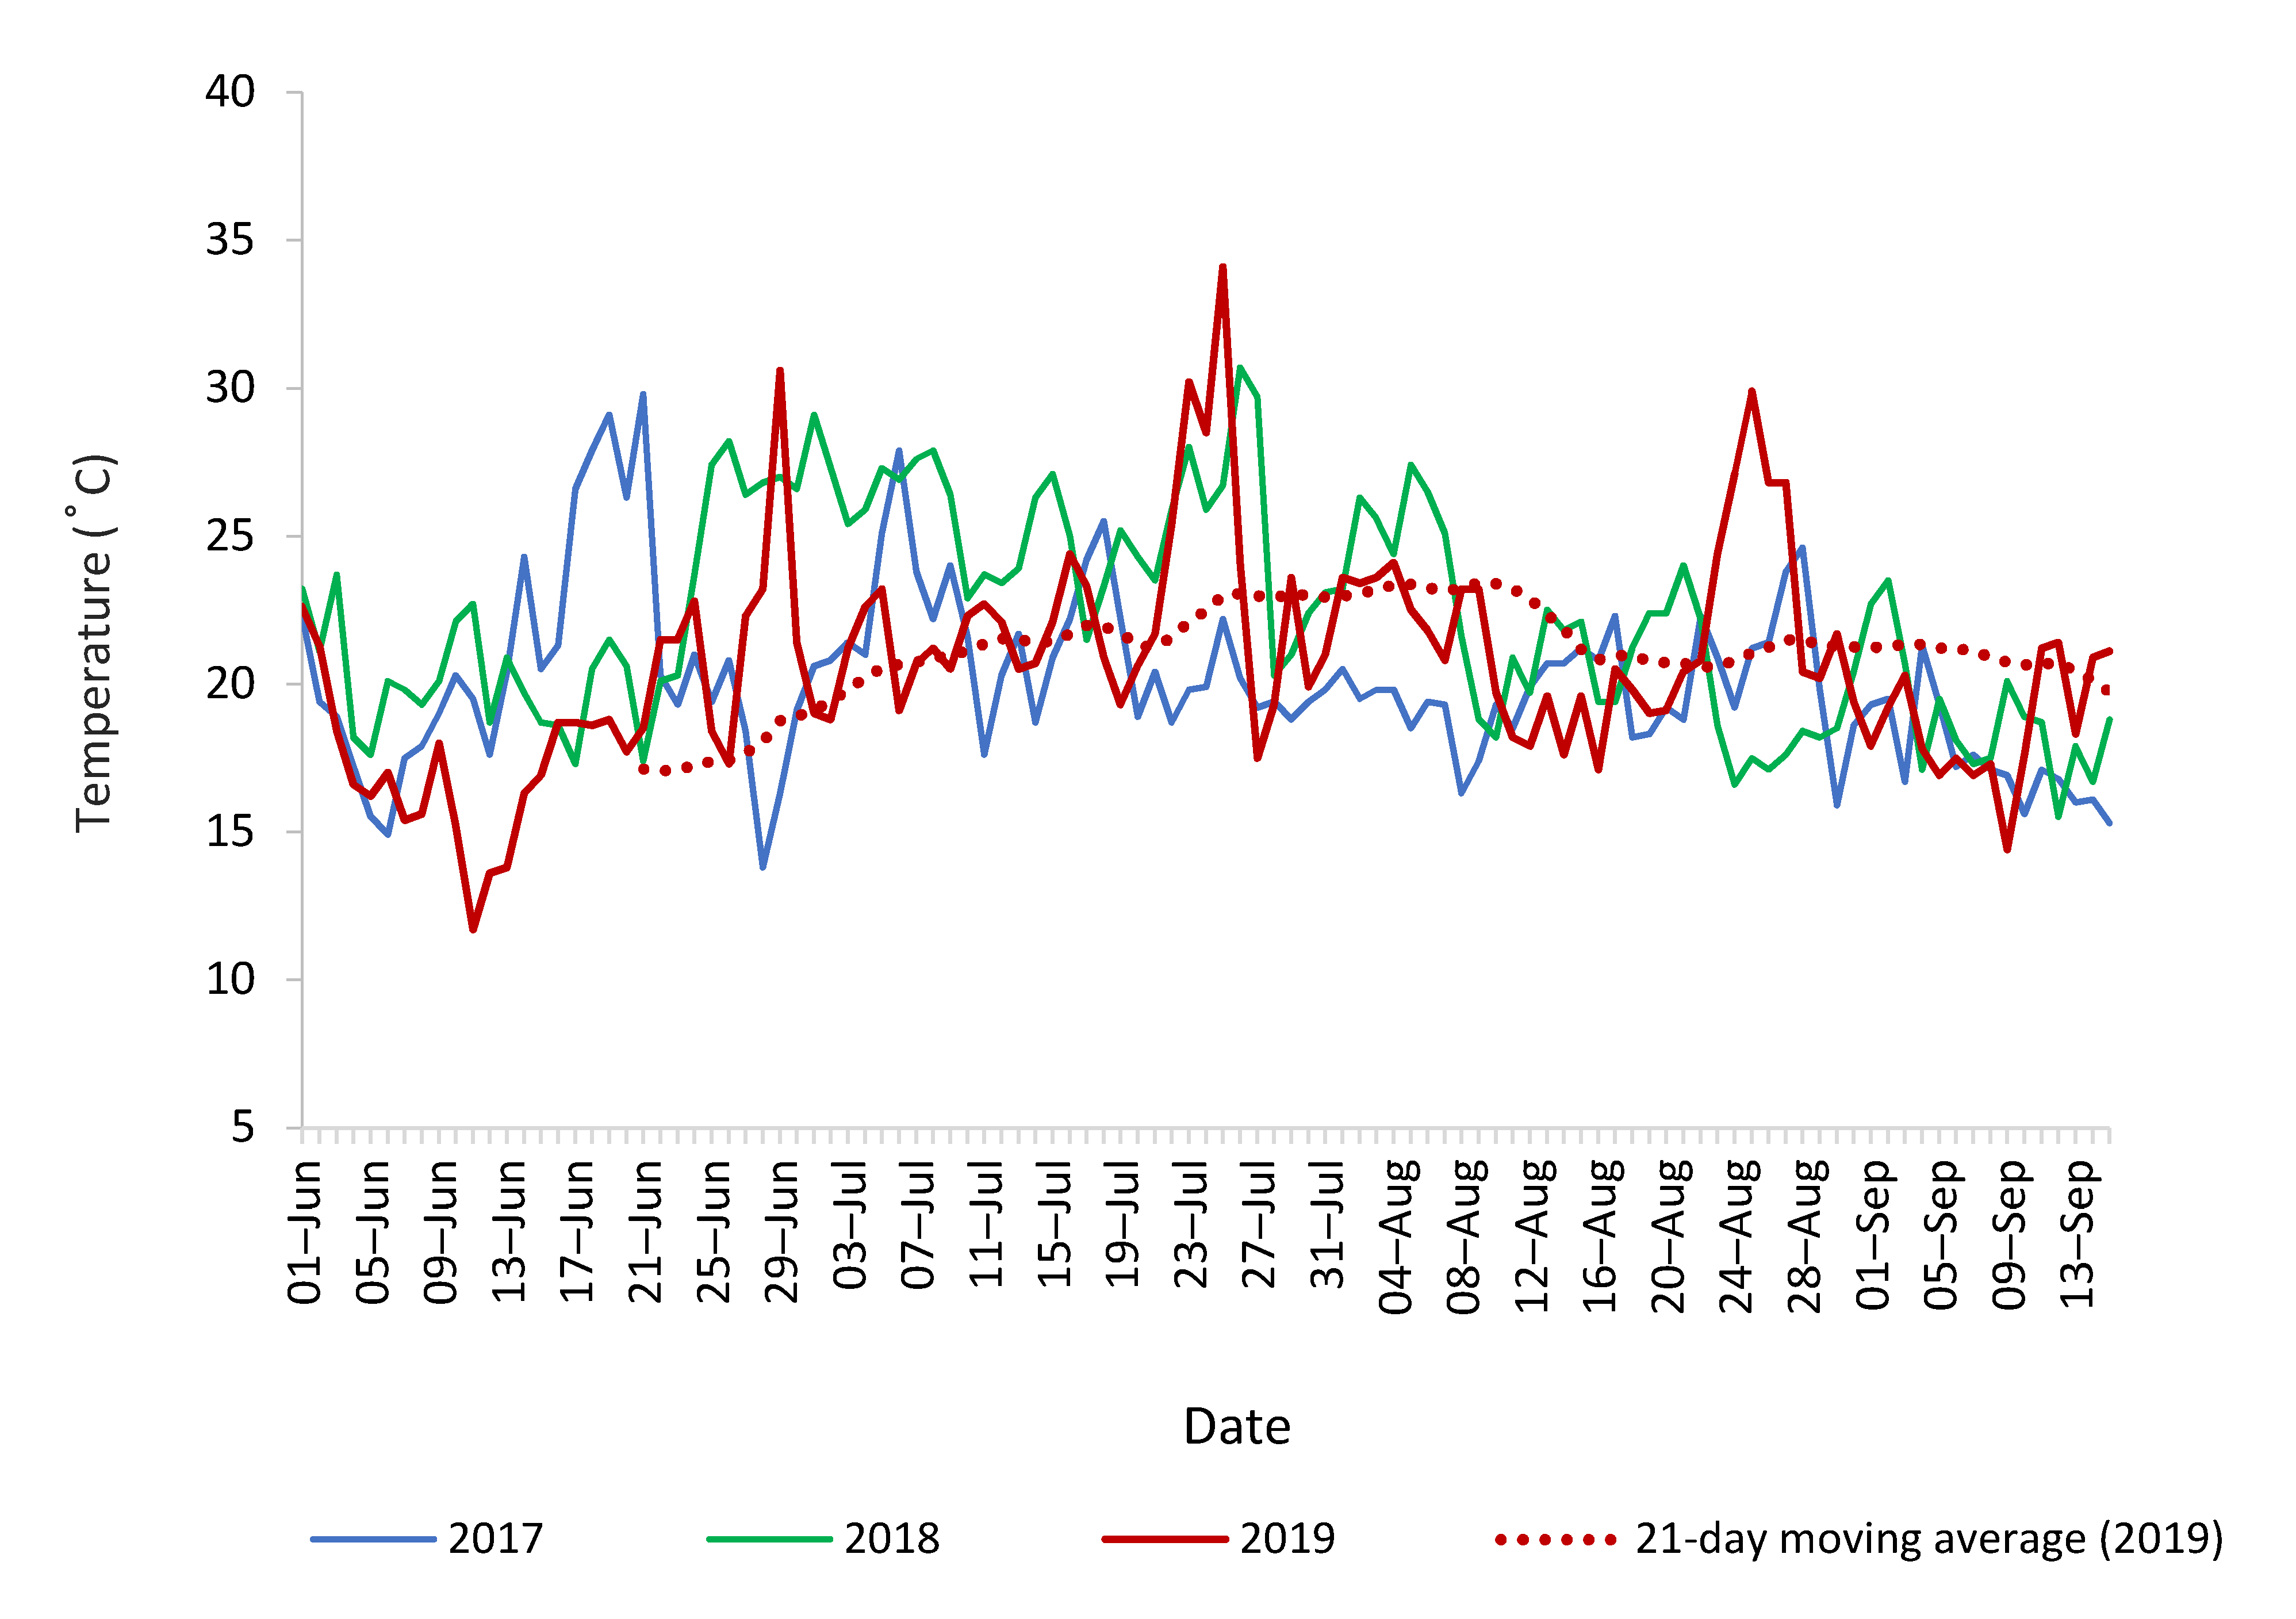
The temperatures for the summer periods in 2017, 2018 and 2019 demonstrate that the temperatures for 2019 were generally lower than 2017 and 2018, with short spikes for the heatwave periods and a significant spike for 25 July 2019 when the all-time highest recorded temperature of 38.7 °C was recorded (Figure 4) [17]. This correlates with the lower-than-usual excess deaths for the summer 2019 period.
4. Discussion
A retrospective analysis of the 2019 summer period was carried out to quantify excess mortality during the three heatwaves. The same method was also used to quantify excess mortality during the heatwaves in 2017 and 2018. The cumulative excess deaths for the three heatwave periods in 2019 were low (161) and were not statistically significant. The longer heatwave periods in 2018 and the more intense heatwaves in 2017 had significantly more excess deaths (1700 and 1489, respectively). All findings were significantly at variance to the excess deaths recorded in the PHE Heatwave mortality monitoring reports, which only include persons over 65 years old and should therefore be an underestimate of the figure for the whole population [23]. The reasons for these findings are not clear. However, several explanations are offered.
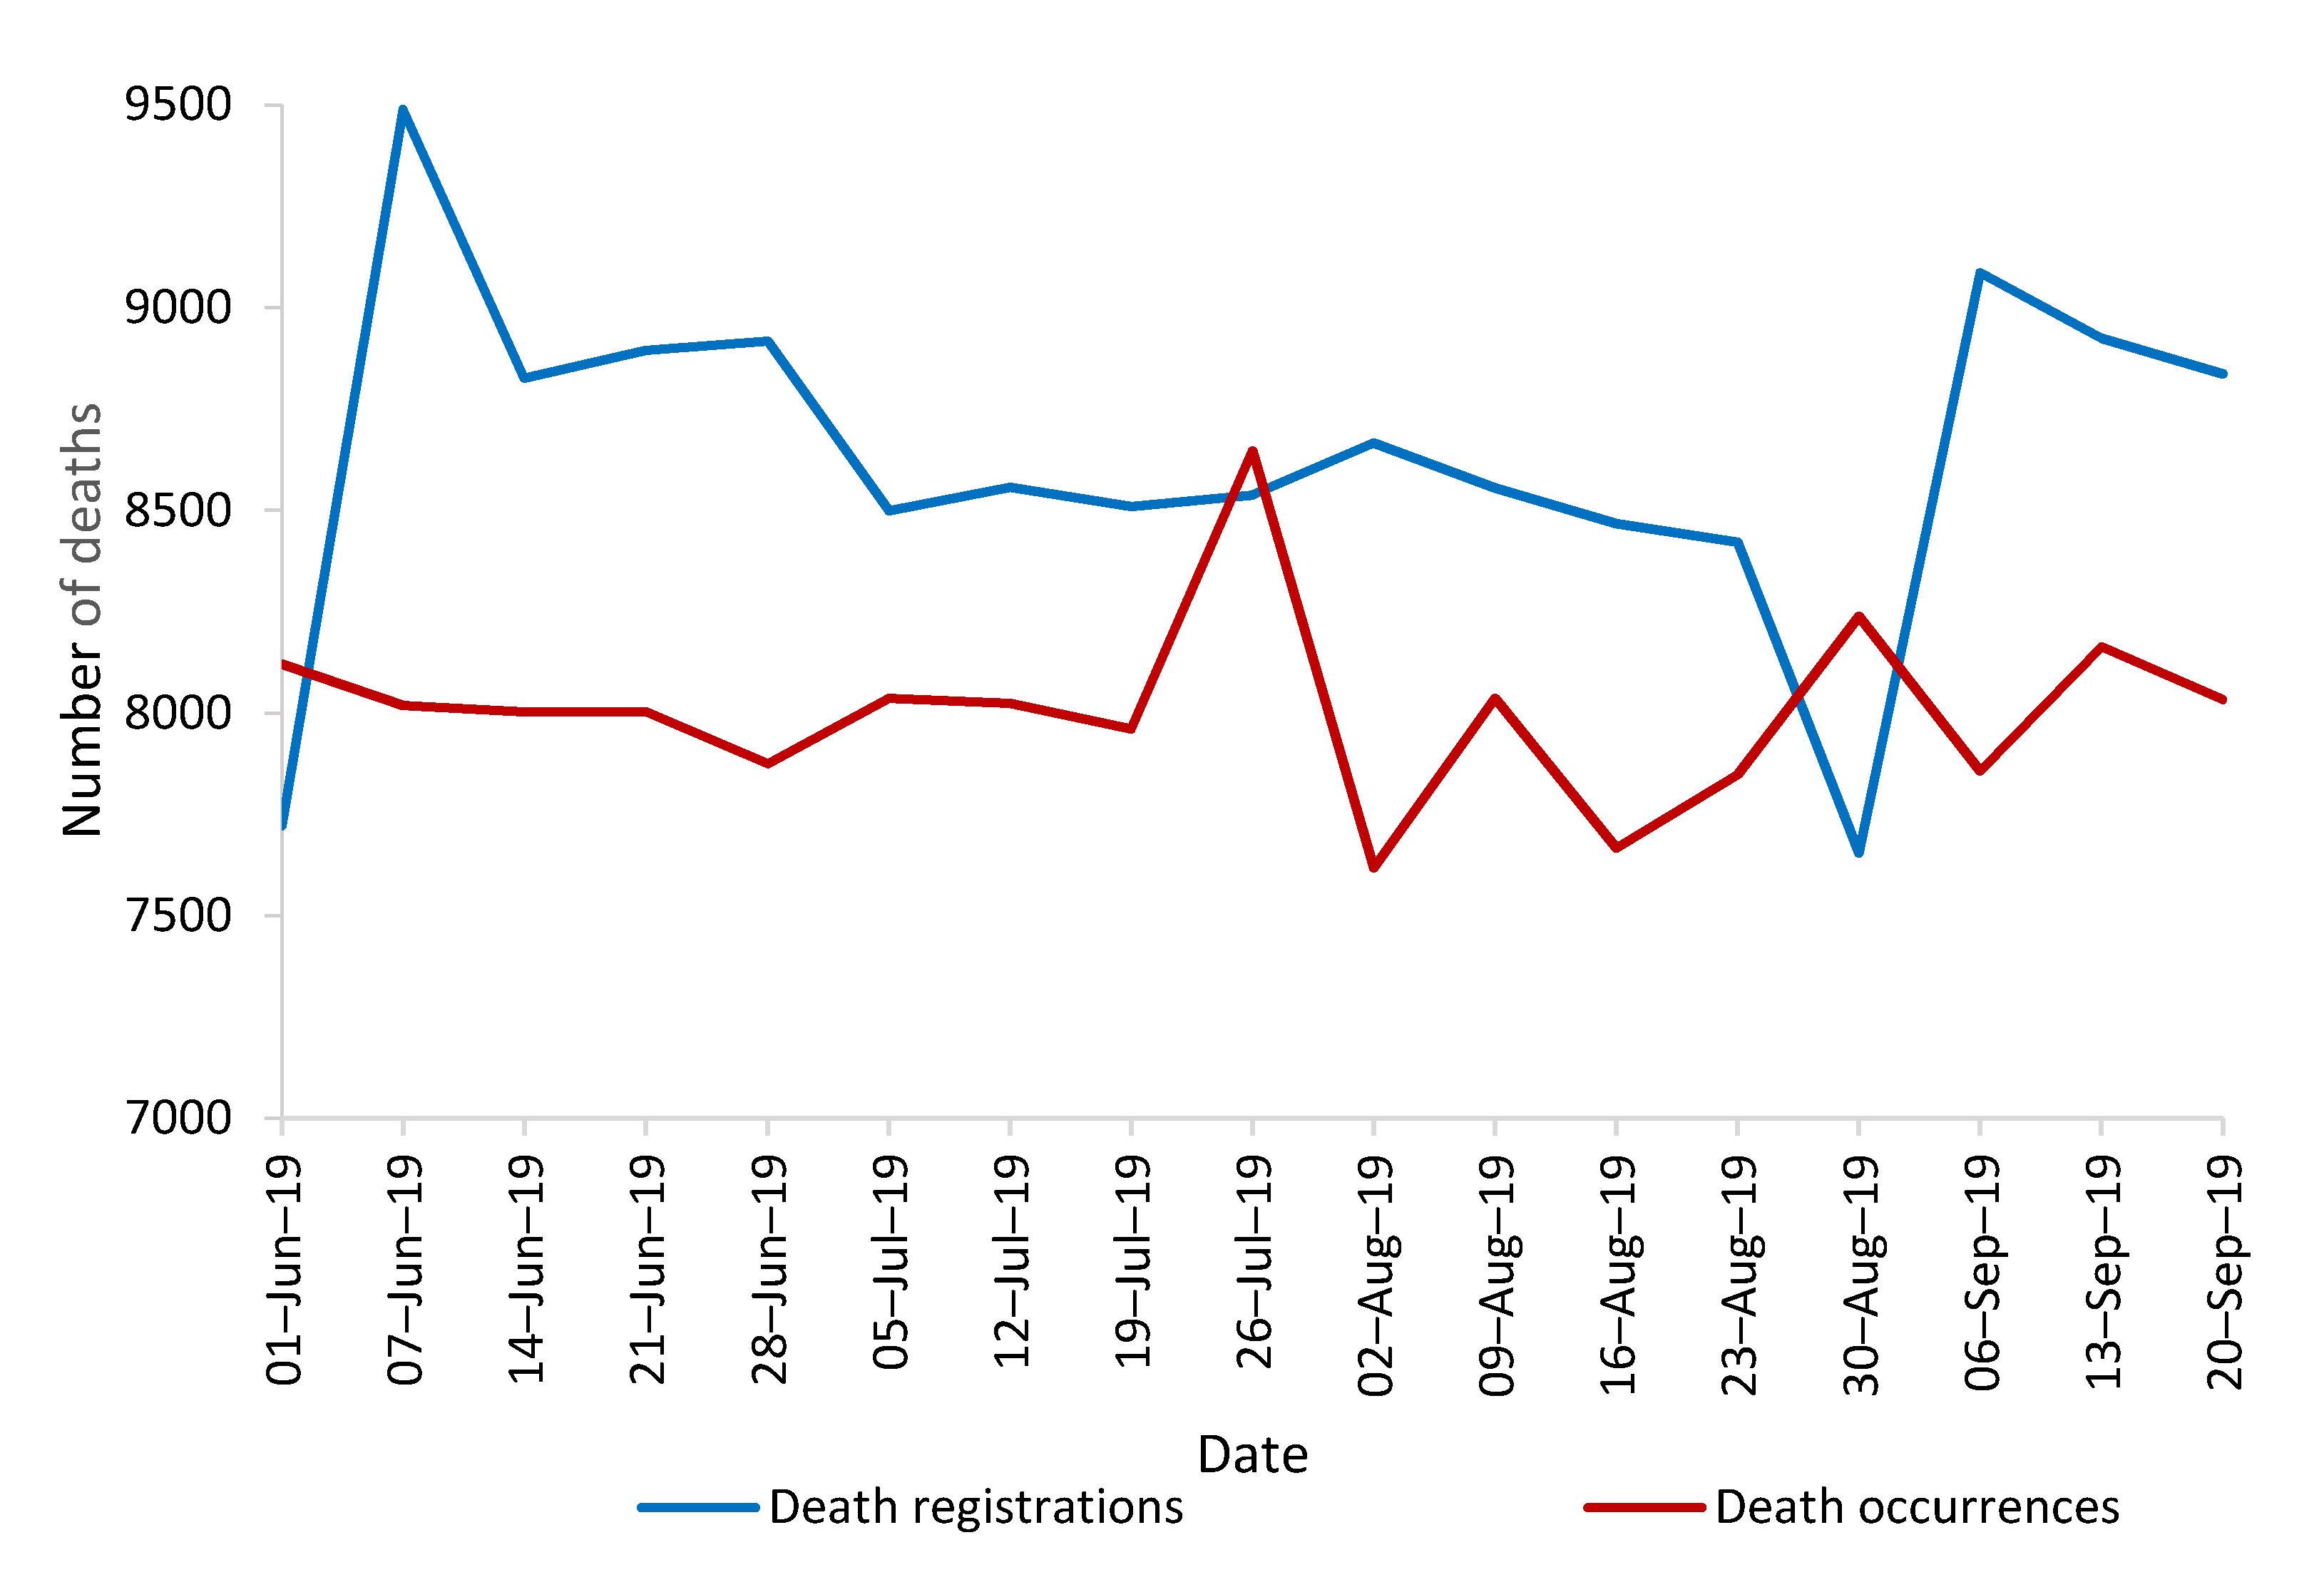
Both this study and the PHE reports used a simple generalized additive model. The main difference between the studies is that our study used death occurrences rather than death registrations, which contain unexplained disparities (Figure 5). The impact of this is significant as the total death registrations for the entire study period (146,564) is over 10,000 more than total death occurrences (136,144) (Table 5). This overestimation of death registrations corresponds with the overestimation of excess mortality in the 2019 PHE Heatwave Mortality Monitoring report, which may explain the difference in the findings.
Further investigation is advised to confirm whether the disparity displayed is accurate as the pattern suggests that any data analysis based on provisional death registrations would be unreliable. It is acknowledged that the excess deaths in the PHE reports are estimates, however, they are not updated at any later stage [23]. In contrast, this study used data which were updated regularly and provided the most reliable evidence to test for a heat-mortality relationship.
Data before 2020 will be of inestimable value when considering the heat-mortality relationship in the future as data post-2020 will be contaminated by excess deaths from COVID-19 for at least 2 to 3 years. Indeed, the impact of COVID-19 on excess death figures may last longer as ‘long COVID’ may increase excess deaths during heatwaves beyond 2020. The recently released 2020 PHE Heatwave mortality monitoring report [23] stated that “Cumulative excess all-cause mortality related to heatwaves in summer 2020 was the highest observed since the introduction of the Heatwave Plan for England” [23]. It is not the remit of this study to analyse the 2020 heatwaves, however, this statement is problematic for several reasons. First, to rely on death certificates to identify deaths attributed to COVID-19 would be unreliable due to widespread lack of testing of COVID-19 in large parts of the population during the 2020 summer period. Second, the 2020 report changed the methodology used to calculate heat-related excess deaths by comparing deaths on heatwave days to deaths on non-heatwave days before and after the heatwaves days to take account of COVID-19 [23]. However, this does not take into account the fact that deaths increase as temperature increases prior to actual heatwave days, and people vulnerable to COVID-19 are also vulnerable to heat-related mortality. This makes it problematic to use the pre-heatwave period as a baseline, and we suggest that it is not possible to separate the contribution of COVID-19 and heat to a particular death as the conditions would interact to some degree. Indeed, an estimate of heat-mortality during the 2020 summer period would be unreliable regardless of the methodology used. Whereas the 2020 PHE report recognises this, it still suggests that the 2556 excess deaths (95% CI 2139 to 2926) over and above the COVID-19 deaths were heat-related.
In light of these observations, an evaluation of the operation of the PHE Heatwave mortality monitoring reports would be valuable to determine their reliability. This would provide stronger evidence as to whether there has been a substantial change in the general summer relationship between temperature and mortality since the introduction of the Heatwave Plan for England in 2004, as suggested in its recent evaluation [52]. This is made more pertinent by the fact that the last study on excess mortality in England, which analysed mortality during the 2013 heatwaves, also recorded a lower-than-expected mortality rate [28].
One explanation for the lower-than-expected excess deaths during the 2019 heatwaves is that the heatwaves were relatively short-lived and most periods of high temperatures throughout the summer were relatively short (Figure 4). In fact, the entire 2019 summer period was relatively showery, unsettled and cold as low pressure often dominated [17]. As a result of these conditions, there was only a modest July temperature anomaly of +1.2 °C [17]. Further studies could consider whether unsettled, changeable weather (regardless of the temperature) affects the heat-mortality relationship.
In response to the study’s objectives, the findings demonstrate that the impact of heatwaves on mortality in 2019 was low (both relative to the 5-year average and relative to the excess mortality during the 2018 and 2017 heatwaves). Furthermore, the excess death findings in this study were substantially different from the majority of findings in the 2017, 2018 and 2019 PHE Heatwave mortality monitoring reports. Issues have been identified in the use of death registrations for mortality monitoring and the potential for increased reliability through the use of daily death occurrences.
On a broader scale, the significance of heat-related mortality studies in relation to future projections is often constrained as they are often based on the assumption that the exposure–response relationship between temperature and mortality will remain the same [42]. Studies that have examined the exposure-response relationship have considered this unlikely [62]. In particular, studies in France and New York have reported improved resilience of the population to heat-related events [63,64]. Thus, simple extrapolation of data to identify relationships with higher temperatures without considering adaptation could be unreliable [65]. This has also been demonstrated by longer retrospective studies, which have observed that there has been a decrease in the vulnerability of populations to heat across a number of decades [66]. This decrease exceeds anything expected from a physiological acclimatisation to a changing climate [67], which suggests that non-climate factors, such as public health strategies to mitigate heat-related mortality, may be a factor.
There are limitations to this study which could be addressed in future studies. For instance, there is evidence that most heat-related deaths take place outside the heatwave alert periods [52], particularly in the case of deaths from respiratory and cardiovascular failure as these deaths often take place in the days after a heatwave and are difficult to attribute to heat [9]. These difficulties may lead to an underreporting of heat-related mortality. Likewise, there is a short-term mortality displacement effect, which accelerates death by a short period of time, which may lead to an overreporting of heat-related mortality [68]. This raises the question as to whether the thresholds for the heatwave alerts should be decreased to increase the timespan of the examined heatwave period. This corresponds with studies that have suggested that lower or higher temperatures leading up to a heatwave have a significant impact on excess mortality [69]. Alternatively, an evaluation of heat-related mortality over the entire summer period would bring a more contextual understanding of the relationship between heat and mortality and may lead to a more nuanced understanding of the implications of higher temperatures in the future. Another difficulty of analysing a specific heatwave period is that there is no universal definition for a heatwave, which makes reliable comparisons between heatwave mortality studies problematic [69].
There are statistical factors which could have affected our findings such as the baseline used, the relative population size and the size of vulnerable groups present in the population, such as those with sociodemographic markers or pre-existing conditions [70,71]. Gross domestic product, income inequalities and time-varying confounders, such as days of the week and public holidays, may also have impacted our findings [72,73,74].
Higher temperatures are not the only meteorologic factor increasing mortality during heatwaves as heatwaves are known to increase air pollutant levels, such as ozone, fine particulate matter and nitrogen dioxides, which present a major threat to human health [28]. These pollutants are the result of chemical reactions and various meteorological effects [63,75,76]. Studies have indicated that a proportion of excess mortality during heatwaves is associated with the increased concentrations of air pollution rather than a direct result of high temperatures [49,77]. Thus, heat-related mortality is greater during high ozone or high particulate matter days, which could potentially lead to overestimations of the number of excess deaths caused directly by higher temperature [77]. Further studies investigating the combined and independent impact of temperature and air pollution on mortality using death occurrences would be beneficial.
There are also other heat-stress metrics, such as humidity, which impact mortality. Sweating is the main physiological coping method for heat stress as sweating helps to reduce body temperature by evaporative cooling. Therefore, humidity inhibits sweating. As a result, days with higher humidity have been observed to have higher heat-related mortality [38]. Future studies investigating the relative impact of humidity on heat-attributable mortality in England during heatwaves would be advised to use daily death occurrences rather than death registrations.
The Urban Heat Island (UHI) phenomenon was also excluded from consideration. This effect causes urban areas to experience higher temperatures than suburban and rural surroundings due to anthropogenic heating, a lack of moisture and urban morphology and materials [78]. These higher temperatures (relative to nearby rural temperatures) mean that urban residents are exposed to higher temperatures [78] and may be more vulnerable to heat stress. However, the impact of the UHI is difficult to assess as the ONS death occurrence data is not region-specific.
Another important variable is indoor thermal conditions as people in developed countries spend most of their time indoors. These conditions are not solely dependent on external temperature thresholds as they also relate to building characteristics, which suggests that local, dwelling-based thresholds need to be developed as a matter of priority [79]. Studies have shown healthy people indoors are at higher risk of adverse conditions of extreme heat compared to people outdoors [80,81]. The impact of indoor thermal conditions is likewise outside this study but a further study on the impact of heatwaves on indoor conditions would be highly beneficial.
At a statistical level, the timely recording of the date of death is essential to attribute a death to raised temperatures. However, the practice of General Practitioners who certify deaths can play a role in undermining this reliability. For instance, GPs frequently do not accurately record the date of death, especially if it takes place over a weekend [72]. One retrospective study of over 100,000 deaths between 2011–2015 suggested there is a lack of concordance between national mortality records and date of deaths in primary care in 23.2% cases [72]. Clearly, these practices would adversely affect the reliability of a database.
5. Conclusions
As climate change continues, accurate and reliable data on cumulative excess deaths during heatwaves are essential to draw up effective adaptation policies. The finding that deaths are significantly lower during relatively showery and unsettled summers may be useful in future evaluations of the Heatwave Plan for England and for other countries that have adopted heatwave plans [82,83]. This is the second heat mortality study that has recorded excess deaths which were lower than expected [28]. However, this is the first study to use the newly available death occurrence data. There is important space for data sources to be critically reviewed and continuously updated, particularly as heatwaves are expected to increase. This analysis did not unpack the causality, adaptation measures or their costs. However, we argue the need to do so. This will allow for a more targeted and measured sets of actions, particularly for our most vulnerable citizens. Such analysis will need to include a more detailed demographic cross section and the causal attributes associated with heatwaves. In so doing. low-cost high impact policies, such as the introduction of air conditioning in care homes, might be justifiably—and easily—actioned. However, without such information, appropriately nuanced cost-benefit analysis is simply not available.
We need to move on from our state of global inaction toward a transformation in public health policies based on accurate and reliable data to reduce heat-related mortality [84]. This study therefore calls for further research into reasons for lower excess mortality during heatwaves, which will help to refine adaption policies and better predict the public health impact of increasing global mean temperatures as a result of climate change.
Author Contributions
Conceptualization, N.R.; methodology, N.R.; software, N.R.; validation, N.R.; formal analysis, N.R.; investigation, N.R.; resources, N.R.; data curation, N.R.; writing—original draft preparation, N.R.; writing—review and editing, M.H. and N.R.; visualization, N.R.; supervision, M.H.; project administration, M.H.; funding acquisition, None. All authors have read and agreed to the published version of the manuscript.
Funding
This research received no external funding.
Informed Consent Statement
Not applicable.
Data Availability Statement
Data from National Office of Statistics and Public Health England.
Conflicts of Interest
The authors declare no conflict of interest.
References
- Coumou, D.; Robinson, A.; Rahmstorf, S. Global increase in record-breaking monthly-mean temperatures. Clim. Chang. 2013, 118, 771–782. [Google Scholar] [CrossRef]
- Hegerl, G.C.; Bronnimann, S.; Cowan, T.; Friedman, A.R.; Hawkins, E.; Iles, C.; Müller, W.; Schurer, A.; Undorf, S. Causes of climate change over the historical record. Environ. Res. Lett. 2019, 14, 123006. [Google Scholar] [CrossRef]
- Stocker, T.F.; Qin, D.; Plattner, G.K.; Alexander, L.V.; Allen, S.K.; Bindoff, N.L.; Bréon, F.M.; Church, J.A.; Cubasch, U.; Emori, S.; et al. Technical summary. In Climate Change 2013: The Physical Science Basis. Contribution of Working Group I to the Fifth Assessment Report of the Intergovernmental Panel on Climate Change; Stocker, T.F., Qin, D., Plattner, G.K., Tignor, M., Allen, S.K., Boschung, J., Nauels, A., Xia, Y., Bex, V., Midgley, P.M., Eds.; Cambridge University Press: Cambridge, UK, 2013; pp. 33–115. [Google Scholar]
- Pachauri, R.K.; Allen, M.R.; Barros, V.R.; Broome, J.; Cramer, W.; Christ, R.; Church, J.A.; Clarke, L.; Dahe, Q.; Dasgupta, P.; et al. Climate Change 2014: Synthesis Report; Contribution of Working Groups I, II and III to the Fifth Assessment Report of the Intergovernmental Panel on Climate Change; Cambridge University Press: Cambridge, UK, 2014. [Google Scholar]
- UNFCCC. Adoption of the Paris Agreement. Proposal by the President (Draft Decision); United Nations Office: Geneva, Switzerland, 2015. [Google Scholar]
- Allen, M.R.; Frame, D.J.; Huntingford, C.; Jones, C.D.; Lowe, J.A.; Meinshausen, M.; Meinshausen, N. Warming caused by cumulative carbon emissions towards the trillionth tonne. Nature 2009, 458, 1163–1166. [Google Scholar] [CrossRef] [PubMed]
- Friedlingstein, P.; Andrew, R.M.; Rogelj, J.; Peters, G.P.; Canadell, J.G.; Knutti, R.; Luderer, G.; Raupach, M.R.; Schaeffer, M.; van Vuuren, D.P.; et al. Persistent growth of CO2 emissions and implications for reaching climate targets. Nat. Geosci. 2014, 7, 709–715. [Google Scholar] [CrossRef]
- Huntingford, C.; Mercado, L.M. High chance that current atmospheric greenhouse concentrations commit to warmings greater than 1.5 degrees C over land. Sci. Rep. 2016, 6, 30294. [Google Scholar] [CrossRef] [PubMed]
- Mitchell, D.; Kornhuber, K.; Huntingford, C.; Uhe, P. The day the 2003 European heatwave record was broken Comment. Lancet Planet. Health 2019, 3, E290–E292. [Google Scholar] [CrossRef] [Green Version]
- Orlowsky, B.; Seneviratne, S.I. Global changes in extreme events: Regional and seasonal dimension. Clim. Chang. 2012, 110, 669–696. [Google Scholar] [CrossRef] [Green Version]
- Argueso, D.; Di Luca, A.; Perkins-Kirkpatrick, S.E.; Evans, J.P. Seasonal mean temperature changes control future heat waves. Geophys. Res. Lett. 2016, 43, 7653–7660. [Google Scholar] [CrossRef]
- Perkins, S.E.; Alexander, L.V.; Nairn, J.R. Increasing frequency, intensity and duration of observed global heatwaves and warm spells. Geophys. Res. Lett. 2012, 39, 39. [Google Scholar] [CrossRef]
- Guerreiro, S.B.; Dawson, R.J.; Kilsby, C.; Lewis, E.; Ford, A. Future heat-waves, droughts and floods in 571 European cities. Environ. Res. Lett. 2018, 13, 034009. [Google Scholar] [CrossRef]
- Mora, C.; Dousset, B.; Caldwell, I.R.; Powell, F.E.; Geronimo, R.C.; Bielecki, C.R.; Counsell, C.W.W.; Dietrich, B.S.; Johnston, E.T.; Louis, L.V.; et al. Global risk of deadly heat. Nat. Clim. Chang. 2017, 7, 501–506. [Google Scholar] [CrossRef]
- Forzieri, G.; Cescatti, A.; Batista e Silva, F.; Feyen, L. Increasing risk over time of weather-related hazards to the European population: A data-driven prognostic study. Lancet Planet. Health 2017, 1, e200–e208. [Google Scholar] [CrossRef]
- Christidis, N.; McCarthy, M.; Stott, P.A. The increasing likelihood of temperatures above 30 to 40 degrees C in the United Kingdom. Nat. Commun. 2020, 11, 3093. [Google Scholar] [CrossRef] [PubMed]
- Kendon, M.; McCarthy, M.; Jevrejeva, S.; Matthews, A.; Sparks, T.; Garforth, J. State of the UK Climate 2019. Int. J. Climatol. 2020, 40. [Google Scholar] [CrossRef]
- Stott, P. Attribution Weather risks in a warming world. Nat. Clim. Chang. 2015, 5, 516–517. [Google Scholar] [CrossRef]
- Fischer, E.M.; Knutti, R. Anthropogenic contribution to global occurrence of heavy-precipitation and high-temperature extremes. Nat. Clim. Chang. 2015, 5, 560–564. [Google Scholar] [CrossRef]
- McCarthy, M.; Armstrong, L.; Armstrong, N. A new heatwave definition for the UK. Weather 2019, 74, 382–387. [Google Scholar] [CrossRef]
- Herring, S.C.; Christidis, N.; Hoell, A.; Hoerling, M.; Stott, P.A. Introduction to explaining extreme events of 2017 from a climate perspective. Bull. Am. Meteorol. Soc. 2019, 100, S1–S4. [Google Scholar] [CrossRef] [Green Version]
- NOAA National Centers for Environmental Information. State of the Climate: Global Climate Report for July 2019. Miami, Florida: Office of National Oceanic and Atmospheric Administration. Available online: https://www.ncdc.noaa.gov/sotc/global/201907 (accessed on 22 November 2020).
- Public Health England PHE. Heatwave Mortality Monitoring. London: Public Health England. Available online: https://www.gov.uk/government/publications/phe-heatwave-mortality-monitoring (accessed on 22 November 2020).
- Vautard, R.; Van Aalst, M.; Boucher, O.; Drouin, A.; Haustein, K.; Kreienkamp, F.; Van Oldenborgh, G.J.; Otto, F.E.L.; Ribes, A.; Robin, Y.; et al. Human contribution to the record-breaking June and July 2019 heatwaves in Western Europe. Environ. Res. Lett. 2020, 15, 94077. [Google Scholar] [CrossRef]
- De Villiers, M.P. Europe extreme heat 22–26 July 2019: Was it caused by subsidence or advection? Weather 2020, 13. [Google Scholar] [CrossRef]
- Kovats, R.S.; Hajat, S. Heat stress and public heaFlth: A critical review. Annu. Rev. Public Health 2008, 29, 41–55. [Google Scholar] [CrossRef] [PubMed]
- Bennett, J.E.; Blangiardo, M.; Fecht, D.; Elliott, P.; FEzzati, M. Vulnerability to the mortality effects of warm temperature in the districts of England and Wales. Nat. Clim. Chang. 2014, 4, 269–273. [Google Scholar] [CrossRef]
- Green, H.K.; Andrews, N.; Armstrong, B.; Bickler, G.; Pebody, R. Mortality during the 2013 heatwave in England-How did it compare to previous heatwaves? A retrospective observational study. Environ. Res. 2016, 147, 343–349. [Google Scholar] [CrossRef] [PubMed]
- Johnson, H.; Kovats, S.; McGregor, G.; Stedman, J.; Gibbs, M.; Walton, H.A.; Cook, L.; Blace, E.C.L. The impact of the 2003 heat wave on mortality and hospital admissions in England. Epidemiology 2004, 15, S126. [Google Scholar] [CrossRef] [Green Version]
- Public Health England Heatwave Plan for England. London: Public Health England. Available online: https://www.gov.uk/government/publications/heatwave-plan-for-england (accessed on 22 November 2020).
- Elliot, A.J.; Bone, A.; Morbey, R.; Hughes, H.E.; Harcourt, S.; Smith, S.; Loveridge, P.; Green, H.K.; Pebody, R.; Andrews, N.; et al. Using real-time syndromic surveillance to assess the health impact of the 2013 heatwave in England. Environ. Res. 2014, 135, 31–36. [Google Scholar] [CrossRef]
- Green, H.K.; Andrews, N.J.; Bickler, G.; Pebody, R.G. Rapid estimation of excess mortality: Nowcasting during the heatwave alert in England and Wales in June 2011. J. Epidemiol. Community Health 2012, 66, 866–868. [Google Scholar] [CrossRef] [Green Version]
- Martiello, M.A.; Giacchi, M.V. High temperatures and health outcomes: A review of the literature. Scand. J. Public Health 2010, 38, 826–837. [Google Scholar] [CrossRef]
- Vandentorren, S.; Bretin, P.; Zeghnoun, A.; Mandereau-Bruno, L.; Croisier, A.; Cochet, C.; Ribéron, J.; Siberan, I.; Declercq, B.; Ledrans, M. August 2003 heat wave in France: Risk factors for death of elderly people living at home. Eur. J. Public Health 2006, 16, 583–591. [Google Scholar] [CrossRef] [Green Version]
- Li, M.M.; Gu, S.H.; Bi, P.; Yang, J.; Liu, Q.Y. Heat Waves and Morbidity: Current Knowledge and Further Direction-A Comprehensive Literature Review. Int. J. Environ. Res. Public Health 2015, 12, 5256–5283. [Google Scholar] [CrossRef] [Green Version]
- Nelson, N.G.; Collins, C.L.; Comstock, D.; McKenzie, L.B. Exertional Heat-Related Injuries Treated in Emergency Departments in the U.S.; 1997–2006. Am. J. Prev. Med. 2011, 40, 54–60. [Google Scholar] [CrossRef]
- Sherwood, S.C.; Huber, M. An adaptability limit to climate change due to heat stress. Proc. Natl. Acad. Sci. USA 2010, 107, 9552–9555. [Google Scholar] [CrossRef] [PubMed] [Green Version]
- McNab, B.K. The Physiological Ecology of Vertebrates: A View from Energetics; Cornell Univ Press: Ithaca, NY, USA, 2002; p. 525. [Google Scholar]
- Mehnert, P.; Malchaire, J.; Kampmann, B.; Piette, A.; Griefahn, B.; Gebhardt, H. Prediction of the average skin temperature in warm and hot environments. Eur. J. Appl. Physiol. 2000, 82, 52–60. [Google Scholar] [CrossRef] [PubMed]
- Raymond, C.; Matthews, T.; Horton, R.M. The emergence of heat and humidity too severe for human tolerance. Sci. Adv. 2020, 6, eaaw1838. [Google Scholar] [CrossRef]
- Robine, J.M.; Cheung, S.L.K.; Le Roy, S.; Van Oyen, H.; Griffiths, C.; Michel, J.P.; Herrmannd, F.R. Death toll exceeded 70,000 in Europe during the summer of 2003. Comptes Rendus Biol. 2008, 331, 171–178. [Google Scholar] [CrossRef] [PubMed]
- Met Office Heat-Health Watch Service. Available online: https://www.metoffice.gov.uk/weather/warnings-and-advice/seasonal-advice/heat-health-watch-service (accessed on 22 November 2020).
- Public Health England. All-Cause Mortality Surveillance. London: Public Helath England. Available online: https://www.gov.uk/government/collections/all-cause-mortality-surveillance (accessed on 22 November 2020).
- Office for National Statistics. Deaths Registered Weekly in England and Wales. Newport, South Wales: Office for National Statistics. Available online: https://www.ons.gov.uk/peoplepopulationandcommunity/birthsdeathsandmarriages/deaths/datasets/weeklyprovisionalfiguresondeathsregisteredinenglandandwales (accessed on 22 November 2020).
- Office for National Statistics. Quarterly Mortality, England. Newport, South Wales: Office for National Statistics. Available online: https://www.ons.gov.uk/peoplepopulationandcommunity/birthsdeathsandmarriages/deaths/datasets/quarterlymortalityreportsanalysis (accessed on 23 November 2020).
- Watts, J.D.; Kalkstein, L.S. The development of a warm-weather relative stress index for environmental applications. J. Appl. Meteorol. 2004, 43, 503–513. [Google Scholar] [CrossRef] [Green Version]
- Sheridan, S.C.; Kalkstein, L.S. Progress in heat watch–warning system technology. Bull. Am. Meteorol. Soc. 2004, 85, 1931–1942. [Google Scholar] [CrossRef]
- Vaneckova, P.; Neville, G.; Tippett, V.; Aitken, P.; FitzGerald, G.; Tong, S. Do biometeorological indices improve modeling outcomes of heat-related mortality? J. Appl. Meteorol. Climatol. 2011, 50, 1165–1176. [Google Scholar] [CrossRef]
- Rooney, C.; McMichael, A.J.; Kovats, R.S.; Coleman, M.P. Excess mortality in England and Wales, and in Greater London, during the 1995 heatwave. J. Epidemiol. Community Health 1998, 52, 482–486. [Google Scholar] [CrossRef] [Green Version]
- Office for National Statistics. Impact of registration delays on mortality statistics in England and Wales: 2018. Wales: Office for National Statistics. Available online: https://www.ons.gov.uk/peoplepopulationandcommunity/birthsdeathsandmarriages/deaths/articles/impactofregistrationdelaysonmortalitystatisticsinenglandandwales/2018 (accessed on 22 November 2020).
- Office for National Statistics. Quarterly Mortality Report, England: April to June 2019, Deaths data sources. Newport, South Wales: Office for National Statistics. Available online: https://www.ons.gov.uk/peoplepopulationandcommunity/birthsdeathsandmarriages/deaths/articles/quarterlymortalityreports/apriltojune2019#measuring-these-data (accessed on 22 November 2020).
- Williams, L.; Erens, B.; Ettelt, S.; Hajat, S.; Manacorda, T.; Mays, N. Evaluation of the Heatwave Plan for England; Policy Innovation and Evaluation Research Unit: London, UK, 2019. [Google Scholar]
- Mai, F.; Del Pinto, R.; Ferri, C. COVID-19 and cardiovascular diseases. J. Cardiol. 2020, 76, 453–458. [Google Scholar] [CrossRef]
- Met Office. Hadley Centre Central England Temperature Data. Available online: https://www.metoffice.gov.uk/hadobs/hadcet/data/download.html (accessed on 22 November 2020).
- Parker, D.E.; Legg, T.P.; Folland, C.K. A new daily Central England Temperature series, 1772–1991. Int. J. Climatol. 1992, 12, 317–342. [Google Scholar] [CrossRef]
- Ederer, F. The relative survival rate: A statistical methodology. NCI Monogr. 1961, 6, 101–121. [Google Scholar]
- Petkova, E.P.; Vink, J.K.; Horton, R.M.; Gasparrini, A.; Bader, D.A.; Francis, J.D.; Kinney, P.L. Towards more comprehensive projections of urban heat-related mortality: Estimates for New York City under multiple population, adaptation, and climate scenarios. Environ. Health Perspect. 2017, 125, 47–55. [Google Scholar] [CrossRef] [Green Version]
- Tong, S.; Wang, X.Y.; Guo, Y. Assessing the short-term effects of heatwaves on mortality and morbidity in Brisbane, Australia: Comparison of case-crossover and time series analyses. PLoS ONE 2012, 7, e37500. [Google Scholar] [CrossRef] [Green Version]
- Guo, Y.; Barnett, A.G.; Tong, S. Spatiotemporal model or time series model for assessing city-wide temperature effects on mortality? Environ. Res. 2013, 120, 55–62. [Google Scholar] [CrossRef]
- Elie, C.; De Rycke, Y.; Jais, J.P.; Landais, P. Appraising relative and excess mortality in population-based studies of chronic diseases such as end-stage renal disease. Clin. Epidemiol. 2011, 3, 157. [Google Scholar] [CrossRef] [Green Version]
- Anderson, G.B.; Bell, M.L. Heat waves in the United States: Mortality risk during heat waves and effect modification by heat wave characteristics in 43 US communities. Environ. Health Perspect. 2011, 119, 210–218. [Google Scholar] [CrossRef] [PubMed] [Green Version]
- Hajat, S.; Kosatky, T. Heat-related mortality: A review and exploration of heterogeneity. J. Epidemiol. Community Health 2010, 64, 753–760. [Google Scholar] [CrossRef] [PubMed]
- Fouillet, A.; Rey, G.; Laurent, F.; Pavillon, G.; Bellec, S.; Guihenneuc-Jouyaux, C.; Jougla, E.; Hémon, E. Excess mortality related to the August 2003 heat wave in France. Int. Arch. Occup. Environ. Health 2006, 80, 16–24. [Google Scholar] [CrossRef] [PubMed] [Green Version]
- Sheridan, S.; Lin, S. Assessing Variability in the Impacts of Heat on Health Outcomes in New York City Over Time, Season, and Heat-Wave Duration. Ecohealth 2014, 11, 512–525. [Google Scholar] [CrossRef]
- Urban, A.; Kysely, J.; Plavcova, E.; Hanzlikova, H.; Stepanek, P. Temporal changes in years of life lost associated with heat waves in the Czech Republic. Sci. Total Environ. 2020, 716. [Google Scholar] [CrossRef]
- Hondula, D.M.; Balling, R.C.; Vanos, J.K.; Georgescu, M. Rising Temperatures, Human Health, and the Role of Adaptation. Curr. Clim. Chang. Rep. 2015, 1, 144–154. [Google Scholar] [CrossRef] [Green Version]
- Vicedo-Cabrera, A.M.; Guo, Y.M.; Sera, F.; Huber, V.; Schleussner, C.F.; Mitchell, D.; Tong, S.; de Sousa Zanotti Stagliorio Coelho, M.; Saldiva, P.H.N.; Lavigne, E.; et al. Temperature-related mortality impacts under and beyond Paris Agreement climate change scenarios. Clim. Chang. 2018, 150, 391–402. [Google Scholar] [CrossRef] [Green Version]
- Armstrong, B.; Gasparrini, A.; Hajat, S. Estimating mortality displacement during and after heat waves. Am. J. Epidemiol. 2014, 179, 1405–1406. [Google Scholar] [CrossRef] [PubMed] [Green Version]
- Perkins, S.E.; Alexander, L.V. On the measurement of heat waves. J. Clim. 2013, 26, 4500–4517. [Google Scholar] [CrossRef]
- Toloo, G.; FitzGerald, G.; Aitken, P.; Verrall, K.; Tong, S.L. Evaluating the effectiveness of heat warning systems: Systematic review of epidemiological evidence. Int. J. Public Health 2013, 58, 667–681. [Google Scholar] [CrossRef] [PubMed]
- Henderson, S.B.; Wan, V.; Kosatsky, T. Differences in heat-related mortality across four ecological regions with diverse urban, rural, and remote populations in British Columbia, Canada. Health Place 2013, 23, 48–53. [Google Scholar] [CrossRef] [Green Version]
- Harshfield, A.; Abel, G.A.; Barclay, S.; Payne, R.A. Do GPs accurately record date of death? A UK observational analysis. BMJ Supportive Palliat. Care 2020, 10. [Google Scholar] [CrossRef] [Green Version]
- Sera, F.; Armstrong, B.; Tobias, A.; Vicedo-Cabrera, A.M.; Åström, C.; Bell, M.L.; Chen, B.-Y.; De, M.; Zanotti, S.; Coelho, M.S.Z.S.; et al. How urban characteristics affect vulnerability to heat and cold: A multi-country analysis. Int. J. Epidemiol. 2019, 48, 1101–1112. [Google Scholar] [CrossRef] [Green Version]
- Arbuthnott, K.G.; Hajat, S. The health effects of hotter summers and heat waves in the population of the United Kingdom: A review of the evidence. Environ. Health 2017, 16, 119. [Google Scholar] [CrossRef] [Green Version]
- Kalisa, E.; Fadlallah, S.; Amani, M.; Nahayo, L.; Habiyaremye, G. Temperature and air pollution relationship during heatwaves in Birmingham, UK. Sustain. Cities Soc. 2018, 43, 111–120. [Google Scholar] [CrossRef] [Green Version]
- Analitis, A.; Michelozzi, P.; D’Ippoliti, D.; De’Donato, F.; Menne, B.; Matthies, F.; Lefranc, A. Effects of heat waves on mortality: Effect modification and confounding by air pollutants. Epidemiology 2014, 25, 15–22. [Google Scholar] [CrossRef] [PubMed]
- Stedman, J.R. The predicted number of air pollution related deaths in the UK during the August 2003 heatwave. Atmos. Environ. 2004, 38, 1087–1090. [Google Scholar] [CrossRef]
- Heaviside, C.; Vardoulakis, S.; Cai, X.M. Attribution of mortality to the urban heat island during heatwaves in the West Midlands, UK. Environ. Health 2016, 15, 49–59. [Google Scholar] [CrossRef] [PubMed] [Green Version]
- Anderson, M.; Carmichael, C.; Murray, V.; Dengel, A.; Swainson, M. Defining indoor heat thresholds for health in the UK. Perspect. Public Health 2013, 133, 158–164. [Google Scholar] [CrossRef]
- Cui, J.; Arbab-Zadeh, A.; Prasad, A.; Durand, S.; Levine, B.D.; Crandall, C.G. Effects of heat stress on thermoregulatory responses in congestive heart failure patients. Circulation 2005, 112, 2286–2292. [Google Scholar] [CrossRef] [Green Version]
- Huang, W.; Kan, H.; Kovats, S. The impact of the 2003 heat wave on mortality in Shanghai, China. Sci. Total Environ. 2010, 408, 2418–2420. [Google Scholar] [CrossRef]
- Lowe, D.; Ebi, K.L.; Forsberg, B. Heatwave Early Warning Systems and Adaptation Advice to Reduce Human Health Consequences of Heatwaves. Int. J. Environ. Res. Public Health 2011, 8, 4623–4648. [Google Scholar] [CrossRef] [Green Version]
- Smith, K.; Woodward, A.; Campbell-Lendrum, D.; Chadee, D.; Honda, Y.; Liu, Q.; Olwoch, J.; Revich, B.; Sauerborn, R.; Aranda, C.; et al. Human health: Impacts, adaptation, and co-benefits. In Climate Change 2014: Impacts, Adaptation, and Vulnerability. Part A: Global and Sectoral Aspects. Contribution of Working Group II to the Fifth Assessment Report of the Intergovernmental Panel on Climate Change, 1st ed.; Field, C.B., Barros, V., Dokken, D.J., Eds.; Cambridge University Press: Cambridge, UK, 2014; pp. 709–754. [Google Scholar]
- Watts, N.; Amann, M.; Ayeb-Karlsson, S.; Belesova, K.; Bouley, T.; Boykoff, M.; Byass, P.; Cai, W.; Campbell-Lendrum, D.; Chambers, J.; et al. The Lancet Countdown on health and climate change: From 25 years of inaction to a global transformation for public health. Lancet 2018, 391, 581–630. [Google Scholar] [CrossRef]
Figure 1.
All-cause excess mortality in 65+ years group during the 2020 summer period. The shaded areas highlight periods which meet the Heatwave Plan for England (PHE) heatwave criteria for estimating heatwave excess mortality [23].
Figure 1.
All-cause excess mortality in 65+ years group during the 2020 summer period. The shaded areas highlight periods which meet the Heatwave Plan for England (PHE) heatwave criteria for estimating heatwave excess mortality [23].

Figure 2.
Comparison of observed and expected daily mortality in England in Summer 2019 relative to the mean Central England Temperature (CET). The daily number of deaths (green line) and 7-day moving average were compared to the expected number (black line) with the daily maximum CET (°C, brown line) and daily mean CET (°C, purple line) during the summer period of 2019. The shaded blue area highlights periods which met the PHE heatwave criteria as defined in Green et al. 2016.

Figure 3.
Daily excess deaths during the summer period (1 June to 15 September) for (a) 2017, (b) 2018 and (c) 2019 based on daily death occurrences. The negative excess deaths refer to days when death was lower than expected relative to the average of the previous 5-year period.
Figure 3.
Daily excess deaths during the summer period (1 June to 15 September) for (a) 2017, (b) 2018 and (c) 2019 based on daily death occurrences. The negative excess deaths refer to days when death was lower than expected relative to the average of the previous 5-year period.

Figure 4.
Maximum temperatures during the summer period (1 June to 15 September) for 2017, 2018 and 2019.
Figure 4.
Maximum temperatures during the summer period (1 June to 15 September) for 2017, 2018 and 2019.

Figure 5.
Daily death occurrences (red line) compared to death registrations (blue line) for the period 1 June to 15 September 2019.
Figure 5.
Daily death occurrences (red line) compared to death registrations (blue line) for the period 1 June to 15 September 2019.


Table 1.
Summer 2019 heatwave periods, the corresponding 5-year average of death occurrence for the same period and the excess number of deaths with 95% confidence intervals.
Table 1.
Summer 2019 heatwave periods, the corresponding 5-year average of death occurrence for the same period and the excess number of deaths with 95% confidence intervals.
| Heatwave Period | Average Deaths 2014–2018 | Total Deaths | 95% Confidence Limits | Total Excess Deaths | 95% Confidence Limits | PHE Heatwave Mortality Monitoring Excess Deaths |
|---|---|---|---|---|---|---|
| 28–30 June | 3556 | 3369 | 3048 to 3690 | 0 | −508 to 134 | 0 |
| 21–28 July | 9471 | 9632 | 8720 to 10,500 | 161 | −751 to 1053 | 572 |
| 23–29 Aug | 8334 | 8267 | 7826 to 8708 | 0 | −508 to 374 | 320 |
| Total | 17,805 | 17,899 | 161 | 892 |
Table 2.
Summer 2018 heatwave periods, the corresponding 5-year average of death occurrence for the same period and the excess number of deaths with 95% confidence intervals.
Table 2.
Summer 2018 heatwave periods, the corresponding 5-year average of death occurrence for the same period and the excess number of deaths with 95% confidence intervals.
| Heatwave Period | Average Deaths 2013–2017 | Total Deaths | 95% Confidence Limits | Total Excess Deaths | 95% Confidence Limits | PHE Heatwave Mortality Monitoring Excess Deaths |
|---|---|---|---|---|---|---|
| 25–27 June | 3755 | 4117 | 3844 to 4389 | 362 | 89 to 634 | 188 |
| 30 June–10 July | 14,080 | 14,538 | 14,056 to 15,015 | 458 | −24 to 935 | 266 |
| 21–29 July | 11,206 | 11,851 | 11,127 to 12,575 | 645 | −79 to 1369 | 409 |
| 2–9 August | 10,053 | 10,298 | 9808 to 10,788 | 235 | −255 to 725 | 0 |
| Total | 39,094 | 40,804 | 1700 | 863 |
Table 3.
Summer 2017 heatwave periods, the corresponding 5-year average of death occurrence for the same period and the excess number of deaths with 95% confidence intervals.
Table 3.
Summer 2017 heatwave periods, the corresponding 5-year average of death occurrence for the same period and the excess number of deaths with 95% confidence intervals.
| Heatwave Period | Average Deaths 2012–2016 | Total Deaths | 95% Confidence Limits | Total Excess Deaths | 95% Confidence Limits | PHE Heatwave Mortality Monitoring Excess Deaths |
|---|---|---|---|---|---|---|
| 17–23 June | 8216 | 9237 | 8730 to 9928 | 1113 | 514 to 1712 | 598 |
| 5–7 July | 3528 | 3904 | 3724 to 4084 | 376 | 196 to 556 | 180 |
| Total | 11,744 | 13,141 | 1489 | 778 |
Table 4.
Total excess deaths during the summer period (1 June to 15 September) for 2017, 2018 and 2019 based on daily death occurrences. The negative excess death total indicates that the deaths for that year were lower than the average number of deaths for the previous 5-year period.
Table 4.
Total excess deaths during the summer period (1 June to 15 September) for 2017, 2018 and 2019 based on daily death occurrences. The negative excess death total indicates that the deaths for that year were lower than the average number of deaths for the previous 5-year period.
| Year | Total Deaths | Expected Deaths | Excess Deaths |
|---|---|---|---|
| 2019 | 122,257 | 128,087 | 0 (−5830) |
| 2018 | 126,627 | 126,115 | 0 (−1506) |
| 2017 | 129,998 | 126,059 | 3939 |
Table 5.
Death registrations compared to death occurrences for the summer 2019 period.
| Week Number | Week Ended | Death Registrations | Death Occurrences |
|---|---|---|---|
| 22 | 1 June 2019 | 7722 | 8121 |
| 23 | 7 June 2019 | 9489 | 8018 |
| 24 | 14 June 2019 | 8826 | 8003 |
| 25 | 21 June 2019 | 8895 | 8002 |
| 26 | 28 June 2019 | 8918 | 7874 |
| 27 | 5 July 2019 | 8499 | 8036 |
| 28 | 12 July 2019 | 8557 | 8024 |
| 29 | 19 July 2019 | 8509 | 7960 |
| 30 | 26 July 2019 | 8537 | 8647 |
| 31 | 2 August 2019 | 8666 | 7617 |
| 32 | 9 August 2019 | 8555 | 8036 |
| 33 | 16 August 2019 | 8467 | 7667 |
| 34 | 23 August 2019 | 8421 | 7848 |
| 35 | 30 August 2019 | 7655 | 8239 |
| 36 | 6 September 2019 | 9087 | 7856 |
| 37 | 13 September 2019 | 8924 | 8163 |
| 38 | 20 September 2019 | 8837 | 8033 |
Publisher’s Note: MDPI stays neutral with regard to jurisdictional claims in published maps and institutional affiliations. |
© 2021 by the authors. Licensee MDPI, Basel, Switzerland. This article is an open access article distributed under the terms and conditions of the Creative Commons Attribution (CC BY) license (http://creativecommons.org/licenses/by/4.0/).
Share and Cite
MDPI and ACS Style
Rustemeyer, N.; Howells, M. Excess Mortality in England during the 2019 Summer Heatwaves. Climate 2021, 9, 14. https://0-doi-org.brum.beds.ac.uk/10.3390/cli9010014
AMA Style
Rustemeyer N, Howells M. Excess Mortality in England during the 2019 Summer Heatwaves. Climate. 2021; 9(1):14. https://0-doi-org.brum.beds.ac.uk/10.3390/cli9010014
Chicago/Turabian StyleRustemeyer, Natasha, and Mark Howells. 2021. "Excess Mortality in England during the 2019 Summer Heatwaves" Climate 9, no. 1: 14. https://0-doi-org.brum.beds.ac.uk/10.3390/cli9010014
Note that from the first issue of 2016, this journal uses article numbers instead of page numbers. See further details here.