
Sensitivity of Winter Barley Yield to Climate Variability in a Pleistocene Loess Area


1
Plant Nutrition, Technical University of Munich, Emil-Ramann-Str. 2, D-85350 Freising, Germany
2
Chair of Agricultural Systems Engineering, Technical University Munich, Dürnast 4, D-85354 Freising, Germany
3
FarmFacts GmbH, Rennbahnstraße 9, D-84347 Pfarrkirchen, Germany
*
Author to whom correspondence should be addressed.
Climate 2021, 9(7), 112; https://0-doi-org.brum.beds.ac.uk/10.3390/cli9070112
Submission received: 20 May 2021
/
Revised: 2 July 2021
/
Accepted: 4 July 2021
/
Published: 6 July 2021
(This article belongs to the Special Issue Climate Change and Variability Impacts on Agriculture and Water Resources Sectors)
Abstract
:Global climate change is predicted to increase temperatures and change the distribution of precipitation. However, there is high uncertainty regarding the regional occurrence and intensity of climate change. Therefore, this work examines the effects of climate parameters on the long-term yields of winter barley and assesses the parameters affecting plant development throughout the year and in specific growth phases. The investigation was carried out in an area with Pleistocene loess, a highly fertile site in Germany. The effect of climate on crop yields was modeled with monthly weather parameters and additional indices such as different drought parameters, heat-related stress, late spring frost, early autumn frost, and precipitation-free periods. Residuals and yield values were treated as dependent variables. The residuals were determined from long-term yield trends using the autoregressive integrated moving average (ARIMA) method. The results indicated that temperature and precipitation are significant in all calculations in all variants, but to a lesser degree when considered as sums or mean values, compared with specific indices (e.g., frost-alternating days, the temperature threshold, the precipitation intensity, rain-free days, the early/late frost index, and the de Martonne–Reichel dryness index). The inter-annual variations in crop yields were mainly determined by the prevailing climatic conditions in winter as well as the transition periods from the warmer season to winter and vice versa. The main winter indices were the temperature threshold, frost-alternating days, and precipitation intensity. During the main growth periods, only the precipitation intensity was significant. These findings can be attributed to the high available field water capacity of this site, which overcomes the need for summer precipitation if the soil water storage is replenished during winter.
1. Introduction
1.1. Background
The possible effects of climate change on plants need in-depth analysis, especially the effects of temperature and precipitation [1]. In addition, there is a need to consider species-specific reactions to the environment with regard to plant development and reproduction [2,3,4].
The soil quality requirements of barley are relatively low as long as a sufficient nutrient supply is maintained. Winter barley grows in soils with a tillage number of >30 [5] but requires an adequate lime supply. Locations with significantly changing temperatures, which tend to freeze, are not suitable for the cultivation of winter barley. Winter barley is at high risk of wintering out if there is insufficient hardening and no snow cover and if the temperatures fall below −15 °C for extended periods [5].
Table 1 lists important climatic conditions affecting plant growth. Heil et al. [6] reported that, at more fertile sites, the variation in winter wheat yield is more affected by climatic conditions in winter and the transition periods from winter to the warmer season and vice versa and less affected by the climatic conditions during the main growing season.
Dendl [7] reported that May and June are the most important periods affecting the variation in winter barley yield. High temperature and low precipitation during these two months negatively affect the yield, as observed in several federal states of Germany. Yield-relevant developmental stages, such as ear emergence, double-ring formation, and first-node formation, are mainly affected by precipitation and average temperature [7,8,9]. Many studies have described how rising temperatures and CO2 concentrations affect plant growth (e.g., [4]). Felbermeir et al. [10] reported that increasing CO2 concentrations shortened the developmental stages and improved yield and water use efficiency. Herz [11] and Asch [12] showed the reducing effects of precipitation redistribution, increased temperatures, radiation levels, and diseases and parasites favored by climate change on the barley yield.
Templer et al. [13] described the variation in barley yield as a function of the water balance. Increased radiation and heat stress led to reactive oxygen species generation, which reduced photosynthesis [14]. Hakala et al. [15] reported a reduction in the number of spike-bearing culms due to steep temperature increases and reduced precipitation. They also outlined the importance of the interaction of high temperatures during the shelling phase, low grain numbers/ears, and reduced thousand-grain weight with a shortening of the period between ear emergence and full maturity was outlined. This shortening may result from high temperatures and increased and long-duration radiation.
Hakala et al. [15] detailed several effects of temperature and precipitation on spring barley biomass growth in Finland. Spring barley yields were frequently reduced by excessive rain early in the season or by drought, by high temperatures around heading, and by enhanced rates of temperature accumulation during the two weeks before heading and between heading and yellow maturity. Low temperatures after sowing increased yields, but frost during the first four weeks after sowing did not. After canopy establishment, higher precipitation resulted in higher yields [10].
Increasingly, research is focusing on future yield development as a function of meteorological factors. Several investigations indicate that changes in atmospheric CO2 concentrations, temperature, rainfall, and pest prevalence, each alone or combined, change the environmental effects of agricultural production systems [16,17]. An increasing frequency of extreme weather events, such as prolonged drought and heatwaves, was predicted, but there is high uncertainty regarding the intensity and aerial extent of local changes [16]. The effects of greenhouse-gas-induced climate change and the direct fertilization effect of CO2 concentrations have been investigated for example by Clausen et al. [18]. This study attributed the potential increase in barley yields to elevated atmospheric CO2 of 385 ppm and 700 ppm. Generally, elevated levels of ozone and temperature appeared to have a negative effect on the plant parameters, whereas CO2 usually gave a significant increase of the plant parameters, plant heights and yields [18].
Dijkman et al. [17] identified four factors that will affect spring barley yield development in Denmark in the next 30 years. First, increasing atmospheric CO2 concentrations will improve grain yields [19], combined with a lower input of fertilizer per mass of harvested plants. An increase of up to 20% has been predicted [17]. Second, the predicted rise in temperature will reduce grain yield mainly because the grain-filling phase will be shortened [20]. A comparison of both contrary effects indicates an increase of 56% in the spring barley yield with increased CO2 concentrations and a decrease of 27% with a 5 °C higher temperature. With both increased CO2 concentrations and increased temperatures, an overall decrease of 14% has been reported compared to barley grown under ambient conditions [19]. Third is a change in precipitation patterns [21] with more precipitation in winter, and less in summer. This predicted change will increase the loss of nutrients (N, P, K) especially for sandy and sandy loam soils, cultivated with barley, respectively. Additionally, restrictions on water use for irrigation in some regions [16,22], are assumed. Fourth is the increase in pest populations (pests that are already present and the spread of new pest diseases) [23]. Therefore, the amount and type of pesticides applied will be determined by climatic changes.
1.2. Objectives of This Study
This study investigated to what extent barley yields are affected by the climate and whether there are specific climate parameters that significantly affect the development of barley throughout the year and in specific growth phases.
This objective based on the derivations of yields with meteorological variables (temperature average, temperature minimum, temperature maximum, total precipitation) [11,24,25,26,27,28,29]. We also included additional parameters in the modeling, such as monthly temperature, precipitation, and radiation. These parameters and indices were identified from the literature [11,15,30].
In addition, it was critical to determine whether the effect of different climatic parameters was influenced by the level of N fertilization.
The study aimed to better interpret experimental results, especially at the investigated site (Dürnast, Germany), where a long-term experiment with different fertilization levels was conducted for more than 40 years and a consistent dataset is available. The biological effects on crop development, as determined by climatic conditions, were not the objective of this study.
2. Materials and Methods
2.1. General Description, Soil, and Physiography of the Dürnast Long-Term Study Area
The Dürnast experimental station is located in Freising (30 km north of Munich, Germany) in a hilly tertiary landscape, 470 m above sea level. The area has undergone Pleistocene loess deposits and subsequent erosion during the periglacial period and Holocene erosion and deposition. According to [37], the predominant soil types in this area are fine-grained dystric eutrochrept and fine-loam typical udifluvent [6].
2.2. General Description of the Experimental Design, Winter Barley Varieties, and Amounts of Fertilizer
A long-term field trial was established in 1979 in a 0.23 ha area, managed by the Chair of Plant Nutrition, TUM, Freising. The crop rotation included potato (maize), wheat, and barley, fertilized with six different N fertilizers: calcium ammonium nitrate (KAS), urea (Ha), ammonium sulfate nitrate (ASA), ammonium nitrate solution (AHL), ammonium sulfate nitrate with a nitrification inhibitor (Ntec), and calcium cyanamide (Pka). Two nitrogen levels were studied with four replicates. Two control plots were planted in each replicate for comparison [6].
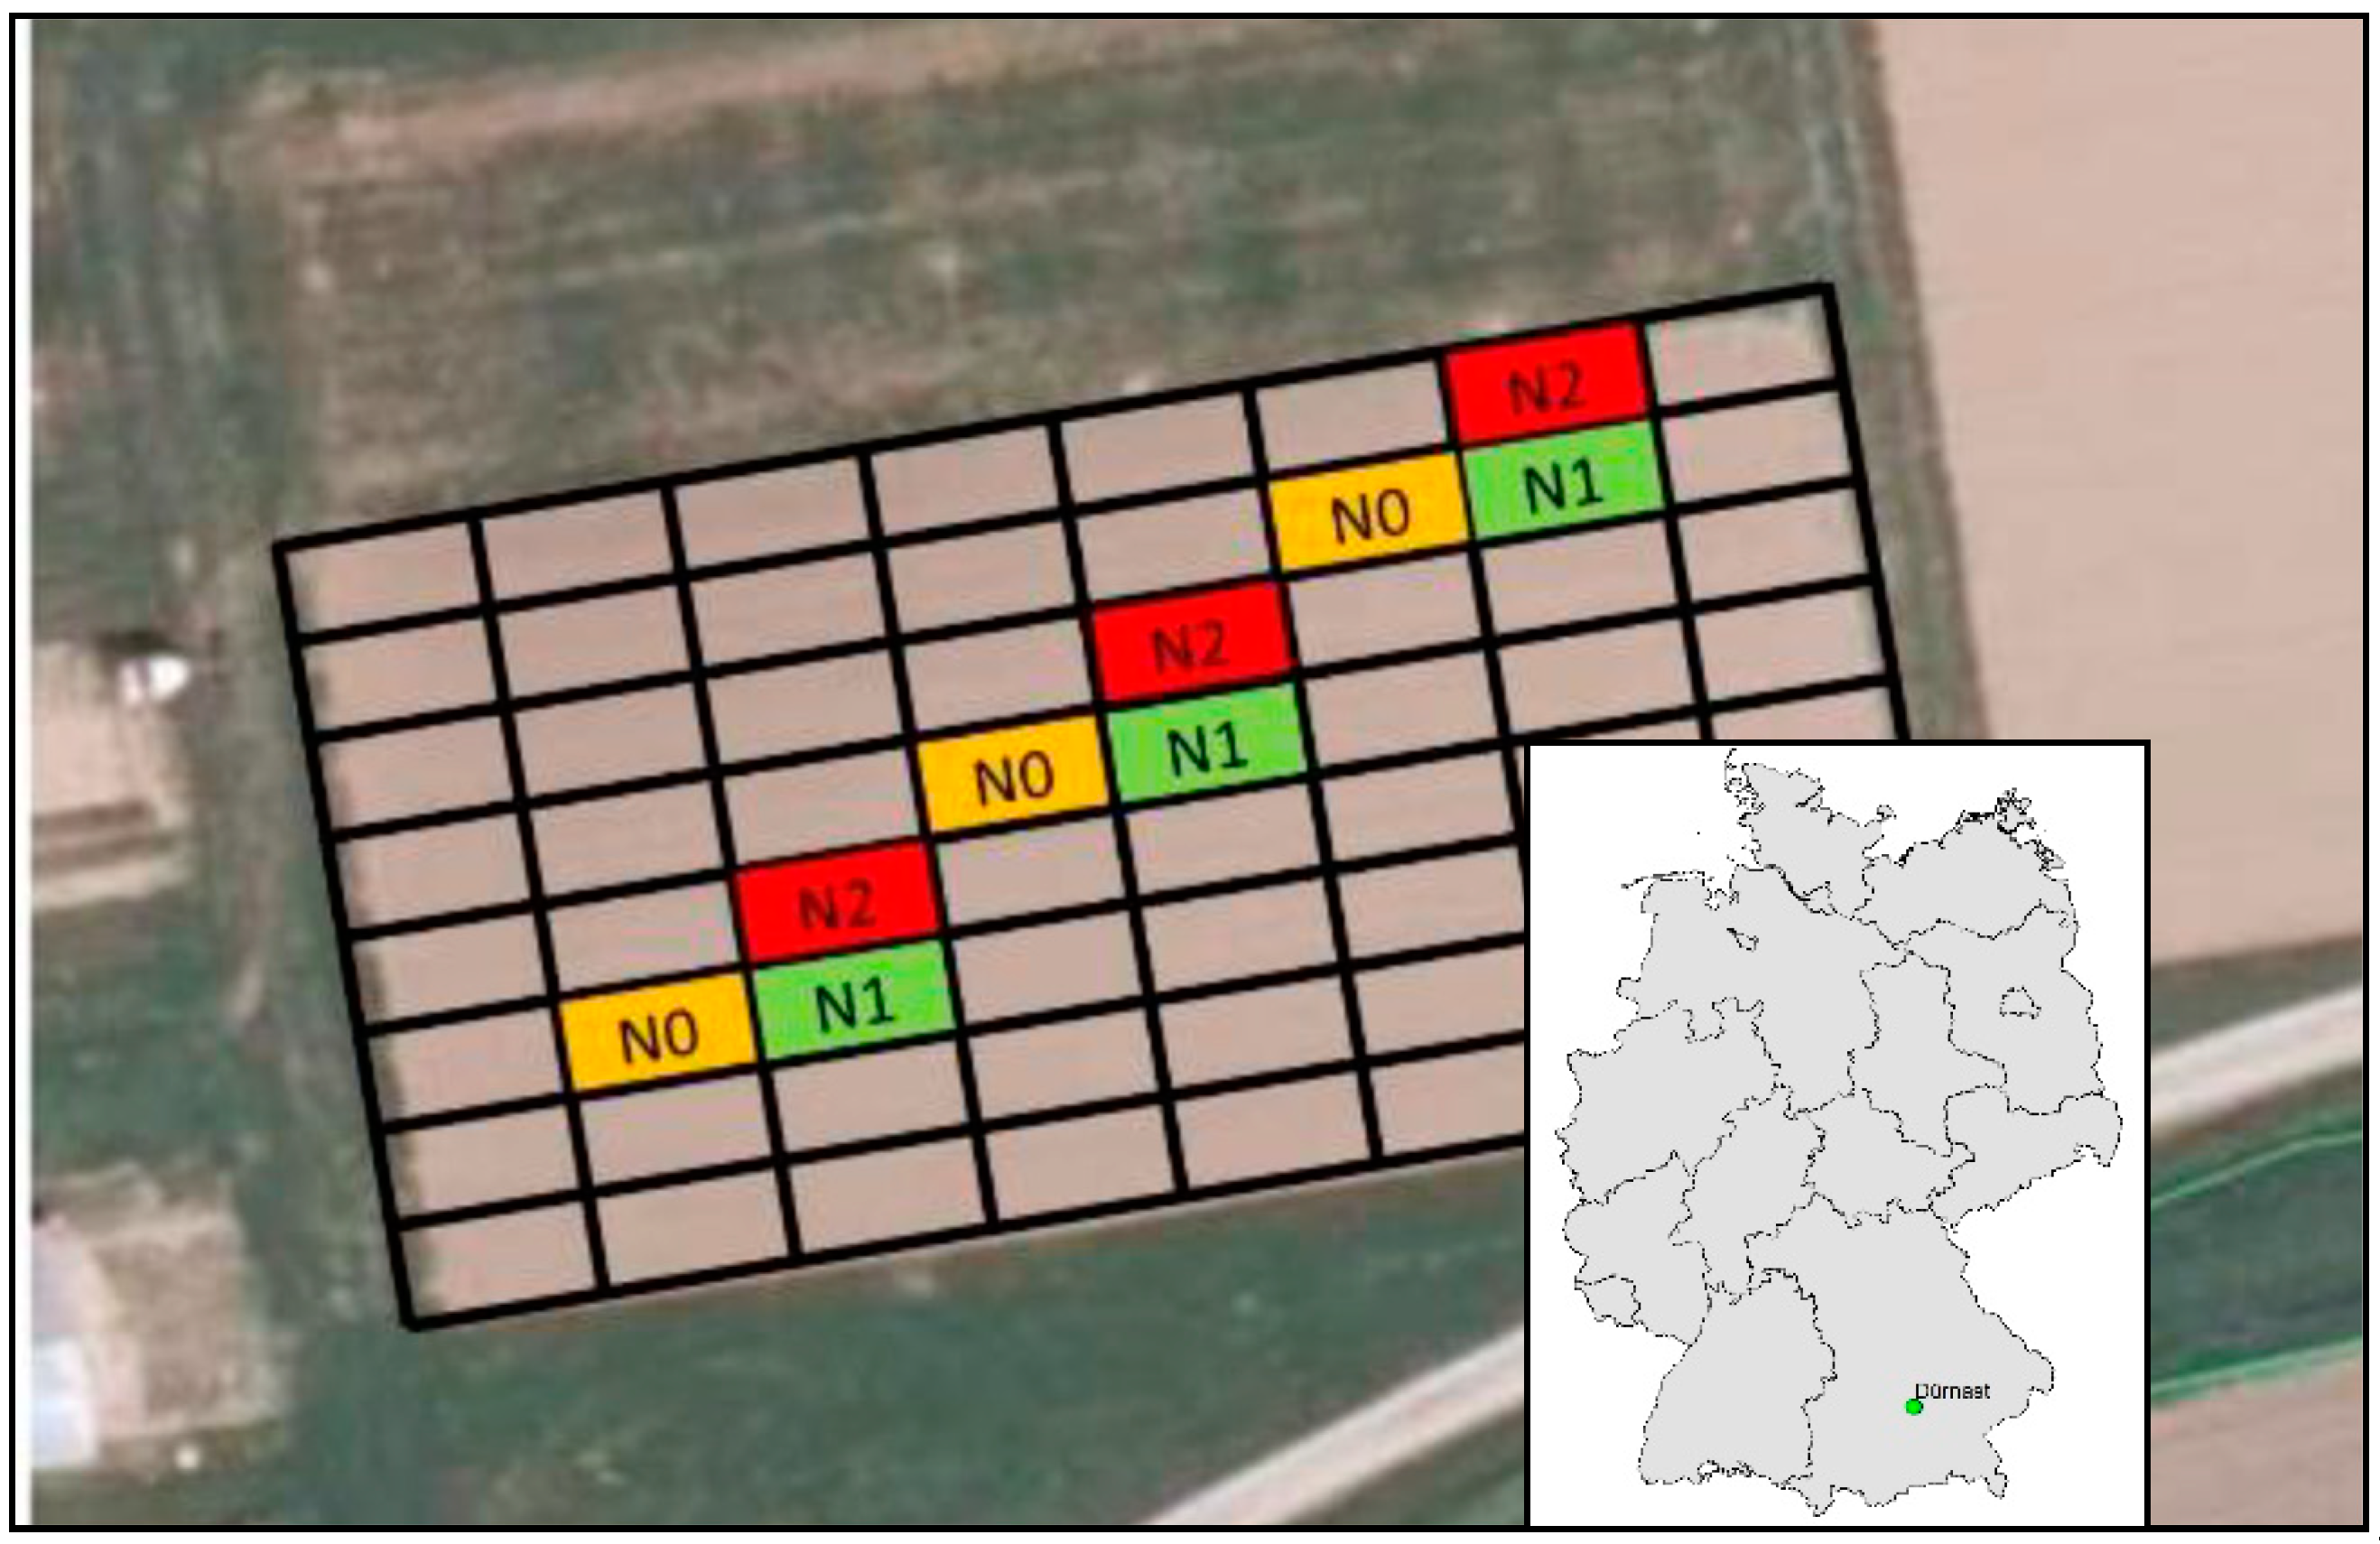
This study investigated the yields of winter barley fertilized with calcium ammonium nitrate and the corresponding control plots. Calcium ammonium nitrate is the most commonly used N fertilizer in Germany. The fertilizer was applied at three levels that included control plots (N0: control plots with zero N; N1: plots with moderate N fertilization; and N2: plots with high N fertilization). Until 2001, 100/130 kg N ha−1 of fertilizer was applied on moderately fertilized plots and 140 kg N ha−1 on higher-fertilized plots. Later, the fertilization level was increased to 140 and 180 kg N ha−1, respectively [6] (Figure 1). Barley yields were determined per plot using a combine harvester [6].
From 1979 until 2016, barley was cultivated 11 times, including spring barley once in 1981. However, the yields were evaluated without the spring barley yield because it was significantly lower compared with winter barley.
The sowing dates were in September to early October (1984: 21.9.1983; 1987: 22.9.1986; 20.9.1989; 1991: 24.9.1992; 1994: 20.9.1995, 1997: 25.9.1998; 2000: 2.10.2001; 2003: 21.9.2004; 2006: 2.10.2007; 2009: 15.9.12010; and 2011: 4.10.2012).
2.3. Independent Parameters for the Derivation of Yield
Data from the German Weather Service weather station were used to calculate the climate indices. This station is located 312 m southeast of the experimental area in Dürnast.
We modeled the weather effect on crop yield with monthly weather parameters and additional indices. In addition to the mean temperature and precipitation, the indices listed in Table 3 were used as independent variables.
2.4. Statistical Analysis
Statistical analysis was performed using SPSS v 24.0 [40]. Two different methods were evaluated. Firstly, the absolute values of the measured yields were used as dependent variables, and secondly, the residuals between the measured yields and the smoothed yields were used as response variables. Here, we developed a smoothing function for the yields of the individual fertilizer stages using the autoregressive integrated moving average (ARIMA) method. Autoregression shows which earlier values were applied to predict the current values:
In this formula the value y at time t can be calculated using the time series (yt−1, yt−2, yt−p) itself and the content from the actual variable. The parameter q ≥ 0 indicates the number of values of the residuals in the past affecting the time series. Additional terms are α and β.
This procedure is needed to remove any development trends in the time series. This smoothing filters out the effects of new varieties, herbicides, insecticides, fertilizers, technical equipment, crop rotation, tillage, and climate change. According to Sterzel (2007), all quantifiable factors can, thus, be systematically removed from the yield. Weather effects remain implicitly embedded in detrended crop yield values.
Table 4 provides an overview of quantifiable and non-quantifiable factors. Subsequently, we formed residuals of the respective annual yields (Y) as follows:
where Yresidual is the dependent input data for the regressions.
2.5. Statistical Procedures
For both calculation procedures and also for every fertilization level stepwise regressions were used. The theoretical model of regression is:
where (yi) is the dependent variable (yields, residuals); xi, …, xn are the climatic variables; b0, …., bn are empirical regression model coefficients; and ej is the error component of the model.
The climate variables from the specific year have been related to the yield of the same cultivation year.
Four primary assumptions must be met for multiple regression models. These assumptions were tested using the following procedures:
- Durbin–Watson test
- Plotting of the residuals against predicted values
- Visual inspection of normally distributed residuals
- Tolerance and variance inflation factor (VIF)
In the last step, the calculated values were tested against the measured values with the root-mean-square difference (RMSD):
where N represents the number of years, zsi is the observed value, and z*si is the predicted value.
3. Results
When evaluating the yield level, the fact that this experiment was performed in one of the more fertile regions in Germany was considered. According to the German soil evaluation system [40], soil numbers and tillage numbers ranged from 67 to 73 and 59 to 69, respectively.
3.1. Temporal Course of the Yields
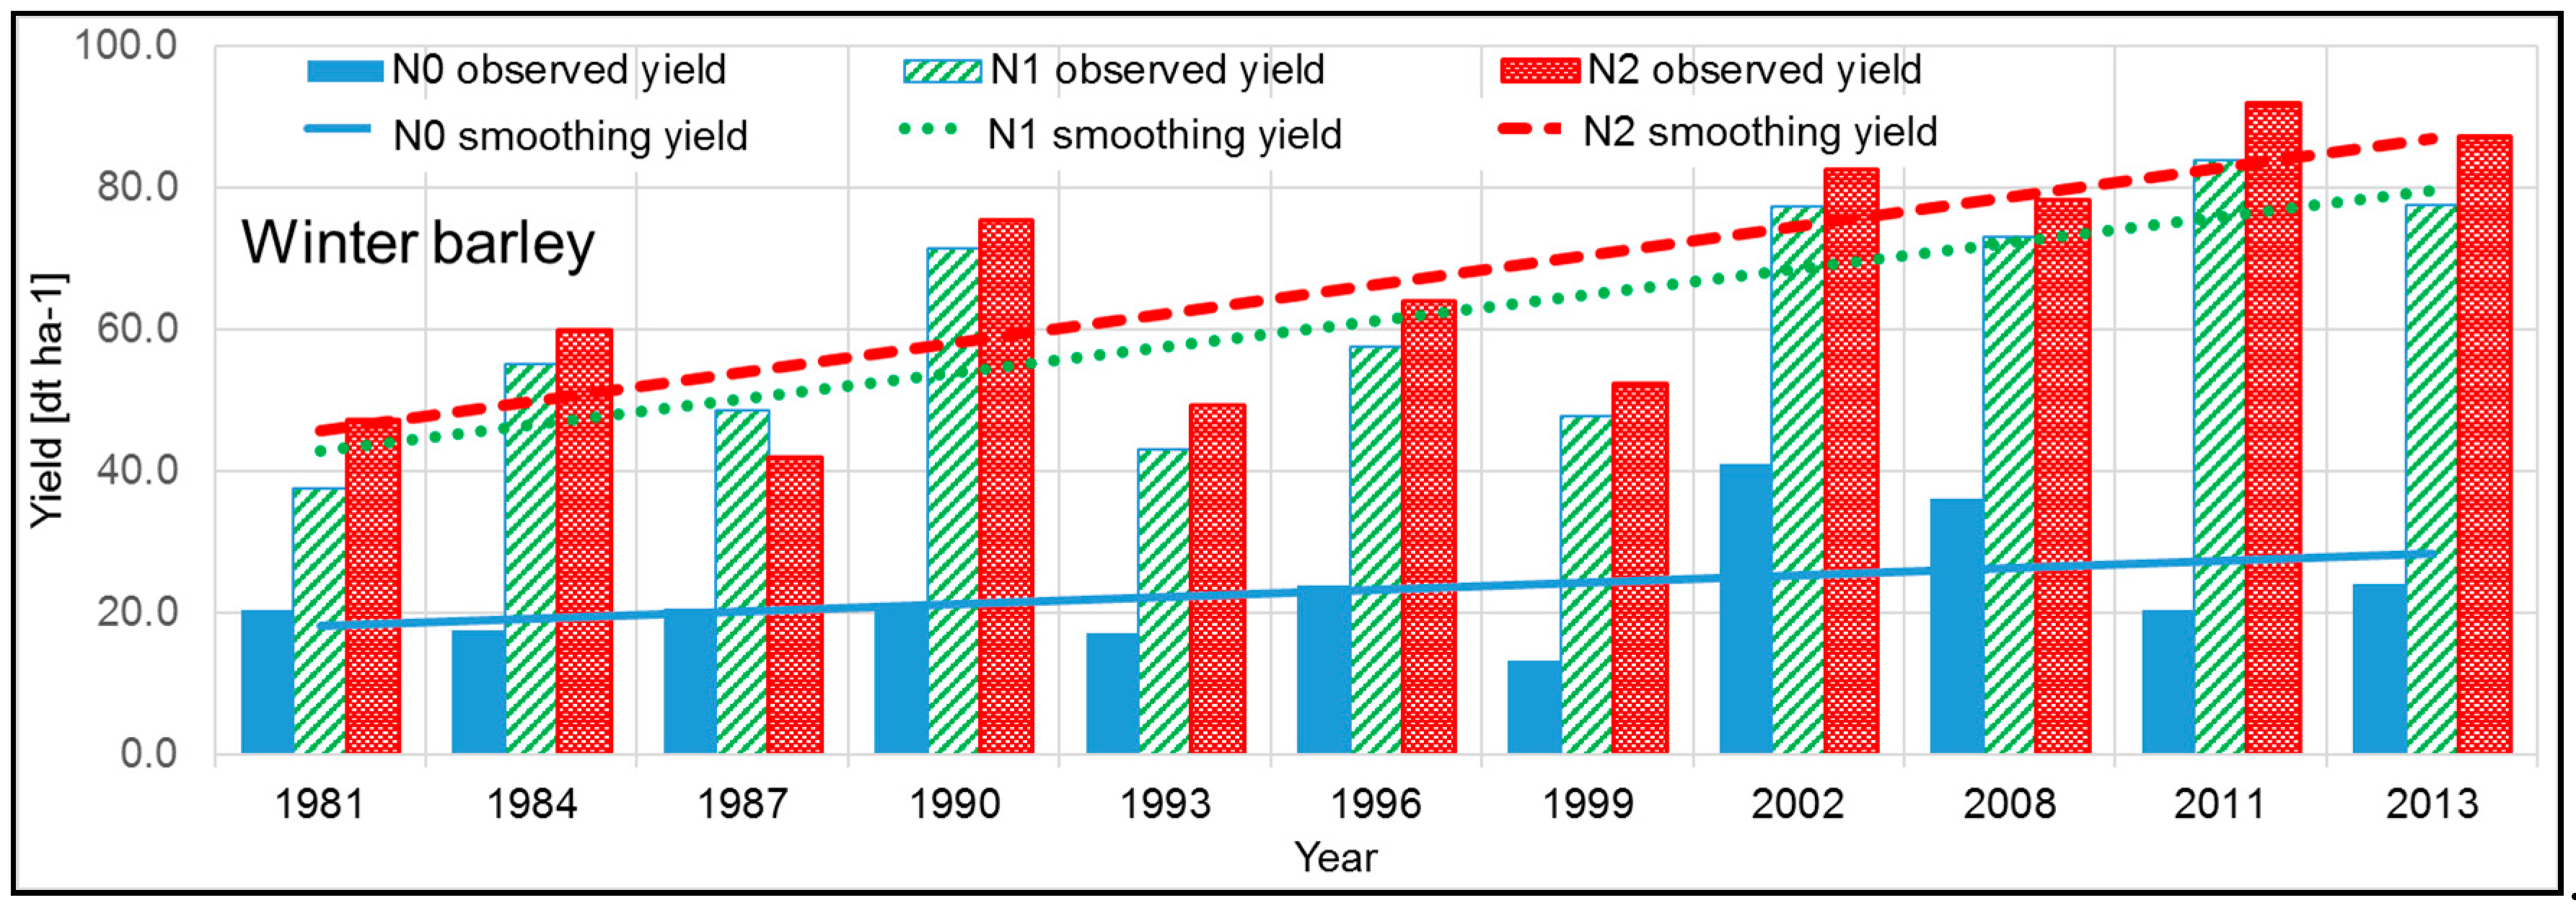
From 1981 to 2013, fertilizer treatments caused nearly a doubling of yields from 37.6 to 77.5 dt ha−1 for moderately fertilized and 47.3 to 87.3 dt ha−1 for highly fertilized plots. A higher level of N fertilization produced about 10% higher yields from 1990 compared to moderately fertilized plots, which was statistically not significant. The mean yield from unfertilized plots was about 23 dt ha–1, which remainined nearly constant during the study period and was approximately a quarter to a half of the yield after fertilizer treatments.
The smoothing lines in Figure 2 indicate an increasing trend in the yields. While the yield rates of the N0 plots were low, the fertilized variants (N1 and N2) showed nearly a double yield.
The lack of fertilization exerted a more significant effect on the yields than progress in breeding and advancements in biological, chemical, mechanical, and management practices on control plots. Ahrens et al. (2018) attributed about one-third of the observed yield increase in wheat to the progress in breeding.
3.2. Derivation of Yields with Monthly Predictors
Regressions with monthly independent variables, for fertilization levels, expressed as residuals and unchanged values are indicated in Table 5 and Figure 3 and Figure 4.
Temperature and precipitation were significant in all calculations in all variants, but to a lesser degree when considered as sums or mean values; however, they were significant in the form of special indices (Table 5).
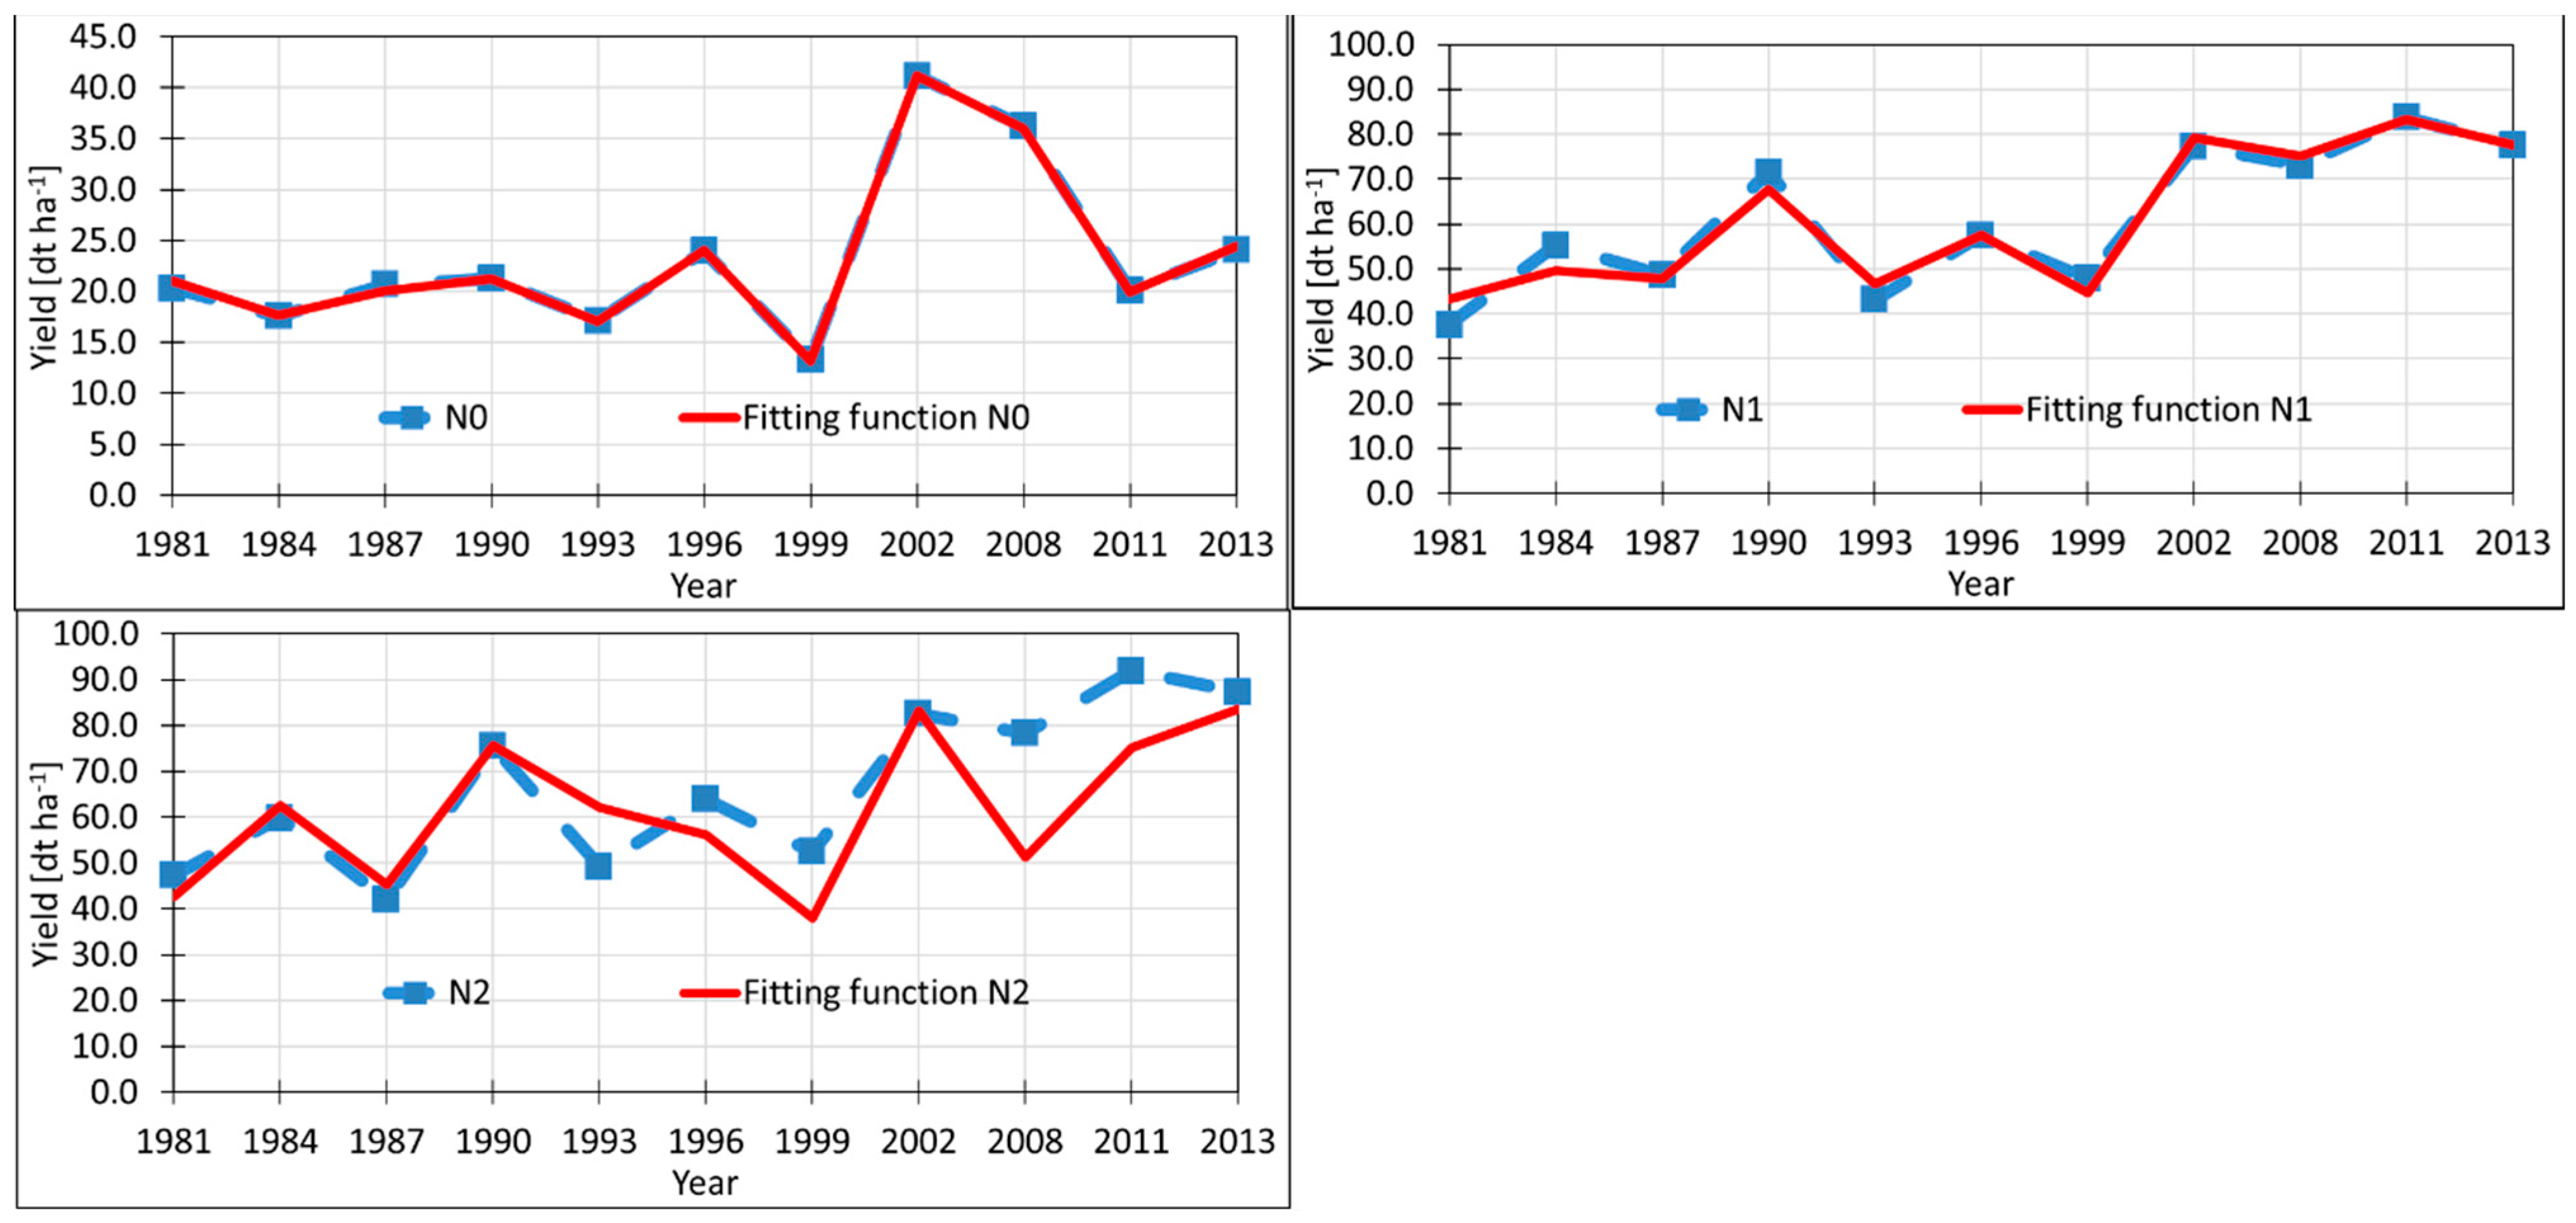
Comparing the measured yield values with the regression model results for the unfertilized variant (Figure 3 and Figure 4) showed an almost identical course of the values (R2: 0.99; RMSE: 0.32 dt ha−1). The number of days with a temperature of >10 °C and global radiation in February, as well as days with precipitation between 1 and 10 mm in October, the number of frost-alternating days in November, and the days in December with precipitation of >10 mm, were included as independent variables with a significant effect on the yield. Similar results were calculated with residual values (R2: 0.98; RMSE: 0.8 dt ha−1). After standardized β-coefficients, the first two parameters dominated the regressions with a positive effect. An increasing number of days with a temperature of >10 °C in combination with increasing global radiation, or increasing day length, had a positive effect on the yields. Wet conditions in October and a higher number of frost-alternating days in November negatively affected growth and, therefore, yields. The amount of precipitation in December (evaluation method: yield) and July was of relatively low importance.
At the moderate fertilizer level, the calculated models also delivered good approximations to the observed yield figures. The regression from the independent variables (total precipitation in December, temperature threshold 1 in February, days with precipitation of >10 mm in May, and mean air temperature in November) explained 92.9% of the variation in the barley yield. For the residuals, the function with the climate indices used explained 96.8% of the variation in the yield due to weather. The residual function indicated the frost-alternating days in November, the mean temperature in March, and the precipitation level in March and May as significant parameters. After standardized β-coefficients, the first two listed parameters had a positive effect on the yield. The regression of the residuals indicated the number of frost-alternating days in November as the most important parameter.
A closer look at the individual precipitation parameters revealed a rather mixed picture. The amount of precipitation in December and the high level of precipitation in May positively affected the yield. In contrast, precipitation parameters in the residual calculation indicated a negative effect but with a low degree of effect evaluated after standardized β-coefficients, probably because the negative residuals produced this negative contribution.
The yields from the highly fertilized plots had only two predictors, the total precipitation in December and rainy days with more than 10 mm of precipitation in March, with an R2 of 0.71 and an RMSE of 11.6 dt ha−1. As explanatory factors of the variation in the residuals, the independent variables (total precipitation in November, days with precipitation of >10 mm in February, and number of frost-alternating days in December) were observed. In the yield regression, both parameters had a positive effect, with December rainfall having a dominant effect. These calculations showed that abundant rainfall in March (yield) and February (residuals) has an increasing contribution. In contrast, the amount of precipitation in November and the frost-alternating days in January had a negative effect on the residuals.
In summary, the quality of the derivations for unfertilized (N0) and moderately fertilized (N1) plots was excellent. In contrast, the divergence between observation and regression of the yields of variant N2 (highly fertilized plot) was distinctly more considerable, especially from 2008 to 2011. The selection of only two significant influencing parameters was the main statistical reason.
The gradation accuracy is reflected in the R2 and RMSE calculations. Rising yields were usually associated with a decreasing R2 and an increasing RMSE.
The dominating predictors were the amount of precipitation and the precipitation intensity, followed by the temperature threshold and the number of frost-alternating days. The following conclusions could be drawn:
- (i)
- On the unfertilized and highly fertilized plots, important indices for predictions were mainly related to winter and a lower contribution was observed for autumn-related parameters. The summer parameter PI_2_Jul (unfertilized residuals) contributed only a little. These findings also somewhat applied to moderately fertilized plots.
- (ii)
- Positive and negative standardized β-coefficients occurred in the predictions. Here, no systematic effect could be discerned.
- (iii)
- However, summer precipitation usually played a little (residual control, yield, and residual moderate fertilization) or no role (yield control, yield, and residual high fertilization) in the calculations.
- (iv)
- Regarding the months from which indices were selected, the time spans from October to February were calculated as the most important periods for future growth and, ultimately, the yield. This finding is valid for all indices and all fertilization levels. May and July were also identified as important for plant growth. However, July only occurred in one regression (residual unfertilized) and that too with a low standardized β-coefficient.
- (v)
- The role of temperature was evidenced by the parameters temperature threshold and frost-alternating days and, to a less extent, by average temperature (Tm). While the temperature threshold was significant in February, frost-alternating days occurred mainly in November and December. In addition, while the temperature threshold always indicated a positive effect, the effect influencing direction of FAD was unclear.
4. Discussion
Overall, the significance of precipitation indices is unclear. We must assume a complex interplay of positive and negative contributions to yield development. Three areas of influence act together and partly in opposite directions in yield development:
- (i)
- The low importance of the indices that include summer precipitation was most likely due to favorable soil conditions. Table 2 indicates the main factors that determine the available field water capacity, which is about 241 mm down to a 100 cm soil depth (according to [41]; this is classified as high) and 325 mm down to a 140 cm soil depth. If the field water capacity is reached, barley can grow nearly without additional rain. Therefore, precipitation parameters do not play a direct role in the regressions. This finding is also valid for highly fertilized plots, although indices with precipitation parameters occur more frequently than in the other two variants (N0 and N1).
- (ii)
- However, high water storage can negatively affect the growth of roots. Silty soils quickly form hydromorphic features. This waterlogging negatively affects plants at all stages of growth. In the tillering phase, waterlogging can damage roots. In addition, as the oxygen content decreases, so does the redox potential, changing the nutrient availability. Nitrate, sulfate, manganese, and iron oxides serve as electron acceptors [6]. Plants can thus sometimes absorb higher nutrient concentrations, which has adverse effects [33].
- (iii)
- Excessive precipitation, expressed as the PI index during growth, can also have negative effects. Water can no longer flow off and accumulates. This stagnant moisture causes abiotic stress in plants (premature ripening of barley in grain filling and flowering). Grain filling is shortened, reducing the yield due to a lower grain weight [10].
- (iv)
- The importance of the period from sowing to March becomes apparent when considering the plant development of winter barley. Stand development begins with sowing, and shooting begins in March. During this period, yield-bearing shoots/tillers and main roots are formed. The yield components (number of ears and grains per m2) are fixed at the end of this phase. The growth rate depends on environmental conditions and reduces on dull, cold days [6].
- (v)
- Summer indices were relatively rare. One reason could be the reduction in the growing period during the study period (1984: 306 days; 1987: 323 days; 2011: 294 days; and 2013: 285 days). Whether this is a consequence of increasingly shorter winters and longer springs is not clear.
As the soil temperature decreases, the rate of stand establishment changes. Seeding in October shows optimal stand establishment, with already 50% field emergence after 15 to 20 days. It is crucial to achieve a good stand of 300 to 350 plants/m2 in spring, as barley has a limited ability to compensate for a thin stand with high grain numbers in the ears [6]. Therefore, we assume that these conditions caused the alternating meaning of the precipitation-related parameters.
In a previous evaluation, the effect of climatic conditions on wheat yields was investigated for the same field experiment [6]. In the temperature and precipitation data, summarized for individual months, the precipitation-free days in June and the temperature threshold in April, February, and December proved to be significant. Precipitation-free days were those with 0–1 mm precipitation, where October to August were considered. The temperature threshold sums up days when the temperature exceeds 10 °C, also in October to August. We found a different sensitivity to drought between the different fertilizer levels. Plants at the higher fertilizer level were more sensitive to drought and less sensitive to the temperature threshold, indicating that reduced fertilization affects a plant’s sensitivity to drought.
The regressions of winter barley and winter wheat indicated a sequence of similarities and differences:
- (i)
- Winter indicators occurred in both evaluations. This was especially evident for winter barley. For winter wheat, winter indicators were observed on unfertilized variants and, to a lesser extent, in the calculations of fertilized variants.
- (ii)
- Precipitation did not play a direct role in winter wheat calculations. For both fertilized variants, however, the variable precipitation-free days in June were significant. The contribution to regression accuracy showed that the importance of precipitation-free days in June increases with increasing fertilizer application, probably due to the higher water consumption by wheat.
- (iii)
- Winter barley has a greater tolerance to drought than winter wheat. This finding is consistent with cultivation recommendations for winter barley. Due to its strong development in autumn and early maturity, winter barley tolerates early season and pre-summer drought well, with relatively good yield security in dry years and locations [6].
5. Conclusions
This study detected the effects of monthly climate indices on the long-term yield of winter barley in one of the more fertile areas in Germany, at three different nitrogen fertilization levels.
The high contribution of climate indices from sowing to March was noteworthy.
First, stand establishment before winter significantly determines yield. Good winter barley needs one main shoot for optimum yield and at least two to three strong secondary tillers. The winter short-day conditions are crucial for plant development, as the duration of growth under these conditions determines the number of leaves and tillers established. In the case of a late frost, the ears do not fully form [42,43].
Positive winter indices occurred in the form of temperature thresholds in November and February, indicating that there already were positive reactions to rising temperatures in these months.
With regard to the significance of precipitation, both the precipitation amount and the precipitation intensity are significant. The frequently occurring negative contributions indicate that excessive soil water content reduces yield.
Clearly, the listed indices cannot consider all possible effects of meteorological variables, especially the short-term effects that may be essential for plant development.
Nevertheless, this study provided an additional view of the effect of climate. The importance of the growing periods until spring is not the farmers’ main focus but most often of modeling work.
In the cultivation years with winter wheat grown on the same plots, highly fertilized crops were more sensitive to drought and less to the temperature threshold. This gradation was not observed for winter barley, and the effect of less precipitation due to the shorter growing season may help avoid this phenomenon.
The role of precipitation and the effect of water content on plant growth and development can only be assessed by measuring the soil water content over the years. The findings can be used to make decisions about things like fertilization and irrigation. The combination of developmental stages and climate indices can provide information about the fertilization level. In the case of frost-alternating days in March and April, it is recommended that N fertilization be reduced.
These findings are valid for this site with regional soil and climatic conditions and require further research in order to be extrapolated.
Author Contributions
Writing—original draft preparation, writing—review and editing, and visualization, K.H.; partly master thesis, S.G. (student); project administration, supervision, and editing, U.S. All authors have read and agreed to the published version of the manuscript.
Funding
This research was funded by the BMBF Project Bonares Nr. 031A564E.
Conflicts of Interest
The authors declare no conflict of interest.
References
- Hatfield, J.L.; Boote, K.J.; Fay, P.; Hahn, L.; Izaurralde, R.C.; Kimball, B.A.; Mader, T.; Morgan, J.; Ort, D.; Polley, W.; et al. Agriculture. In The Effects of Climate Change on Agriculture, Land Resources, Water Resources, and Biodiversity in the United States; Backlund, P., Janetos, A., Schimel, D., Eds.; U.S. Climate Change Science Program and the Subcommittee on Global Change Research: Washington, DC, USA, 2008; p. 362. Available online: https://www.fs.fed.us/rm/pubs_other/rmrs_2008_backlund_p003.pdf (accessed on 1 November 2020).
- Gammans, M.; Mérel, P.; Ortiz-Bobea, A. Negative Impacts of Climate Change on Cereal Yields: Statistical Evidence from France. Environ. Res. Lett. 2017, 12, 5. [Google Scholar] [CrossRef]
- Hatfield, J.L.; Prueger, J.H. Agroecology. Implications for plant response to climate change. In Crop Adaptation to Climate Change; Yadav, S.S., Redden, R.J., Hatfield, J.L., Lotze-Campen, H., Hall, A.E., Eds.; Wiley-Blackwell: West Sussex, UK, 2001; pp. 27–43. [Google Scholar]
- Wittwer, S. Food, Climate, and Carbon Dioxide: The Global Environment and World Food Production; CRC Press: Boca Raton, FL, USA, 1995; p. 236. ISBN 0-87371-796-1. [Google Scholar]
- Leitlinie zur effizienten und umweltfreundlichen Erzeugung von Wintergerste; Thüringer Landesanstalt für Landwirtschaft: Jena, Germany, 2015; Volume 8, p. 22.
- Heil, K.; Lehner, A.; Schmidhalter, U. Influence of Climate Conditions on the Temporal Development of Wheat Yields in a Long-Term Experiment in an Area with Pleistocene Loess. Climate 2020, 8, 100. [Google Scholar] [CrossRef]
- Dendl, M. Ertragsschwankungen von Weizen und Gerste und deren Ursachen in ausgewählten Bundesländern Deutschlands. Diploma Thesis, Technische Universität München, Lehrstuhl für Pflanzenernährung, Freising, Germany, 2008; p. 50. [Google Scholar]
- Olszynski, A. Der Einfluss von Niederschlag und Temperatur auf die Ertragsentwicklung von Weizen, Gerste und Mais in ausgewählten Landkreisen Bayerns unter besonderer Berücksichtigung der Entwicklungsstadien. Bachelor’s Thesis, Technische Universität München, Lehrstuhl für Pflanzenernährung, Freising, Germay, 2013; p. 85. [Google Scholar]
- Barlow, K.M.; Christy, B.P.; O’Leary, G.J.; Riffkin, P.A.; Nuttall, J.G. Simulating the impact of extreme and frost events on wheat crop production: A review. Field Crop. Res. 2015, 171, 109–119. [Google Scholar] [CrossRef] [Green Version]
- Felbermeir, T.; Schweizer, G.; Diethelm, M.; Halawach, B.; Reichenberger, G.; Herz, M.; Hess, M.; Bayer; Landesanstalt für Landwirtschaft (Eds.) Klimaänderung in Bayern. Antworten des Pflanzenbaus. Unter Mitarbeit von LfL—Jahrestagung 9. Kulturlandschaftstag; Freising-Weihenstephan, 19.10; Institut für Agrarökologie, Ökologischen Landbau und Bodenschutz: Wolnzach, Germany, 2011. [Google Scholar]
- Herz, M. Lösungsansätze zur züchterischen Anpassung der Gerste an den Klimawandel. DLG-/GFP-Symposium: Züchtung für extreme Umwelten-Forschung gestaltet Zukunft. Gesellschaft für Pflanzenzüchtung (EDS.), Unter Mitarbeit von Eulenstein, Werner, Wenkel, Herz, Asch, Weidner et al. Bonn, Oktober; Gustav-Stresemann-Institut, Gesellschaft für Pflanzenzüchtung (Vorträge für Pflanzenzüchtung): Quedlinburg, Germany, 2009; p. 171. [Google Scholar]
- Asch, F.; Weidner, A. Klimawandel und Pflanzenzüchtung: Eine transdisziplinäre Herausforderung. DLG-/GFP-Symposium: Züchtung für extreme Umwelten-Forschung gestaltet Zukunft. Gesellschaft für Pflanzenzüchtung (EDS.), Unter Mitarbeit von Eulenstein, Werner, Wenkel, Herz, Asch, Weidner et al. Bonn, Oktober; Gustav-Stresemann-Institut, Gesellschaft für Pflanzenzüchtung (Vorträge für Pflanzenzüchtung): Quedlinburg, Germany, 2009; p. 151. [Google Scholar]
- Templer, S.E.; Ammon, A.; Pscheidt, O.; Ciobotea, C.S.; McCollum, C.; Sonnewald, U.; Förster, J.; Ordon, F.; von Kroff, M.; Voll, L.M. Metabolite profiling of barley flag leaves under drought and combined heat and drought stress reveals metabolic QTLs for metabolites associated with antioxidant defense. J. Exp. Bot. 2017, 68, 1697–1713. [Google Scholar] [CrossRef] [Green Version]
- Lang, J. Der Einfluss von Klimafaktoren auf Wachstums-und Entwicklungsverlauf sowie Ertrags-und Qualitätsleistung der Braugerste, dargestellt anhand spezifischer internationaler Anbauversuche; Barley Committee, European Brewery Convention: Weihenstephan, Germany, 1966; p. 205. [Google Scholar]
- Hakala, K.; Jauhiainen, L.; Himanen, S.J.; Rötter, R.; Salo, T.; Kahiluoto, H. Sensitivity of barley varieties to weather in Finland. J. Agric. Sci. 2012, 150, 145–160. [Google Scholar] [CrossRef] [PubMed] [Green Version]
- Dijkman, T.J.; Birkved, M.; Saxe, H.; Wenzel, H.; Hauschild, M.Z. Environmental impacts of barley cultivation under current and future climatic conditions. J. Clean. Prod. 2017, 140, 644–653. [Google Scholar] [CrossRef] [Green Version]
- Brassard, J.P.; Singh, B. Effects of climate change and CO2 increase on potential agricultural production in Southern Québec, Canada. Clim. Res. 2007, 34, 105–117. [Google Scholar] [CrossRef] [Green Version]
- Clausen, S.K.; Frenck, G.; Linden, L.G.; Mikkelsen, T.N.; Lunde, C.; Jørgensen, R.B. Effects of single and multifactor treatments with elevated temperature, CO2 and ozone on oilseed rape and barley. J. Agron Crop Sci. 2011, 197, 442–453. [Google Scholar] [CrossRef]
- Børgesen, C.D.; Olesen, J.E. A probabilistic assessment of climate change impacts on yield and nitrogen leaching from winter wheat in Denmark. Nat. Hazards Earth Syst. Sci. 2011, 11, 2541–2553. [Google Scholar] [CrossRef] [Green Version]
- Cook, J.; Nuccitelli, D.; Green, S.A.; Richardson, M.; Winkler, B.; Painting, R.; Way, R.; Jacobs, P.; Skuce, A. Quantifying the consensus on anthropogenic global warming in the scientific literature. Environ. Res. Lett. 2013, 8, 024024. [Google Scholar] [CrossRef] [Green Version]
- Jeppesen, E.; Kronvang, B.; Olesen, J.E.; Audet, J.; Søndergaard, M.; Hoffmann, C.C.; Andersen, H.E.; Lauridsen, T.L.; Liboriussen, L.; Larsen, S.E. Climate Change Effect on Nitrogen Loading from Cultivated Catchments in Europe: Implications for Nitrogen Retention, Ecological Stat of Lakes and Adaptation. Hydrobiologia 2011, 663, 1–21. [Google Scholar] [CrossRef]
- Gregory, P.J.; Johnson, S.N.; Newton, A.C.; Ingram, J.S.I. Integrating pests and pathogens into the climate change/food security debate. J. Exp. Bot. 2009, 60, 2827–2838. [Google Scholar] [CrossRef]
- Hooker, R.H. The weather and the crops in eastern England, 1885–1921. Q. J. R. Meteorol. Soc. 1922, 48, 115–138. [Google Scholar] [CrossRef]
- Baumann, H.; Weber, E. Attempt of a statistical analysis of the relation between weather and yield by multiple regression. Notes Ger. Natl. Meteorol. Serv. 1966, 37, 37–41. [Google Scholar]
- Swanson, E.R.; Nyankori, J. Influence of weather and technology on corn and soy-bean yield trends. Agric. Meteorol. 1979, 20, 327–342. [Google Scholar] [CrossRef]
- Chmielewski, F.-M.; Potts, J.M. The relationship between crop yields from an experiment in southern England and long-term climate variations. Agric. For. Meteorol. 1995, 73, 43–66. [Google Scholar] [CrossRef]
- Alexandrov, V.A.; Hoogenboom, G. Climate variation and crop production in Georgia, USA, during the twentieth century. Clim. Res. 2001, 17, 33–43. [Google Scholar] [CrossRef] [Green Version]
- Soja, A.-M.; Soja, G. Dokumentation von Auswirkungen extremer Wetterereignisse auf die Landwirtschaftliche Produktion. In Startprojekt Klimaschutz: StartClim.3b—Erste Analysen Extremer Wetterereignisse und ihrer Auswirkungen in Österreich; ARC Seibersdorf Research: Seibersdorf, Austria, 2019; p. 106. Available online: http://141.244.189.116/fileadmin/user_upload/StartClim2003_reports/StCl03b.pdf (accessed on 8 December 2019).
- Bernhofer, C.; Hänsl, S.; Schaller, A.; Pluntke, T. Charakterisierung von Meteorologischer Trockenheit; Landesamt, F.U., Landwirtschaft, U.G., Eds.; Sächsisches Landesamt für Umwelt, Landwirtschaft und Geologie Dresden, Schriftenreihe: Schriftenreihe, Germany, 2015. [Google Scholar]
- Beitz, R. Witterung und Klima. 2020. Available online: http://www.forstliche-umweltkontrolle-bb.de/r3_klima.php (accessed on 1 January 2020).
- Schweizer, G.; Diethelm, M.; Halaweh, B.; Reichenberger, G.; Herz, M. Bayerische Landesanstalt für Landwirtschaft. Klimatoleranz bei Gerste—ein biotechnologischer Ansatz zur Ertragssicherung. In Klimaänderung in Bayern Antworten des Pflanzenbaus; LfL – Jahrestagung, 9. Kulturlandschaftstag: Freising, Germany, 2011; p. 17. [Google Scholar]
- Lüttger, A.B.; Feike, T. Development of heat and drought related extreme weather events and their effect on winter wheat yields in Germany. Theor. Appl. Clim. 2018, 132, 15–29. [Google Scholar] [CrossRef]
- Wollmer, A.-C.; Pitmann, K.; Mühling, K.-H. Einfluss von temporärer Überstauung auf Wachstum, Nährstoffkonzentration und Ertrag von Weizen. In Thomas Ebertseder (Hg.): Kongressband 2016 Rostock. Vorträge zum Generalthema: Anforderungen an die Verwertung von Reststoffen in der Landwirtschaft. Darmstadt; VDLUFA-Verlag VDLUFA-Schriftenreihe: Darmstadt, Germany, 2016; Volume 73, pp. 138–142. [Google Scholar]
- Kristensen, K.; Schelde, K.; Olesen, J.E. Winter wheat yield response to climate variability in Denmark. J. Agric. Sci. 2011, 149, 33–47. [Google Scholar] [CrossRef]
- Peltonen-Sainio, P.; Jauhiainen, L.; Trnka, M.; Olesen, J.E.; Calanca, P.; Eckersten, H.; Eitzinger, J.; Gobin, A.; Kersebaum, K.C.; Kozyrai, J.; et al. Coincidence of variation in yield and climate in Europe. Agric. Ecosyst. Environ. 2010, 139, 483–489. [Google Scholar] [CrossRef]
- Lobell, D.B.; Ortiz-Monasterio, J.I.; Anser, P.; Matson, P.A.; Naylor, R.L.; Falcon, W.P. Analysis of wheat yield and climatic trends in Mexico. Field Crop. Res. 2007, 94, 250–256. [Google Scholar] [CrossRef]
- Arbeitsgruppe, B. Bodenkundliche Kartieranleitung. 5. Verbesserte und erweiterte Auflage (Herausgegeben von der Bundesanstalt für Geowissenschaften und Rohstoffe in Zusammenarbeit mit den Staatlichen Geologischen Diensten der Bundesrepublik Deutschland; Schweizerbart’sche Verlagsbuchhandlung: Hannover, Germany, 2005. [Google Scholar]
- Heil, K.; Schmidhalter, U. Improved evaluation of field experiments by accounting for inherent soil variability. Eur. J. Agron. 2017, 89, 1–15. [Google Scholar] [CrossRef]
- Sterzel, T. Correlation analysis of climate variables and wheat yield data on various aggregation levels in Germany and the EU-15 using GIS and statistical methods, with a focus on wave years. In PIK Report; Potsdam Institut für Klimafolgenforschung: Potsdam, Germany, 2007; p. 108. [Google Scholar]
- IBM. SPSS Forecasting 20; IBM Corporation: Hannover, Germany, 2011. [Google Scholar]
- Bayer. Landes amt für Umwelt, Umweltatlas Boden. Available online: https://www.umweltatlas.bayern.de/mapapps/resources/apps/lfu_boden_ftz/index.html?lang=de (accessed on 7 May 2021).
- Ahrends, H.E.; Eugster, W.; Gaiser, T.; Rueda-Ayala, V.; Hüging, H.; Ewert, F.; Siebert, S. Genetic Yield Gains of Winter Wheat in GERMANY over more than 100 Years (1895–2007) under Contrasting Fertilizer Applications. Environ. Res. Lett 2018, 13, 104003. [Google Scholar] [CrossRef]
- Siebert, S. Ursachen der Ertragssteigerungen bei Weizen im letzten Jahrhundert—neuer Versuch auf dem Reinshof angelegt. Hg. v. Georg-August-Universität Göttingen. Fakultät für Agrarwissenschaften. Göttingen. 2018. Available online: https://agrardebatten.blog/2018/12/11/ursachen-der-ertragssteigerungen-bei-weizen-im-letzten-jahrhundert-neuer-versuch-auf-dem-reinshof-angelegt/ (accessed on 14 May 2019).
Figure 1.
Location of experimental plots (4 × 8 m2) fertilized with calcium ammonium nitrate across the long-term field experiment (N0 without fertilization, N1 moderately fertilized, N2 highly fertilized).
Figure 1.
Location of experimental plots (4 × 8 m2) fertilized with calcium ammonium nitrate across the long-term field experiment (N0 without fertilization, N1 moderately fertilized, N2 highly fertilized).

Figure 2.
Annual yields of winter barley between 1981 and 2013, with smoothing lines for control and fertilized (unfertilized plots (N0), moderately fertilized plots (N1), and highly fertilized plots (N2)).
Figure 2.
Annual yields of winter barley between 1981 and 2013, with smoothing lines for control and fertilized (unfertilized plots (N0), moderately fertilized plots (N1), and highly fertilized plots (N2)).

Figure 3.
Measured and calculated residuals, with monthly independent variables for different fertilization levels (unfertilized plots (N0), moderately fertilized plots (N1), and highly fertilized plots (N2)).
Figure 3.
Measured and calculated residuals, with monthly independent variables for different fertilization levels (unfertilized plots (N0), moderately fertilized plots (N1), and highly fertilized plots (N2)).

Figure 4.
Measured and calculated yields, with monthly independent variables for different fertilization levels (unfertilized plots (N0), moderately fertilized plots (N1), and highly fertilized plots (N2)).
Figure 4.
Measured and calculated yields, with monthly independent variables for different fertilization levels (unfertilized plots (N0), moderately fertilized plots (N1), and highly fertilized plots (N2)).


Table 1.
Literature overview of various studies investigating the effect of climate on barley, wheat, and maize grain yields.
Table 1.
Literature overview of various studies investigating the effect of climate on barley, wheat, and maize grain yields.
| Author | Year | Location | Crop | Factors and Effects |
|---|---|---|---|---|
| [9] | 2011 | Germany | Wheat | Positive effects of increasing CO2 concentrations on C-3 plants through fertilization and improvement of water use efficiency and shortening of developmental stages due to temperature increases |
| [31] | 2011 | Germany | Barley | Analysis of genome activity of winter barley under UV and/or drought stress |
| [8] | 2013 | Germany | Wheat, barley, maize | Precipitation and average temperature totals as decisive factors in yield formation due to a significant negative effect on the yield-relevant developmental stages of ear emergence, double-ring formation, and first-node formation in wheat and barley |
| [7] | 2008 | Germany | Wheat, barley | May and June as the most influential periods affecting yield variation in winter barley, with negative effects of high temperatures and precipitation during this period on yield |
| [11] | 2009 | Germany | Barley | Negative effect on barley yield due to redistribution of precipitation, increased temperature and radiation, and diseases favored by these factors |
| [12] | 2009 | Germany | Barley wheat | Yield variation due to variation in the water balance |
| [13] | 2009 | Germany | Barley | Much stronger attenuation of leaf carbon metabolism in drought-adapted genotypes than in elite lines during drought stress adaptation |
| [32] | 2018 | Germany | Wheat | Development of heat/drought and effects on wheat yield; heat stress above 25 °C during flowering period |
| [33] | 2016 | Germany | Wheat | Temporary waterlogging as a negative factor affecting growth, nutrient concentration, and yield of wheat |
| [34] | 2011 | Denmark | Wheat | Summer temperature showed the strongest effect causing lower yields with increasing temperature, whereas yield increased with increasing radiation during summer and spring. |
| [35] | 2011 | Europe | Wheat, barley, maize | Harmful effects of high precipitation during grain-filling in grain and seed crops and at flowering in oilseed rape were recorded. |
| [36] | 2005 | Mexico | Wheat | Particular cooling of growingseason nighttime temperatures causing a 25% increase in wheat yield over the past 20 years |
| [6] | 2020 | Germany | Wheat | At more fertile sites, yield is significantly determined by climatic conditions in winter and the transition periods from winter to the warmer season and vice versa and less affected by the climatic conditions during the main growing season. |
| Site | Mean temperature | 7.6°C | Weather station DWD Weihenstephan-Dürnast 1961–1990 | |
| Precipitation | 788 mm | |||
| Elevation (min, max), latitude, longitude | 470 (469–472), 48,402,499, 11,694,555 | |||
| Inclination level (min, max) [38] | N2 (weakly inclined) 0.05 rad (0.05–0.09) | |||
| Type of topography [38] | Underhanging foot, concavely elongated | |||
| Aspect (min, max) | 2.64 rad (1.97–3.46) | |||
| Soil | German soil evaluation (soil number/arable land number) | L3D 70/69 | ||
| Soil (sub)type [38] | Dystric eutrochrept and fine-loam typical udifluvent | |||
| Type of substrate (subtype) [38] | p-Lu-(x)(Lol)\p-Tu4-(Lol)/p-Ut4-(Lol)/p-Tu3-(Lol) | |||
| Texture fine soil [38] | Lu | |||
| Soil vertical layer | 0–25 cm | 25–50 cm | 50–75 cm | |
| Clay (kg kg−1) (min, max) | 20.8 (15.7–27.3) | 23.3 (15.2–34.9) | 26.2 (13.6–34.8) | |
| Silt (kg kg−1) (min, max) | 61.5 (54.4–67.5) | 61.7 (35.7–72.9) | 60.7 (32.8–76.8) | |
| Sand (kg kg−1) (min, max) | 16.6 (11.9–21.3) | 14.4 (8.5–40.5) | 12.4 (5.3–46.8) | |
| Skeleton (kg kg−1) (min, max) | 1.2 (0.0–3.0) | 0.6 (0.0–7.0) | 0.4 (0.0–3.0) | |
| pH (min, max) | 6.44 (5.94–6.84) | 6.36 (5.96–7.12) | 6.31 (5.98–7.18) | |
| C content (%) (min, max) | 1.18 (0.94–1.38) | 0.56 (0.35–1.14) | 0.4 (0.22–1.11) | |
| N content (%) (min, max) | 0.1 (0.08–0.12) | 0.06 (0.03–0.12) | 0.04 (0.02–0.12) | |
Table 3.
Overview of the climate variables used in this study.
| Variable | Definition/Time Range | Formula for the Derivation of Indices | |
|---|---|---|---|
| Precipitation-related indices | Precipitation intensity (PI) | Sum of days on which a certain amount of precipitation occurs | |
| PI1: 0–1 mm per day | |||
| PI2: 1–10 mm per day | |||
| PI3: ≥10 mm per day | , | ||
| Monthly values from October to July | where P is precipitation (mm) and n denotes the number of days | ||
| Precipitation sum (Pm) | Sum of precipitation (calculated for October to July) | where Pd is precipitation per day | |
| Rain factor (RF) | Relationship of precipitation/temperature per year (calculated for every year) | , where Py is the annual precipitation and Ty is the average annual temperature | |
| Rain-free days (P0) | Sum of days without precipitation (P0); monthly values from October to July | where N is the height of precipitation | |
| Temperature-related indices | Temperature threshold (TT) | Sum of the days on which the threshold values of 5 or 10 °C are exceeded; monthly values from October to July | where Tmax is the daily maximum temperature (°C) |
| Summer days (SD) | Sum of the days on which the air temperature exceeds 25 °C; monthly values from October to July | ||
| Heat days (HD) | Sum of the days on which the air temperature exceeds 30 °C; monthly values from October to July | ||
| Frost days (FT) | Sum of the days on which the air temperature falls below 0 °C; monthly values from October to July | , where Tmin is the daily minimum temperature (°C) | |
| Average temperature (Tm) per month | , where Tempd is the diurnal mean air temperature of the day and n is the number of days | ||
| Average temperature (Tv) October to July | , where n is the number of days from October to July | ||
| Summer index (SIy) | Sum of days with a daily maximum of air temperature above 5 °C; yearly | ||
| Summer index (SIv) | Sum of days with a daily maximum air temperature above 5 °C; October to July | ||
| Winter index (WI) | Sum of days with a daily maximum air temperature above 5 °C from November to April | ||
| Frost-alternating days (FAD(Oct–Jul.)) | Sum of days (October to July) with a change in temperatures above and below 0 °C within a day, between consecutive days | ||
| Early frost index (EFI) | Sum of the days on which the minimum air temperature falls below 0 °C from July to October | ||
| Late frost index (LFI) | Sum of the days on which the minimum air temperature falls below 0 °C from April to July | ||
| Frost severity (FS) | Annual minimum of temperature | ||
| Frost index per Liu (FI_Liu) | Sum of the days on which the minimum air temperature is below −3 °C and the temperature difference is at least 8 °C from the mean value of the last 20 days; from September to May | ||
| Frost shock (FS) | Sum of the days on which the air temperature drops by 15 °C within 24 h and the minimum air temperature falls below −3 °C; annual values | ||
| Summer cold per Liu (SC_Liu) | Sum of the difference between the minimum temperature and the mean minimum temperature of the last 20 days exceeding 8 °C | ||
| Temperature- and precipitation-related indices | de Martonne–Reichel dryness index (DI) | Evaluates the effect of precipitation on plant physiology and precipitation distribution from October to July | , where 10 indicates that negative values in the denominator should be avoided, K is the number of days with precipitation of ≥1.0 mm, and 120 is the multiannual average number of days with precipitation in Germany (October to July) |
| Air humidity (AH) | Evaluates the effect of precipitation on plant physiology; annual values | ||
| Aridity index (AI) | Evaluates the effect of precipitation on plant physiology; main vegetation period | ||
| Growing-period-related indices | Begin/end of the main vegetation period | First week of the year on which the threshold value of 5 °C is permanently exceeded (at least 5 days) | |
| Climatic vegetation time duration 1 (CL1) | Number of days with the longest period in which the air temperature exceeds 10 °C; values per year | ||
| Climatic main vegetation time duration 2 (CL2) | Number of 5-day periods with a maximum diurnal air temperature above 10 °C; values per year | ||
| Radiation-related indices | Global radiation GR(Oct.–Jul.) | Sum of global radiation; monthly values | |
Table 4.
Overview of the effects on the temporal yield development and the effects eliminated by calculating residuals.
Table 4.
Overview of the effects on the temporal yield development and the effects eliminated by calculating residuals.
| Effects | Effects Eliminated by Residuals | Effects Remaining in Residuals |
|---|---|---|
| Biological and chemical | New varieties Herbicides Insecticides Fertilizer, fertilization level | Diseases, pest infestation |
| Mechanical management | Technical equipment Processing | |
| Management advancement | Crop rotation | |
| Atmospheric | Climate change | Weather deviations, extreme weather events |
Table 5.
Multiple regression calculations of residuals and yields, with monthly climate parameters for different levels of fertilization (abbreviations are given in Table 3).
Table 5.
Multiple regression calculations of residuals and yields, with monthly climate parameters for different levels of fertilization (abbreviations are given in Table 3).
| Predictors | Regression Coefficient | Significance | β-Coefficient Standardized | Adj. R2 | RMSE (dt ha−1) | VIF | Durbin-Watson | |
|---|---|---|---|---|---|---|---|---|
| Yield, unfertilized control | Constant | −7.256 | *** | 0.99 | 0.32 | 1.741 | ||
| TT 2_Feb | 20.304 | *** | 0.739 | 1.30 | ||||
| GR_Feb | 0.001 | *** | 0.650 | 1.18 | ||||
| PI 2_Oct | −1.475 | *** | −0.410 | 1.13 | ||||
| FAD_Nov | −0.764 | *** | −0.272 | 1.40 | ||||
| PI 3_Dec | 0.652 | ** | 0.069 | 1.01 | ||||
| Residuals, unfertilized control | Constant | −22.221 | *** | 0.98 | 0.80 | 1.703 | ||
| TT 2_Feb | 13.381 | *** | 0.532 | 1.23 | ||||
| GR_Feb | 0.00055 | *** | 0.564 | 1.03 | ||||
| PI 2_Oct | −1.590 | *** | −0.482 | 1.14 | ||||
| PI 2_Jul | 0.569 | *** | 0.231 | 1.15 | ||||
| Yield, moderate fertilization level | Constant | 16.942 | n.s. | 0.929 | 3.16 | 2.452 | ||
| Pm_Dec | 0.383 | ** | 0.458 | 2.547 | ||||
| TT 1_Feb | 2.617 | *** | 0.590 | 1.209 | ||||
| PI 3_May | 4.932 | *** | 0.399 | 1.332 | ||||
| Tm_Nov. | 0.701 | ** | 0.403 | 1.907 | ||||
| Residuals, moderate fertilization level | Constant | −33.613 | *** | 0.968 | 1.34 | 1.701 | ||
| FAD Nov | 2.968 | *** | 0.859 | 1.242 | ||||
| Tm Mar | 0.956 | *** | 0.452 | 1.227 | ||||
| PI 2_Mar | −0.681 | ** | −0.240 | 1.351 | ||||
| PI 1_May | −1.157 | ** | −0.211 | 1.455 | ||||
| Yield, high fertilization level | Constant | 10.943 | n.s. | 0.715 | 11.63 | 2.29 | ||
| Pm_Dec | 0.741 | *** | 0.810 | 1.02 | ||||
| PI 3_March | 6.042 | ** | 0.472 | 1.02 | ||||
| Residuals, high fertilization level | Constant | 20.175 | *** | 0.939 | 2.11 | 2.299 | ||
| Pm_Nov | −0.141 | *** | −0.646 | 1.11 | ||||
| PI 3_Feb | 5.968 | *** | 0.575 | 1.00 | ||||
| FAD_Dec | −0.956 | ** | −0.375 | 1.11 |
Note: N0, N1, and N2 indicate fertilization control, moderate fertilizer treatment, and high fertilizer treatment, respectively. *, ** and *** indicate 5%, 1%, and 0.01 levels of significance, respectively; n.s., not significant.
Publisher’s Note: MDPI stays neutral with regard to jurisdictional claims in published maps and institutional affiliations. |
© 2021 by the authors. Licensee MDPI, Basel, Switzerland. This article is an open access article distributed under the terms and conditions of the Creative Commons Attribution (CC BY) license (https://creativecommons.org/licenses/by/4.0/).
Share and Cite
MDPI and ACS Style
Heil, K.; Gerl, S.; Schmidhalter, U. Sensitivity of Winter Barley Yield to Climate Variability in a Pleistocene Loess Area. Climate 2021, 9, 112. https://0-doi-org.brum.beds.ac.uk/10.3390/cli9070112
AMA Style
Heil K, Gerl S, Schmidhalter U. Sensitivity of Winter Barley Yield to Climate Variability in a Pleistocene Loess Area. Climate. 2021; 9(7):112. https://0-doi-org.brum.beds.ac.uk/10.3390/cli9070112
Chicago/Turabian StyleHeil, Kurt, Sebastian Gerl, and Urs Schmidhalter. 2021. "Sensitivity of Winter Barley Yield to Climate Variability in a Pleistocene Loess Area" Climate 9, no. 7: 112. https://0-doi-org.brum.beds.ac.uk/10.3390/cli9070112
Note that from the first issue of 2016, this journal uses article numbers instead of page numbers. See further details here.