Review

Stress Corrosion Cracking in Amorphous Phase Separated Oxide Glasses: A Holistic Review of Their Structures, Physical, Mechanical and Fracture Properties

1
Université Paris-Saclay, CEA, CNRS, SPEC, 91191 Gif-sur-Yvette, France
2
CNRS, IPR (Institut de Physique de Rennes)—UMR 6251, Université Rennes, F-35000 Rennes, France
3
CEA, Service de la Corrosion et du Comportement des Matériaux dans leur Environnement, Université Paris-Saclay, 91191 Gif-sur-Yvette, France
*
Author to whom correspondence should be addressed.
Corros. Mater. Degrad. 2021, 2(3), 412-446; https://0-doi-org.brum.beds.ac.uk/10.3390/cmd2030022
Submission received: 10 May 2021 / Revised: 23 June 2021 / Accepted: 14 July 2021 / Published: 23 July 2021

Abstract

:
Stress corrosion cracking is a well-known phenomenon in oxide glasses. However, how amorphous phase separation (APS) alters stress corrosion cracking, and the overall mechanical response of an oxide glass is less known in literature. APS is a dominant feature concerning many multicomponent systems, particularly the ternary sodium borosilicate (SBN) glass systems. Its three constituent oxides have significant industrial relevance, as they are the principal components of many industrial oxide glasses. Simulations and experimental studies demonstrate the existence of a two-phase metastable miscibility gap. Furthermore, theory suggests the possibility of three-phase APS in these oxide glasses. Literature already details the mechanisms of phase separation and characterizes SBN microstructures. Realizing that glasses are structurally sensitive materials opens a number of other questions concerning how the mesoscopic APS affects the continuum behavior of glasses, including dynamic fracture and stress corrosion cracking. This paper reviews current literature and provides a synthetic viewpoint on how APS structures of oxide glasses alter physical, mechanical, dynamic fracture, and stress corrosion cracking properties.

1. Introduction

Since Before the Common Era, humankind has been fabricating oxide glasses for various uses. Over the years, interest in oxide glasses has grown due to advantageous optical, chemical, and electrical properties [1]. Some of these properties include optical transparency, electrical isolation, and a high melting point (between 800–1800 °C depending on the chemical composition). Yet oxide glasses have a major drawback: they seem to fail abruptly. However, studying the failure of the glass samples in detail frequently leads one to discover sub-critical crack growth, also called stress corrosion cracking (SCC) because it is aided by environmental factors, or flaws that occurred before the dynamic fracture. For homogenous oxide glasses, this phenomenon is well documented in literature [2,3,4,5,6,7,8,9,10,11]. Moreover, the SCC properties are known to depend on the chemical composition of the oxide glass [2,3,4], the fictive temperature [5,6], the environmental factors [7,8,9,10,11], etc. In recent years, it has become apparent that understanding dynamic and sub-critical cracking requires a detailed knowledge of how short- and medium-range structures influence physical and mechanical properties in these glasses. By gaining this deep understanding, researchers will obtain key knowledge to advancing glass technology. This will ultimately benefit all kinds of industry, including high technology fields such as laser technology, energy-saving technology, and communication technology.
Literature highlights the significant body of work concerning structural [12,13,14,15,16], physical [12,17,18], and mechanical properties [2,14,19,20,21], dynamic fracture [10,20,22,23,24], and SCC [2,3,4,5,6,7,8,9,10,11] behavior of homogeneous single-phase oxide glasses whereas multiphase glasses are less studied in literature. Thus, this review takes a closer look at the current knowledge of the failure of amorphous phase separated (APS) oxide glasses via a holistic vantage point—how does APS structure alter physical, mechanical, dynamic fracture, and SCC glass properties?
Ideally, a material should not fail unless the stress intensity factor is greater than the fracture toughness ( K c ) of the material, which is considered as material parameter [25]. Needless to say, in actual materials, cracks also propagate when K I < K c . In this instance, crack propagation is sub-critical, i.e., stress corrosion cracking (SCC), and is aided by environmental factors [26,27,28]. Figure 1 shows a sketch of the logarithm of crack tip velocity ( log ( v ) ) as a function of K I . There are commonly 3 zones associated with SCC [7]. For stress intensity factors slightly less than K c , the velocity falls in what is commonly called Region III of the SCC v K I curve. In this region, the velocity of the crack front increases exponentially with increasing stress intensity factor:
v I I I = v 0 I I I exp ( Z I I I K I )
where v 0 I I I and Z I I I are empirical constants fitted to data [8,9]. Researchers agree that the dynamics in this section are independent of water concentration [8,9], but other environmental conditions (temperature [10], other corrosive environments such as nitrogen gas [8] and organic liquids [9], etc.) do play a role in this region. Beyond this, researchers do not quite understand the dynamics of crack propagation in this zone [7,8,9]. Decreasing the stress intensity factor further, the crack velocity stabilizes and reaches a plateau where it is independent of K I . This zone is frequently referred to as Region II. The height of the log ( v ) plateau depends on the time the water takes to reach the crack front [7,8,9,29], and thus depends on the amount of water in the environment. Increasing the humidity shifts the plateau upwards [8]. Further decreasing the stress intensity factor causes the velocity to reach Region I. For the K I range of Region I, the velocity of the crack front decreases exponentially with decreasing stress intensity factor, similarly as in Region III [7,8]:
v I = v 0 I exp ( Z I K I ) = Z 1 ( p H 2 O p 0 ) Z 2 exp ( Δ E a Z 3 K I R T )
where p H 2 O is the partial pressure of vapor phase in the environment, p 0 is the total atmospheric pressure, R is the gas constant, T the temperature, and Δ E a is related to the activation energy. Z 1 , Z 2 , Z 3 , and Δ E a are four fitting parameters that depend on the glasses’ composition. The significant difference between Region I and Region III is: Region I depends strongly on the amount of water in the surrounding environment as it is shown in the above equation [7,8]. The crack front propagation in Region I is controlled by the time for water to chemically react with the stretched bonds at the crack tip. Increasing the humidity at constant temperature in this region causes the log ( v ) versus K I curve to shift upwards maintaining a constant slope. Reducing the stress intensity factor further renders an environmental limit ( K e ) below which the crack front does not propagate anymore. To sum up, the position of K e and Region I, II, III, and the slope of Region I and III depend on parameters such as environmental factors and glass type. However, what is less understood is how APS structures alter the fracture behaviors of the glasses.
A single-phase material has a structurally and chemically homogeneous distribution of its constituents. Multiphase materials occur when precipitates with structural and/or chemical composition differences form. Each phase in these materials is homogeneous, and there is a distinctive barrier between different phases [30,31,32]. Liquid–liquid phase separation occurs in multi-component liquids when the Gibbs energy curve shows two distinct minimums as a function of the liquid composition.
From a thermodynamic viewpoint, a simple binary system composed of components A and B can exist as a homogenous mixture (attractive interactions A–B), or it might prefer to exist as a heterogeneous mixture with repulsive A–B interactions. The preference to exist as a heterogeneous mixture induces phase separation over a well-defined range of compositions, temperatures, and pressures. Likewise, phase separation can also be due to irradiation [33]. Phase separation processes produce a large variety of mesoscopic structures, which modify the macroscopic behavior of the material. Theories propose different mechanisms to explain these scenarios taking into consideration the composition of the glass and the kinetic limits [34,35].
Over the years, researchers identified metastable miscibility gaps in multiple different types of oxide glass systems [36,37,38], particularly those based on silica and boron oxides [39,40,41]. Simulation and experimental approaches aid in obtaining phase diagrams to predict the miscibility gaps. These studies [42,43,44,45,46,47] help in understanding from short- to medium-range (micro and meso) structures of the glasses. Researchers also study how these changes scale up to variations in the overall physical and mechanical/fracture properties of phase separated glass systems [48,49]. An industrial application of phase separated glasses and their enhanced mechanical/fracture properties concerns crush-resistant glasses [50]. Furthermore, phase diagrams have industrial significance when considering functional materials, such as glass-ceramics and porous glasses [51,52,53].
This review revisits several key pieces of literature concerning APS glasses, from their formation to their structures, and physical, mechanical and fracture properties. To aid these studies, the co-authors include new research concerning an APS SiO 2 - B 2 O 3 - Na 2 O (SBN) sample. Section 2 commences with a brief discussion concerning current industrial applications of phase-separated glasses. Section 3 presents why phase separation occurs via the thermodynamic viewpoint. Section 4, Section 5 and Section 6 present the structures, physical and mechanical/fracture (respectively) properties of a few APS glass systems. The last section provides an outlook of future investigations on APS glass systems.

2. APS Glasses: Their Uses in Industry

Phase separated glasses have several industrial uses. This section briefly reviews two uses: glass-ceramics and porous glasses. Glass-ceramics [54] are oxide-based glasses with a secondary crystalline phase. Common uses for glass-ceramics include optical thermometry [55], cookware [56], dental applications [57], etc. Controlling the thermal treatments of the pristine homogeneous glass leads to nucleation and growth of crystalline phases [54,58]. Studies suggest that APS glasses could be favorable systems in elaborating glass-ceramics, because a secondary amorphous phase could provide favorable sites for crystal nucleation [59]. Moreover, secondary amorphous phases could themselves be a preliminary step in the crystal nucleation process [60].
Combining some observations and analyses, Uhlmann [61] proposed four effects of liquid–liquid phase separation on crystal nucleation in glass forming systems: enhanced driving force, special interfacial sites, higher atomic mobility, and enrichment of certain components after the appearance of the second phase. Tomozawa [59] attributed a higher nucleation rate to the presence of a narrow and deep diffusion zone at the interface between the minor phase and the main matrix. This provides favorable sites for crystal nucleation by lowering the interfacial energy between the matrix and the secondary phase.
Recently, Kleebusch et al. [60] built upon these studies by combining different experimental techniques. They used X-ray diffraction (XRD) in conjunction with scanning transmission electron microscope (STEM) supported by energy-dispersive X-ray (EDX) spectroscopy to study TiO2-doped lithium aluminosilicate glasses during heat treatment. This series of experiments revealed the as-formed glass was of amorphous structure, with the presence of titanium-rich inclusions on the order of 2–3 nm. Thus, the as-formed glass contains some amount of liquid–liquid phase separation. After annealing for only 15 min at 740 °C, these inclusions grew, and the density of the inclusions increased. Extending the annealing time for more than 1 h does reveal the formation of a phase rich in crystalline TiO2 (anatase). Continuing the annealing process for more than 4 h gives way to the formation of another phase, β-quartz type. One could hypothesize that liquid–liquid phase separation is a precursor to the onset of crystal nucleation as several pieces of research [62,63] indicate. Yet the precise connection (if any) between these processes eludes scientists [64]. Further investigations are required to conclusively determine the mechanisms involved.
Porous glasses concern another industrial use of APS glasses [51]. Their application involves the creation of a melt that undergoes a spinodal decomposition (see Section 5), followed by subsequent leaching of one or more of the phases [65,66] (Figure 2). In the case of sodium borosilicate glasses [53], the alkali-rich borate phase is removed, and the nearly pure silica phase, or “backbone”, remains. These glasses find a multitude of different industrial applications, including ion exchange [67], membrane technology [68], chromatography [69], solid-phase biochemistry [70], and heterogeneous catalysis [71]. Furthermore, porous glasses are a base material in the preparation of zeolite/porous glass composites [72,73].
Generally, the structure of porous glass is important for the macroscopic behavior of the material [51,74]; and subsequently, its industrial application. Therefore, the glass structure should be strictly controlled to enable specific functionalities of the glasses. These functionalities are determined by (i) initial glass composition, (ii) annealing protocol (duration, temperature, number of annealing times…), and (iii) leaching conditions [75]. In certain cases, the porous glass structure makes the material more crush resistant. For example, a porous silica-rich glass fabricated from a phase-separated alkali metal silica by leaching the phase-separated glass in acid solution containing silica ions and at least one common ion of the component in precursor glass is more resistant to fracture [76]. In general, the precursor APS glass controls the properties of the final products.
Nevertheless in APS glasses, the individual phase separated zones (and their structure) impact the glasses properties due to special medium-range structure. Hence, understanding how APS, specifically size and geometry of the secondary phase, affects the structure of the glasses and subsequently the physical and mechanical/fracture behavior plays an important role in fabricating stronger glasses for future applications.

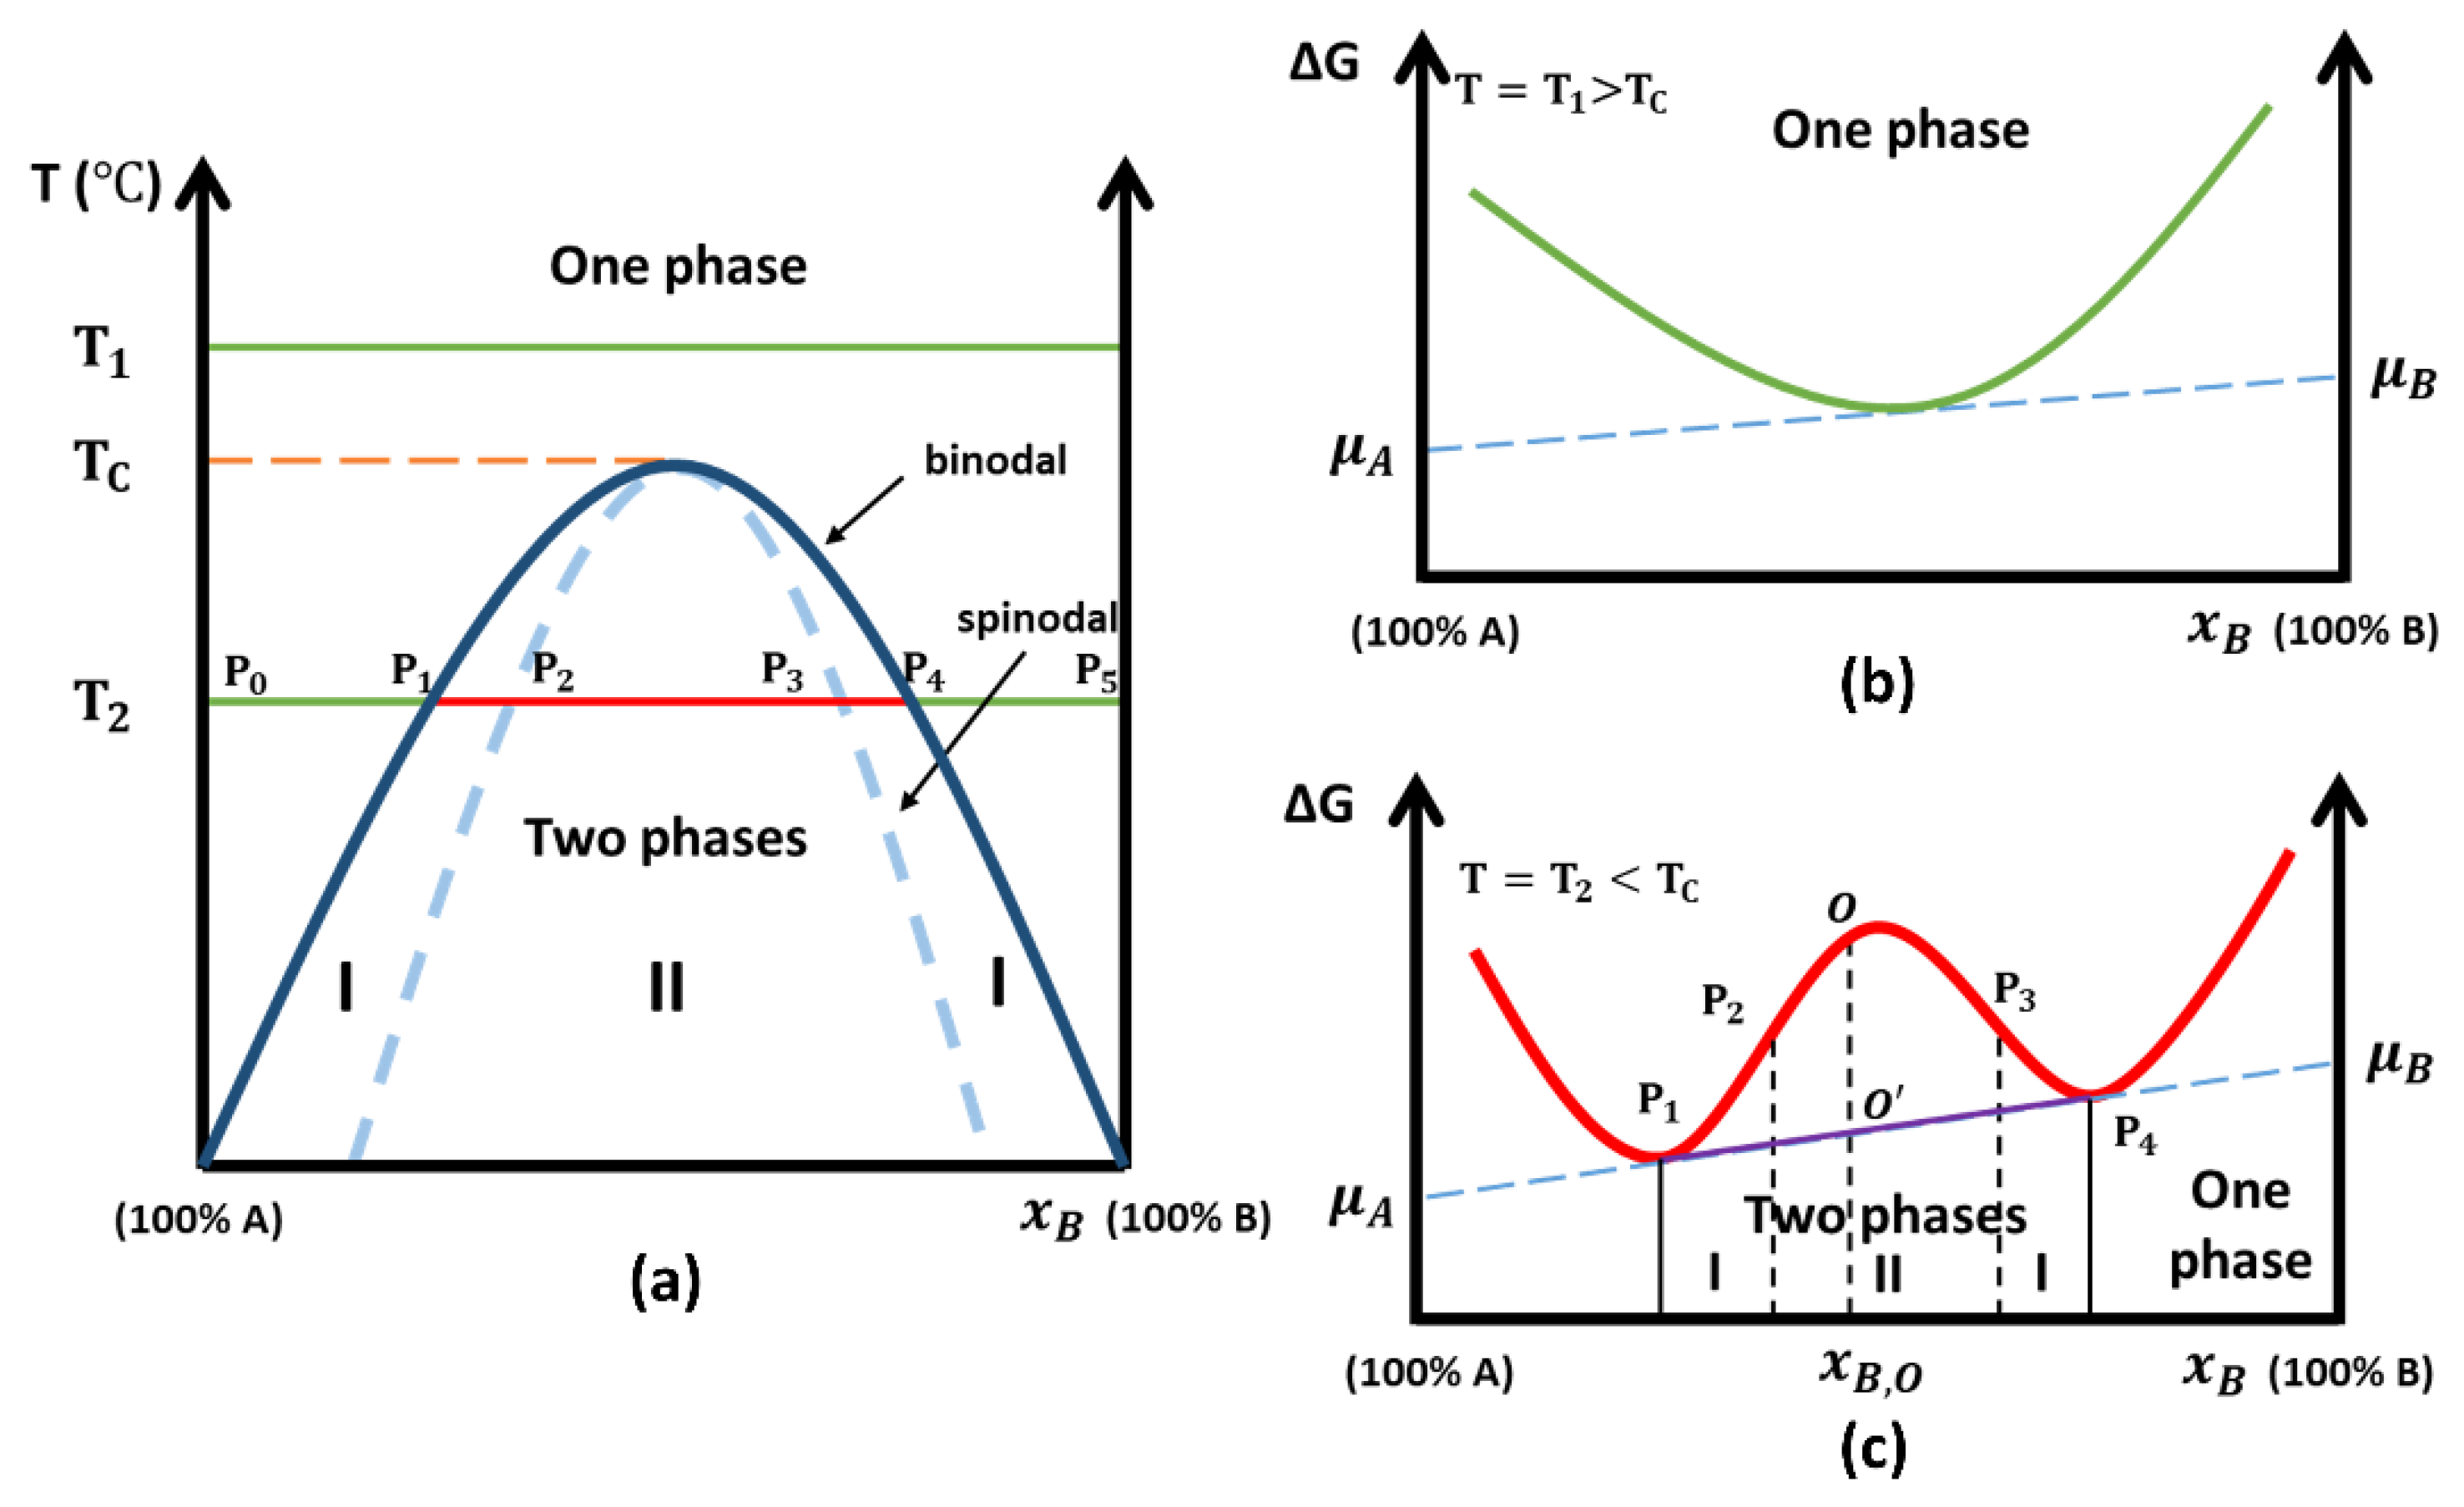
3. Thermodynamic Interpretations of Phase Separation

Thermodynamic theories are some of the most widely accepted methods for explaining the occurrence of phase separation in materials. Section 3.1 reviews the case of a two-atom theoretical system. Section 3.2 turns to the more complex problem of multi-oxide glass systems. Section 3.3 addresses the special case of SiO 2 - B 2 O 3 - Na 2 O glasses. APS in glasses is usually considered and analyzed as liquid–liquid phase separation [35,59,77]. However, it should be noted that a glass is not in thermodynamic equilibrium; hence, discussions herein concern inherently metastable glasses.

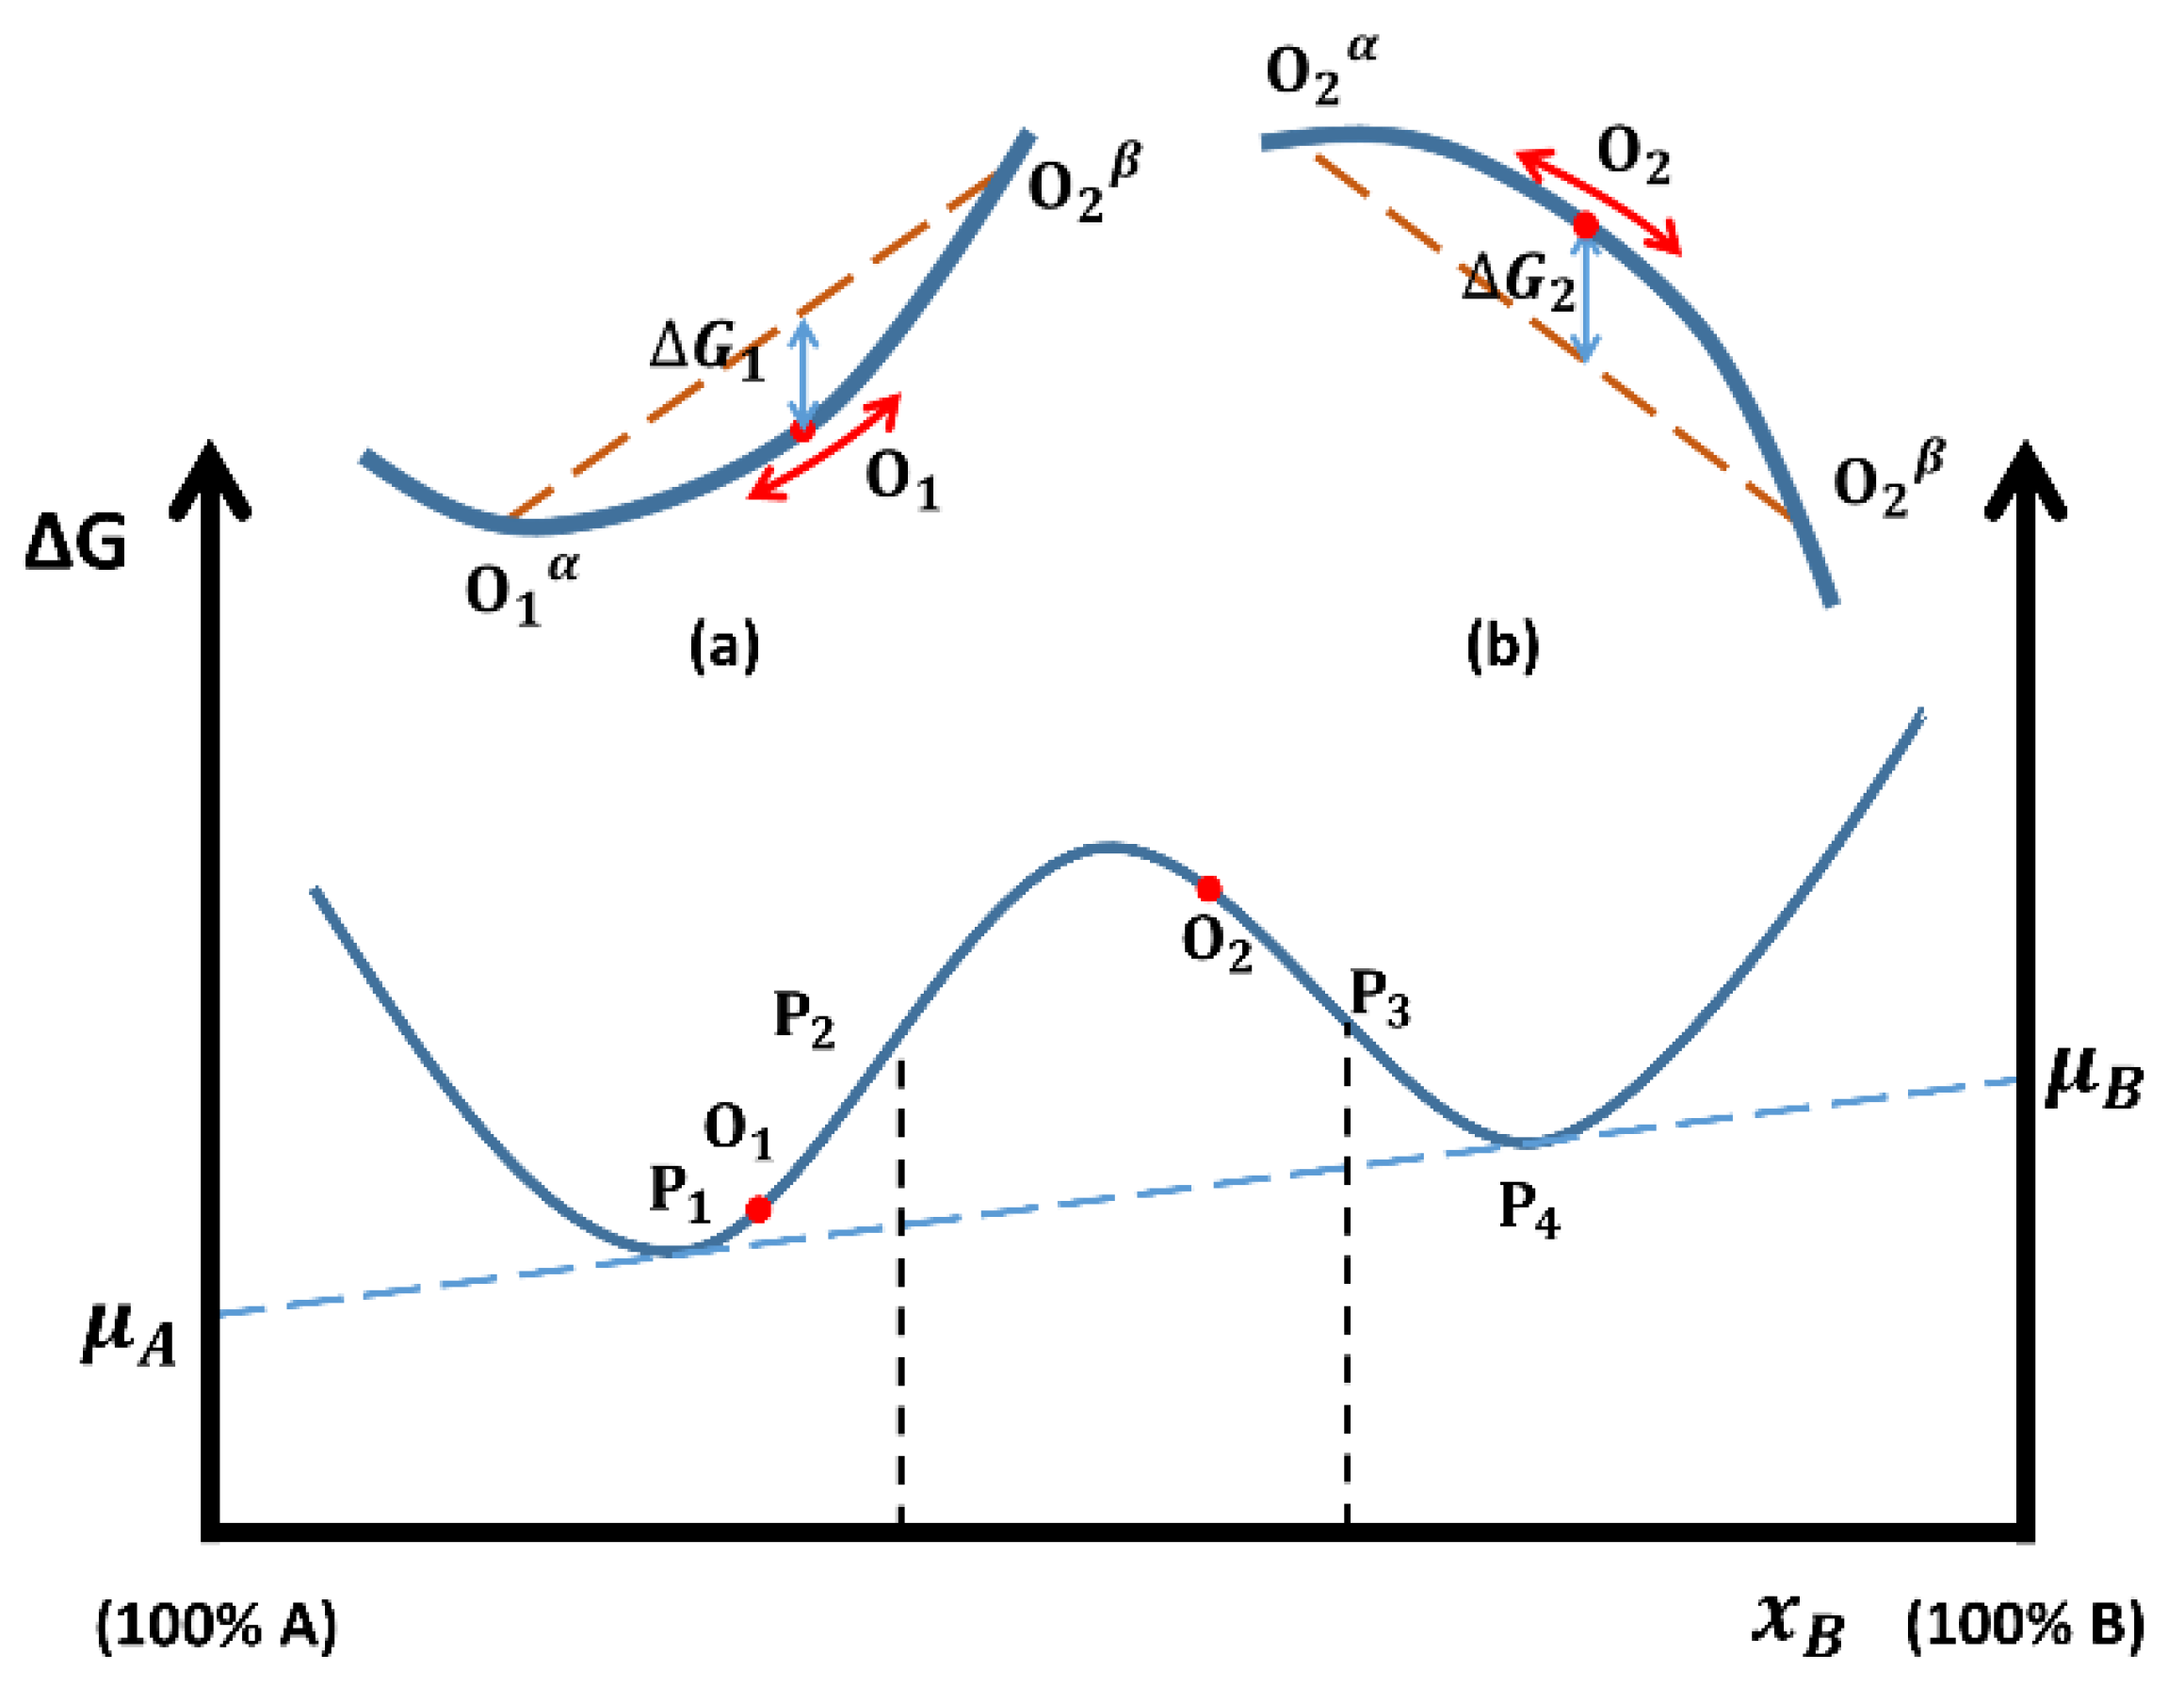
3.1. Binary Amorphous Phase Separation: A Two-Atom Theoretical Viewpoint

A simple case of phase separation concerns binary systems. Cottrell [78] and James [35] simplified the problem to a two-atom system to explain qualitatively the behavior of the two liquids. This approach is reviewed herein (Appendix C contains a summary of variables used herein). For a homogeneous single-phase system, in theory, atoms A and B are considered randomly distributed on a regular lattice. The Gibbs free energy of this ideal mixing Δ G m i x is [35,79,80]:
Δ G m i x = Δ H m i x T Δ S m i x
where Δ H m i x is the enthalpy of mixing, Δ S m i x in the entropy of mixing, and T is the temperature. The entropy of the mixed phase is [35,79,80]:
Δ S m i x = R [ x B ln ( x B ) + x A ln ( x A ) ]
where x A and x B are the mole fractions of atoms A and B (respectively), and R is the gas constant. As this is a binary system, x A = 1 x B , the entropy of the mixed system is [35,79,80]:
Δ S m i x = R [ x B ln ( x B ) + ( 1 x B ) ln ( 1 x B ) ]
The enthalpy of the system is arrived at via the quasi-chemical approach [79]. This method assumes a homogeneous mixture of A–B, A–A and B–B interatomic bonds. Moreover, the interatomic distances and bonding energies are independent of the chemical composition. In this instance, the enthalpy of mixing is [79,80]:
Δ H m i x = η x B ( 1 x B )
where η is
η = N A Z [ E A B 1 2 ( E A A + E B B ) ]
where E A A , E B B and E A B are the bonding energies between atomic species, Z is the number of nearest neighbors surrounding each atom, and N A is Avogadro’s number. Finally, the Gibbs free energy of mixing is [35,79,80]:
Δ G m i x = η x B ( 1 x B ) + R T [ x B ln ( x B ) + ( 1 x B ) ln ( 1 x B ) ]
Figure 3 depicts a typical miscibility gap and the Gibbs free energy curves as a function of x B . In Figure 3a, the solid dark blue line represents the binodal curve, which is the boundary between the domain where only a single phase exists to a domain where multiple phases exist, and hence a miscibility gap. This curve is obtained from the shape variation of Gibbs free energy curves (Figure 3b,c).
The temperature at the apex, T C , is the upper consolute temperature. For temperatures greater than T C (for example at T 1 ), a single phase exists for all compositions. Figure 3b shows the Gibbs free energy curve as a function of the chemical composition. In this case, the Gibbs free energy varies with chemical composition as G = μ A X A + μ B X B ( X A and X B are the moles of components A and B) [79]. The tangent to the Gibbs free energy for a specific chemical composition gives the chemical potential of A at that composition μ A (value of the tangent at x B = 0 ), and that of B μ B (value of the tangent at x B = 1 , bearing in mind that x A = 1 x B ).
For temperatures below T C (Figure 3c), the liquid can be single-phased or it can separate into two phases with different compositions. For P 0 x B P 1 and P 4 x B P 5 , a single phase exists (Figure 3a). However, when P 1 x B P 4 , phase separation occurs due to thermodynamic driving forces which reduce the system’s free energy. Within this zone, the Gibbs free energy of the mixture follows the tangent line shown in purple between P 1 and P 4 (Figure 3c). As an example, take a system with chemical composition x B , O . The Gibbs free energy is marked by point O if component A and B are ideally mixed. On the other hand, point O in Figure 3c represents the Gibbs free energy when the system decomposes into two phases: composition x B , P 1 and x B , P 4 , respectively. The decrease in free energy from O to O drives the phase separation.
Once the system equilibrates, there are two liquids co-existing, the chemical composition of which corresponds to that of P 1 and P 4 for atoms A and B, respectively. (It is worth noting that P 1 and P 4 will be coined tie-line end members, henceforth, for T 2 [81,82]) Furthermore, the chemical potential of each compound should be the same in different phases. For example, the chemical potential of A in the first phase α ( μ A α ) is equal to that in the second phase β ( μ A β ): μ A α = μ A β = μ A . A similar phenomenon occurs for the chemical potential of B. Moreover, these values correspond to the common tangent between P 1 and P 4 , which is extracted to x B = 0 and x B = 1 (see Figure 3c). The result of this is the coexistence of two phases with different possible geometries and influences on physical and mechanical/fracture properties of the overall material.
Phase separation is favorable within the zone between P 1 and P 4 . It is further divided into two structures, revealing itself as either binodal or spinodal decomposition. Figure 3a,c identifies the different zones via the markers I and II. Moreover, the changeover from zone I ( P 1 P 2 and P 3 P 4 ) to zone II ( P 2 P 3 ) corresponds to 2 Δ G x 2 = 0 (Figure 3a light blue dashed line).
While the system tries to decompose into two different phases, the free energy of both phases follow the G lines. For zone I where 2 Δ G x 2 > 0 , the Gibbs free energy curve is convex ( O 1 in embedded graph (a) in Figure 4). A small composition fluctuation of the system O 1 in zone I induces a phase separation into O 1 α and O 1 β . This results in an increase in the free energy of the system (brownish dashed line), so that there is a driving force to recombine them, which inhibits nucleation of a secondary phase. Hence, a stronger fluctuation is needed to overcome the energy barrier. In this case, the system is considered metastable. Once there is nucleation, the secondary phase can grow by diffusion mechanisms since the energy barrier for growth is small. This mode of phase separation is called nucleation and growth (or coarsening), also coined binodal decomposition. A similar scenario occurs when the chemical composition falls between P 3 P 4 .
On the other hand, if the initial composition is between P 2 P 3 (zone II) where 2 Δ G x 2 < 0 , the curve is concave ( O 2 in embedded graph (b) in Figure 4). Slight fluctuations in composition implies lower Gibbs free energy of the system, so the system is not stable. In this case, the structure changes continuously until an equilibrium is reached, and phase separation occurs. This process is called spinodal decomposition.

3.2. Beyond the Two-Atom Approximation

In general, the initial chemical composition of glasses along with heat treatment protocols dictates the phases in the resulting glass. Looking at binary oxide systems (specially B 2 O 3 - Na 2 O , SiO 2 - B 2 O 3 , and SiO 2 - Na 2 O ), which can be analyzed as pseudo-binary systems even though there are three types of atoms, the problem is significantly more complex than the two-atom model presented above. All three binary oxide systems exhibit a miscibility gap depending on chemical composition [81,83,84]. Haller [81] has modified the regular mixing model for binary SiO 2 - M 2 O systems (where M is the alkali metal). In his studies, the main network component [ SiO 2 ] m and a stoichiometric compound [ M 2 O · n SiO 2 ] are the limit of the miscibility gap on the alkaline oxide side. Charles [85], instead of considering the ideal mixing of atoms, studied a more realistic statistical model involving the interchange of bridging/non-bridging oxygen atoms. He compares the exothermic contribution (conversion of bridging Si O bonds to non-bridging Si O bonds) and endothermic contribution (coulombic interaction energy difference between metal cations/free oxygen ions in the pure metal oxide and metal cations/non-bridging oxygen ions in the glass melt) to explain the origin of immiscibility. Other explanations have been proposed for the origin of phase separation [86,87]. Nevertheless, it is not clear if the different approaches mentioned above are consistent with one another. The systems with multiple components, which are more common in daily life, should be more complicated to analyze. Moreover, the structural complexity of the different systems increases the research difficulty.

3.3. Phase Diagram of the SBN System

As mentioned in the previous section, the miscibility gap for binary systems is where the phase separation for a given material occurs. Nevertheless, the ternary oxide system SiO 2 - B 2 O 3 - Na 2 O concerns a significantly more complex system than the two-atom system presented in Section 3.1. One should recall even single-phase SBN systems are rather structurally complex, with more than nine elementary structural units existing [12,88,89,90,91]. Furthermore, Haller et al. [83] hypothesized two- and three-phase separation for the SBN system. From early on, researchers realized the difficulty in identifying in-situ the onset of phase separation in oxide glasses, as the changes are rather subtle. Hence, Haller et al. [81] identified systemic tendencies with annealing temperature, which are more obvious. These tendencies reveal a three-step process regarding the transparency of the glass: (1) the glass starts out transparent at room temperature; (2) increasing the temperature causes the sample to become opaque; and (3) subsequently increasing the temperature further causes the sample to regain its transparency. Researchers frequently use the clearing temperature (where a sample becomes clear again) as the upper bound of the metastable miscibility surface for SBN glasses. In some cases, the maximum opalescence is used instead of the clearing temperature; however, Haller et al. [81] found the maximum opalescence and clearing temperature to be nearly the same. They examined a number of glasses with varying chemical composition and proposed a phase diagram. Figure 5 presents Haller’s measured clearing temperatures for the ternary oxide SBN system (circles and isothermal lines, [83]) and for the binary oxide SiO 2 - Na 2 O system (triangles, [81]).
Furthermore, Haller [83] reveals how heat treatment conditions result in different glass structures for a given chemical composition. Figure 6 depicts Haller’s I, II, and III hypothesized phase separation zones at 600 °C. This phase diagram is widely used to predict phase separation [65,92,93] in SBN glasses. However, experimental methods have some limitations. Estimating the microstructure of the glass simply by the macro-opalescence is not precise enough to point out the onset of phase separation, let alone distinguish between two or three different phases. Therefore, experimental methods require complementary numerical techniques to understand fully the dynamics of phase separation.
Thermodynamic approaches using activity data [36], empirical method [95], and Gibbs free energy [96,97] provide an enhanced understanding of the liquid phases in phase-separated systems. The literature contains numerous thermodynamic ionic liquid models (including regular [36,37], quasi-regular [37,98], and sub-regular solution models [37]) used to predict the thermodynamic behavior of ternary oxide melts [99]. These predictions mostly arise from calculations of chemical activity data on binary systems or binary oxide systems. For example, Charles [36] estimated thermodynamically the metastable immiscibility in the SiO 2 - B 2 O 3 - Li 2 O via activity data. In addition, Kawamoto and Tomozawa [95] developed an empirical method with the assumption that the ternary oxide alkaline earth silicate glasses separate into two phases, one of which is assumed to be nearly pure silica. However, these assumptions are not considered to be accurate in determining the compositions of the different phases while annealing [100].
For many years, the CALPHAD (CALculation of PHAse Diagrams) method was used to provide predictions of liquid phase miscibility gaps in multiple different systems [96,97]. This method uses the Gibbs energy to calculate phase diagrams and thermodynamic properties. Input parameters include conditions such as chemical composition, temperature, and pressure. Extending CALPHAD methods to oxide glasses may give reliable estimates of the phase diagram [101], yet this is proving difficult because glass is not at equilibrium.
Generally, the ternary metastable liquid–liquid phase diagram is highly important. Moreover, kinetic factors also have essential effects on the phase separation processes. For a given glass with a chemical composition within the miscibility gap, annealing protocols determine: (1) the phase composition while attaining equilibrium (Section 3.1), (2) the type of phase separation (binodal or spinodal) [83], (3) the nucleation/growth kinetics in the miscibility gaps [77,102], and (4) the final phase compositions and phase size [94,103,104]. The next section focuses on different structures of some APS-SBN (amorphous phase separated SBN) glasses.

4. The Medium-Range Structure of APS-SBN Glasses

Industrial glasses commonly contain four or more different oxides [105,106]. However, these glasses are frequently represented by model glasses with only the principal oxides. These model glasses usually consist of two glass formers, normally SiO 2 and B 2 O 3 [107,108]. Each of these glass formers reacts with alkali metal oxides [88,89,90]; herein, the authors are predominantly concerned with Na 2 O . Varying the glass chemical composition alters the nearest-neighbor structures of the glass in regards to the coordination number of the boron atoms and the number of non-bridging oxygen atoms (see [2,3,4,12,19,20] for more details) in the silicate and borate networks. The network formed, beyond these nearest-neighbor structures, is usually described as interconnected rings of various sizes, denoted nMR (n-membered rings) (see [2,3,4,12,19,20,80,108,109,110,111] for more details). The size and distribution of these nMR depends on the glass chemical composition along with fabrication protocols [112]. In general, slightly beyond the nMR size glasses are considered homogeneous materials. However, for certain chemical compositions, phase separation generated by annealing causes mesoscopic variations beyond the nMR structures. Section 4.1 presents these variations revealed by several microscopy techniques (particularly the atomic force microscope, AFM) and concentrates on SBN samples. This section also reviews some recent tomography experiments in APS glasses and examines the possibility of using such experiments on SBN glasses. Section 4.2 introduces a more complicated phenomenon—secondary phase separation, which occurs sometimes when an APS sample undergoes a second annealing protocol.

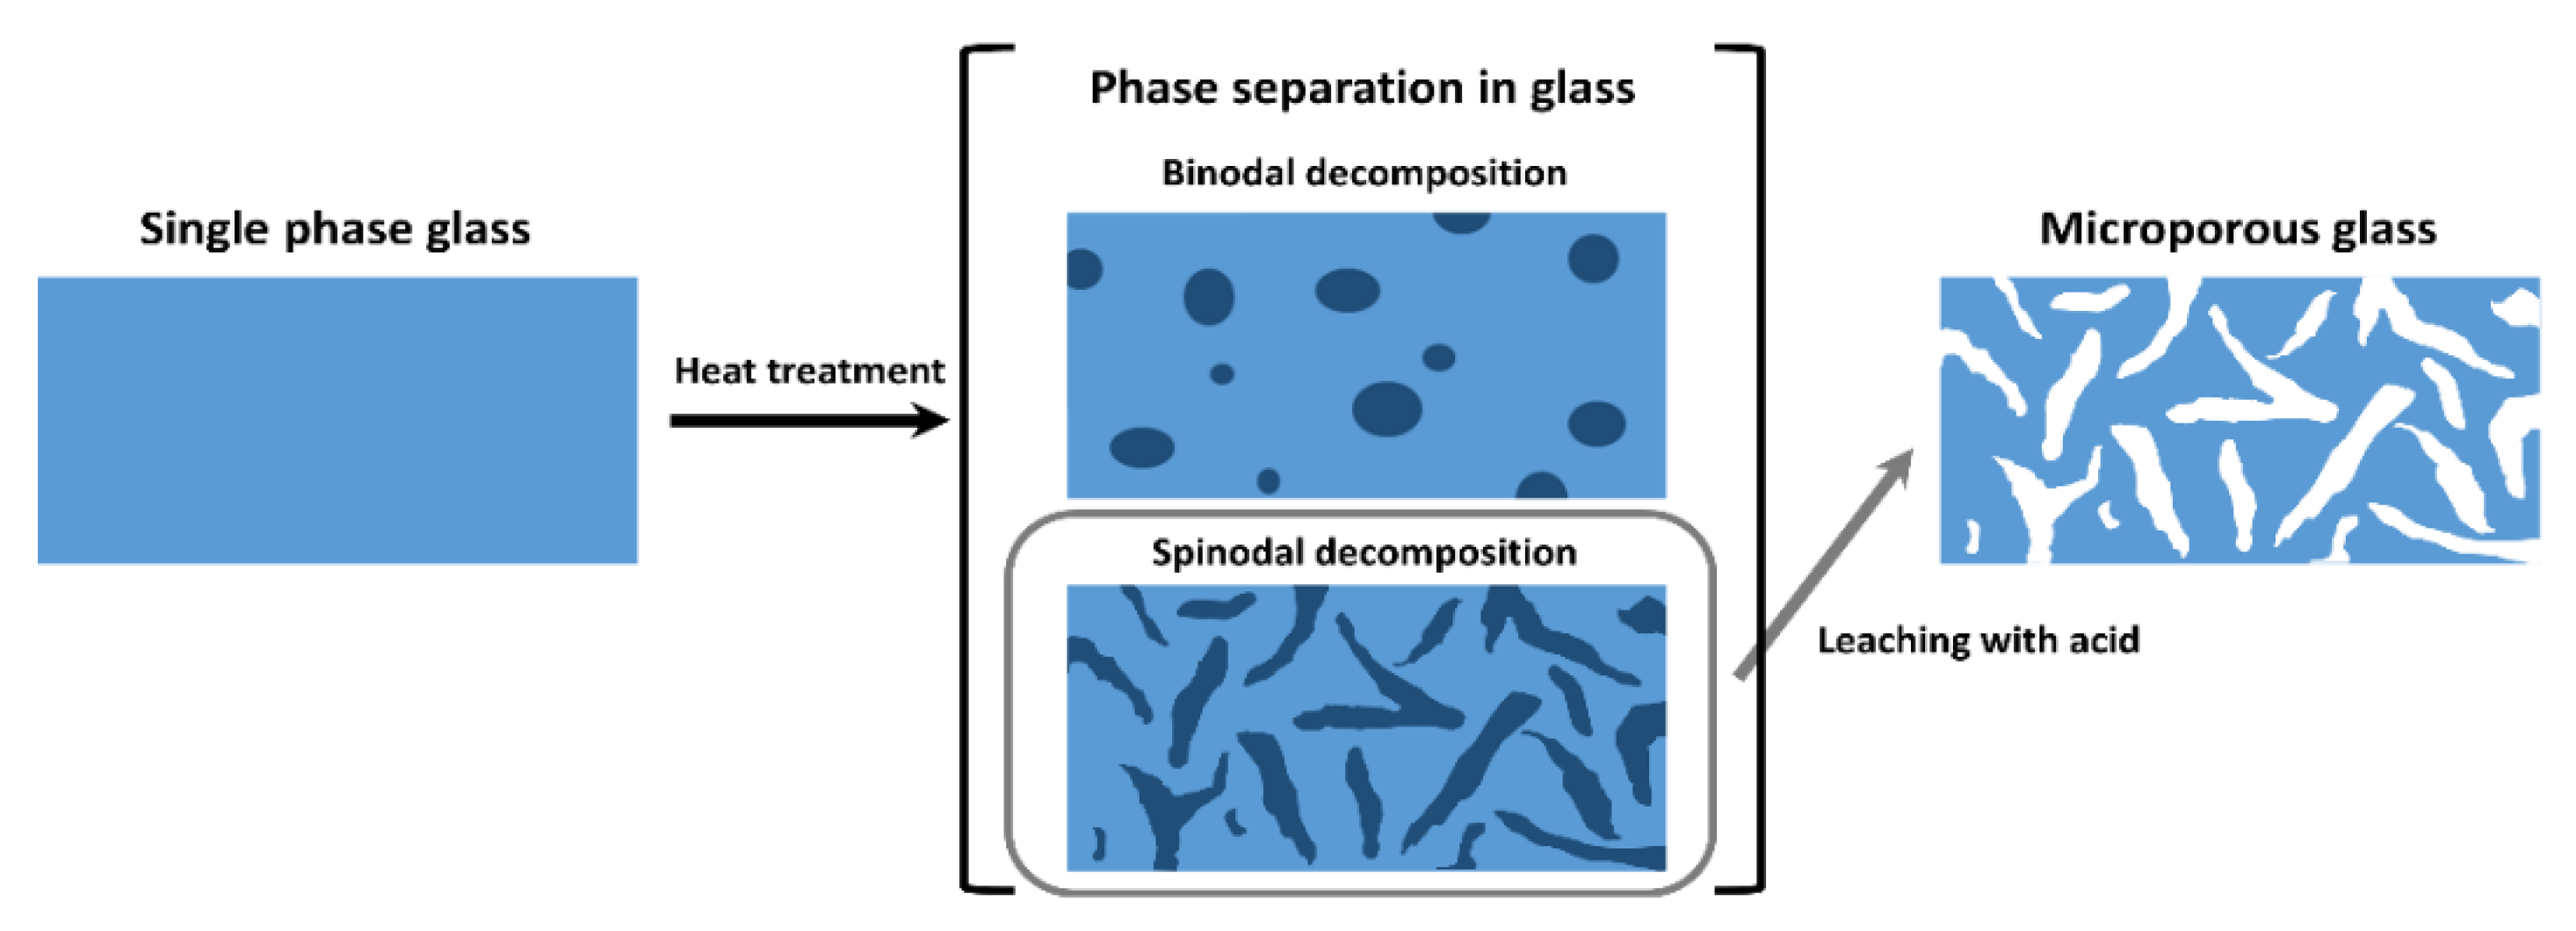
4.1. Sub-µm Amorphous Phase Separation in Glasses

Ternary systems behave similarly as binary systems: they both undergo binodal and spinodal decompositions. For ternary systems, the complexity of the glass structure is so significant that the rules for binary systems via the chemical composition and annealing temperatures remain unknown. After fabrication and annealing, researchers used different techniques to probe short-, medium-, and long-range structures of APS glasses. Techniques such as X-ray scattering [113], nuclear magnetic resonance (NMR) [114], and Raman scattering [115,116] provide short-range structural information. However, these techniques integrate data over μ m spots in the case of X-ray and Raman scattering techniques and on the sample size for NMR results. Thus, probing medium-range ordering (>10 Å up to 1 µm) relies on TEM, scanning electron microscopy (SEM), and AFM imaging techniques.

4.1.1. Binodal Decomposition in SBN Glasses

Binodal decomposition inside the glass reveals itself as a droplet-shaped secondary phase embedded in a matrix. The mechanisms and kinetics of binodal decomposition, i.e., nucleation and growth, have been widely studied [35,117,118]. Wheaton and Clare [104] studied a complex commercial material based on borosilicate oxide glass Corning 7070. This glass exhibited a binodal decomposition with well-formed droplets. Figure 7 displays AFM images after annealing at 700 °C for 1, 8, and 24 h, in panels a, b, and c, respectively. Clearly, the droplets have grown during this time period. Wheaton found the average droplet radius is proportional to the cubic root of time for a given isothermal annealing temperature.
Ternary oxide SBN system also undergoes binodal decomposition. Häßler and Rüssel [94] investigated a glass with the following chemical composition: [ SiO 2 ] = 60.0%, [ B 2 O 3 ] = 37.0%, and [ Na 2 O ] = 3.0%, where [ · ] implies mol%. The square in Figure 6 depicts the location of the glass system in the ternary oxide phase diagram at 600 °C. It clearly resides in the two-phase area. Based on its chemical composition, one expects the structure to be sodium borate-rich particles embedded in a silica-rich matrix [119]. Häßler and Rüssel [94] subjected the samples to various annealing protocols: annealing temperature ranges from 520 °C to 680 °C and annealing times range from 1 h to 100 h. TEM and SEM were used to characterize the medium-range structure of samples. In their studies [94], EDX characterization tests show clearly the occurrence of APS in the samples. The secondary phase has a droplet-like structure, consistent with the theoretical structure of binodal decomposition. These droplets have a high concentration of boron atoms and a low concertation of silicon atoms. The growth rate of the phase depends strongly on the annealing temperature. At 680 °C, the growth rate of droplet diameter D is approximately proportional to t 0.25 while for 620 °C, it is to t 0.08 [94].
Another SBN glass has been studied by Shepilov et al. [120] with the following chemical composition: [ SiO 2 ] = 50.1%, [ B 2 O 3 ] = 36.0%, and [ Na 2 O ] = 13.9% (in mol%). Samples were heat-treated at 610 °C for 5 and 10 h. These glasses display a binodal structure after annealing. The distribution of particle radius and its mean were obtained by electron micrograph analysis. According to Shepilov et al.’s [120] investigation, the mean particle radii of this APS-SBN glass are 22.7 nm and 33.8 nm, respectively, for 5 h and 10 h.
Apart from the SBN glasses, many other systems are also subjected to binodal decomposition, such as the PbO - B 2 O 3 glass system, which is widely studied in literature. This oxide glass provides a typical example of binodal structure glass for which many theories on physical and mechanical/fracture properties (which will be discussed in Section 5 and Section 6) are derived.

4.1.2. Spinodal Decomposition in SBN Glasses

Spinodal decomposition induces a distributed network similar to secondary phase in the glass. Researchers used different technical tools to evidence and characterize this structure in SBN glass system [83,104,121,122]. Haller [83] studied the glass with chemical compositions: [ SiO 2 ] = 60.0%, [ B 2 O 3 ] = 30.5%, and [ Na 2 O ] = 9.5% (in mol%). This glass displays a spinodal structure after annealing at 550 °C, 600 °C, and 650 °C, but a binodal structure at 700 °C. Additionally, Wheaton and Clare [104] have done quantitative analysis by AFM on the phase growth in the glass with chemical compositions: [ SiO 2 ] = 82.5%, and [ Na 2 O ] = 17.5% (in mol%). They found that the phase growth during the coarsening stage at 650 °C in the glass can be linked to the cubic root of annealing time t a n n e a l i n g 1 / 3 : the area of inhomogeneity increases linearly with t a n n e a l i n g 1 / 3 ; the interface area between different phases decreases linearly with increasing t a n n e a l i n g 1 / 3 .
The authors herein have investigated a glass with the following target chemical composition: [ SiO 2 ] = 70.0%, [ B 2 O 3 ] = 23.0%, and [ Na 2 O ] = 7.0% (in mol%) (coined SBN42 herein). The white star in Figure 6 marks the location of the glass system in the ternary oxide phase diagram at 600 °C, and it clearly resides in the hypothesized three-phase area. To view the different phases, chemical treatment techniques used for fabricating porous glasses in industry were invoked herein (see Section 2). HCl acid leaches out the borate-rich and sodium-rich phases (if exist) from the samples leaving behind the silica-rich structure [51,66]. Here, the samples are immersed in HCl 3N at 60 °C for 30 min. Figure 8 depicts the pristine structure (i.e., no annealing; but the sample is broken in two and the fracture surface is studied to avoid interference due to polishing) captured via an AFM before (Figure 8a) and after (Figure 8b) immersing the sample in HCl acid. These pristine samples do not display APS before nor after leaching.
The SBN42 sample series from the same batch underwent heat treatments at 600 °C and 650 °C for 2 h, 4 h, 6 h, 18 h, and 24 h. Imaging these annealed samples before immersion in HCl did not reveal the same underlying structure as the pristine one. However, a rich structure is revealed after chemical treatment in HCl acid.
Figure 9 presents the series of AFM images of the sample after annealing and immersing in HCl acid. These images confirm the occurrence of APS in SBN42. Moreover, the sample’s structure evolves with annealing time and temperature. For a fixed temperature, the structure coarsens as annealing time increases. The structure displayed in the AFM images resembles that of a spinodal decomposition, which is also evidenced by Elmer [122] using SEM.
Post (i.e., after annealing and after leaching) AFM image analysis enables a description of the growth of the silica rich zone. This is done by drawing lines across the width of the silica rich zones then averaging the length of these lines over the image. For each temperature, the phase evolution described by its width L is:
600   ° C : L = 16.205 × t a n n e a l i n g 0.558
650   ° C : L = 62.586 × t a n n e a l i n g 0.352
Studying the two fits revealed that increasing the temperature accelerates the growth of the phase. However, for the 650 °C annealed sample, one also notes the sample went from being transparent to translucent when annealing times reached 24 h. Higher annealing temperatures, 700 °C, cause the samples to go from transparent to opaque with increased annealing times. For these longer annealing times and higher temperatures, Raman spectroscopy revealed sample crystallization.
In recent years, another non-destructive technique, X-ray micro-tomography [123], was used to capture in-situ microstructural changes in glasses. The absorption contrast of different chemical compositions reveals the phase separation in samples via 3D visualization schemes. For example, Bouttes [42,43,44] monitored the coarsening dynamics of barium borosilicate melts (predicted to separate into silica-rich and barium-rich phases) during phase separation with this method. Image reconstruction provides the evolution of the volumes, mean surfaces, Gaussian curvatures, and phase size changes as a function of time at various temperatures. Furthermore, this technique can also be used during the mechanical test to monitor the formation of crack systems in some disordered materials [124,125]. With the current availability of third-generation synchrotron sources and the development of new detectors, the spatial resolutions can reach the micrometer range routinely [126]. However, investigations of phase separation in SBN glasses remain outside the scope of X-ray micro-tomography (and other techniques including Raman) as the scale of phase separation is on the order of 10 nm.

4.2. Secondary Phase Separation

With the aid of electron microscopy, researchers evidenced and characterized highly disperse structures co-existing within the main phase(s) in phase-separated systems, including fluid mixtures [127], alloys [128], and glasses [42,129,130]. It is hypothesized that this arises due to natural fluctuations [131] or a special type of phase separation, called micro-separation [132]. For glass systems, combining the observations in several studies, Shaw [130] ( PbO - B 2 O 3 glass system) and Porai-Koshits et al. [133] ( SiO 2 - Na 2 O glass systems) link this phenomenon to the asymmetry of the miscibility gap, leading to the oversaturation of one component at lower temperature in one of the phases after the primary phase separation, thus, calling it secondary phase separation.
Secondary phase separation may occur in a glass that has already undergone phase separation once and the sample is reheated [133]. Figure 10 [133] shows an example of sodium silicate glass with 12.5 mol% Na 2 O . After annealing at 777 °C for 2 h, binodal phase separation occurred in the sample, with the matrix phase enriched in sodium (Figure 10a). Then, the sample was heat treated at 668 °C for 2 h. At this temperature, silica is oversaturated in the alkali-rich phase, resulting in a secondary phase separation in the matrix (Figure 10b). Lead borate glasses have also been investigated and phases rich in boron have a higher tendency to be exposed to the secondary phase separation according to the shape of the miscibility gap [130].
Generally, APS glasses may possess a large variety of structures depending on the initial chemical compositions and annealing protocols. These structures alter material properties, some of which will be discussed in the following sections.

5. Physical Properties of APS Glasses

The inherent structure of the glass and its amorphous phase separated counterpart could play a role in altering physical and mechanical/fracture glass properties. In this section, we take a closer look at how the APS structure of the glasses plays on the physical properties where Section 6 concentrates on the mechanical/fracture properties.
For homogeneous SBN glasses falling in zone I (Figure 6), first order mixing laws can be used to estimate the physical properties of SBN glasses [12,88,90,91]. These mixing laws commence with an estimate of the number of basic structural units (BO3/2, BO4/2ONa, BO2/2ONa, BO1/2O2Na2, Q4, Q3, Q2, and Q1) in the SBN system. Then, the physical properties can be calculated by accumulating these values depending on the chemical composition of the glass. From these structural units, Inoue et al. [91] developed a series of equations to estimate multiple physical properties: molar volume, refractive index, mean dispersion, coefficient of thermal expansion, and glass transition temperature of SBN glasses. These equations provide an estimate of the physical properties to within 10% of the experimental data [12,91]. This includes estimations in the immiscibility zones; yet they ignore the possibility of spatial structural heterogeneities in the material.
APS produces a large variety of structures in glasses. This affects the density calculations. Burnett and Douglas’ [77] investigations found that phase separation consists of two distinctive stages: (i) the decomposition stage when the developing phases gradually reaches the equilibrium composition; and (ii) the coarsening stage when the size of the phase separation regions increases without considerable changes in phase composition. At the end of the first stage, the dimension of phase separated regions are usually large enough to neglect the interfacial effects between different phases [82]. In this case, a two-phase glass can be considered as a composite material consisting of two different homogeneous substances, i.e., the tie-line end members.
In the remaining part of this section, we take a closer look at how density is affected by phase separation, and how it can be predicted using a model by knowing the tie-line end members parameters. Returning to the ideal A–B binary system, researchers [82,134,135] use numerical models to estimate the properties of two-phase materials (Appendix C contains a summary of variables used herein). Now, let us consider the zone of phase separation between P 1 and P 4 ( T 2 < T C in Figure 3) where the glass separates into phase α and phase β . Recalling phase α corresponds to the phase at P 1 in Figure 3, and phase β corresponds to the phase at P 4 . According to the conservation of mass, the total mass ( m T ) of the system shall be the sum of two phases or equivalently the components (for all the parameters used herein, superscripts α or β relate to the phases; subscripts A or B relate to the components):
m = m α + m β = m A + m B  
where m α and m β are the masses of phases α and β , m A and m B are the masses of component A and B, respectively. Knowing the density ( ρ ) of the system (i.e., mass divided by volume), one can substitute this into Equation (11) to get:
ρ V = ρ α V α + ρ β V β     ρ = 1 V ( ρ α V α + ρ β V β )
where ρ α and ρ β are the densities of phases α and β , V α and V β are the volumes of phases α and β , respectively. If one assumes that mixing phases α and β conserves the system volume, then the volume ( V ) is just the sum of the volume of each phase:
V = V α + V β
Combining Equations (12) and (13) gives:
ρ = ρ α + V β V ( ρ β ρ α )
Equations (11)–(14) assume uniform mixing. The lever rule permits a calculation of the mass fraction of each phase, w B α for phase α and w B β for phase β , with respect to the mass fraction of component B, w B .
w α = w B w B β w B α w B β = m α m w β = w B w B α w B β w B α = m β m
The lever law permits one to extrapolate the volumetric fraction V β / V in Equation (14).
V β V = ρ α ( w B w B α ) ( w B w B α ) ( ρ α ρ β ) + ( w B β w B α ) ρ β
Combining Equations (14) and (16) permits one to access the density [134]:
ρ = ρ α ρ β [ ( w B w B α ) / ( w B β w B α ) ] ( ρ α ρ β ) + ρ β
The first and secondary derivatives of Equation (17) with respect to w B are [134]
ρ w B = ρ α ρ β ( ρ α ρ β ) / ( w B β w B α ) { [ ( w B w B α ) / ( w B β w B α ) ] ( ρ α ρ β ) + ρ β } 2
2 ρ w B 2 = 2 ρ α ρ β [ ( ρ α ρ β ) / ( w B β w B α ) ] 2 { [ ( w B w B α ) / ( w B β w B α ) ] ( ρ α ρ β ) + ρ β } 3
From the above equations, the sign of the first derivative does not change with w B , and it depends on the quantitative comparison between ρ α and ρ β . Additionally, the second derivative is always positive. This shows that the curve of ρ as a function of one component’s initial weight fraction is convex.
As an example of this model applied to a binary oxide glass system, Shaw et al. [130,134] compared and contrasted experimental and theoretical results concerning the density of PbO - B 2 O 3 glass systems. The zone of phase separation is estimated to extend from 0.31 mol% PbO (1 wt% PbO) to 19.68 mol% PbO (44 wt% PbO), i.e., between the two tie-line end members. In this case, the phase parameters in the above equations correspond to these two tie-line end members. Figure 11a presents Shaw’s experimental data [134] (blue triangles) in comparison with the theoretical estimates (solid orange line) from Equation (17) for the density with respect to the weight fraction of PbO   ( w B ) . As shown in Figure 11, the experimental data compare favorably with estimations as a function of the PbO weight fraction. However, understanding how the density varies with respect to the volume fraction of the PbO -rich phase requires some additional insight.
Likewise, Figure 11b presents Shaw’s experimental data [130] (blue triangles) in comparison with the theoretical estimates (solid orange line) from Equation (14), density with respect to the volume fraction of the PbO -rich phase ( V β V ). Apart from a distinct region, the experimental results display a clear linear relation, which is consistent with the theoretical analysis Equation (14). According to Shaw’s analysis [130], the region where the linear relation is not valid comes from the occurrence of secondary phase separation due to the asymmetric shape of miscibility gap (see [130] for more details). In this case, a secondary PbO -rich phase occurs in the B 2 O 3 -rich phase, but they are too small to be measured. This leads to an underestimation of PbO -rich phase volume fraction, thus the deviation between experimental data points and theoretical analysis.
The comparison between experiments and theory shows the wide usability of Equations (16) and (17). This analysis is also valid for ternary and higher-order systems in a two-phase region. In these regions, the above equations are valid if one follows the tie line of constant temperature [130,135].

6. Mechanical/Fracture Properties of APS Glasses

Glass is one of the most common materials in daily life due to many advantageous properties, including transparency, thermal and chemical stability, etc. However, its biggest disadvantage is its brittleness, which limits its uses in many applications. This is still the case despite a long history of developments aiming at overcoming this drawback [136,137,138,139]. To understand the mechanical/fracture properties of APS glasses, Section 6.1 first takes a closer look at the Young’s modulus of APS glasses. It highlights the PbO - B 2 O 3 glass systems discussed in Section 5. Then, Section 6.2 addresses some fracture properties of APS glasses, including the interaction between the crack front and secondary phases during dynamic fracture (Section 6.2.1), fracture toughness (Section 6.2.2), sub-critical cracking (Section 6.2.3) and post-mortem fracture surface analysis (Section 6.2.4).

6.1. Young’s Modulus in Two-Phase Glasses

Considering the two-phase system, some theories have been proposed for the variation of elastic moduli [135]. Researchers encountered difficulties in obtaining the exact expressions while considering the mutual interaction of many secondary phase inclusions. Multiple models propose upper ( E U ) and lower bounds ( E L ) to predict the range of moduli values with tie-line end member phases parameters. The Voigt model assumes constant strain for the entire system and provides an upper bounds [135] (Equation (20)) for the Young’s modulus E V o i g t U . The Voigt estimation of Young’s modulus is formulated as follows:
E V o i g t U = ( 1 V β V ) E α + V β V E β
where E α and E β are the Young’s moduli of different phases and V β / V can be expressed by Equation (16).
On the other hand, the Reuss model assumes constant stress for the entire system and provides a lower bound for the Young’s modulus E R e u s s L [135]. The Reuss estimation of Young’s modulus is formulated as follows:
E R e u s s L = 1 ( 1 V β / V ) E α + V β / V E β
By using the principle of minimum potential energy and minimum complementary energy, Hashin and Shtrikman [140] proposed a finer model (HS model). This model first predicts upper and lower bounds for bulk ( K ) and shear ( G ) moduli. Appendix A provides the equations for calculating bounds of K and G . Invoking equations in Appendix A and the standard equation to calculate the Young’s modulus from K and G by
E = 9 K G 3 K + G
one obtains the Hashin and Shtrikman [140] bounds E H S U and E H S L for the Young’s modulus.
Considering boron-based glasses, a noteworthy series of experiments [135,141,142,143,144] compares and contrasts mechanical properties of PbO - B 2 O 3 glass systems. Appendix B compiles data concerning this series from various authors into a table (Table A1). Figure 12 plots the Young’s modulus as a function of the chemical composition for experimental data in Appendix B and in [135]. Recall the zone of APS extends from 0.31 mol% PbO (1 wt% PbO ) to 19.68 mol% PbO (44 wt% PbO ), which concerns the gray region in Figure 12. Data in the non-APS also appear in Figure 12 for comparisons purposes; it does not follow the trend seen in the APS zone. The Young’s modulus within the APS zone significantly increases from 17.5 GPa at 0.31 mol% PbO to 56.5 GPa at 19.68 mol% PbO . Data is within the zone predicted by the Voigt (red solid line) and Reuss (blue dotted line) models. However, the data lie below the HS limit (upper limit—green dash dotted line and lower limit—black solid line). Interestingly, the experimental results are between the lower bound of HS model and the Reuss bound. These two bounds constitute the predictive range of Young’s modulus for PbO - B 2 O 3 glass system in APS zones. Further investigations should be carried out to propose more precise predictive models.

6.2. Fracture Properties of APS Glasses

Recalling from the introduction, it is well-known that K C depends on the type of glass and the position of K e and Region I, II, III and the slope of Region I and III depend on parameters such as environmental factors and glass type. However, what is less understood is how APS structures alter the fracture behaviors of the glasses. This section reviews current literature concerning the effects of APS on dynamic fracture ( K I > K C ) and sub-critical cracking ( K I < K C ).

6.2.1. Dynamic Fracture in Multi-Phase Microstructure

As mentioned above, fracture can be divided into two types: dynamic cracking and sub-critical cracking. This section focuses on dynamic fracture, when crack propagation is too fast for environment factors to interact with the crack tip. In this case, theory suggests that secondary phase dispersions in brittle materials can influence the crack path, leading to variations in the fracture strength [145,146].
The presence of a secondary phase can yield toughening via different mechanisms, which can be separated into two main classes [147]. First, crack wake processes occur in the wake of a propagating crack front and reduce crack-driving forces. A common crack wake process is crack bridging [148,149], which occurs when a secondary crack nucleates ahead of a tough inclusion. This gives way to broken material ahead of the crack front [150]. Thus, stress will concentrate not only right ahead of the crack front but also around these damage areas. Hence, the applied stress intensity factor at the crack front decreases. Secondly, crack propagation processes also influence the crack tip dynamics. In this case, toughening comes from the direct interaction of the crack front with secondary phase inclusions. Several studies tried to establish the crack path motion by considering the crack front as an elastic line which interacts with obstacles in the system, including crack pinning [145,151], crack trapping [152,153,154] and crack deflection [155,156,157]. Extension to these mechanisms concerns avalanches of the crack front [158,159]. Figure 13 provides an oversimplified schematic of the interaction between the second phase and the crack. When an obstacle (the secondary phase herein) occurs ahead of the crack front, the crack front can circumvent the obstacle (Figure 13a) or traverse it (Figure 13b). The circumstances under which either occurs depend on multiple factors.
The first factor which should be considered in predicting the crack path is the fracture surface energy ( Γ ) for both the matrix ( Γ m ) and for the particles ( Γ p ). The fracture surface energy concerns the energy needed to create the fracture surface. A smaller fracture surface energy implies that it is easier to break the material. Like the fracture toughness ( K c ) , fracture surface energy defines a material’s resistance to fracture. Moreover, these two material constants are related: Γ = K c 2 / E where E refers to the Young’s modulus. Considering the case where Γ p > Γ m , the particle pins the crack front. Thus, this leads to an overall increase in the fracture surface energy [141,145,160]. Likewise, soft particles can also lead to higher fracture surface energies due to crack blunting [141,161,162].
Now take into consideration residual stress fields. The formation of APS glasses potentially leads to residual stresses, which depend on the local chemical composition. Due to phase separation (i.e., variations in the meso-scale chemical composition), the thermal expansion is potentially non-homogenous throughout the glass. Consider first the simple case of one precipitate (often considered a particle or inclusion in fracture mechanics) in an otherwise homogeneous matrix/system, where the coefficient of thermal expansion for the matrix and the particle, α m and α p respectively, are different. As the system begins to cool, the difference in the coefficients of thermal expansion of the two phases leads to the formation of residual stresses around the particle.
Selsing [163] provides theories concerning the development of stress during cooling based on differences in the coefficient of thermal expansion. Figure 14 depicts the orientation of the stress fields in matrix around a particle, along with the crack path, and how the crack path depends on the coefficient of thermal expansion and the fracture surface energy [141,163]. When the coefficient of thermal expansion for the matrix α m is greater than that of the particles α p ( α m > α p ), the matrix has a tendency to shrink more than the particle during cooling. This in turn puts the particle under compressive stresses. Meanwhile, the matrix is under radial compressive and tangential tensile stresses [141,163]. On the other hand, when α m < α p , the matrix has a tendency to shrink less than the particle during cooling. This shrinkage will put the particle under tensile stresses. However, the matrix will be under radial tensile and tangential compressive stresses [141,163]. These differences in thermal stresses can lead to micro-damage.
Comparing and contrasting residual stress occurring due to the thermal expansion with the fracture surface energy provides researchers with an idea as to whether a crack front will cut a particle in two or avoid it. Figure 14 recalls Miyata’s [141] works. In general, radial damage around or inside the particles will facilitate crack propagation and the crack tends to traverse the particles [141]. Hemispherical damage in the matrix around the particles will repel the approaching crack front [141]. For Γ m > Γ p , independent of the residual stresses (i.e., α m > α p or α m < α p ), the crack front will have a tendency to traverse the particle. For Γ m < Γ p and α m < α p , the crack front will have a tendency to bypass the particle. However, for Γ m < Γ p and α m > α p , the crack front path is uncertain; it can either circumvent or traverse the particle. Hence, the residual thermal stresses play an important role in predicting the crack path as shown in Figure 14.
The third factor studied by Miyata [141] is the elastic mismatch between two phases. Figure 15 shows the expected crack by combining the fracture surface energy and the shear modulus G path when an external tensile stress σ is applied to the sample. When Γ m < Γ p and G m > G p or G m < G p , the crack front will bypass the particle; yet when Γ m > Γ p and G m > G p or G m < G p , the crack front will traverse the particle. Micro-cracking due to stress concentrations is possible, which affects the crack orientation. This is similar to the effects of micro-cracking caused by residual thermal stresses.
Putting these theories together, Miyata et al. [141] studied PbO -rich particles in a B 2 O 3 -rich matrix (i.e., α m > α p ). Recall, the fracture surface energy is lower in the particles than the matrix ( Γ m > Γ p ). Furthermore, there is some elastic mismatch between the particles and the matrix: the Young’s modulus is greater in the particle ( E m < E p ). With all the theoretical analysis above, Miyata et al. [141] propose that the crack passes through the particles in this system. It should be noted that this scenario is in stark contrast with sub-critical cracking, which will be addressed in Section 6.2.3. The particles inhibit crack growth thus pin the crack front during slow crack propagation [164].
Likewise, Miyata et al. [141] studied B 2 O 3 -rich particles in a PbO -rich matrix (i.e., α m < α p , Γ m < Γ p , and E m > E p ). With all the theoretical analysis above, they proposed that the crack passes around the particles in this system.
To predict the fracture path for a real binodal phase separated glass system, many factors come into play, only a few of which have been detailed here. Other factors include phase morphology [165,166], interfacial interaction between the different phases [167,168], etc.

6.2.2. Effects of APS Structure on Fracture Toughness

As stated above, APS in glasses alters crack propagation at the mesoscale. Hence, macroscopic fracture properties should be influenced by these medium-range structural variations [169]. It has been widely considered that the presence of APS systematically increases the fracture toughness of the glass [143,166]. Several toughening mechanisms have been proposed to explain how heterogeneous inclusions affect the fracture behavior as it is mentioned at the beginning of Section 6.2.1 (crack pinning, deflection, trapping, etc.).
In addition, the toughening mechanisms due to the secondary phase have been studied using finite elements methods. In these simulations, Tang et al. modeled the crack behavior in an APS glass containing some spherical nano-inclusions [170]. In most cases, phase separation leads to an increase in the fracture energy of the glass, thus, an increase in fracture toughness. Their work also contributes to crack deflection, the effective cohesion of the phase-separated glass, the existence of plastic energy dissipation, and the roughness of the fracture surfaces.
Experimentally, fracture toughness investigations frequently rely on three-point or four-point bending tests or indentation tests. The next two subsections take a closer look at results from these types of experiments in a few SBN glasses. The last subsection reviews Miyata’s studies [141,143,144], which compares and contrasts the indentation test with bending tests in lead borate glasses.
  • Fracture Toughness from Indentation Tests
Indentation tests reveal a wealth of information concerning not only the hardness but also other interesting mechanical parameters, such as fracture toughness, cracking patterns, cracking probability, plastic deformation, irreversible deformation, etc. [20,124,171,172].
Cheng et al. [173] distinguished two different phase separation effects on crack behavior using a TEM to analyze cracking patterns after indentation. For borosilicate glasses with a boron-rich secondary phase, the medial/radial crack lengths are short since the precipitates limit the crack propagation. On the other hand, for soda-lime-silica glass consisting of a spinodal structure where one phase was relatively weaker, cracks forming at the corners of the indent propagate outside the area of observation. Hence long radial/medium cracks form.
Beyond cracking patterns, indentation investigations highlight the effects of APS on fracture toughness of SBN glass systems. Both Haller et al. [83] and Seal et al. [166] studied annealed glasses (annealing temperature and duration shown in Figure 16) with the following chemical composition: [ SiO 2 ] = 60.0%, [ B 2 O 3 ] = 30.0%, and [ Na 2 O ] = 10.0% (in mol%). According to Seal’s investigation [166], the interconnectivity between different phases in the glasses, which was obtained by TEM images, accounts for at least some of the changes in the fracture toughness. Samples annealed at 600 °C for 64 h present the highest indentation fracture toughness ( K c i n d ). Seal conjectured that phase separation interfaces, which are highly interconnected formed by annealing, restrain crack propagation. This, in turn, leads to an increase in K c i n d . At higher temperatures (at 700 °C for 24 h), the APS structure becomes spherical [83]. This transformation results in the reduction of the energy barrier for stopping the crack propagation. Thus, K c i n d decreases. Seal [166] concluded that phase separation with high interconnectivity potentially increases the fracture toughness.
b.
Fracture Toughness from Three-Point or Four-Point Bending Tests
As seen above, indentation tests do provide a measure for K c i n d . Moreover, indenters are commonly available in many labs and are applicable to many types of samples; thus, researchers frequently use the technique to acquire K c i n d measurements (see [174,175,176]). However, indentation tests do have a number of limitations (see [177] for more details); and when feasible, three-point or four-point bending tests provide more accurate measurements. Häßler and Rüssel [94] invoked the four-point bending test to examine the fracture toughness ( K c ) for the binodal decomposition ([ SiO 2 ] = 60%, [ B 2 O 3 ] = 37%, and [ Na 2 O ] = 3% (in mol%); presented in Section 4.1.1). With a strong mismatch between the thermal expansion coefficients of the two phases, the stresses formed around the secondary phase during cooling are considered to be responsible for increasing K c .
c.
Comparison between Results Obtained by Indentation and Three-Point Bending Tests
An interesting study concerns the reduced fracture toughness ( k K c i n d ) values from indentation tests in comparison with fracture toughness ( K c ) values from three-point bending tests (data listed in Appendix B) for PbO - B 2 O 3 glasses. Figure 17 presents data concerning fracture toughness obtained by different techniques as a function of the PbO mol% in PbO - B 2 O 3 glasses: three-point bending fracture toughness ( blue circles) [143] and relative fracture toughness values ( k K c i n d red squares) from indentation tests [143,144]. Recalling that zone of phase separation is estimated to extend from 0.31 PbO mol% to 19.68 PbO mol% (gray shaded zone in Figure 17). Miyata and Jinno [141] estimated these tie-line end members mechanical properties (black stars, row in gray in Appendix B). In order to obtain K c i n d , Miyata and Jinno originally estimated the prefactor k to be 0.61 via comparing indentation data to three-point bending for glasses with PbO mol% less than 21% [143]. In Figure 17, open green diamonds represent the data with k = 0.61 . Invoking Evans and Charles equations [174], Miyata and Jinno reassessed data in 1982 [144]. This study estimated k to be 0.69 to 0.70 for glasses with PbO mol% greater than 20%. Closed green diamonds in Figure 17 represent data with k = 0.70 . We have provided a visualization of these data for both k = 0.61 and k = 0.70 over the full data range to have an idea of the error in selecting the prefactor.
As was analyzed in Section 6.2.1 [141], for the PbO -rich particles/ B 2 O 3 -rich matrix where α m > α p , Γ m > Γ p , and E m < E p , the crack propagates preferentially through the PbO -rich phase; for the B 2 O 3 -rich particles/ PbO -rich matrix where α m < α p , Γ m < Γ p , and E m > E p , the crack propagates preferentially around the B 2 O 3 -rich “impenetrable” particles.
First, in the part corresponding to the PbO -rich particles/ B 2 O 3 -rich matrix (first half of Table A1) where the PbO fraction increases, the PbO -rich particle fraction and particle size increase. However, fracture surface energy and fracture toughness decrease. For the structure concerning B 2 O 3 -rich particles/ PbO -rich matrix (the middle of Table A1), the variation tendency of the two parameters with increasing PbO content is the same as that of PbO -rich particles/ B 2 O 3 -rich matrix: both the fracture toughness and the fracture surface energy decrease with increasing PbO content. The fracture toughness of B 2 O 3 -rich particle/ PbO -rich matrix is significantly higher than the other APS structure as well as the non-APS ones. It is worth noting that the glass with 12.8 mol% PbO has the highest fraction of “impenetrable” particles and possesses the highest fracture toughness compared with the others.
In summary, the structure of APS glass with “penetrable” or “impenetrable” particles has some influence on fracture toughness. The glass with highest fraction of “impenetrable” particles possesses the highest fracture toughness and should be more resistant to crack propagation.

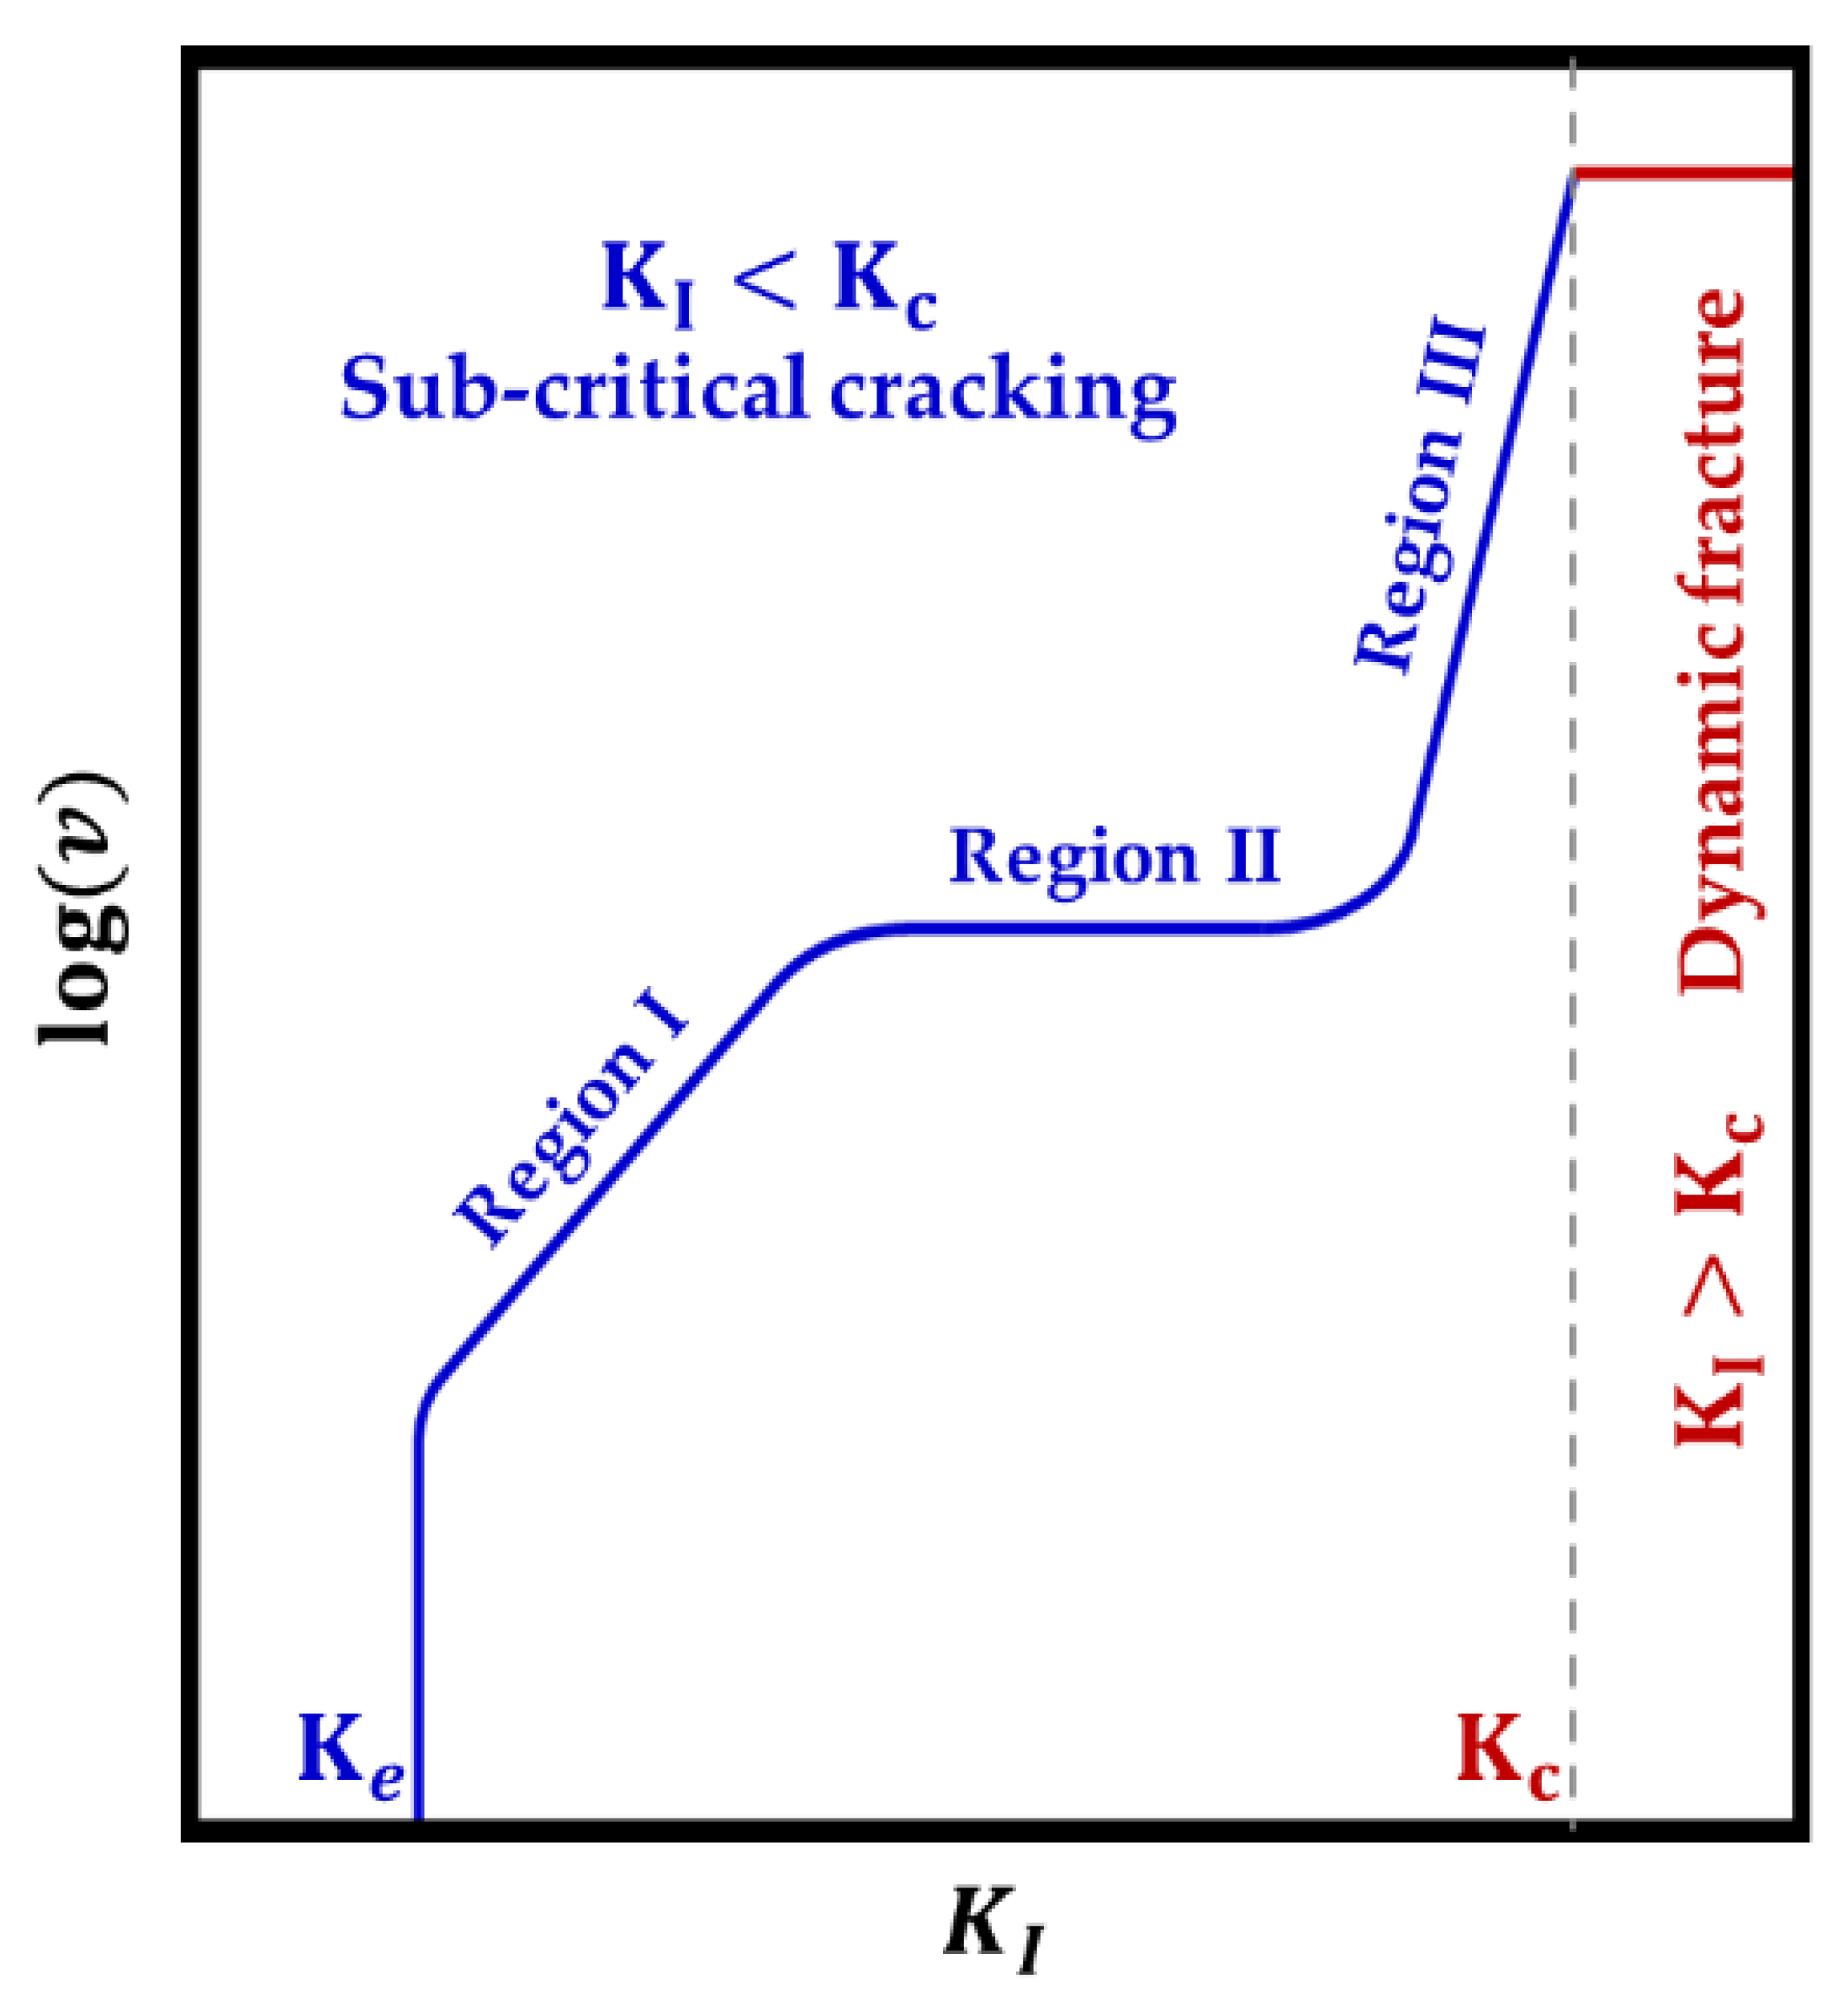
6.2.3. Sub-Critical Cracking of APS Glasses

Recalling Wiederhorn’s works ([8,9,29] reviewed in Section 1, dynamic fracture (see Section 6.2.1) concerns K I K C , but sub-critical cracking occurs when K I < K C . For sub-critical crack propagation, chemical interactions between the environment and the crack front become relevant. Hence, environmental factors should be taken into consideration to determine the crack path. Now, turning to APS systems, mesoscopic heterogeneities alter SCC behavior of the material. This section takes a closer look at how APS affects SCC behavior, more specifically, the interaction between crack front and secondary phase as well as the v K I curve.
  • Crack Front Interaction with Secondary Particulate Phase
Binodal structures can have either a pinning or a blunting effect on the crack front’s movement according to the differences in stress corrosion resistances between the matrix and the particles [164]. The PbO - B 2 O 3 glass system is a typical example of this kind of structure, which contains PbO -rich and B 2 O 3 -rich phases after binodal phase separation.
Since crack growth is slow, the fracture surface energy is no longer the most important factor in predicting the crack front orientation. Instead, resistance to SCC dominates the interaction between the crack front and the precipitates and determines whether the crack passes through the precipitate, or not. Figure 18a is a schematic illustrating the interaction between a growing crack and a particle in its wake predicted for PbO -rich particles/ B 2 O 3 -rich matrix glasses [164]. For this system, PbO -rich particles, which are supposed to be easier for the crack to pass through in dynamic fracture ( α m > α p and Γ m > Γ p [141]), are more resistant to stress corrosion; hence, the crack favors circumventing the particles in sub-critical cracking. Thus, it can be said that the particle works as an obstacle to inhibit the crack growth in the B 2 O 3 -rich matrix. Figure 18b shows the opposite configuration, with a B 2 O 3 -rich particle in a PbO -rich matrix. In this case, the crack penetrates into the B 2 O 3 -rich particle. Then, it blunts locally at the particle–matrix interface. This occurs because the matrix is not as easily broken due to its high corrosion resistance. This phenomenon inhibits the propagation of the crack front at the interface. Thus, the volume fraction of the secondary particles should impede the crack front propagation.
The two mechanisms above demonstrate how the existence of the secondary particle can modify the SCC behavior of an APS glassy system. Moreover, this suggests that the APS structure has the potential to increase the resistance to SCC in glassy systems. Similar mechanisms have been proposed for other material systems to explain the influence of structural heterogeneities on SCC [161,178].
b.
Effects of APS Structure on SCC Curve
Recalling Figure 1, cracks can grow unstably ( K I > K c ) or sub-critically ( K I < K c ). Section 6.2.2 reviews results concerning the fracture toughness K c of APS glasses. Concerning sub-critical crack propagation ( K I < K c ) in APS oxide glasses, data are significantly more limited. Thus, how APS influences the sub-critical crack propagation behavior is not well understood.
Nevertheless, some studies in literature indicate the presence of this effect. Figure 19 shows the SCC curves for an APS-SBN glass by Simmons et al. [146]. The chemical composition of the glass is [ SiO 2 ] = 70.0 mol%, [ B 2 O 3 ] = 23.0 mol%, and [ Na 2 O ] = 7.0 mol% (black square in Figure 6). This is the same chemical composition as the samples in Section 4.1.2 and are verified to have a spinodal structure. Different thermal treatment conditions (temperature and duration) were used to change the microstructure sizes and chemical composition. The system depicted in Figure 19 underwent four different thermal treatment protocols: Sample 1 (red stars) annealed at 550 °C for 6.5 h, phase size < 10   nm ; Sample 2 (blue triangles) annealed at 620 °C for 0.5 h, phase size ~ 15   nm ; Sample 3 (green diamonds) annealed at 620 °C for about 35 h, phase size ~ 60   nm ; and Sample 4 (yellow triangles) annealed at 650 °C for about 90 h, phase size ~ 150   nm . For Region II sub-critical cracking, all four cases have the same velocity value on the plateau. This is consistent with the theoretical analysis in Section 1: this value depends on the environmental water quantity. Thus, difference in the microstructure does not significantly affect the height of plateau in Region II. However, shifts of the curve exist in Region I. This implies that the dynamics in Region I significantly depend on the mesoscale structural arrangement. As the increase in secondary phase size occurs, Figure 19 depicts a shift to lower values of the stress intensity factor. Sample 4 with the largest secondary phase displays the greatest susceptibility to SCC since its curve lies on the far left side of the other three samples. It is noteworthy that the presence of a secondary phase promotes rather than impedes SCC for this glass. Simmons [146] considered that after high temperature annealing, the sodium concentration in the silica-rich phase is higher compared with lower temperature annealing. This induces a huge decrease in chemical durability in this phase, decreasing the glass resistance to corrosion and facilitating crack propagation. The mechanism of crack propagation in Region I is controlled by the changes in composition and durability of the silica-rich phase.

6.2.4. Fracture Surface Toughness Investigation

Most of the sections above discuss the interactions between a single secondary phase particle in matrix and the crack front during dynamic fracture or SCC at the mesoscopic scale. Comparing the simple model presented above (single particle in an infinite field) with the complex network shape after spinodal decomposition, the stress distribution of the latter is much more complex to analyze. However, the interaction between the crack front and the precipitates can still be predicted by analogy with the previous stress field analysis and by post-mortem fracture surface analysis via line models [179,180,181]. These line models provide insight on how the crack front propagates in such media. In these models, the crack front is considered as an elastic line that moves through a set of randomly distributed obstacles, and its dynamics depend on long-range elastic interactions along the rough crack front [182,183]. Moreover, the fracture surface roughness depends on the crack propagation speed, which is linked to the stress intensity factor K . When K is less than a threshold value K , the crack front stops propagating due to pinning effects [181]. If K is large enough, the front can overcome the obstacles and propagate. However, the velocity varies due to the obstruction. There is a competition between a roughening effect due to the randomly distributed secondary phase, and a smoothing effect due to elastic interactions along the front. The balance between these effects leads to a rich phenomenology. It is difficult to access these phenomena experimentally [184]. Hence, researchers turn to post-mortem fracture surfaces [185].
A number of studies have been carried out to investigate the fracture surface of glasses, mostly by AFM [186,187,188,189]. At the nanometer scales, these surfaces exhibit self-affine morphological features: the root mean square roughness R q as well as the roughness exponent (or Hurst exponent) ζ . For a given topography image, the relationship between them can be expressed as [188]:
R q ( L 0 ) = Z 4 l 1 ζ L 0 ζ
where Z 4 is a constant close to 1 mostly independent of the image resolution, L 0 is the image size, l is topothesy (a characteristic length-scale of the self-affine surface). The two parameters ζ and l provide a consistent characterization of the self-affine surface roughness, which is independent of the image size used to evaluate it. It is worth emphasizing here that these self-affine morphological scaling features are observed at small scales only (about 10   µ m ) [190].
Dalmas et al. [187] looked at fracture surfaces at large scales in a phase-separated glass ( [ SiO 2 ] = 70.0%, [ B 2 O 3 ] = 25.0%, [ Na 2 O ] = 2.5%, and [ K 2 O ] = 2.5%, in mol%). Specifically, the study concentrated on the out-of-plane roughness parallel to the direction of crack propagation in glass with domain sizes ranging from 20 to 100 nm via heat treatment, i.e., controlling annealing temperatures and duration [121]. Post-mortem fracture surfaces were generated by DCDC (double cleavage drilled compression) mechanical tests and the stress intensity factor was in the vicinity of the propagation threshold ( K ~ K ), i.e., sub-critical cracking. Their experimental results show that, at length scales larger than the phase domain size d , the height difference Δ h increases logarithmically with the in-plane distance Δ x parallel to the crack propagation direction. The relationship between Δ h and Δ x follows the equation [187]:
Δ h ( Δ x ) Δ h ( d ) = Z 5 l o g ( Δ x d ) + Z 6
where Z 5 and Z 6 are constants. This logarithmic roughness is compatible with theoretical [183] and numerical predictions [191] obtained in the framework of line models.
In Dalmas’ study, the roughness disorder is not a direct reflection of the structural disorder due to the lack of information at the length scale of the process zone. Moreover, AFM tip geometries may cause interference in the measurements at small scales [190,192]. Hence, depinning models of SBN oxide glasses currently provide limited information on the process zone size. Additional models should be used to supplement the existing results.

7. Conclusions and Outlook

The phenomenon of dynamic fracture and stress corrosion cracking in oxide glasses has been studied for years, yet phase separation (liquid–liquid immiscibility) has been less studied in literature. Herein, the co-authors have tried to provide a holistic viewpoint on failure mechanics, specifically dynamic fracture and stress corrosion, in APS oxide glasses based on literature. This includes a discussion on how the thermal history of the sample leads to APS in oxide glasses (Section 3) and subsequently how APS alters structural (Section 4), physical (Section 5), and mechanical/fracture (Section 6) properties of APS oxide glasses. While current literature lacks a complete description of these phenomena, some conclusions can still be drawn.
APS is a dominant feature of many multicomponent glass systems, which has several industrial uses, including glass-ceramics and porous glasses. According to thermodynamic analysis, the morphology of the different phases can be described as discrete secondary particles (binodal structures) or as complex three-dimensional interconnected structures (spinodal structures). Kinetics and thermal history both affect the resulting structure. The widely used ternary glass system SiO 2 - B 2 O 3 - Na 2 O is hypothesized to undergo two- and three-phase separation according to the experimental investigation of the miscibility gaps [81,83]. However, the estimation of APS by macro-opalescence during those experiments is not rigorous. In the future, CALPHAD methods could provide keys to predict the liquid phase miscibility gap in glass systems, but there are still some hurdles to overcome.
Currently, with the aid of advanced microscopy techniques, different phase separated structures, including binodal and spinodal, as well as secondary phase separation, have been evidenced and characterized (phase shape, size, etc.). The mesoscale heterogeneity of those structures is accompanied by some effects on the material properties. For a binary APS glass system, a series of equations can be used to calculate some properties (density and elastic moduli) and compare with experimental data. Concerning the fracture properties of APS glasses, experimental results showed that the presence of two-phase domains or multiphase structures in glasses affect dynamic fracture as well as sub-critical cracking behavior. The interaction between secondary phases and the crack front can be estimated by considering various properties in the different phases. Concerning dynamic fracture, glasses with a large fraction of particles acting as obstacles due to their higher fracture surface energy possess a higher fracture toughness. Thus, they are more resistant to crack propagation in the binodal system due to the pinning mechanism. Another proposed mechanism concerns spinodal structures, the high interconnectivity in these spinodal structures aids in increasing the fracture toughness. SCC experiments show that the chemical compositions of phases have notable effects on the sample’s behavior. For the chosen SBN glass in Figure 19, annealing at high temperature implies much lower chemical durability in the matrix phase and thus higher susceptibility to SCC. Nevertheless, for other chemical compositions or other annealing conditions, is it possible to achieve an improvement on SCC resistance compared with the homogeneous pristine samples? This remains an unanswered question, which could ultimately improve glasses’ resistance to SCC.
In general, to control the chemical composition, the form and the scale of APS structures would seem to offer notable potential to improve glass mechanical, dynamic fracture, and stress corrosion cracking properties. However, the existing studies are not sufficient to realize this potential, most notably for the SBN glasses, which are widely used in industry. Can glass properties be optimized by controlling phase separation? More investigations, including simulations and experiments, should be carried out to analyze and understand their effects.

Author Contributions

Conceptualization, all authors; SNB42 sample fabrication, F.C. and P.H.; SNB42 sample formal analysis and investigation, W.F., F.C., P.H. and C.L.R.; writing—original draft preparation, W.F.; writing—review and editing, W.F., D.B., F.C., P.C.M.F., S.G., P.H. and C.L.R.; project administration, F.C., S.G. and C.L.R.; funding acquisition, D.B., F.C., P.H., S.G. and C.L.R. All authors have read and agreed to the published version of the manuscript.

Funding

This work has been supported by a number of funding agencies including Commissariat à l’énergie atomique et aux énergies alternatives (CEA), Triangle de la Physique (RTRA), Ile-de-France (DIM-MAP, C’Nano and ISC-PIF), PHOM, and ANR (ANR-17-CE08-0004).

Institutional Review Board Statement

Not applicable.

Informed Consent Statement

Not applicable.

Data Availability Statement

The data presented in this study are available on reasonable request from the corresponding author.

Acknowledgments

The co-authors would like to acknowledge Rémy Baniel’s work during his internship under the direction of Fabrice Célarié concerning the fabrication and preliminary characterizations on the SBN42 samples reported herein.

Conflicts of Interest

The authors declare no conflict of interest.

Appendix A. Hashin and Shtrikman Model for Predicting the Range of Moduli for Two-Phase Materials

Hashin and Shtrikman [140] found an improved model to predict the range of moduli for a two-phase material. The following equations show the predictive ranges of bulk and shear moduli for the case K β > K α , G β > G α :
K H S U = K β + 1 V β / V 1 K α K β + 3 V β / V 3 K β + 4 G β G H S U = G β + 1 V β / V 1 G α G β + 6 ( K β + 2 G β ) V β / V 5 G β ( 3 K β + 4 G β )
K H S L = K α + V β / V 1 K β K α + 3 ( 1 V β / V ) 3 K α + 4 G α G H S L = G α + V β / V 1 G β G α + 6 ( K α + 2 G α ) ( 1 V β / V ) 5 G α ( 3 K α + 4 G α )
where K α and K β are the bulk moduli of different phases, G α and G β are the shear moduli of different phases, and V β / V can be expressed by Equation (16).

Appendix B. Table with Mechanical/Fracture Properties for PbO - B 2 O 3 Glass System

This appendix gathers different mechanical/fracture properties concerning the PbO - B 2 O 3 glass system in Table A1. Recalling that PbO - B 2 O 3 glass systems undergo a binodal decomposition structure, the zone of phase separation is estimated to extend from 0.31 mol% PbO (1 wt% PbO ) to 19.68 mol% PbO (44 wt% PbO ) (see Section 6). Miyata and Jinno [141] estimated these tie-line end members’ mechanical properties (row in grey in Table A1). The parameters in Table A1 include the chemical composition of the glass, Young’s Modulus ( E ), fracture toughness ( K c ), and fracture surface energy ( Γ ). The fracture surface energy Γ can be calculated by the following equation [193]:
Γ = ( 1 ν 2 ) K c 2 2 E
where ν is the Poisson ratio.
For comparison, data herein concern not only the APS [141,143] zone but also the non-APS zone [142].
Table A1. Mechanical properties of PbO - B 2 O 3 glass system including APS zone [141,143] and non-APS zone [142].
PbO   mol % . Volume   Fraction   of   PbO - Rich   Phase Fracture   Toughness   K c   ( MPa · m 0.5 ) Young s   Modulus   E   ( GPa ) Fracture   Surface   Energy   Γ   ( J · m 2 ) References
Indentation - k K c 3-Points Bending
0- 0.544 ± 0.050 -17.324.5[141,143]
APS glasses    Non-APS glasses
0.31 0.94717.523.9[141]
1.620.05 0.528 ± 0.032 -18.721.4[141,143]
3.350.13 0.488 ± 0.035 -20.216.9[141,143]
4.450.18 0.472 ± 0.026 0.819 ± 0.094 21.015.2[141,143]
6.010.25 0.475 ± 0.036 0.842 ± 0.066 22.314.5[141,143]
PbO -rich spherical particles in B 2 O 3 -rich matrix     B 2 O 3 -rich spherical particles in PbO -rich matrix
12.800.59 0.994 ± 0.140 1.59 ± 0.20 31.237.6[141,143]
14.38-- 34.5-[141,143]
14.930.71 0.848 ± 0.123 1.38 ± 0.22 36.224.4[141,143]
17.220.84 0.786 ± 0.090 1.33 ± 0.27 44.518.4[141,143]
19.68 0.96056.57.56[141]
APS glasses   Non-APS glasses
20.33- 0.581 ± 0.046 0.906 ± 0.105 60.46.30[142]
25- 0.485 ± 0.036 -56.53.94[142]
30- 0.477 ± 0.029 -59.33.62[142]
35- 0.492 ± 0.037 -62.33.66[142]
40- 0.485 ± 0.042 -64.13.46[142]
45- 0.469 ± 0.028 -61.43.38[142]
50- 0.425 ± 0.028 -60.32.82[142]
55- 0.404 ± 0.027 -54.22.83[142]
60- 0.347 ± 0.032 -49.62.28[142]

Appendix C. Nomenclature

SymbolMeaningEquation
X A Number of moles of component A
X B Number of moles of component B
x A Mole fraction of component A x A = X A / ( X A + X B ) (A4)
x B Mole fraction of component B x B = X B / ( X A + X B ) (A5)
μ A Chemical potential of component A
μ B Chemical potential of component B
μ A α Chemical potential of component A in phase α
μ A β Chemical potential of component A in phase β
μ B α Chemical potential of component B in phase α
μ B β Chemical potential of component B in phase β
m A Mass of component A m A = w A m = m A α + m A β (A6)
m B Mass of component B m B = w B m = m B α + m B β (A7)
m α Mass of phase α m α = w α m = m A α + m B α (A8)
m β Mass of phase β m β = w β m = m A β + m B β (A9)
m Mass system assuming conservation of mass m = m A + m B = m α + m β (A10)
m B α Mass of component B in phase α m B α = w B α m α (A11)
m A α Mass of component A in phase α m A α = w A α m α (A12)
m B β Mass of component B in phase β m B β = w B β m β (A13)
m A β Mass of component A in phase β m A β = w A β m β (A14)
w A α Mass fraction of component A in phase α w A α = m A α / m α (A15)
w A β Mass fraction of component A in phase β w A β = m A β / m β (A16)
w B α Mass fraction of component B in phase α w B α = m B α / m α (A17)
w B β Mass fraction of component B in phase β w B β = m B β / m β (A18)
w α Mass fraction in phase α w α = m α / m (A19)
w β Mass fraction in phase β w β = m β / m (A20)
w A Mass fraction of component A w A = m A / m (A21)
w B Mass fraction of component B w B = m B / m (A22)
Γ m Fracture surface energy for matrix
Γ p Fracture surface energy for particles
α m Coefficient of thermal expansion for matrix
α p Coefficient of thermal expansion for particles
G m Shear modulus for matrix

References

  1. Charleston, R.J.; Fisher, J.E.; Michael, J. Masterpieces of Glass: A World History from the Corning Museum of Glass; HN Abrams: New York, NY, USA, 1990; ISBN 0810924641. [Google Scholar]
  2. Barlet, M. Evolution of Mechanical Properties of Silicate Glasses: Impact of the Chemical Composition and Effects of Irradiation. Ph.D. Thesis, École Polytechnique, Palaiseau, France, 2014. [Google Scholar]
  3. Barlet, M.; Delaye, J.-M.; Boizot, B.; Caraballo, R.; Peuget, S.; Rountree, C.L. From network polymerization to stress corrosion cracking in sodium-borosilicate glasses: Effect of the chemical composition. J. Non-Cryst. Solids 2016, 450, 174–184. [Google Scholar] [CrossRef] [Green Version]
  4. Rountree, C.L. Recent progress to understand stress corrosion cracking in sodium borosilicate glasses: Linking the chemical composition to structural, physical and fracture properties. J. Phys. D Appl. Phys. 2017, 50, 343002. [Google Scholar] [CrossRef] [Green Version]
  5. Koike, A.; Tomozawa, M.; Ito, S. Sub-critical crack growth rate of soda-lime-silicate glass and less brittle glass as a function of fictive temperature. J. Non-Cryst. Solids 2007, 353, 2675–2680. [Google Scholar] [CrossRef]
  6. Koike, A.; Tomozawa, M. Fictive temperature dependence of subcritical crack growth rate of normal glass and anomalous glass. J. Non-Cryst. Solids 2006, 352, 5522–5530. [Google Scholar] [CrossRef]
  7. Ciccotti, M. Stress-corrosion mechanisms in silicate glasses. J. Phys. D Appl. Phys. 2009, 42, 214006. [Google Scholar] [CrossRef] [Green Version]
  8. Wiederhorn, S.M. Influence of water vapor on crack propagation in soda-lime glass. J. Am. Ceram. Soc. 1967, 50, 407–414. [Google Scholar] [CrossRef]
  9. Wiederhorn, S.M.; Freiman, S.W.; Fuller, E.R.; Simmons, C.J. Effects of water and other dielectrics on crack-growth. J. Mater. Sci. 1982, 17, 3460–3478. [Google Scholar] [CrossRef]
  10. Wiederhorn, S.M.; Johnson, H.; Diness, A.M.; Heuer, A.H. Fracture of glass in vacuum. J. Am. Ceram. Soc. 1974, 57, 336–341. [Google Scholar] [CrossRef]
  11. Célarié, F. Dynamique de Fissuration a Basse Vitesse des Matériaux Vitreux. Ph.D. Thesis, Université Montpellier II-Sciences et Techniques du Languedoc, Montpellier, France, 2004. [Google Scholar]
  12. Barlet, M.; Kerrache, A.; Delaye, J.-M.; Rountree, C.L. SiO2-Na2O-B2O3 density: A comparison of experiments, simulations, and theory. J. Non-Cryst. Solids 2013, 382, 32–44. [Google Scholar] [CrossRef] [Green Version]
  13. Bray, P.J.; Geissberger, A.E.; Bucholtz, F.; Harris, I.A. Glass structure. J. Non-Cryst. Solids 1982, 52, 45–66. [Google Scholar] [CrossRef]
  14. Rouxel, T. Elastic properties and short-to medium-range order in glasses. J. Am. Ceram. Soc. 2007, 10, 3019–3039. [Google Scholar] [CrossRef]
  15. Soules, T.F. A molecular dynamic calculation of the structure of sodium silicate glasses. J. Chem. Phys. 1979, 71, 4570–4578. [Google Scholar] [CrossRef]
  16. Zachariasen, W.H. The atomic arrangement in glass. J. Am. Chem. Soc. 1932, 54, 3841–3851. [Google Scholar] [CrossRef]
  17. Grandjean, A.; Malki, M.; Simonnet, C.; Manara, D.; Penelon, B. Correlation between electrical conductivity, viscosity, and structure in borosilicate glass-forming melts. Phys. Rev. B 2007, 75, 054112. [Google Scholar] [CrossRef]
  18. Ritland, H.N. Relation between refractive index and density of a glass at constant temperature. J. Am. Ceram. Soc. 1955, 38, 86–88. [Google Scholar] [CrossRef]
  19. Barlet, M.; Delaye, J.-M.; Gennisson, M.; Caraballo, R.; Boizot, B.; Bonamy, B.; Rountree, C.L. Influence of electronic irradiation on failure and hardness properties of pure silica glasses. Procedia Mater. Sci. 2014, 7, 286–293. [Google Scholar] [CrossRef]
  20. Barlet, M.; Delaye, J.-M.; Charpentier, T.; Gennisson, M.; Bonamy, D.; Rouxel, T.; Rountree, C.L. Hardness and toughness of sodium borosilicate glasses via Vicker’s indentations. J. Non-Cryst. Solids 2015, 417–418, 66–79. [Google Scholar] [CrossRef] [Green Version]
  21. Makishima, A.; Mackenzie, J.D. Calculation of bulk modulus, shear modulus and Poisson’s ratio of glass. J. Non-Cryst. Solids 1975, 17, 147–157. [Google Scholar] [CrossRef]
  22. Overend, M.; Parke, G.A.; Buhagiar, D. Predicting failure in glass—A general crack growth model. J. Struct. Eng. 2007, 133, 1146–1155. [Google Scholar] [CrossRef] [Green Version]
  23. Beason, W.L.; Morgan, J.R. Glass failure prediction model. J. Struct. Eng. 1984, 110, 197–212. [Google Scholar] [CrossRef]
  24. Rouxel, T.; Yoshida, S. The fracture toughness of inorganic glasses. J. Am. Chem. Soc. 2017, 100, 4374–4396. [Google Scholar] [CrossRef]
  25. Sih, G.C. Fracture toughness concept. In Properties Related to Fracture Toughness; ASTM International: West Conshohocken, PA, USA, 1976. [Google Scholar]
  26. Calabrese, L.; Proverbio, E. A review on the applications of acoustic emission technique in the study of stress corrosion cracking. Corros. Mater. Degrad. 2021, 2, 1–30. [Google Scholar] [CrossRef]
  27. Raja, V.S.; Shoji, T. Stress Corrosion Cracking: Theory and Practice; Elsevier: Amsterdam, The Netherlands, 2011; ISBN 978-1-84569-673-3. [Google Scholar]
  28. Sih, G.C. Mechanics of subcritical crack growth. In Fracture Mechanics Technology Applied to Material Evaluation and Structure Design; Sih, G.C., Ryan, N.E., Jones, R., Eds.; Springer: Dordrecht, The Netherlands, 1983; pp. 3–18. ISBN 978-94-009-6914-8. [Google Scholar]
  29. Wiederhorn, S.M.; Bolz, L.H. Stress corrosion and static fatigue of glass. J. Am. Ceram. Soc. 1970, 53, 543–548. [Google Scholar] [CrossRef]
  30. Bernstein, J. Polymorphism in Molecular Crystals 2e; International Union of Crystal: Chester, England, 2020; Volume 30, ISBN 9780199655441. [Google Scholar]
  31. Findlay, A. The Phase Rule and Its Applications; Longmans, Green: Harlow, UK, 1904. [Google Scholar]
  32. Glasstone, S. Text-Book of Physical Chemistry; Van Nostrand Co.: New York, NY, USA, 1940. [Google Scholar]
  33. Möbus, G.; Ojovan, M.; Cook, S.; Tsai, J.; Yang, G. Nano-scale quasi-melting of alkali-borosilicate glasses under electron irradiation. J. Nucl. Mater. 2010, 396, 264–271. [Google Scholar] [CrossRef]
  34. Cahn, J.W. Phase separation by spinodal decomposition in isotropic systems. J. Chem. Phys. 1965, 42, 93–99. [Google Scholar] [CrossRef]
  35. James, P.F. Liquid-phase separation in glass-forming systems. J. Mater. Sci. 1975, 10, 1802–1825. [Google Scholar] [CrossRef]
  36. Charles, R.J. Metastable immiscibility in BaO-Li2O-SiO2 system. Phys. Chem. Glasses 1967, 8, 185. [Google Scholar]
  37. Kim, S.S.; Sanders, T.H., Jr. Thermodynamic modeling of phase diagrams in binary alkali silicate systems. J. Am. Ceram. Soc. 1991, 74, 1833–1840. [Google Scholar] [CrossRef]
  38. Mazurin, O.V.; Porai-Koshits, E.A. Phase Separation in Glass; Elsevier: Amsterdam, The Netherlands, 1984; ISBN 9780080983653. [Google Scholar]
  39. Ghanbari-Ahari, K.; Cameron, A.M. Phase diagram of Na2O-B2O3-SiO2 system. J. Am. Ceram. Soc. 1993, 76, 2017–2022. [Google Scholar] [CrossRef]
  40. Kim, S.S.; Sanders, T.H., Jr. Calculation of subliquidus miscibility gaps in the Li2O-B2O3-SiO2 system. Ceram. Int. 2000, 26, 769–778. [Google Scholar] [CrossRef]
  41. Polyakova, I.G. Alkali borosilicate systems: Phase diagrams and properties of glasses. Phys. Chem. Glasses 2000, 41, 247–258. [Google Scholar]
  42. Bouttes, D. Micro-Tomographie d’un Borosilicate de Baryum Démixé: Du Mûrissement à la Fragmentation. Ph.D. Thesis, ParisTech, Paris, France, 2014. [Google Scholar]
  43. Bouttes, D.; Gouillart, E.; Boller, E.; Dalmas, D.; Vandembroucq, D. Fragmentation and limits to dynamical scaling in viscous coarsening: An interrupted in situ X-ray tomographic study. Phys. Rev. Lett. 2014, 112, 245701. [Google Scholar] [CrossRef] [PubMed] [Green Version]
  44. Bouttes, D.; Lambert, O.; Claireaux, C.; Woelffel, W.; Dalmas, D.; Gouillart, E.; Lhuissier, P.; Salvo, L.; Boller, E.; Vandembroucq, D. Hydrodynamic coarsening in phase-separated silicate melts. Acta Mater. 2015, 92, 233–242. [Google Scholar] [CrossRef] [Green Version]
  45. Bouttes, D.; Gouillart, E.; Vandembroucq, D. Topological symmetry breaking in viscous coarsening. Phys. Rev. Lett. 2016, 117, 145702. [Google Scholar] [CrossRef] [Green Version]
  46. Mazurin, O.V.; Roskova, G.P.; Kluyev, V.P. Properties of phase-separated soda-silica glasses as a means of investigation of their structure. Discuss. Faraday Soc. 1970, 50, 191–199. [Google Scholar] [CrossRef]
  47. Oliveira, J.M.; Correia, R.N.; Fernandes, M.H. Effect of SiO2 on amorphous phase separation of CaO-P2O5-SiO2-MgO glasses. J. Non-Cryst. Solids 2000, 273, 59–63. [Google Scholar] [CrossRef]
  48. Gueguen, Y.; Houizot, P.; Célarié, F.; Chen, M.; Hirata, A.; Tan, Y.; Allix, M.; Chenu, S.; Roux-Langlois, C.; Rouxel, T. Structure and viscosity of phase-separated BaO-SiO2 glasses. J. Am. Ceram. Soc. 2017, 100, 1982–1993. [Google Scholar] [CrossRef]
  49. Pye, L.D.; Ploetz, L.; Manfredo, L. Physical properties of phase separated soda-silica glasses. J. Non-Cryst. Solids 1974, 14, 310–321. [Google Scholar] [CrossRef]
  50. Hammel, J.; Allersma, T. Method of Making Thermally Stable and Crush Resistant Microporous Glass Catalyst Supports. U.S. Patent 3843341A, 22 October 1974. [Google Scholar]
  51. Enke, D.; Janowski, F.; Schwieger, W. Porous glasses in the 21st century—A short review. Microporous Mesoporous Mater. 2003, 60, 19–30. [Google Scholar] [CrossRef]
  52. Ramsden, A.H.; James, P.F. The effects of amorphous phase separation on crystal nucleation kinetics in BaO-SiO2 glasses. J. Mater. Sci. 1984, 19, 1406–1419. [Google Scholar] [CrossRef]
  53. Suzuki, M.; Tanaka, T. Materials design for the fabrication of porous glass using phase separation in multi-component borosilicate glass. ISIJ Int. 2008, 48, 1524–1532. [Google Scholar] [CrossRef] [Green Version]
  54. Deubener, J.; Allix, M.; Davis, M.J.; Duran, A.; Höche, T.; Honma, T.; Komatsu, T.; Krüger, S.; Mitra, I.; Müller, R.; et al. Updated definition of glass-ceramics. J. Non-Cryst. Solids 2018, 501, 3–10. [Google Scholar] [CrossRef]
  55. Zhong, J.; Chen, D.; Peng, Y.; Lu, Y.; Chen, X.; Li, X.; Ji, Z. A review on nanostructured glass ceramics for promising application in optical thermometry. J. Alloys Compd. 2018, 763, 34–48. [Google Scholar] [CrossRef]
  56. Fafet, G.P.; Fredholm, A.M. Glass-Ceramic Cooking Plate for Gas Cookers, and Method for Making Same. U.S. Patent 5931152A, 3 August 1999. [Google Scholar]
  57. Höland, W.; Ritzberger, C.; Rheinberger, V.; Apel, E. Dental Glass Ceramics. U.S. Patent 7846857B2, 7 December 2010. [Google Scholar]
  58. Höland, W.; Rheinberger, V.; Schweiger, M. Control of nucleation in glass ceramics. Philos. Trans. R. Soc. London. Ser. A Math. Phys. Eng. Sci. 2003, 361, 575–589. [Google Scholar] [CrossRef]
  59. Tomozawa, M. Liquid-phase separation and crystal nucleation in Li2O-SiO2 glasses. Phys. Chem. Glasses 1972, 13, 161. [Google Scholar]
  60. Kleebusch, E.; Patzig, C.; Krause, M.; Hu, Y.; Höche, T.; Rüssel, C. The effect of TiO2 on nucleation and crystallization of a Li2O-Al2O3-SiO2 glass investigated by XANES and STEM. Sci. Rep. 2018, 8, 2929. [Google Scholar] [CrossRef] [PubMed] [Green Version]
  61. Uhlmann, D.R.; Goldstein, M.; Scholes, S.; Barry, T.I.; Zarzycki, J.; Tomozawa, M.; MacCrone, R.K.; Porai-Koshits, E.A.; Andreev, N.S.; Mazurin, O.V.; et al. General discussion. Discuss. Faraday Soc. 1970, 50, 222–240. [Google Scholar] [CrossRef]
  62. Gangopadhyay, A.K.; Croat, T.K.; Kelton, K.F. The effect of phase separation on subsequent crystallization in Al88Gd6La2Ni4. Acta Mater. 2000, 48, 4035–4043. [Google Scholar] [CrossRef]
  63. Höche, T.; Mäder, M.; Bhattacharyya, S.; Henderson, G.S.; Gemming, T.; Wurth, R.; Rüssel, C.; Avramov, I. ZrTiO4 crystallisation in nanosized liquid–liquid phase-separation droplets in glass–a quantitative XANES study. CrystEngComm 2011, 13, 2550–2556. [Google Scholar] [CrossRef]
  64. Pannhorst, W. Glass ceramics: State-of-the-art. J. Non-Cryst. Solids 1997, 219, 198–204. [Google Scholar] [CrossRef]
  65. Suzuki, M.; Tanaka, T. Thermodynamic prediction of spinodal decomposition in multi-component silicate glass for design of functional porous glass materials. High Temp. Mater. Processes 2012, 31, 323–328. [Google Scholar] [CrossRef]
  66. Koketsu, N.; Zhang, Z.; Kotani, Y.; Sugiyama, A.; Takashima, K. Method for Manufacturing Porous Glass, and Method for Manufacturing Optical Element. U.S. Patent 9162920B2, 20 October 2015. [Google Scholar]
  67. Hosono, H.; Abe, Y. Silver ion selective porous lithium titanium phosphate glass-ceramics cation exchanger and its application to bacteriostatic materials. Mater. Res. Bull. 1994, 29, 1157–1162. [Google Scholar] [CrossRef]
  68. Kuraoka, K.; Chujo, Y.; Yazawa, T. Hydrocarbon separation via porous glass membranes surface-modified using organosilane compounds. J. Membr. Sci. 2001, 182, 139–149. [Google Scholar] [CrossRef]
  69. Safronsky, E.D.; Roizin, Y.O.; Rysiakiewicz-Pasek, E. Application of porous glasses for humidity control. Opt. Mater. 1996, 5, 217–220. [Google Scholar] [CrossRef]
  70. Hermann, M.; Gottschalk, U. Large-scale immobilization of antibodies on porous glass carriers. Bioforum 2000, 3, 172. [Google Scholar]
  71. Hoffmann, M.; Kreft, S.; Georgi, G.; Fulda, G.; Pohl, M.-M.; Seeburg, D.; Berger-Karin, C.; Kondratenko, E.V.; Wohlrab, S. Improved catalytic methane combustion of Pd/CeO2 catalysts via porous glass integration. Appl. Catal. B 2015, 179, 313–320. [Google Scholar] [CrossRef]
  72. Dong, W.-Y.; Long, Y.-C. Preparation and characterization of preferentially oriented continuous MFI-type zeolite membranes from porous glass. Microporous Mesoporous Mater. 2004, 76, 9–15. [Google Scholar] [CrossRef]
  73. Lopez-Orozco, S.; Inayat, A.; Schwab, A.; Selvam, T.; Schwieger, W. Zeolitic materials with hierarchical porous structures. Adv. Mater. 2011, 23, 2602–2615. [Google Scholar] [CrossRef]
  74. Cui, Z.; Huang, Y.; Liu, H. Predicting the mechanical properties of brittle porous materials with various porosity and pore sizes. J. Mech. Behav. Biomed. Mater. 2017, 71, 10–22. [Google Scholar] [CrossRef]
  75. Takamori, T.; Tomozawa, M. HCl leaching rate and microstructure of phase-separated borosilicate glasses. J. Am. Ceram. Soc. 1978, 61, 509–512. [Google Scholar] [CrossRef]
  76. Marshall, W.P.; Hammel, J.J.; Barch, H.W.; Hegedus, R.D.; Robertson, W.J. Silica-Rich Porous Substrates with Reduced Tendencies for Breaking or Cracking. U.S. Patent 4933307A, 12 June 1990. [Google Scholar]
  77. Burnett, D.G.; Douglas, R.W. Liquid-liquid phase separation in soda-lime-silica system. Phys. Chem. Glasses 1970, 11, 125. [Google Scholar]
  78. Cottrell, A.H. Theoretical Structural Metallurgy; Edward Arnold: London, UK, 1960. [Google Scholar]
  79. Campbell, F.C. Phase Diagrams: Understanding the Basics; ASM International: Almere, The Netherlands, 2012; ISBN 9781615039869. [Google Scholar]
  80. Varshneya, A.K. Fundamentals of Inorganic Glasses; Elsevier: Amsterdam, The Netherlands, 2013; ISBN 9780128162262. [Google Scholar]
  81. Haller, W.; Blackburn, D.H.; Simmons, J.H. Miscibility gaps in alkali-silicate binaries—Data and thermodynamic interpretation. J. Am. Ceram. Soc. 1974, 57, 120–126. [Google Scholar] [CrossRef]
  82. Mazurin, O.V. Physical properties of phase separated glasses. J. Non-Cryst. Solids 1987, 95, 71–82. [Google Scholar] [CrossRef]
  83. Haller, W.; BlackBurn, D.H.; Wagstaff, F.E.; Charles, R.J. Metastable immiscibility surface in the system Na2O-B2O3-SiO2. J. Am. Ceram. Soc. 1970, 53, 34–39. [Google Scholar] [CrossRef]
  84. Shaw, R.R.; Uhlmann, D.R. Subliquidus immiscibility in binary alkali borates. J. Am. Ceram. Soc. 1968, 51, 377–382. [Google Scholar] [CrossRef]
  85. Charles, R.J. Origin of immiscibility in silicate solutions. Phys. Chem. Glasses 1969, 10, 169. [Google Scholar]
  86. Hudon, P.; Baker, D.R. The nature of phase separation in binary oxide melts and glasses. I. Silicate systems. J. Non-Cryst. Solids 2002, 303, 299–345. [Google Scholar] [CrossRef]
  87. McGahay, V.; Tomozawa, M. The origin of phase separation in silicate melts and glasses. J. Non-Cryst. Solids 1989, 109, 27–34. [Google Scholar] [CrossRef]
  88. Budhwani, K.; Feller, S. A density model for the lithium, sodium and potassium borosilicate glass systems. Phys. Chem. Glasses 1995, 36, 183–190. [Google Scholar]
  89. Dell, W.J.; Bray, P.J.; Xiao, S.Z. 11B NMR-studies and structural modeling of Na2O-B2O3-SiO2 glasses of high soda content. J. Non-Cryst. Solids 1983, 58, 1–16. [Google Scholar] [CrossRef]
  90. Feil, D.; Feller, S. The density of sodium borosilicate glasses related to atomic arrangements. J. Non-Cryst. Solids 1990, 119, 103–111. [Google Scholar] [CrossRef]
  91. Inoue, H.; Masuno, A.; Watanabe, Y.; Suzuki, K.; Iseda, T. Direct calculation of the physical properties of sodium borosilicate glass from its chemical composition using the concept of structural units. J. Am. Ceram. Soc. 2012, 95, 211–216. [Google Scholar] [CrossRef]
  92. Mazurin, O.V.; Streltsina, M.V. Determination of tie-line directions in the metastable phase-separation regions of ternary systems. J. Non-Cryst. Solids 1972, 11, 199–218. [Google Scholar] [CrossRef]
  93. Taylor, P.; Ashmore, S.D.; Owen, D.G. Chemical durability of some sodium borosilicate glasses improved by phase separation. J. Am. Ceram. Soc. 1987, 70, 333–338. [Google Scholar] [CrossRef]
  94. Häßler, J.; Rüssel, C. Self-organized growth of sodium borate-rich droplets in a phase-separated sodium borosilicate glass. Int. J. Appl. Glass Sci. 2017, 8, 124–131. [Google Scholar] [CrossRef]
  95. Kawamoto, Y.; Tomozawa, M. Prediction of immiscibility boundaries of the systems K2O-SiO2, K2O-Li2O-SiO2, K2O-Na2O-SiO2, and K2O-BaO-SiO2. J. Am. Ceram. Soc. 1981, 64, 289–292. [Google Scholar] [CrossRef]
  96. Bormann, R.; Gärtner, F.; Zöltzer, K. Application of the CALPHAD method for the prediction of amorphous phase formation. J. Less Common Met. 1988, 145, 19–29. [Google Scholar] [CrossRef]
  97. Gossé, S.; Guéneau, C.; Bordier, S.; Schuller, S.; Laplace, A.; Rogez, J. A thermodynamic approach to predict the metallic and oxide phases precipitations in nuclear waste glass melts. Procedia Mater. Sci. 2014, 7, 79–86, ISSN 2211-8128. [Google Scholar] [CrossRef] [Green Version]
  98. Strnad, Z.; Strnad, P. Calculation of metastable two-liquid tie lines in ternary glass-forming systems. J. Am. Ceram. Soc. 1978, 61, 283–286. [Google Scholar] [CrossRef]
  99. Saunders, N.; Miodownik, A.P. CALPHAD (Calculation of Phase Diagrams): A Comprehensive Guide; Elsevier: Amsterdam, The Netherlands, 1998; ISBN 9780080528434. [Google Scholar]
  100. Strnad, Z.; McMillan, P.W. Metastable two-liquid tie lines in the soda-lime-silica system. Phys. Chem. Glasses 1983, 24, 57–64. [Google Scholar]
  101. Benigni, P. CALPHAD modeling of the glass transition for a pure substance, coupling thermodynamics and relaxation kinetics. Calphad 2021, 72, 102238. [Google Scholar] [CrossRef]
  102. Hammel, J.J. Direct measurements of homogeneous nucleation rates in a glass-forming system. J. Chem. Phys. 1967, 46, 2234–2244. [Google Scholar] [CrossRef]
  103. Brequel, H.; Parmentier, J.; Sorar, G.D.; Schiffini, L.; Enzo, S. Study of the phase separation in amorphous silicon oxycarbide glasses under heat treatment. Nanostruct. Mater. 1999, 11, 721–731. [Google Scholar] [CrossRef]
  104. Wheaton, B.R.; Clare, A.G. Evaluation of phase separation in glasses with the use of atomic force microscopy. J. Non-Cryst. Solids 2007, 353, 4767–4778. [Google Scholar] [CrossRef]
  105. Kaspar, T.C.; Ryan, J.V.; Pantano, C.G.; Rice, J.; Trivelpiece, C.; Hyatt, N.C.; Corkhill, C.L.; Mann, C.; Hand, R.J.; Kirkham, M.A.; et al. Physical and optical properties of the international simple glass. Npj Mater. Degrad. 2019, 3, 15. [Google Scholar] [CrossRef]
  106. To, T. Fracture Toughness and Fracture Surface Energy of Inorganic and Non-Metallic Glasses. Ph.D. Thesis, Université de Rennes 1, Rennes, France, 2019. [Google Scholar]
  107. Gin, S.; Beaudoux, X.; Angéli, F.; Jégou, C.; Godon, N. Effect of composition on the short-term and long-term dissolution rates of ten borosilicate glasses of increasing complexity from 3 to 30 oxides. J. Non-Cryst. Solids 2012, 358, 2559–2570. [Google Scholar] [CrossRef]
  108. Jan, A.; Delaye, J.-M.; Gin, S.; Kerisit, S. Molecular dynamics simulation of ballistic effects in simplified nuclear waste glasses. J. Non-Cryst. Solids 2019, 505, 188–201. [Google Scholar] [CrossRef]
  109. Ojovan, M.I. The modified random network (MRN) model within the configuron percolation theory (CPT) of glass transition. Ceramics 2021, 4, 121–134. [Google Scholar] [CrossRef]
  110. Sitarz, M.; Mozgawa, W.; Handke, M. Rings in the structure of silicate glasses. J. Mol. Struct. 1999, 511, 281–285. [Google Scholar] [CrossRef]
  111. Ferlat, G.; Charpentier, T.; Seitsonen, A.P.; Takada, A.; Lazzeri, M.; Cormier, L.; Calas, G.; Mauri, F. Boroxol rings in liquid and vitreous B2O3 from first principles. Phys. Rev. Lett. 2008, 101, 065504. [Google Scholar] [CrossRef] [PubMed]
  112. Kieu, L.-H.; Delaye, J.-M.; Stolz, C. Modeling the effect of composition and thermal quenching on the fracture behavior of borosilicate glass. J. Non-Cryst. Solids 2012, 358, 3268–3279. [Google Scholar] [CrossRef]
  113. Boiko, G.G.; Bokov, N.A. Small-angle scattering and scattering of visible light by sodium-silicate glasses at phase separation. J. Non-Cryst. Solids 1970, 5, 41–54. [Google Scholar] [CrossRef]
  114. Du, L.S.; Stebbins, J.F. Nature of silicon-boron mixing in sodium borosilicate glasses: A high-resolution 11B and 17O NMR study. J. Phys. Chem. B 2003, 107, 10063–10076. [Google Scholar] [CrossRef]
  115. Furukawa, T.; Fox, K.E.; White, W.B. Raman spectroscopic investigation of the structure of silicate glasses. III. Raman intensities and structural units in sodium silicate glasses. J. Chem. Phys. 1981, 75, 3226–3237. [Google Scholar] [CrossRef]
  116. White, W.B. Investigation of phase separation by Raman spectroscopy. J. Non-Cryst. Solids 1982, 49, 321–329. [Google Scholar] [CrossRef]
  117. Cahn, J.W.; Charles, R.J. Initial stages of phase separation in glasses. Phys. Chem. Glasses 1965, 6, 181. [Google Scholar]
  118. Uhlmann, D.R.; Kolbeck, A.G. Phase separation and the revolution in concept of glass structure. Phys. Chem. Glasses 1976, 17, 146–158. [Google Scholar]
  119. Scholes, S.; Wilkinson, F.C.F. Glassy phase separation in sodium borosilicate glasses. Discuss. Faraday Soc. 1970, 50, 175–181. [Google Scholar] [CrossRef]
  120. Shepilov, M.P.; Kalmykov, A.E.; Sycheva, G.A. Liquid–liquid phase separation in sodium borosilicate glass: Ordering phenomena in particle arrangement. J. Non-Cryst. Solids 2007, 353, 2415–2430. [Google Scholar] [CrossRef]
  121. Dalmas, D.; Lelarge, A.; Vandembroucq, D. Quantitative AFM analysis of phase separated borosilicate glass surfaces. J. Non-Cryst. Solids 2007, 353, 4672–4680. [Google Scholar] [CrossRef] [Green Version]
  122. Elmer, T.H.; Nordberg, M.E.; Carrier, G.B.; Korda, E.J. Phase separation in borosilicate glasses as seen by electron microscopy and scanning electron microscopy. J. Am. Ceram. Soc. 1970, 53, 171–175. [Google Scholar] [CrossRef]
  123. Salvo, L.; Cloetens, P.; Maire, E.; Zabler, S.; Blandin, J.J.; Buffiere, J.Y.; Ludwig, W.; Boller, E.; Bellet, D.; Josserond, C. X-ray micro-tomography an attractive characterisation technique in materials science. Nucl. Instrum. Methods Phys. Res. Sect. B 2003, 200, 273–286. [Google Scholar] [CrossRef]
  124. Lacondemine, T. Initiation et Propagation d’une Fissure dans un Composite Particulaire à Matrice Verre: Expérimentation et Analyse Numérique. Ph.D. Thesis, Université de Rennes 1, Rennes, France, 2019. [Google Scholar]
  125. Yang, Z.; Ren, W.; Sharma, R.; McDonald, S.; Mostafavi, M.; Vertyagina, Y.; Marrow, T.J. In-situ X-ray computed tomography characterisation of 3D fracture evolution and image-based numerical homogenisation of concrete. Cem. Concr. Compos. 2017, 75, 74–83. [Google Scholar] [CrossRef] [Green Version]
  126. Buffiere, J.-Y.; Maire, E.; Adrien, J.; Masse, J.-P.; Boller, E. In situ experiments with X-ray tomography: An attractive tool for experimental mechanics. Exp. Mech. 2010, 50, 289–305. [Google Scholar] [CrossRef]
  127. Tanaka, H.; Araki, T. Spontaneous double phase separation induced by rapid hydrodynamic coarsening in two-dimensional fluid mixtures. Phys. Rev. Lett. 1998, 81, 389. [Google Scholar] [CrossRef] [Green Version]
  128. Han, J.H.; Mattern, N.; Kim, D.H.; Eckert, J. Phase separation and microstructure evolution of rapidly quenched Gd-Hf-Co-Al alloys. J. Alloys Compd. 2011, 509, S42–S45. [Google Scholar] [CrossRef]
  129. Seward, T.P., III; Uhlmann, D.R.; Turnbull, D. Phase separation in the system BaO-SiO2. J. Am. Ceram. Soc. 1968, 51, 278–285. [Google Scholar] [CrossRef]
  130. Shaw, R.R.; Breedis, J.F. Secondary phase separation in lead borate glasses. J. Am. Ceram. Soc. 1972, 55, 422–425. [Google Scholar] [CrossRef]
  131. Filipovich, V.N. Some aspects of the formation of new phases in melt and glasses. Struct. Glass 1965, 5, 39. [Google Scholar]
  132. Galakhov, F.Y.; Konovalova, S.F. Liquation phenomena in the system alumina-silica. Communication 1. Experimental data and their discussion. Izv. Akad. Nauk. SSSR Seriya Khimicheskaya 1964, 8, 1373. [Google Scholar]
  133. Porai-Koshits, E.A.; Averjanov, V.I. Primary and secondary phase separation of sodium silicate glasses. J. Non-Cryst. Solids 1968, 1, 29–38. [Google Scholar] [CrossRef]
  134. Shaw, R.R.; Uhlmann, D.R. Effect of phase separation on the properties of simple glasses. I. Density and molar volume. J. Non-Cryst. Solids 1969, 1, 474–498. [Google Scholar] [CrossRef]
  135. Shaw, R.R.; Uhlmann, D.R. Effect of phase separation on the properties of simple glasses. II. Elastic properties. J. Non-Cryst. Solids 1971, 5, 237–263. [Google Scholar] [CrossRef]
  136. Hood, H.P.; Stookey, S.D. Method of Making a Glass Article of High Mechanical Strength and Article Made Thereby. U.S. Patent 2779136A, 29 January 1957. [Google Scholar]
  137. Mirkhalaf, M.; Dastjerdi, A.K.; Barthelat, F. Overcoming the brittleness of glass through bio-inspiration and micro-architecture. Nat. Commun. 2014, 5, 3166. [Google Scholar] [CrossRef] [PubMed] [Green Version]
  138. Sehgal, J.; Ito, S. A new low-brittleness glass in the soda-lime-silica glass family. J. Am. Ceram. Soc. 1998, 81, 2485–2488. [Google Scholar] [CrossRef]
  139. Wondraczek, L.; Mauro, J.C.; Eckert, J.; Kühn, U.; Horbach, J.; Deubener, J.; Rouxel, T. Towards ultrastrong glasses. Adv. Mater. 2011, 23, 4578–4586. [Google Scholar] [CrossRef] [PubMed]
  140. Hashin, Z.; Shtrikman, S. A variational approach to the theory of the elastic behaviour of multiphase materials. J. Mech. Phys. Solids 1963, 11, 127–140. [Google Scholar] [CrossRef]
  141. Miyata, N.; Jinno, H. Strength and fracture surface energy of phase-separated glasses. J. Mater. Sci. 1981, 16, 2205–2217. [Google Scholar] [CrossRef]
  142. Osaka, A.; Soga, N.; Kunugi, M. Elastic constants and Vickers hardness of lead borate glasses. J. Soc. Mater. Sci. Jpn. 1974, 23, 128–131. [Google Scholar] [CrossRef]
  143. Miyata, N.; Jinno, H. Use of Vickers indentation method for evaluation of fracture toughness of phase-separated glasses. J. Non-Cryst. Solids 1980, 38, 391–396. [Google Scholar] [CrossRef]
  144. Miyata, N.; Jinno, H. Fracture toughness and fracture surface energy of lead borate glasses. J. Mater. Sci. Lett. 1982, 1, 156–158. [Google Scholar] [CrossRef]
  145. Lange, F.F. The interaction of a crack front with a second-phase dispersion. Philos. Mag. 1970, 22, 0983–0992. [Google Scholar] [CrossRef]
  146. Simmons, C.J.; Freiman, S.W. Effects of phase separation on crack growth in borosilicate glass. J. Non-Cryst. Solids 1980, 38, 503–508. [Google Scholar] [CrossRef]
  147. Evans, A.G. Perspective on the development of high-toughness ceramics. J. Am. Ceram. Soc. 1990, 73, 187–206. [Google Scholar] [CrossRef]
  148. Bao, G.; Suo, Z. Remarks on crack-bridging concepts. Appl. Mech. Rev. 1992, 45, 355–366. [Google Scholar] [CrossRef]
  149. Budiansky, B.; Amazigo, J.C.; Evans, A.G. Small-scale crack bridging and the fracture toughness of particulate-reinforced ceramics. J. Mech. Phys. Solids 1988, 36, 167–187. [Google Scholar] [CrossRef]
  150. Bonamy, D.; Prades, S.; Rountree, C.L.; Ponson, L.; Dalmas, D.; Bouchaud, E.; Ravi-Chandar, K.; Guillot, C. Nanoscale damage during fracture in silica glass. Int. J. Fract. 2006, 140, 3–14, ISSN 0376-9429. [Google Scholar] [CrossRef] [Green Version]
  151. Gjerden, K.S.; Stormo, A.; Hansen, A. Local dynamics of a randomly pinned crack front: A numerical study. Front. Phys. 2014, 2, 66. [Google Scholar] [CrossRef] [Green Version]
  152. Bower, A.F.; Ortiz, M. A three-dimensional analysis of crack trapping and bridging by tough particles. J. Mech. Phys. Solids 1991, 39, 815–858. [Google Scholar] [CrossRef]
  153. Gao, H.; Rice, J.R. A first-order perturbation analysis of crack trapping by arrays of obstacles. J. Appl. Mech. 1989, 56, 828–836. [Google Scholar] [CrossRef]
  154. Mower, T.M.; Argon, A.S. Experimental investigations of crack trapping in brittle heterogeneous solids. Mech. Mater. 1995, 19, 343–364. [Google Scholar] [CrossRef] [Green Version]
  155. Faber, K.T.; Evans, A.G. Crack deflection processes–I. Theory. Acta Metall. 1983, 31, 565–576. [Google Scholar] [CrossRef]
  156. Faber, K.T.; Evans, A.G. Crack deflection processes–II. Experiment. Acta Metall. 1983, 31, 577–584, ISSN 0001-6160. [Google Scholar] [CrossRef]
  157. Lebihain, M.; Leblond, J.-B.; Ponson, L. Effective toughness of periodic heterogeneous materials: The effect of out-of-plane excursions of cracks. J. Mech. Phys. Solids 2020, 137, 103876. [Google Scholar] [CrossRef]
  158. Laurson, L.; Santucci, S.; Zapperi, S. Avalanches and clusters in planar crack front propagation. Phys. Rev. E 2010, 81, 046116. [Google Scholar] [CrossRef] [PubMed] [Green Version]
  159. Måløy, K.J.; Santucci, S.; Schmittbuhl, J.; Toussaint, R. Local waiting time fluctuations along a randomly pinned crack front. Phys. Rev. Lett. 2006, 96, 045501. [Google Scholar] [CrossRef] [Green Version]
  160. Evans, A.G. A method for evaluating the time-dependent failure characteristics of brittle materials and its application to polycrystalline alumina. J. Mater. Sci. 1972, 7, 1137–1146, ISSN 1573-4803. [Google Scholar] [CrossRef]
  161. Ahlquist, C.N. On the interaction of cleavage cracks with second phase particles. Acta Metall. 1975, 23, 239–243. [Google Scholar] [CrossRef]
  162. Green, D.J.; Nicholson, P.S.; Embury, J.D. Fracture of a brittle particulate composite. J. Mater. Sci. 1979, 14, 1413–1420. [Google Scholar] [CrossRef]
  163. Selsing, J. Internal stresses in ceramics. J. Am. Ceram. Soc. 1961, 44, 419. [Google Scholar] [CrossRef]
  164. Miyata, N.; Takeda, S.; Jinno, H. Slow crack growth in phase-separated glasses. J. Non-Cryst. Solids 1987, 95, 1047–1054. [Google Scholar] [CrossRef]
  165. Kleebe, H.-J.; Pezzotti, G.; Ziegler, G. Microstructure and fracture toughness of Si3N4 ceramics: Combined roles of grain morphology and secondary phase chemistry. J. Am. Ceram. Soc. 1999, 82, 1857–1867. [Google Scholar] [CrossRef]
  166. Seal, A.K.; Chakraborti, P.; Roy, N.R.; Mukerjee, S.; Mitra, M.K.; Das, G.C. Effect of phase separation on the fracture toughness of SiO2-B2O3-Na2O glass. Bull. Mater. Sci. 2005, 28, 457–460. [Google Scholar] [CrossRef]
  167. Lane, M. Interface fracture. Annu. Rev. Mater. Res. 2003, 33, 29–54. [Google Scholar] [CrossRef]
  168. Raghava, R.S. Role of matrix-particle interface adhesion on fracture toughness of dual phase epoxy-polyethersulfone blend. J. Polym. Sci. Part B Polym. Phys. 1987, 25, 1017–1031. [Google Scholar] [CrossRef]
  169. Mecholsky, J.J. Toughening in glass ceramic through microstructural design. Fract. Mech. Ceram. 1983, 6, 165. [Google Scholar]
  170. Tang, L.; Krishnan, N.M.A.; Berjikian, J.; Rivera, J.; Smedskjaer, M.M.; Mauro, J.C.; Zhou, W.; Bauchy, M. Effect of nanoscale phase separation on the fracture behavior of glasses: Toward tough, yet transparent glasses. Phys. Rev. Mater. 2018, 2, 113602. [Google Scholar] [CrossRef]
  171. Kermouche, G.; Barthel, E.; Vandembroucq, D.; Dubujet, P. Mechanical modelling of indentation-induced densification in amorphous silica. Acta Mater. 2008, 56, 3222–3228. [Google Scholar] [CrossRef] [Green Version]
  172. Perriot, A.; Vandembroucq, D.; Barthel, E.; Martinez, V.; Grosvalet, L.; Martinet, C.; Champagnon, B. Raman microspectroscopic characterization of amorphous silica plastic behavior. J. Am. Ceram. Soc. 2006, 89, 596–601. [Google Scholar] [CrossRef]
  173. Cheng, S.; Song, C.; Ercius, P. Indentation cracking behaviour and structures of nanophase separation of glasses. Phys. Chem. Glasses-Eur. J. Glass Sci. Technol. Part B 2017, 58, 237–242. [Google Scholar] [CrossRef] [Green Version]
  174. Evans, A.G.; Wilshaw, T.R. Quasi-static solid particle damage in brittle solids—I. Observations, analysis and implications. Acta Metall. 1976, 24, 939–956, ISSN 0001-6160. [Google Scholar] [CrossRef]
  175. Quinn, G.D.; Bradt, R.C. On the Vickers indentation fracture toughness test. J. Am. Ceram. Soc. 2007, 90, 673–680. [Google Scholar] [CrossRef]
  176. To, T.; Stabler, C.; Ionescu, E.; Riedel, R.; Célarié, F.; Rouxel, T. Elastic properties and fracture toughness of SiOC-based glass-ceramic nanocomposites. J. Am. Ceram. Soc. 2020, 103, 491–499. [Google Scholar] [CrossRef] [Green Version]
  177. Ostojic, P.; Mcpherson, R. A review of indentation fracture theory—Its development, principles and limitations. Int. J. Fract. 1987, 33, 297–312. [Google Scholar] [CrossRef]
  178. Fu, S.-Y.; Feng, X.-Q.; Lauke, B.; Mai, Y.-W. Effects of particle size, particle/matrix interface adhesion and particle loading on mechanical properties of particulate–Polymer composites. Compos. Part B Eng. 2008, 39, 933–961. [Google Scholar] [CrossRef]
  179. Bonamy, D.; Bouchaud, E. Failure of heterogeneous materials: A dynamic phase transition? Phys. Rep. 2010, 498, 1–44. [Google Scholar] [CrossRef]
  180. Bouchaud, E.; Lapasset, G.; Planes, J.; Naveos, S. Statistics of branched fracture surfaces. Phys. Rev. B 1993, 48, 2917–2928, ISSN 0163-1829. [Google Scholar] [CrossRef]
  181. Daguier, P.; Nghiem, B.; Bouchaud, E.; Creuzet, F. Pinning and depinning of crack fronts in heterogeneous materials. Phys. Rev. Lett. 1997, 78, 1062. [Google Scholar] [CrossRef] [Green Version]
  182. Bonamy, D.; Ponson, L.; Prades, S.; Bouchaud, E.; Guillot, C. Scaling exponents for fracture surfaces in homogeneous glass and glassy ceramics. Phys. Rev. Lett. 2006, 97, 135504, ISSN 0031-9007. [Google Scholar] [CrossRef] [PubMed] [Green Version]
  183. Ramanathan, S.; Ertas, D.; Fisher, D.S. Quasistatic crack propagation in heterogeneous media. Phys. Rev. Lett. 1997, 79, 873. [Google Scholar] [CrossRef] [Green Version]
  184. Rountree, C.L.; Feng, W. SILICA and its process zone. Int. J. Appl. Glass Sci. 2020, 11, 385–395. [Google Scholar] [CrossRef]
  185. Guerra, C.; Scheibert, J.; Bonamy, D.; Dalmas, D. Understanding fast macroscale fracture from microcrack post mortem patterns. Proc. Natl. Acad. Sci. USA 2012, 109, 390–394. [Google Scholar] [CrossRef] [PubMed] [Green Version]
  186. Ciccotti, M.; George, M. In Situ AFM investigations and fracture mechanics modeling of slow fracture propagation in oxide and polymer glasses. In Handbook of Materials Modeling: Applications: Current and Emerging Materials; Springer: New York, NY, USA, 2018; pp. 1–37. [Google Scholar] [CrossRef]
  187. Dalmas, D.; Lelarge, A.; Vandembroucq, D. Crack propagation through phase-separated glasses: Effect of the characteristic size of disorder. Phys. Rev. Lett. 2008, 101, 255501. [Google Scholar] [CrossRef] [PubMed] [Green Version]
  188. Pallares, G.; Lechenault, F.; George, M.; Bouchaud, E.; Ottina, C.; Rountree, C.L.; Ciccotti, M. Roughness of oxide glass subcritical fracture surfaces. J. Am. Ceram. Soc. 2018, 101, 1279–1288. [Google Scholar] [CrossRef] [Green Version]
  189. Wünsche, C.; Rädlein, E.; Frischat, G.H. Glass fracture surfaces seen with an atomic force microscope. Fresenius J. Anal. Chem. 1997, 358, 349–351. [Google Scholar] [CrossRef]
  190. Lechenault, F.; Pallares, G.; George, M.; Rountree, C.L.; Bouchaud, E.; Ciccotti, M. Effects of finite probe size on self-affine roughness measurements. Phys. Rev. Lett. 2010, 104, 025502. [Google Scholar] [CrossRef] [Green Version]
  191. Barés, J.; Barlet, M.; Rountree, C.L.; Barbier, L.; Bonamy, D. Nominally brittle cracks in inhomogeneous solids: From microstructural disorder to continuum-level scale. Front. Phys. 2014, 2, 70, ISSN 2296-424X. [Google Scholar] [CrossRef] [Green Version]
  192. Guin, J.P.; Wiederhorn, S.M.; Fett, T. Crack-tip structure in soda-lime-silicate glass. J. Am. Ceram. Soc. 2005, 88, 652–659, ISSN 0002-7820. [Google Scholar] [CrossRef]
  193. Tetelman, A.S.; McEvily, A.J. Fracture of Structural Materials; Wiley: Hoboken, NJ, USA, 1967. [Google Scholar]
Figure 1. Schematic of the log of the velocity ( log ( v ) ) as a function of the stress intensity factor ( K I ) depicting the three regions of sub-critical cracking ( K I < K c ) [3,4,7]. Recreated with permission from Elsevier and Journal of Physics D.
Cmd 02 00022 g001
Figure 2. Schematic diagram of how to create porous glass using phase separation in glass obtained from slag. Recreated from [65].
Cmd 02 00022 g002
Figure 3. (a) Schematic two-liquid immiscibility region showing binodal (zone I) and spinodal (zone II); (b) Sketch of the Gibbs free energy curve versus composition x B (mole fraction of component B) for temperature T 1 where T 1 > T C ; and (c) Gibbs free energy curve versus composition x B (mole fraction of component B) for temperature T 2 where T 2 < T C . Binodal decomposition occurs in zone I, and spinodal decomposition occurs in zone II [35,79,80].
Cmd 02 00022 g003
Figure 4. Gibbs free energy-composition diagram method for determining the driving force for phase separation. Recreated from [80].
Cmd 02 00022 g004
Figure 5. Ternary SBN oxide glass system with Haller’s isothermals acquired from clearing temperatures. Data points correspond to data presented in two of Haller’s papers for pseudo-ternary SBN systems (circles [83]) and SiO 2 - Na 2 O systems (triangles [81]). The colors correspond to the clearing temperature. Arrows indicate the direction of increasing mol%. Recreated with data in [81,83].
Cmd 02 00022 g005
Figure 6. Immiscibility diagram posed by Haller for SBN glass systems at 600 °C [83]. The line marks the 600 °C isothermal as seen in Figure 5. It represents the border between one-phase (Zone I) and multi-phases (Zones II and III). The blue solid triangle indicates the 3-phase zone. Data points correspond to data presented in Section 4.1.1 (black square [94]) and 4.1.2 (white star). Arrows indicate the direction of increasing mol%. Recreated with data in [83].
Cmd 02 00022 g006
Figure 7. AFM images of Corning 7070 glass after heat treatment at 700 °C for (a) 1 h, (b) 8 h, and (c) 24 h. All scans are 2 × 2 μm [104]. Reprinted with permission from Elsevier; published by Wheaton et al., 2007.
Cmd 02 00022 g007
Figure 8. AFM images of pristine SBN42 glass samples after being broken in two. Panel (a) without and panel (b) with chemical treatment, chemical treated in HCl at 60 °C for 30 min.
Cmd 02 00022 g008
Figure 9. AFM images of SBN42 (white star in Figure 6) after annealing at 600 °C and 650 °C and for different times and then after chemical treatment (immersion in HCl 3 N at 60 °C for 30 min).
Cmd 02 00022 g009
Figure 10. Electron microscope photographs ×18,900) of secondary phase separation in SiO2-Na2O glass with 12.5 mol% Na2O heat treated for 2 h at 777 °C (a), and then heated at 668 °C for 2 h (b) [133]. Reprinted with permission of Elsevier; published by Porai-Koshits and Averjanov, 1968.
Cmd 02 00022 g010
Figure 11. Variation of density with (a) weight fraction of PbO   w B and (b) volume fraction of PbO rich phase V β / V   in PbO - B 2 O 3 glass system. Data points in blue triangles and fitting lines in orange. (Recreated with data from [130,134].)
Cmd 02 00022 g011
Figure 12. Plot of Young’s Modulus of PbO - B 2 O 3 glasses as a function of the PbO mol%. Experimental data of Young’s modulus of PbO - B 2 O 3 glasses with mole fraction composition are presented in Table A1 blue points from [141,142], red squares from [135], black stars for end points from [141]. Predictive ranges of different models within the APS zone (gray section): solid red line for Voigt upper bound, blue dotted line for Reuss lower bound, green dashed line for HS upper bound and black solid line for HS lower bound [135].
Cmd 02 00022 g012
Figure 13. Schematic of possible crack paths when a crack interacts with a second-phase particle: (a) crack circumvents the particle or (b) crack traverses the particle. Recreated from [141].
Cmd 02 00022 g013
Figure 14. Schematic of residual stresses in matrix around a single embedded particle, which arise due to thermal expansion mismatches during cooling. In the schematic, coefficient of thermal expansion for the matrix α m and the particle α p are non-equivalent. Panal (a) depicts the scenario when α m > α p , and Panal (b) depicts the scenario when α m < α p . Recreated from [141].
Cmd 02 00022 g014
Figure 15. Schematic of stress concentration (grey zone) around a single particle embedded in a matrix, when the overall system is under tensile stresses σ (black arrows) and elastic mismatch exists between the bulk material and the particle. In the schematic, the shear moduli of the matrix and particle are G m and G p , respectively. Column (a) depicts the scenario when G m > G p , and Column (b) depicts the scenario when G m < G p (recreated from [141]).
Cmd 02 00022 g015
Figure 16. Comparison of indentation fracture toughness K c i n d values for SBN glass with chemical composition [ SiO 2 ] = 60%, [ B 2 O 3 ] = 30%, and [ Na 2 O ] = 10% (in mol%) annealed at different temperatures for different durations: (1) without annealing (Non-APS); (2) 600 °C for 64 h (spinodal structure); (3) 650 °C for 16 h (spinodal structure); and (4) 700 °C for 24 h (binodal structure). Recreated with data from [166].
Cmd 02 00022 g016
Figure 17. Fracture Toughness as a function of the PbO mol% in PbO - B 2 O 3 glasses: blue circles for fracture toughness K c by three-point bending tests from [143]; red squares for relative fracture toughness values k K c i n d by indentation in [143,144]; open and closed green diamonds for K c i n d calculated from k K c i n d with k = 0.61 [143] and k = 0.70 [144], respectively; and black stars for estimated K c values from [141] for tie-line end members (corresponding to 0.31 mol% PbO (1 wt% PbO ) to 19.68 mol% PbO (44 wt% PbO )). Data presented in Table A1.
Cmd 02 00022 g017
Figure 18. Schematic illustration of successive positions of crack front upon interaction with a second-phase particle, expected for (a) glasses consisting of PbO -rich particles/ B 2 O 3 -rich matrix, and (b) glasses consisting of B 2 O 3 -rich particles/ PbO -rich matrix. Recreated from [164].
Cmd 02 00022 g018
Figure 19. Crack growth data for SBN glass with chemical composition: [ SiO 2 ] = 70.0 mol%, [ B 2 O 3 ] = 23.0 mol%, and [ Na 2 O ] = 7.0 mol% after varying degrees of phase separation. Sample 1 (red stars) annealed at 550 °C for 6.5 h, phase size < 10   nm ; Sample 2 (blue triangles) annealed at 620 °C for 0.5 h, phase size ~ 15   nm ; Sample 3 (green diamonds) annealed at 620 °C for about 35 h, phase size ~ 60   nm ; and Sample 4 (yellow triangles) annealed at 650 °C for about 90 h, phase size ~ 150   nm . Recreated from [146] with permission from Elsevier; published by Simmons et al., 2007.
Cmd 02 00022 g019
Publisher’s Note: MDPI stays neutral with regard to jurisdictional claims in published maps and institutional affiliations.

