Article

Cyclic Polarization of Corrugated Austenitic Stainless Steel Rebars in Acid Rain: Effect of Fly Ash, pH and Steel Type

by
Angeliki G. Lekatou
1,2,* and
Sofia Tsouli
1
1
Laboratory of Applied Metallurgy, Department of Materials Science and Engineering, University of Ioannina, 45110 Ioannina, Greece
2
Institute of Materials Science and Computing, University Research Center of Ioannina (URCI), 45110 Ioannina, Greece
*
Author to whom correspondence should be addressed.
Corros. Mater. Degrad. 2022, 3(1), 75-100; https://0-doi-org.brum.beds.ac.uk/10.3390/cmd3010005
Submission received: 28 November 2021 / Revised: 27 January 2022 / Accepted: 10 February 2022 / Published: 17 February 2022

Abstract

:
The present work studies the effect of fly ash content (0–25 wt.%), pH (8, 12.5), and steel type (316L, 304L) on the cyclic polarization of stainless steel rebars in electrolytes, simulating fresh concrete exposed to acid rain and corroded concrete cover that has exposed the reinforcement to direct acid rain attack. At the same time, it tries to elucidate the corrosion inhibition activities of a Greek lignite fly ash that is a high-Ca fly ash with a questionable effect on the corrosion resistance of concrete. A higher pH results in lower corrosion rates for both steels and all fly ash content. However, different passivity trends are noted for the two steels as a function of pH. The partial replacement of Ca(OH)2 with fly ash up to 20 wt.% has a beneficial effect on the electrochemical behavior of the stainless steel rebars, in terms of both uniform and localized corrosion resistance. However, this trend is reversed at 25 wt.% FA. The reasons for such trends are explored via microstructural examinations of the steels after polarization and XRD analysis of fly ash, as well as reinforced concrete containing fly ash.

1. Introduction

The bond strength between steel reinforcements and concrete, along with the durability of concrete, are factors of paramount importance for the structural performance, seismic resistance, and service life of reinforced concrete structures. Both factors are primarily affected by the corrosion of the steel rebar [1,2,3,4,5,6,7,8]).
Corrosion due to acid rain attack has gained rapidly increasing significance owing to recent acute urban and industrial activities [9,10]. An acidity of pH = 3.0–6.5 is detrimental to concrete of high quality [11,12]. Deterioration has been observed even in high performance concrete at pH values lower than 6.5 and sulfate concentrations greater than 500 ppm [12]. Ordinary Portland concrete has minimal (almost no) resistance to acid attacks [13] because all the hydration products of cement-based materials are soluble to acidic solutions. The corrosion of Portland cement and steel reinforcements caused by acid rain is primarily the combined result of the dissolving action of H+ and the expanding action of SO42− [9,14]. However, since acid rain contains many more aggressive constituents than H+ and SO4 (NO3, Cl, Mg2+, NH4+, etc.), and its composition varies throughout the world due to variations in industrial and urban activities as well as environmental conditions and disasters, acid rain attacks on concrete involve a more complex mechanism compared to pure acid attacks that may also differ from region to region [14]. Furthermore, the mechanism of attack of sulfate salts included in acid rain (e.g., (NH4)2SO4, Na2SO4, MgSO4) is also highly complicated and leads to increased permeability, porosity, and expansion-due cracking, thereby allowing aggressive ions to reach the embedded steel [12].
In order to minimize or delay the corrosion of steel reinforcements, various methods have been developed and employed, which are categorized by: (i) the employment of alternative reinforcements and slab designs; (ii) barrier methods; (iii) electrochemical methods; and (iv) the use of corrosion inhibitors [15]. Amongst alternative concrete reinforcements, solid stainless steel rebars yield the best structural properties [16]. Therefore, stainless steel rebars are increasingly employed in new concrete structures or for the repair of existing reinforced concrete structures, especially in critical parts subjected to corrosive environments [17]. The corrosion resistance of stainless steels is attributed to their passivation by the formation of a bi-layer film. The outer layer is Fe3+-rich and hydrated (FeOOH, Fe(OH)3), whereas the inner layer is Cr3+-rich and anhydrous with barrier properties. In the case of austenitic steels, the inner layer contains nickel and, depending on the chemistry of the steel, molybdenum [18,19]. Previous studies have shown that the pH of the electrolyte greatly influences the passivity of the austenitic stainless steels. Freire et al. [19] reported that as pH increased from 9 to 13 in NaOH and KOH solutions, the passive film of 316 stainless steel became enriched in Fe2+ species and poorer in Cr3+ species, and hence, less stable. However, Luo et al. [20] noted the opposite trend when pH increased from 8.5 to 12.5 for 316L in a simulated concrete pore solution containing 3.5 wt.% NaCl. Regarding 304 stainless steel, Freire et al. [21] found a notable increase in the pitting potential when pH increased from 9 to 13 in an alkaline electrolyte containing 10 wt.% NaCl. The presence of Mo also affects the passivity of stainless steels as a function of pH. Mo has been found to selectively dissolve in strong alkaline environments and be depleted in the passive film of 316L [22]. Ai et al. [3], reported a weakening in the passivity of Cr10Mo1 steel as the pH increased from 9 to 13.3 at low concentrations of Cl (0.2 M).
Barrier methods include the partial replacement of cement with mineral admixtures (silica fume, fly ash, blast furnace slag, microsilica, and calcite laterites [13]), amongst others. The partial replacement of cement with fly ash (FA), the main industrial by-product of the combustion of pulverized coal in thermoelectric power stations, has been shown to improve the corrosion behavior of concrete in acidic environments in a number of works [23,24,25,26] for the following reasons: (i) the silica contained in soluble aluminosilicate or Ca-aluminosolicate glasses of the fly ash reacts with the Ca(OH)2 (C-H) generated from cement hydration reactions to form 3CaO·2SiO2·3H2O (C-S-H). Thus, not only does the pozzolanic reaction reduce the amount of reactive C-H remaining in the hardened concrete, but C-S-H is also more stable than C-H [23,24]. (ii) C-S-H gel reduces the micropores of the concrete [25,27]. (iii) Replacing a portion of Portland cement with fly ash reduces the number of reactive aluminates (C3A: 3CaO·Al2O3) available for expansive reactions with SO42− [28].
Fly ash can also increase the resistance of concrete against sulfate attacks [27,28,29,30]. The main cause of this is the reduction in concrete permeability due to pozzzolanic reaction products that fill the capillary channels in the concrete. A complementary cause may be the formation of primary ettringite via the reaction of fly ash with some alumina phases in the cement (e.g., C3A) during the first few days of cement hydration, thus reducing the potential for expansive sulfate–alumina reactions due to sulfate attacks [29].
Preliminary efforts by the authors have shown that partial replacement of cement by FA in stainless-steel-reinforced concrete does not significantly affect the mechanical properties of the reinforcement after 4 m of salt spraying; the existence of an optimum content of fly ash in aqueous Ca(OH)2 that provides the highest corrosion resistance in mildly acidic and mildly alkaline solutions has also been suggested [31,32,33,34].The main scope of the present investigation is to provide an in-depth insight on the effect of fly ash content, pH, and stainless steel type on the electrochemical performance of stainless steel rebars in electrolytes simulating fresh concrete exposed to acid rain, and corroded concrete cover that has exposed the reinforcement to direct acid rain attacks. At the same time, the present effort tries to elucidate the corrosion inhibition activities of a Greek lignite fly ash that is a high-Ca fly ash with a questionable effect on the resistance of concrete to acid rain attacks.
The main motivation behind this work is that there is limited information on the effect of partial replacement of cement with a high-Ca fly ash on the corrosion resistance of steel concrete reinforcements in an acid rain environment. This is due to the high free CaO and S contents, which are considered to negatively affect volume stability and concrete durability [35]. Furthermore, as CaO-rich materials can hydrate independently and form their own Ca(OH)2, there are doubts concerning the positive contribution of a high-Ca fly ash to resistance against sulfate attacks [36]. This is because high Ca-FAs contain high amounts of alumina in their glassy phase that will react with C-H from cement hydration to form C-A-H (3CaO·Al2O3·6H2O) crystalline structures; C-A-H in a sulfate environment may form ettringite.
Nevertheless, certain mineralogical features of high Ca-FAs can reverse the aforementioned negative effects on the sulfate resistance of concrete: alumina in fly ash may partly be found in inert mineral phases, such as melilite, feldspars, muscovite, illite, etc. [37,38,39,40]. Moreover, high contents of sulfates in fly ash may be a benefit to the sulfate resistance of concrete since they decrease the amount of Ca(OH)2 in hardened concrete and promote the formation of ettringite whilst the concrete is still in a plastic state, effectively supersulfating the concrete [41]. In conjunction with the above postulation, Mehta et al. [42], showed improved sulfate resistance of cement pastes containing lignite high-Ca FAs. Tiburzi et al. [43] claimed that blending high amounts of class C fly ash with Portland limestone cement leads to an improved performance in a sulfate environment because of the dilution of calcium aluminates and silicates from the cement and the stabilization of ettringite and monocarbonates over monosulfates and calcium aluminate hydrates. The presence of CaCO3 in fly ash may also benefit the corrosion resistance of concrete, as C-S-H tends to preferentially nucleate on the surface of limestone particles [44].
In this work, 304L stainless steel was selected to be tested as an alternative to 316L concrete reinforcement. Besides the relatively low material cost and high seismic resistance, the main reason for such a selection is the absence of Mo, an element that has a strong positive effect in acidic and neutral environments, but a slightly negative to negative effect in alkaline environments [45].

2. Materials and Methods

2.1. Materials

316L (composition in wt.%: Fe, 0.022% C, 17.31% Cr, 10.08% Ni, 2.02% Mo, 0.54% Si, 1.75% Mn, 0.032% P, 0.001% S) and 304L (composition in wt.%: Fe, 0.03% C, 18.20% Cr, 8.51% Ni, 0.75% Si, 2.00% Mn, 0.045% P, 0.03% S) austenitic stainless steel corrugated bars, 6 mm in diameter and 2.5 cm in length, were utilized for the electrochemical tests. The rebars were produced by hot rolling and pickling, followed by cold rolling. The formation of nerves was made by pressing the metal into special notches in the last roller. Austenite was the main phase of both 316L and 304L rebars; martensite was present at the ribs due to the strain-induced transformation of austenite caused by intensive work hardening.
A pulverized fly ash (FA) from the Hellenic Public Power Corporation lignite mines, in the region of Western Macedonia, Greece, was used to partially replace Ca(OH)2 in an aqueous solution as well as cement in concrete cubes. The main constituents of FA were, in decreasing order of concentrations: CaO, SiO2, Al2O3, SO3, Fe2O3, and MgO [34] (the qualitative mineralogical composition of the fly ash will be detailed in Section 3.3).
Concrete cubes ((7 × 7 × 7) cm3) contained Portland composite cement (CEM II/A-M 42.5R), CEN Standard silica sand and water (proportions according to BS EN 196-1-2005: 450/225/1350 (g), respectively), and FA (replacing 0 wt.% and 25 wt.% of cement), and were reinforced with 316L rebars.

2.2. Electrochemical Testing

316L and 304L rebars were subjected to potentiodynamic polarization in a slightly alkaline electrolyte and a strongly alkaline electrolyte, the exact composition of which will be reported in the following paragraphs. Their edges (having been cut by a diamond saw) were mounted in a two-component epoxy and further masked by PTFE, leaving a ribbed rebar surface area of ~2 cm2 to be immersed in the electrolytes at 25 °C. Polarization runs were performed at the ACM Gill AC potentiostat/galvanostat (ACM Instruments, Cumbria, UK), which was connected to a standard three-cell arrangement (reference electrode: Ag/AgCl/3.5 M KCl, counter electrode: Pt-gauge). Following 2 h of immersion in the electrolytes under an open circuit in order to achieve a steady state, potentiodynamic polarization was carried out in the potential range of −250 mV to +1500 mV versus the steady state potential at a scan rate of 10 mV/min. The corrosion current density (icorr) values were calculated by Tafel extrapolation through linear regression analysis of the potential versus the logarithm of the current density data. A reasonable accuracy was ensured by adopting a number of restrictions that are previously reported in detail [46]. Briefly: (i) the starting potentials of the linear regression should be at least 50 mV away from the corrosion potential, in order to avoid any possible deviation from the Tafel-like behavior at low current density values owing to the influence of the cathodic reaction on the anodic reaction and vice-versa; (ii) the linear regression should extend over at least one decade of current density so that any deviation caused by concentration polarization and other extraneous defects is minimal; (iii) if a linear segment holding for a current density range of at least one order of magnitude could not be found in the anodic curve (a common case in anodic polarization, due to concentration effects and surface roughening), then Tafel extrapolation could be performed only in the cathodic polarization portion; (iv) a low scan rate should be applied so that the contribution of the current generated for charging the surface capacitance to the current generated from electrochemical reactions is as low as possible; (iv) the linear regression coefficient should be at least 0.98.
Cyclic polarization (CYP) was performed to investigate the resistance of the steel rebars to localized corrosion (complemented by the findings of anodic potentiodynamic polarization and microstructural examination). The main principle of this technique is that localized corrosion will occur if the current density of the reverse anodic polarization curve is greater than the current density of the forward anodic polarization curve at the same anodic potential, resulting in a “negative hysteresis loop” [46,47,48,49,50].
The electrolyte used contained 1.8 g of Ca(OH)2 per L of an acid rain (AR) simulating solution, and FA replacing 0–25 wt.% of Ca(OH)2. The acid rain simulating solution consisted of (g/L H2O): H2SO4: 0.032; HNO3: 0.015; (NH4)2SO4: 0.046; Na2SO4: 0.032; NaNO3: 0.021; and NaCl: 0.084 [51]. The initial pH of this electrolyte ranged between 12.3–12.7. The appropriate addition of drops of H2SO4 to the above electrolyte led to attaining a pH value of 7.5–7.9.
The selection of the aforementioned pH values was based on the following rationale: as sulfuric acid simultaneously penetrates and chemically reacts with concrete [52], acid rain can directly attack the reinforcement only when the concrete cover is cracked (conversely, it is well-documented in the literature that chloride diffuses through concrete porosity to the rebar surface without any strong and harmful interactions with the cementitious binder [52]). It is also taken into account that: (a) an alkaline solution of saturated Ca(OH)2 (i.e., 1.8 g of Ca(OH)2 per L of H2O, pH ≈ 12.5) simulates the solution remaining in the pores and capillary voids of the concrete after the hydration process [53]; (b) acid attacks to the cement paste involve a continuous travel of Ca(OH)2 from the interior of the structure to the surface, resulting in an unsaturated concrete pore solution [11]; (c) in high sulfate and low pH environments, the corrosion of the reinforcing steel is the dominant degradation mechanism of a concrete structure [12]. Therefore, it is herein postulated that the slightly alkaline aqueous solution of pH = 7.5–7.9 may simulate a cracked concrete cover that has directly exposed the steel reinforcement to acid rain in compatibility with Fan et al. [54]. Concomitantly, the strongly alkaline electrolyte of pH = 12.3–12.7 may simulate fresh concrete subjected to AR attacks.

2.3. Microstructural Examination

The microstructure of cross sections of 316L and 304L specimens after electrochemical testing (cross sectioned at ribs by a diamond saw and polished with a standard metallographic procedure) was evaluated by scanning electron microscopy (SEM) and energy dispersion X-ray spectroscopy (EDX) at the JeoL JSM 6510 LV system (JEOL, Tokyo, Japan) equipped with an Oxford Instruments X-Act EDX analyzer (Oxford Instr. plc, Abingdon, UK).
The qualitative mineralogical composition of FA was determined by X-ray diffraction (XRD) at the Bruker D8 Advance Diffractometer (Ni-filtered CuKa1, standard slit, step size: 0.02°, step time: 2 s/step, Bruker, MA, USA). XRD was also performed on samples received from the inner part (i.e., a few mm away from the steel reinforcement) of concrete cubes (with 0 and 25 wt.% FA in cement) that had been hydrated for 28 d.

3. Results-Discussion

3.1. Electrochemical Performance

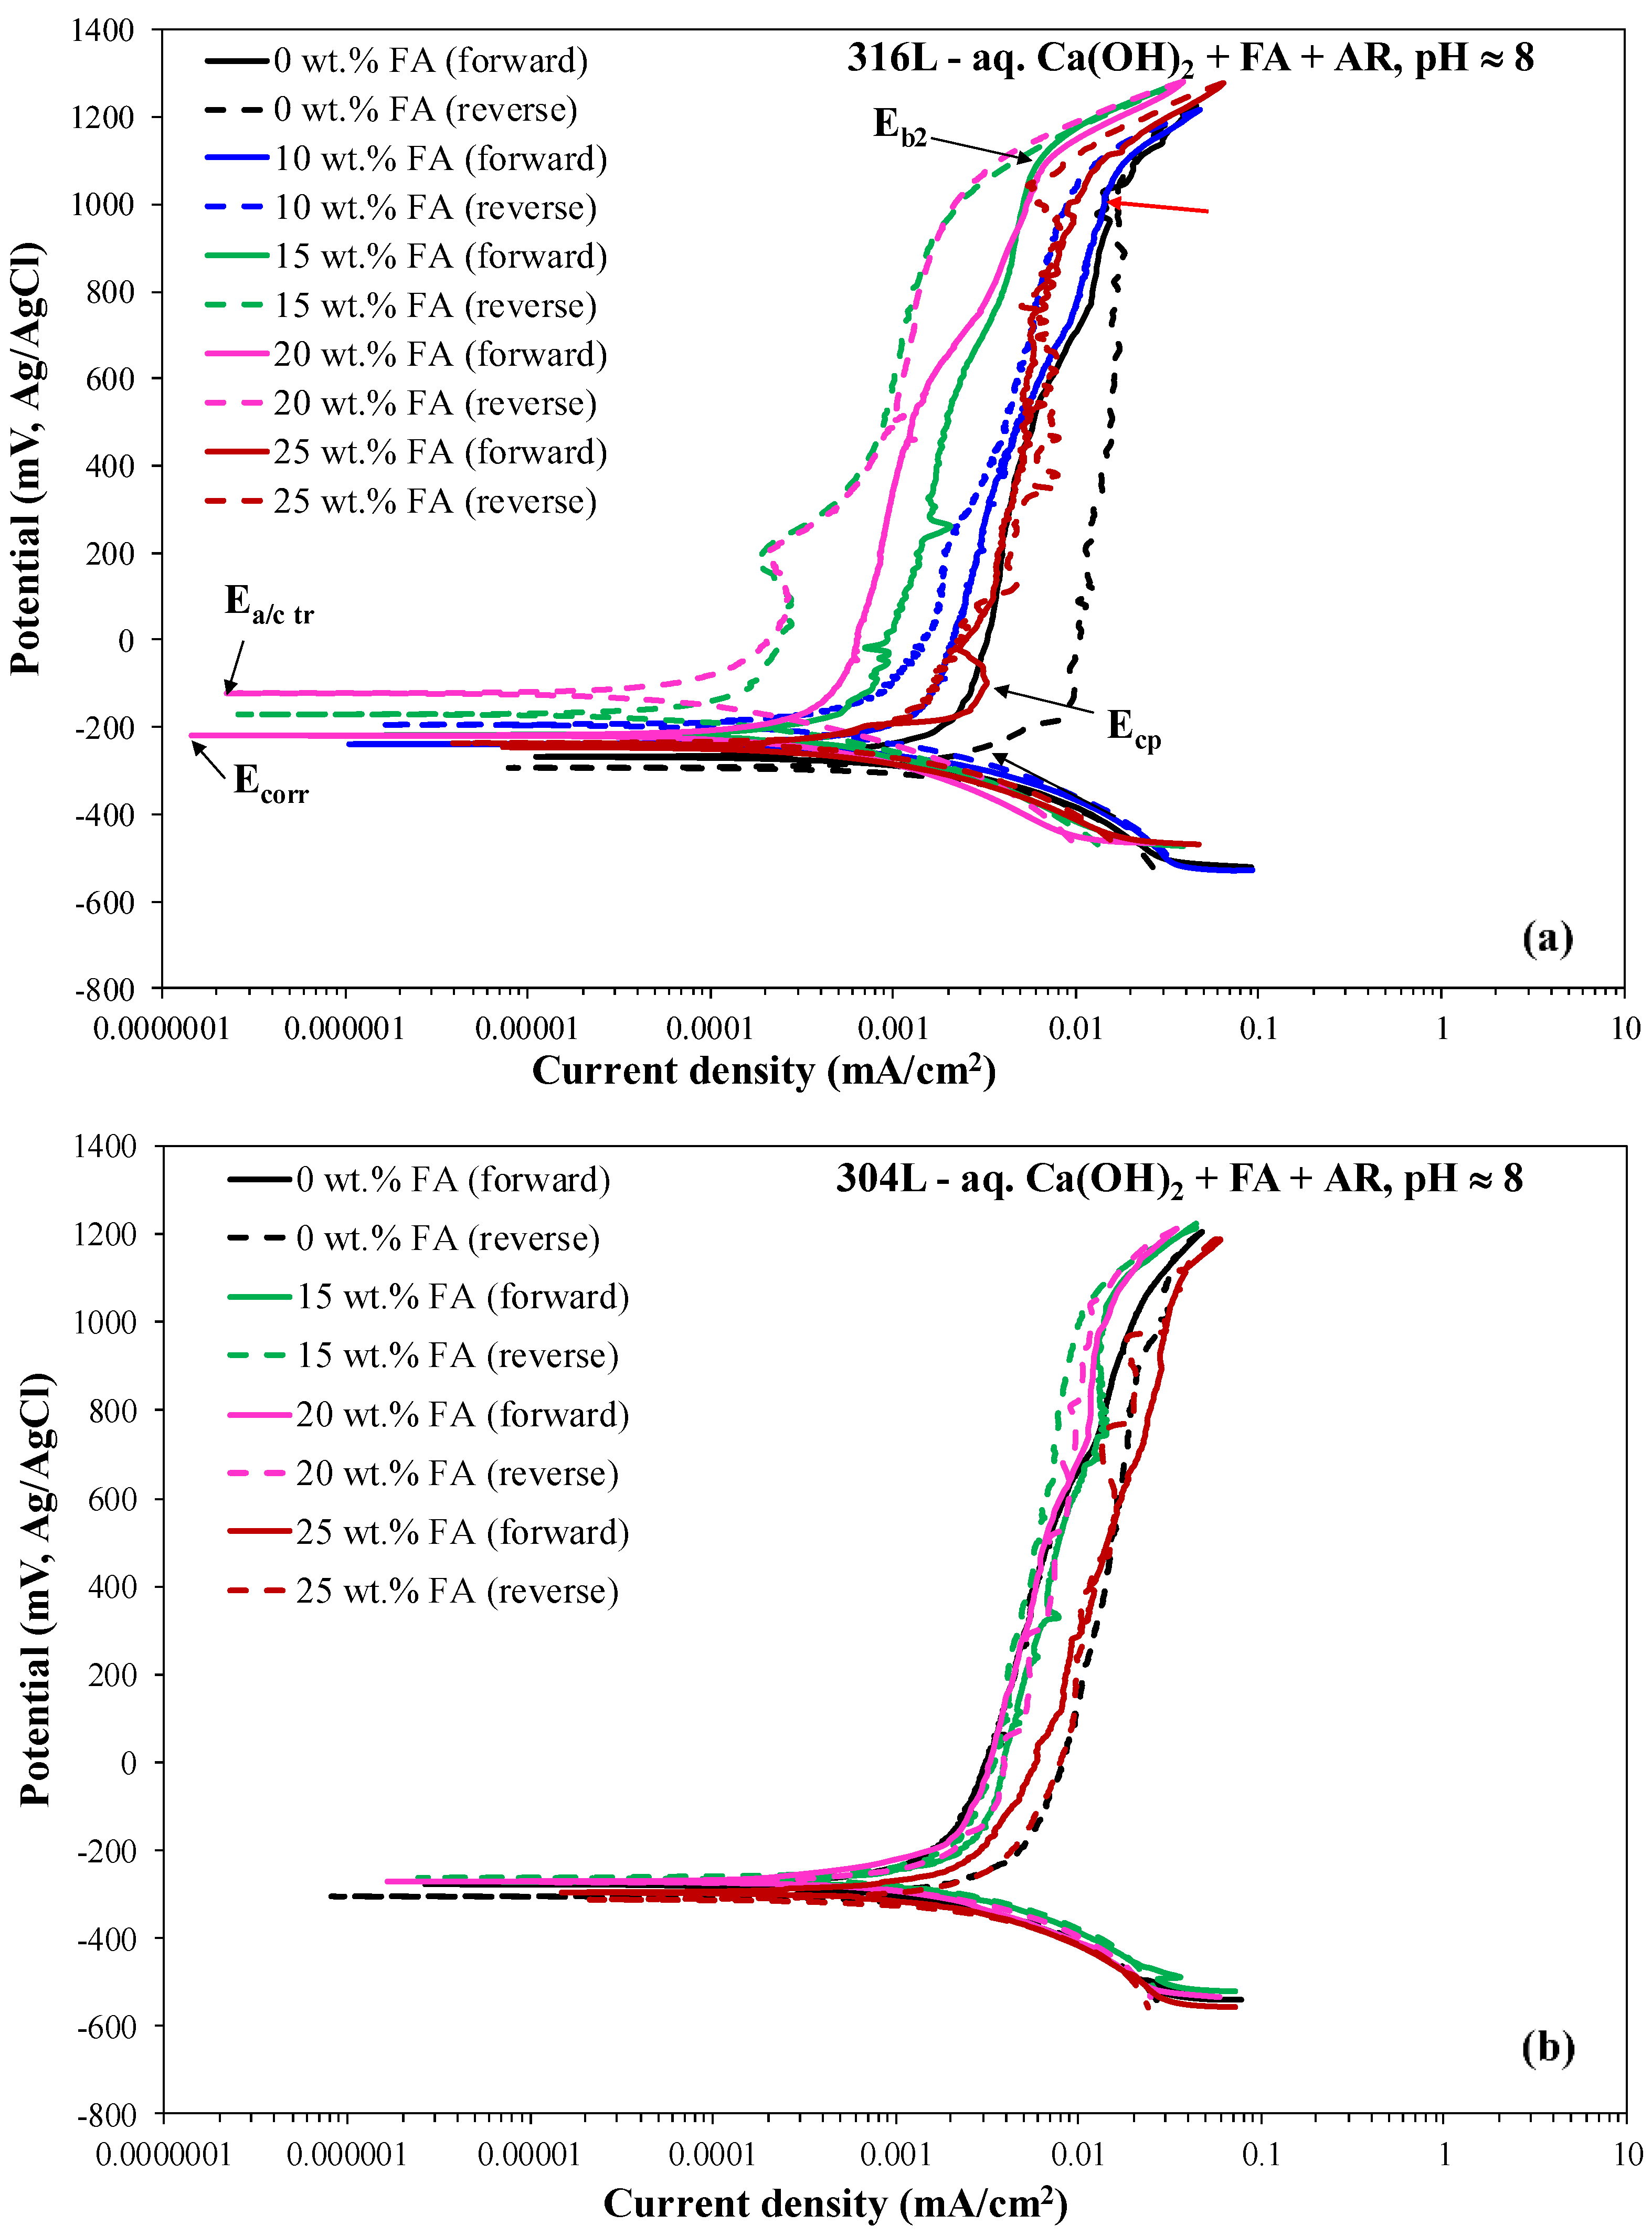
3.1.1. General Observations

Figure 1 and Figure 2 include representative cyclic voltammograms of 316L and 304L rebars during immersion in the electrolyte containing Ca(OH)2 partially replaced by fly ash (0–25 wt.%) and an acid rain simulating solution, at the pH values of ~8 (7.5–7.9) and ~12.5 (12.3–12.7), respectively. Table 1 and Table 2 present critical electrochemical values drawn from the polarization curves. The values reported in Table 1 and Table 2 (Ecorr: corrosion potential; Ecp: critical passivation potential; Eb: breakdown potential; Ea/c tr: anodic-to-cathodic transition potential during reverse scanning; icorr: corrosion current density; ip: current density in the middle of the passive stage) are the average values drawn from three to five replicate runs. The critical potential values are highlighted in Figure 1a and Figure 2. All forward anodic portions are characterized by passivity in a great range of potentials (851–1207 mV vs. Ag/AgCl). Passive currents are very low (one to three orders of magnitude lower than 0.1 mA/cm2), suggesting true passivity.
A two-stage passive regime is discerned from the forward anodic curves at pH ≈ 12.5 (Figure 2). The low-potential passive regime is due to the formation of the well-established bi-layer film, as discussed in the Introduction. The breakdown of the first passive stage occurs at Eb1 due to the transpassive dissolution of the Cr2O3 barrier layer (Equation (1)), which leads to a depletion of Cr in the first atomic layers near the solution [55,56,57]. The very slow increase in current during the first passive stage has been associated with the formation of high valency Cr in the film prior to the massive transpassive dissolution [58]. The first film breakdown is followed by a stage of secondary passivity, where the chromate-based film is not as protective as the passive film prior to transpassive dissolution [57]. The secondary passivity stage ends at the second breakdown potential (Eb2), where some species in the solution, e.g., OH, are oxidized to give O2(g) (Equation (2)).
Cr2O3 + 5H2O → 2CrO42− + 10H+ + 6e
4OH → O2 + 2H2O + 4e
In the case of pH ≈ 8, the distinction between the two passive stages is not clear. However, upon closer observation, subtle increases in current are also discerned, though this occurs at higher Eb1 values compared to pH ≈ 12.5, which cannot be determined accurately. Breakdown becomes distinct at Eb2 (noted in Figure 1a), indicating that the breakdown caused by transpassive dissolution occurs over a potential range, whilst, at Eb2, transpassive dissolution contributes to the steep current increase at Eb2, besides the oxygen evolution reaction [59]. The different characteristics of passivity at the two pH values will further be discussed in Section 3.1.3.
The majority of the anodic polarization curves in Figure 1 and Figure 2 form positive hysteresis loops, namely lower current densities during reverse scanning as compared to forward scanning. Even in the cases of negative hysteresis, the surface areas of the loops are small and the anodic-to-cathodic transition potentials (Ea/c tr) are slightly nobler, equally noble or few decades of mV lower than the corrosion potentials (Ecorr), implying slightly nobler, equally noble or modestly more active surfaces as compared to the surfaces at Ecorr. The physical meaning of the aforementioned observation is further analyzed: a nobler anodic-to-cathodic transition potential compared to the corrosion potential suggests that the corroded area converts to act as a cathode, and its dissolution is retarded by the non-corroded area; conversely, the non-corroded area selectively corrodes. As a consequence, the corrosion of the alloy progresses in a uniform manner and mainly spreads to the width [60]. On the other hand, a less noble Ea/c tr in relation to Ecorr would suggest that the corroded area on the alloy would still act as an anode, leading to its accelerated corrosion by the non-corroded area as well as the protection of the non-corroded area that acts as a cathode. As a consequence, the corrosion of the alloy would spread to the depth causing the formation of many deep pits [60].) Therefore, the long regimes of true passivity, the positive hysteresis loops, and the usually nobler or equally noble anodic-to-cathodic transition potential values compared with the corrosion potential values imply a good resistance to localized corrosion for both types of stainless steel at both pH values [46,47,48,49,60,61].
In all cases, irrespective of FA content, steel type, and pH value, the reverse cathodic currents are similar to the forward ones, indicating insignificant surface damage at the end of the cyclic run.

3.1.2. The Effect of Fly Ash
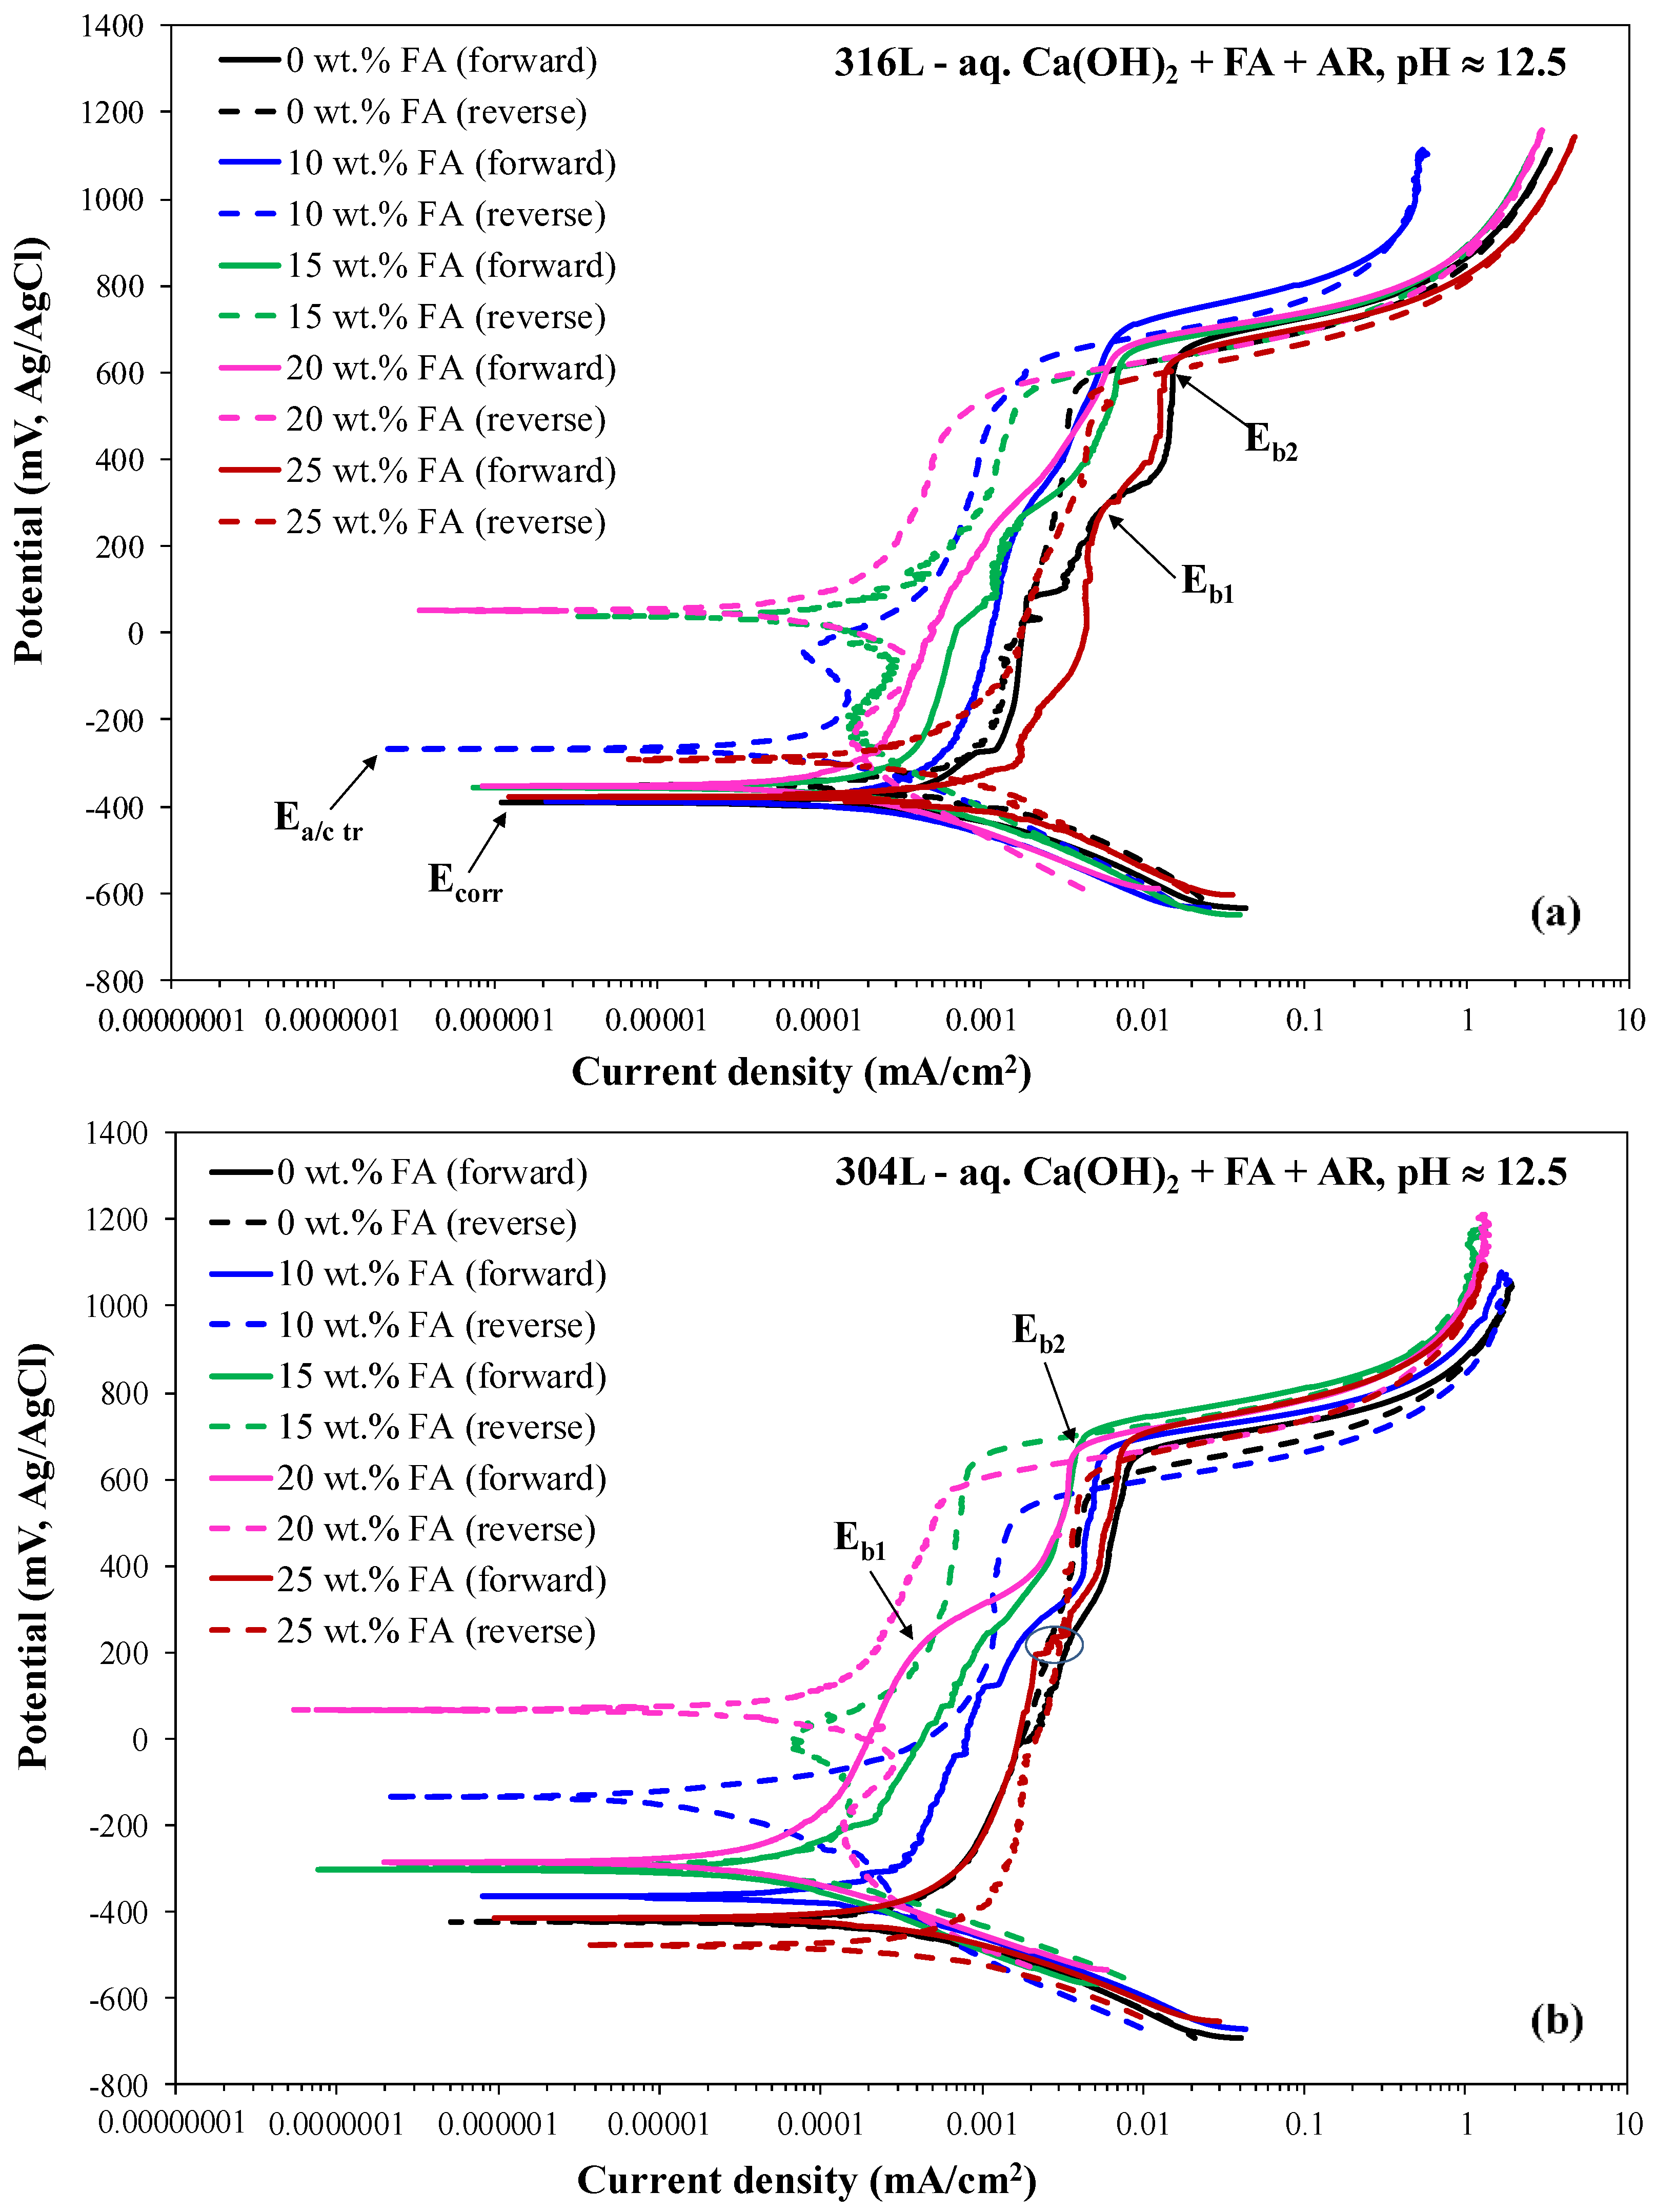
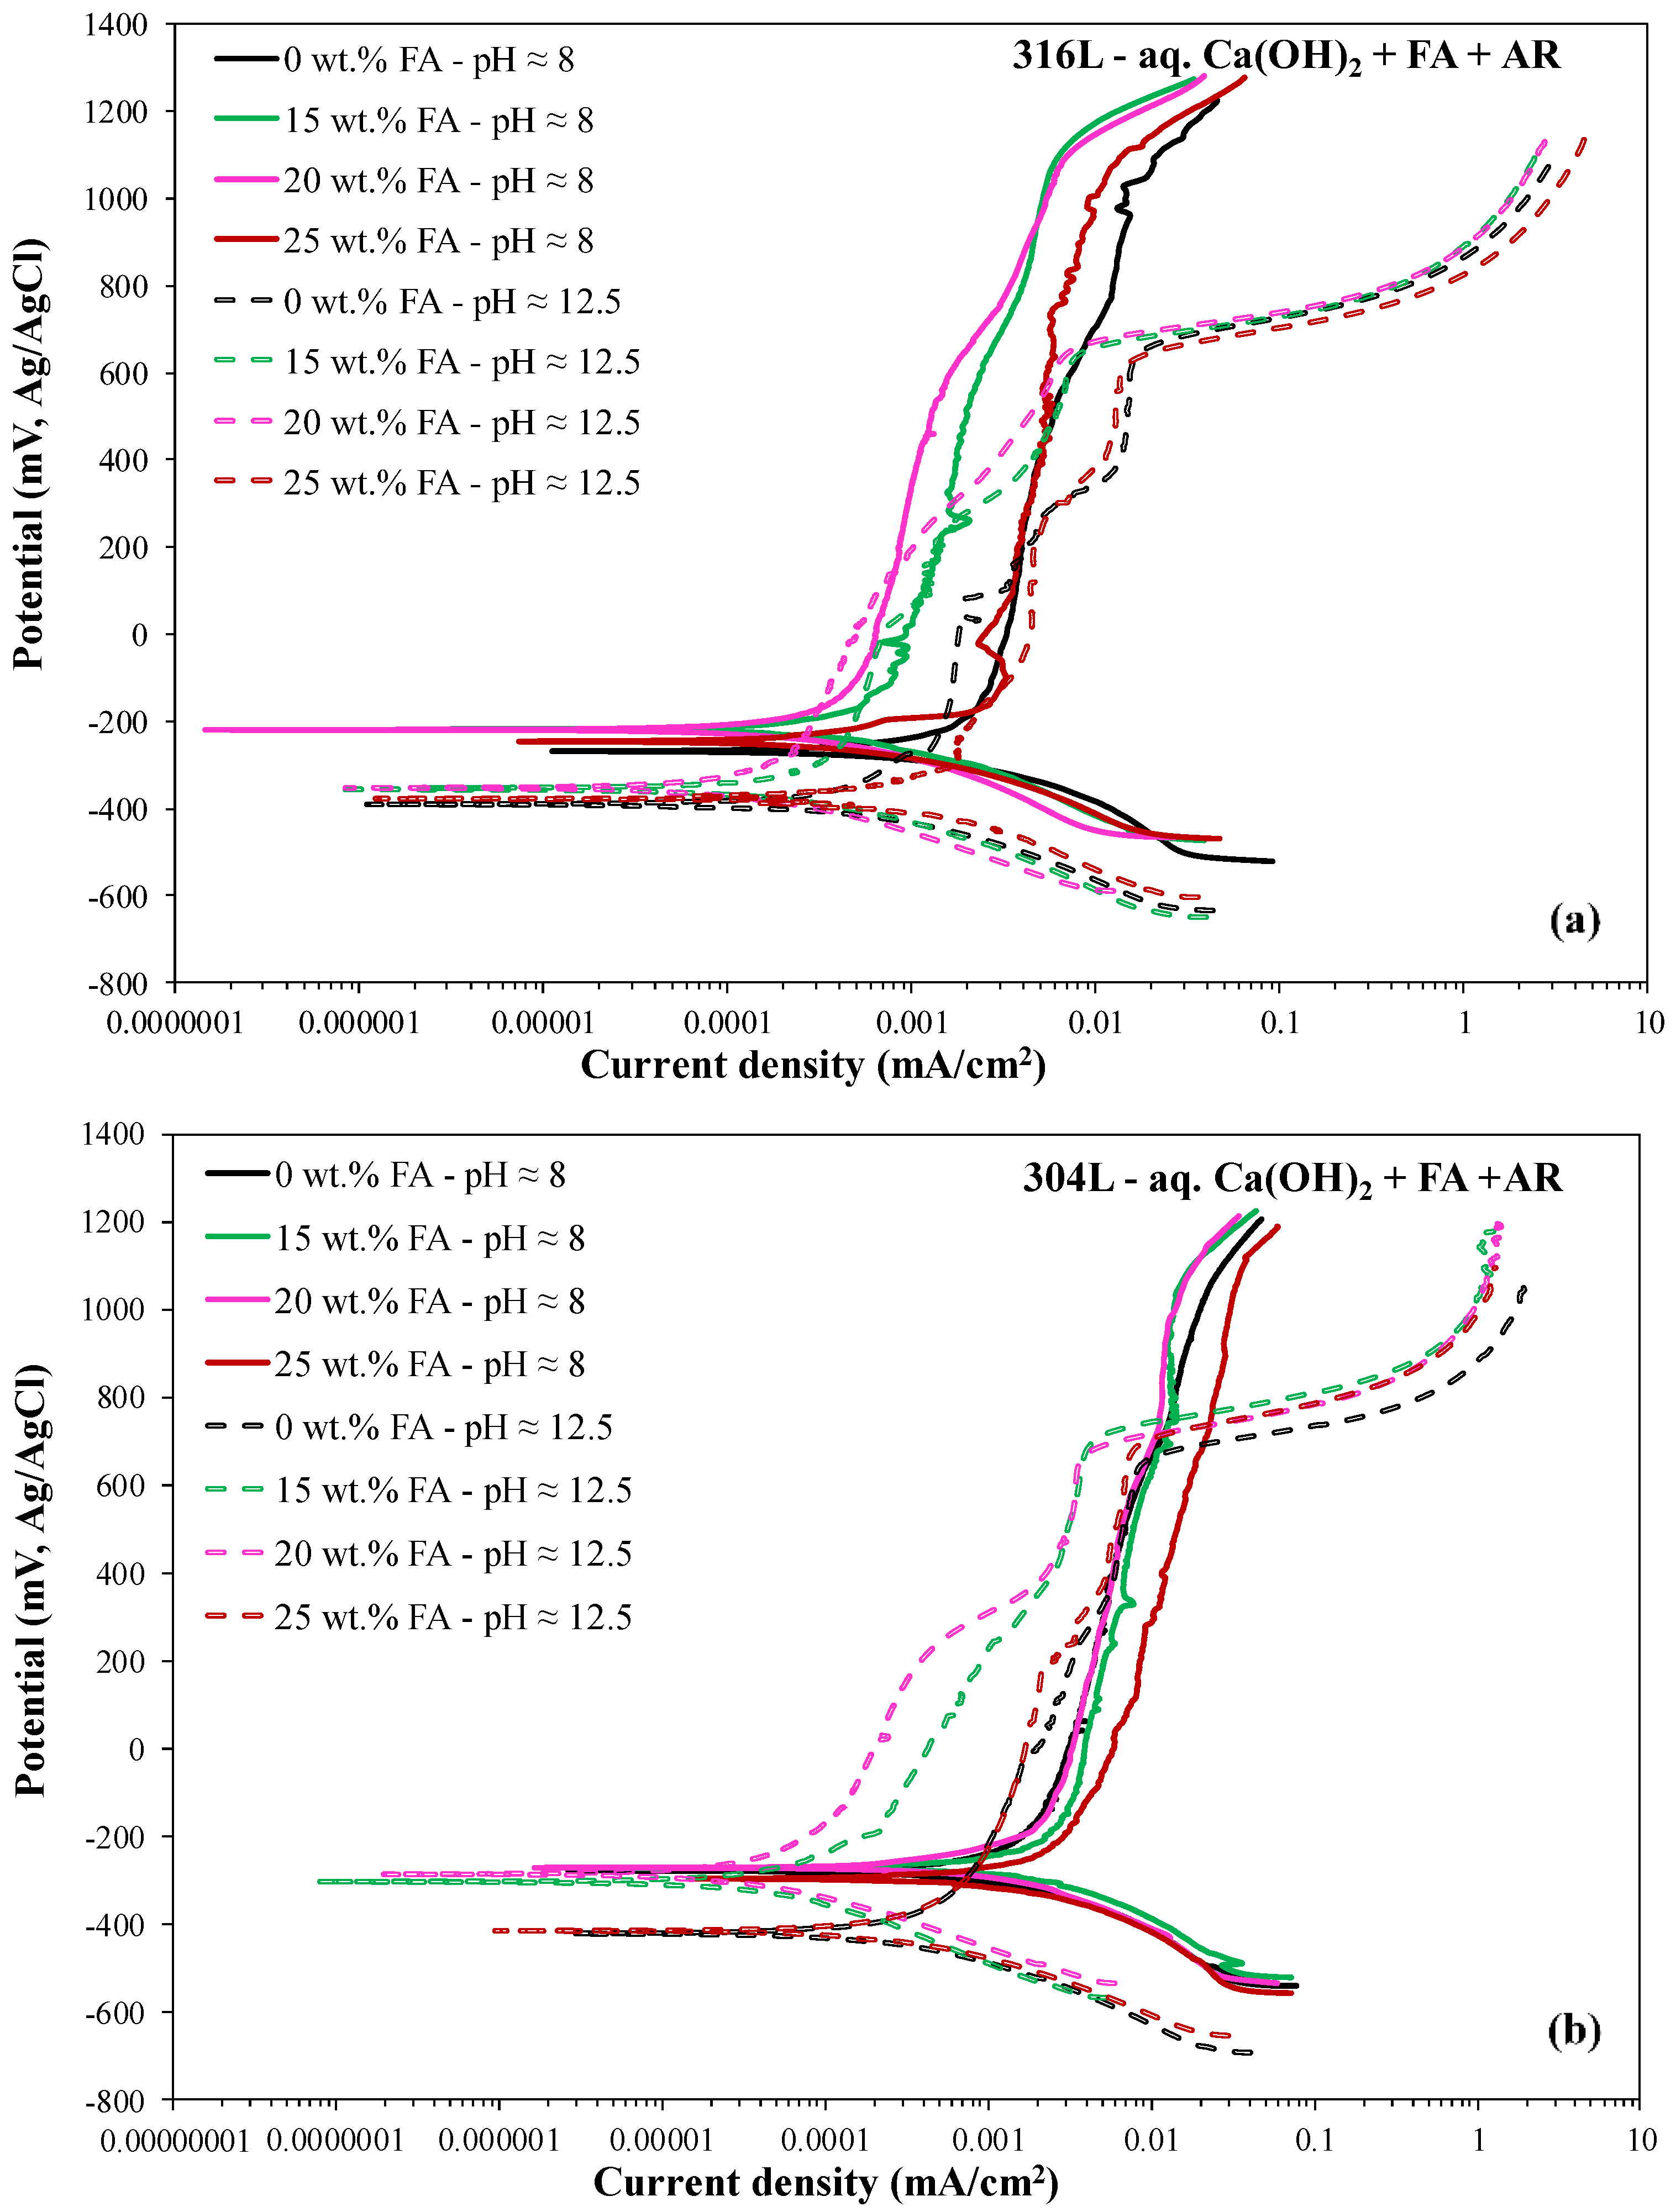
Table 1 and Table 2 show that the corrosion current density (icorr) and the passive current values decrease as the FA addition increases up to 20 wt.%, for both stainless steels and pH values. Slight increases in Ecorr with increasing FA content are also observed. Moreover, Figure 1 and Figure 2 manifest a clear shift of the forward anodic polarization curves to lower currents with increasing FA content up to 20 wt.%. However, the above trends reverse with the addition of 25 wt.% FA; the respective curves present greater corrosion current density values and greater passive current density values compared to the 10–20 wt.% FA curves.
Li et al. [62] identified three modes of CYP curves in steel rebars in strongly alkaline Ca(OH)2 solutions: (a) mode A, where pitting does not initiate up to the oxygen evolution potential or during the reverse scan; the anodic scan of mode A behavior is characterized by a positive hysteresis loop (i.e., smaller “reverse” currents than the “forward” ones corresponding to the same potential), as exhibited by curves “10–20 wt.% FA” in Figure 1a, curve “15 wt.% FA” in Figure 1b, curves “0–25 wt.% FA” in Figure 2a and curves “0–20 wt.% FA” in Figure 2b; (b) mode B, where pitting initiates at a potential near the potential of oxygen evolution, usually during forward scanning, but sometimes at a lower potential during reverse scanning; as a result, the positive hysteresis at high anodic potentials turns negative at lower anodic potentials, as shown by curves “0 and 25 wt.% FA” in Figure 1a and “0, 20, 25 wt.% FA” in Figure 1b; (c) mode C, where pitting initiates well below the potential of oxygen evolution during forward scanning, leading to a large negative hysteresis loop through the whole anodic scan.
Regarding the CYP mode of 316L at pH ≈ 8 (Figure 1a): The CYP mode of the 0 wt.% FA curve corresponds to mode B, where localized phenomena have occurred just below Eb2 (see spikes just below Eb2, noted by a red arrow in Figure 1a), leading to a negative hysteresis loop (i.e., higher “reverse” currents than “forward” ones at the same potential) of an appreciable surface area and an Ea/c tr potential that is slightly more negative than the Ecorr potential; pitting just below Eb2 may account for the clearly lower value of Eb2 compared to the breakdown potential of the 10–25% FA curves in Figure 1a. The CYP modes of the 10, 15, and 20 wt.% FA curves correspond to mode A, with positive hysteresis loops presenting large surface areas, especially in the cases of 15 and 20 wt.% FA, suggesting the absence of any localized phenomena. The CYP mode of the 25 wt.% FA curve corresponds to mode B, where hysteresis turns negative ~350 mV below Eb2 during reverse scanning; taking into account the slightly jagged pattern of the forward anodic curve in contrast with the intensive jagged pattern of the reverse anodic curve, the likely occurrence of localized phenomena during reverse scanning is implied. Nevertheless, the negative hysteresis surface area is quite small and the Ea/c tr value is slightly nobler than the Ecorr value, indicating that the occurrence of pitting is highly localized. It should be noted that in the case of 0% FA, three out of five replicate runs led to mode A, and two out of five runs led to mode B; in the case of 10 wt.% FA, two thirds of the replicate runs led to mode A, and one third led to mode B; and in the case of 15 wt.% FA, two out of five of the replicate runs led to mode A, and three out of five led to mode B. In the case of 20 wt.% FA, all of the replicate runs led to mode A; in the case of 25 wt.% FA, one third of replicate runs led to mode A, and two thirds led to mode B.
Regarding the CYP mode of 304L at pH ≈ 8 (Figure 1b): The CYP mode of the 0 wt.% FA curve corresponds to mode B, where localized phenomena have occurred just below Eb2, leading to a negative hysteresis loop of small but appreciable surface area and an Ea/c tr potential that is 28 mV more negative than the Ecorr potential. The CYP mode of the 15 wt.% FA curve corresponds to mode A, whereas the CYP mode of the 20% FA curve corresponds to mode B but with negligible negative hysteresis, starting at ~450 mV below Eb2. The mode of the 25 wt.% FA curve also corresponds to mode B, where localized phenomena have been initiated during reverse scanning at ~550 mV below Eb2. Here, it should be noted that in the case of 0 wt.% FA, two thirds of the specimens of the replicate runs behaved according to mode B (localized phenomena during reverse scanning) and one third behaved according to mode A (an absence of any localized phenomena); in the cases of 10 wt.% FA, 15 wt.% FA, and 20 wt.% FA, two out of four of the replicate runs led to mode A and two out of four of the replicate runs led to mode B; in the case of 25 wt.% FA, all of the specimens of the replicate runs behaved according to mode B.
Whether the negative hysteresis (of a small but noticeable surface area) of the 25 wt.% FA curves starting several hundred mV below Eb2 (pH ≈ 8) during reverse scanning is associated with pitting will further be investigated by microstructural observations. In any case, localized phenomena, if any, seem to have occurred several hundred mV below the potential of oxygen evolution (EOE) during reverse scanning, showing that attaining the oxygen evolution state is kinetically faster than attaining pitting in agreement with Wang et al. [22].
Regarding the CYP mode of 316L at pH ≈ 12.5 (Figure 2a): The CYP modes of all the curves of Figure 2a correspond to mode A, with positive hysteresis loops presenting large surface areas in the cases of 10, 15, and 20 wt.% FA, implying the absence of localized phenomena. It should be noted that in the case of 0 wt.% FA, two out of four of the specimens of the replicate runs behaved according to mode A, and two out of four behaved according to mode B; in the case of the 10 wt.% FA, the majority (four fifths) of the specimens of the replicate runs behaved according to mode A, and one fifth behaved according to mode C; in the cases of the 15 wt.% FA and 25 wt. FA, three quarters of the specimens of the replicate runs behaved according to mode A, and one quarter behaved according to mode B; in the case of 20 wt.% FA, all of the specimens of the replicate runs behaved according to mode A.
Regarding the CYP mode of 304L at pH≈12.5 (Figure 2b): The CYP modes of the 0, 10, 15, and 20% FA curves of Figure 2b correspond to mode A, with positive hysteresis loops presenting large surface areas in the cases of 10, 15, and 20 wt.% FA. The CYP mode of the 25 wt.% FA curve differs from modes A, B, and C; current fluctuations just above Eb1, namely just above the transpassive potential (noted by an ellipsis in Figure 2b), are associated with a negative hysteresis loop and an Ea/c tr potential that is 60 mV more negative than the Ecorr potential. Here, it should be noted that in the cases of the 0, 15, and 20 wt.% FA, all of the specimens of the replicate runs behaved according to mode A; in the case of the 10 wt.% FA, two thirds of the specimens of the replicate runs behaved according to mode A, and one third behaved according to mode B; in the case of 25 wt.% FA, one third of the specimens of the replicate runs behaved according to mode A, one third of the specimens of the replicate runs behaved according to mode B, and one third of the specimens of the replicate runs as in Figure 2b.
Often, at pH ≈ 12.5, the reverse scan above Eb2 = EOE corresponds to slightly greater current densities in comparison with the forward scan. In the context of positive hysteresis (i.e., lower reverse currents than forward ones) just below EOE, the above mentioned current increase can be attributed to surface modification due to the O2 evolution process, in agreement with Abreu et al. [63].
To conclude, partial replacement of Ca(OH)2 with FA up to 20 wt.% FA has a beneficial effect on the polarization behavior of the stainless steel rebars under the attack of acid rain mimicking solution in terms of thermodynamic tendency for corrosion (slightly but consistently increasing Ecorr with FA content), corrosion kinetics (decreasing icorr with FA content), and passive film stability (decreasing ip and, in most cases, slightly increasing (Eb − Ecp) with FA content). Replacement of Ca(OH)2 with 20 wt.% FA leads to the highest localized corrosion resistance (in terms of the highest fraction of replicate runs with a positive hysteresis loop (i.e., lower “reverse” currents than “forward” ones corresponding to the same potential) and the highest positive values or lowest negative values of (Ea/c tr − Ecorr); however, replacement with 25 wt.% FA leads to the lowest localized corrosion resistance (in terms of the highest fraction of replicate runs with positive hysteresis turning negative during reverse scanning, and, in most cases, the lowest positive values of (Ea/c tr − Ecorr)).
The reasons for the aforementioned effect of FA addition will be discussed in Section 3.2.

3.1.3. Effect of pH

Figure 3 illustrates the effect of pH on the forward polarization curves of 316L (Figure 3a) and 304L (Figure 3b).
It is generally observed that a higher pH results in a lower corrosion potential for both steels and all FA contents. The decrease in Ecorr with increasing pH from 8 to 12.5 can mainly be attributed to the effect of pH on cathodic processes, namely: (a) in the pH range of 8 to 12.5, the predominant reduction process is oxygen reduction. Its electrochemical potential decreases as pH increases [55]. Hence, in the presence of dissolved oxygen, the electrochemical potentials of the equilibria Fe/Fe3O4, Fe/FeO or Fe/Fe(OH)2, Cr/CrO or Cr/Cr(OH)2, CrO/Cr2O3 or Cr(OH)2/Cr(OH)3·nH2O, Cr/Cr2O3 or Cr/Cr(OH)3, Ni/NiO or Ni/Ni(OH)2, and Mo/MoO42− decrease with increasing pH [55]. (b) The reduction of Fe3+ to Fe2+ also contributes to the determination of Ecorr [64]. Freire et al. reported that the Fe2+/Fe3+ ratio in the surface film of 316L in alkaline media increases with increasing pH; accordingly, the potential of the redox couple decreases, resulting in more negative corrosion potential values [19].
In Table 1 and Table 2 it is observed that the corrosion current density values at pH ≈ 8 are markedly higher than those at pH ≈ 12.5, for both steels and all FA contents. This trend can be attributed to the relatively fast dissolution of Fe at pH ≈ 8, as follows: at pH ≈ 8, Cr-oxides have higher stability whereas Fe-oxides have lower stability compared to pH ≈ 12.5 [3]. Hence, at pH ≈ 8, iron oxides in the external layer of the steel surface film gradually decompose and release soluble ions into the electrolyte; consequently, metallic iron dissolution from the substrate below the film into the defective film layer (as Fe(OH)aq) is promoted [65]. Ni dissolution follows at a lower rate [66]. In turn, Cr from the steel substrate dissolves through and into the loose/porous FeOOH/Fe(OH)3 layer formed during the decomposition of iron oxides, but it rapidly passivates [3]. Garcés et al. [67] also noticed a decrease in icorr of corrugated 1030 steel rebars in s. Ca(OH)2 containing FeCl2 as pH increased from 9.5 to 14.
In the case of 316L, the passive currents at pH ≈ 12.5 are greater than those at pH ≈ 8, suggesting the formation of passive films of higher conductivity. The most likely reason for the inferior passivity of 316L at pH ≈ 12.5 with respect to pH ≈ 8 is associated with the poor performance of Mo in strongly alkaline environments, as reported in the Introduction. According to Montemor et al. [18], Mo in stainless steels modifies the properties of the passive film by introducing changes in its defect structure, namely, by decreasing the number of acceptors of the p-type Cr-oxide layers and decreasing the number of donors of the outer n-type (semiconductive) Fe-rich oxide layers. However, in strongly alkaline conditions, Mo is highly unstable, exhibiting a dissolution rate that is more than one order of magnitude higher than that in a neutral solution [68]. The result of the inferior passivity of 316L at pH ≈ 12.5 is compatible with the works of Mesquita et al. [45] and Refaey et al. [69]; the former noted the negative influence of Mo on the pitting resistance of 316L at pH = 12.5, whereas the latter measured a lower pitting potential for 316L than 304L, at pH = 12. The work of Ai et al. [3] also agrees with this, as addressed in the Introduction.
Conversely, in the case of 304L, the passive currents at pH ≈ 12.5 are lower than those at pH ≈ 8 (Figure 3b), suggesting the formation of passive films of lower conductivity compared to those at pH ≈ 8. First, the Mo that could negatively affect the passivity of the austenitic steel is absent in 304L steel. Second, in basic solutions under an applied anodic polarization, hydroxyl ions are selectively attracted to the metallic surface, thus promoting the stability of the passive film [70]. OH ions are also attracted to the surface of 316L at pH ≈ 12.5, however, it appears that their positive effect on the passive film is surpassed by the negative effect of Mo. Third, as Olsson and Landolt [71] reported (and in accordance with a previous paragraph), the main effect of a higher pH is a lower dissolution rate. This results in a thicker passive film with a larger fraction of iron in it, since Fe-oxides are more stable in alkaline solutions. Schmutz and Landolt [72] found that the oxidized iron present in the outer part of the passive film of an Fe-25Cr alloy in 0.1 M NaOH (pH = 13) had a stabilizing effect.
The decrease in the breakdown potential (Eb2) with pH for both steels and all FA contents are in agreement with the respective decrease in the oxygen evolution potential.
As mentioned in 3.1.1, in the case of pH ≈ 8, the distinction between the two passive stages is not as clear as in the case of pH ≈ 12.5. This observation is in agreement with the Cr-H2O Pourbaix diagram [55], where the difference between the oxygen evolution potential and the transpassivity onset potential at pH ≈ 8 is notably smaller than that at pH ≈ 12.5.

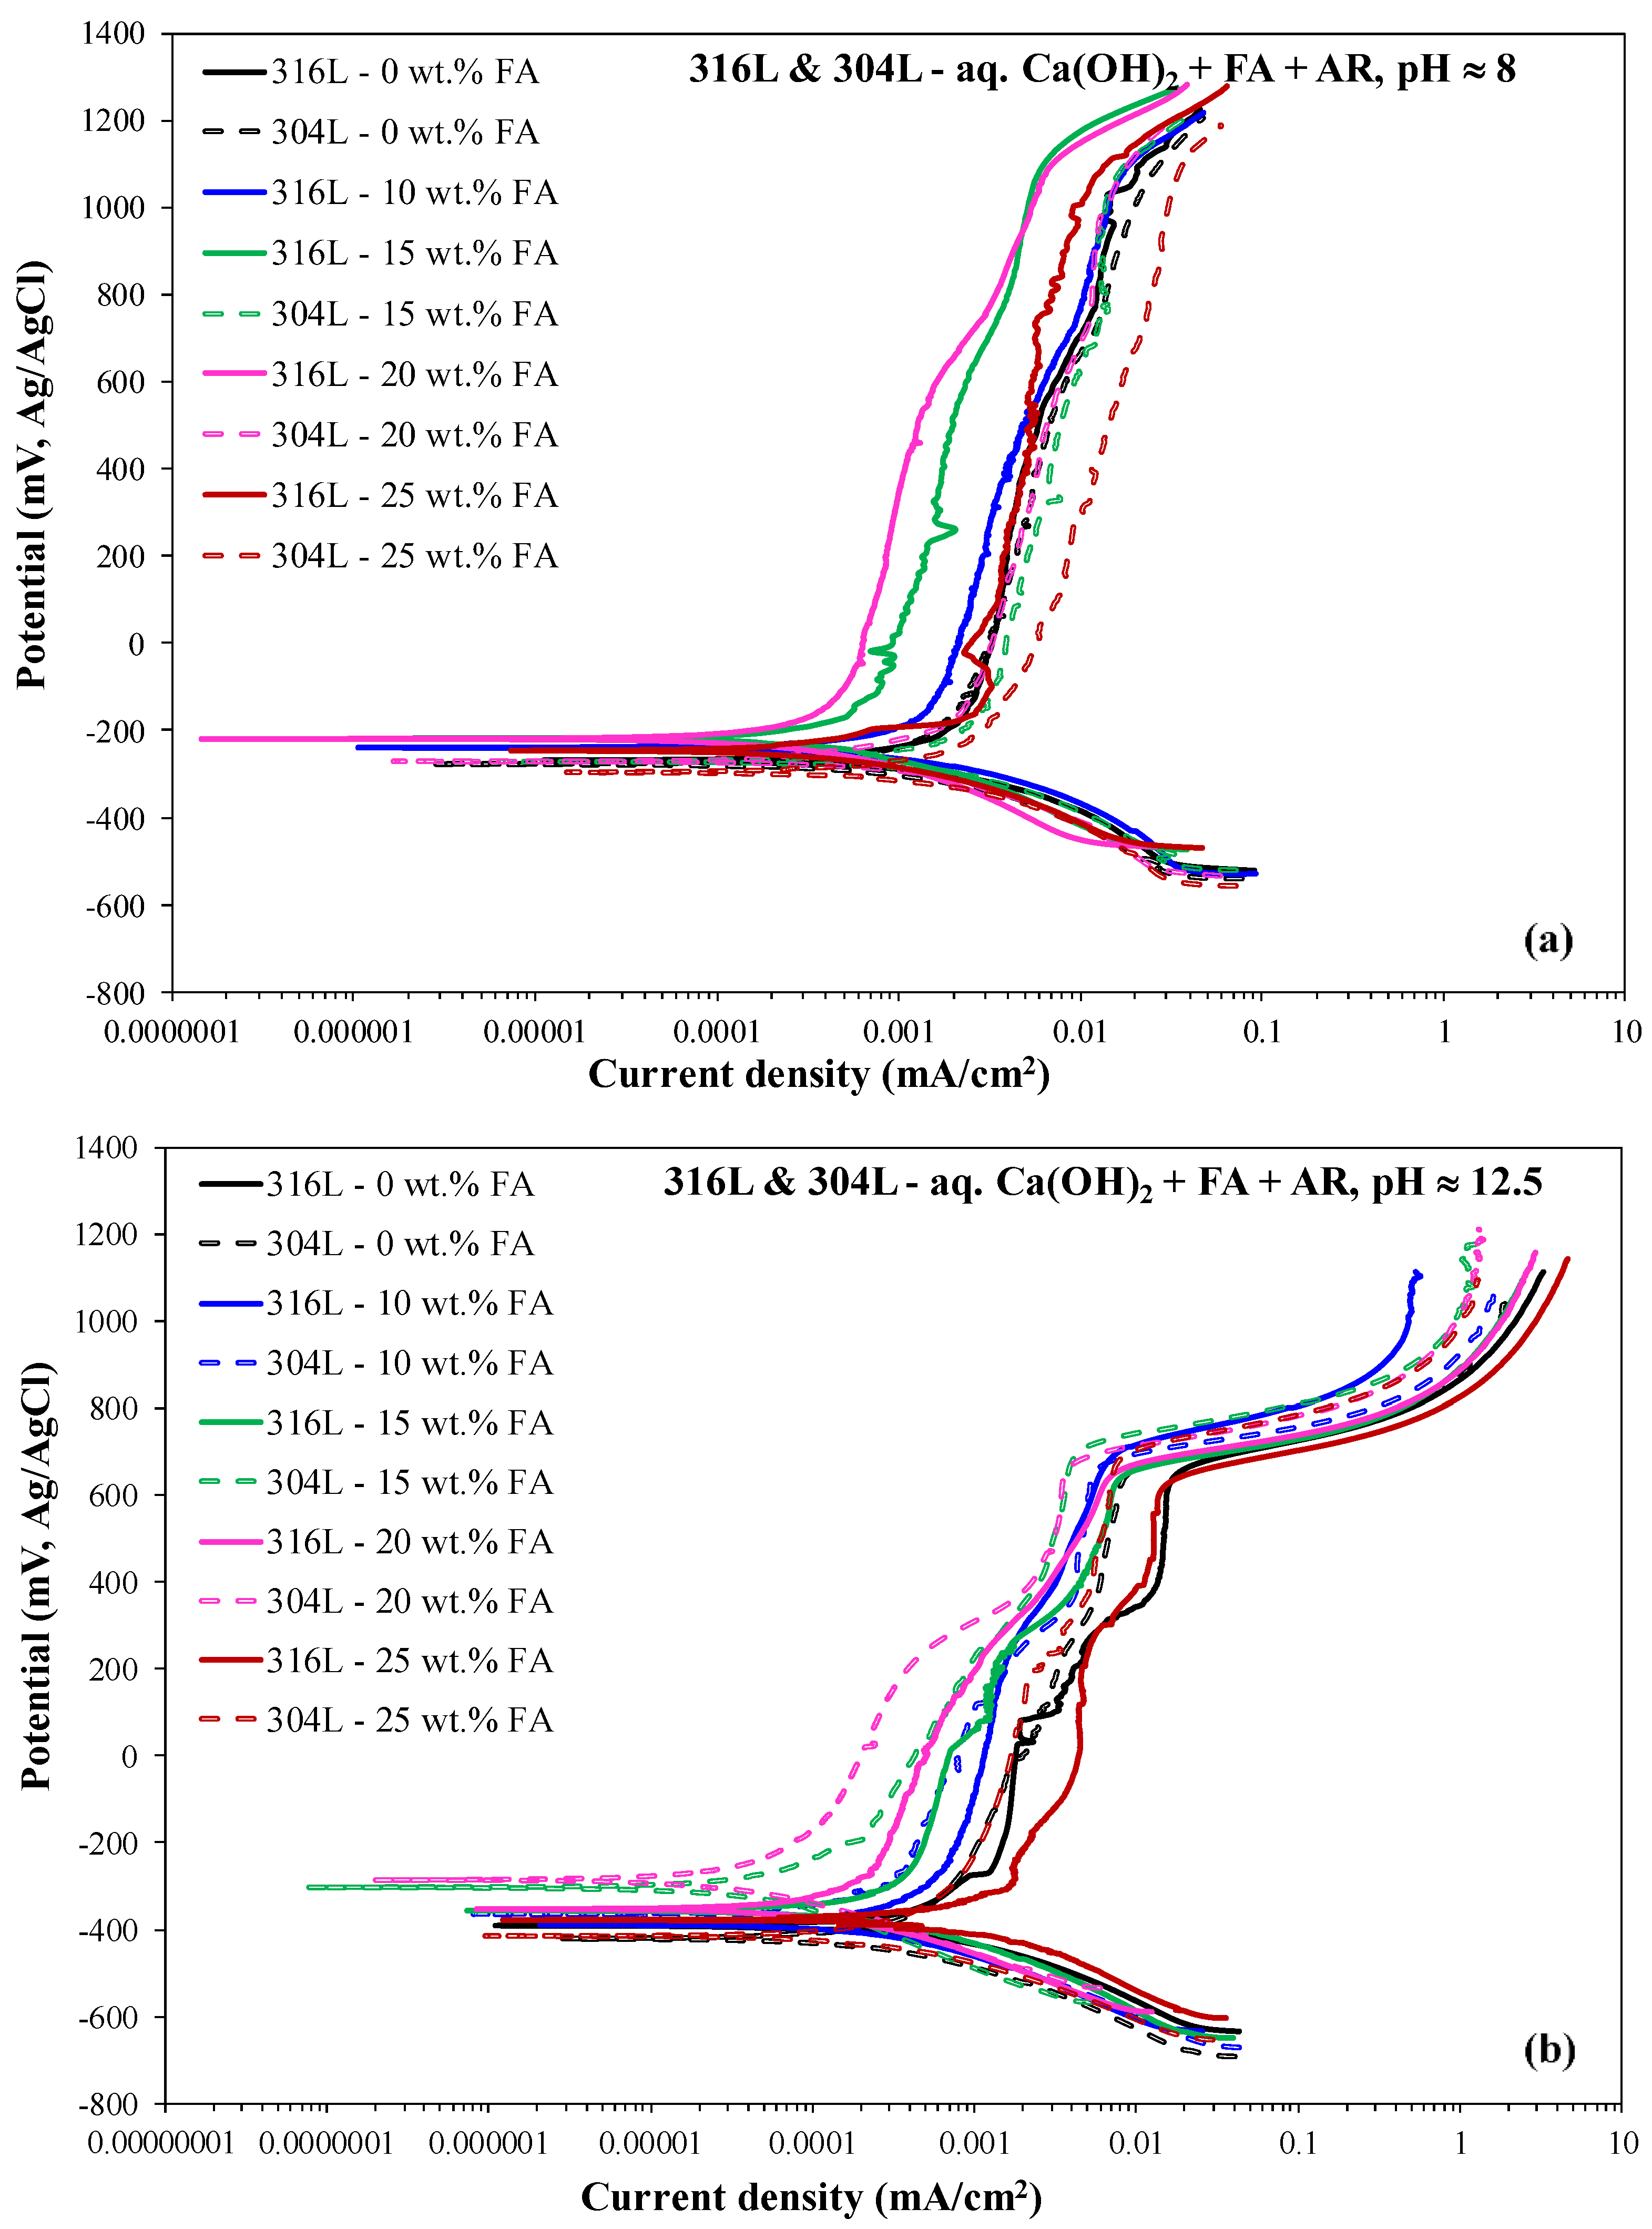
3.1.4. Effect of Stainless Steel Type

The effect of stainless steel type on the voltammograms at the two different pH values is illustrated in Figure 4a (pH ≈ 8) and Figure 4b (pH ≈ 12.5).
304L behaves exceptionally well at pH ≈ 12.5. In all cases of FA content, 304L exhibits lower icorr than 316L (Table 2). The aforementioned instability of Mo in strongly alkaline conditions may account for the relatively high corrosion current densities of 316L at pH ≈ 12.5. Indeed, the facilitation of high general corrosion rates of austenitic and duplex stainless steels in strongly caustic electrolytes by molybdenum (due to its active corrosion to MoO42−) has previously been demonstrated [73,74]. Similarly, the low passive currents exhibited by 304L as compared to 316L at pH ≈ 12.5 (Table 2 and Figure 4b) are justified by the absence of Mo in 304L, since, as aforementioned in Section 3.1.3, Mo has a negative influence on the passivity of the steel [22,45,69].
On the other hand, 316L exhibited lower icorr than 304L at pH ≈ 8 (Table 1). This is mainly caused by the presence of Mo in 316L. It is established that Mo affects dissolution kinetics and inhibits the active dissolution current density of stainless steels [75]. The transient dissolution of MoO42− in the active stage and the formation of Mo6+ species (such as oxy-hydroxides or molybdates) in the surface film formed in the active region may reduce the concentration of metal cations in the corrosive system and, consequently, the corrosion current density [76]. Likewise, the low passive currents of the voltammograms of 316L as compared to 304L at pH ≈ 8 (Figure 4a and Table 1) are mainly attributed to the stabilization effect of Mo on the passive film, as aforementioned in Section 3.1.3. In addition, at pH ≈ 8, 316L exhibits a smaller fraction of mode B-CYP curves than 304L, reflecting its superior localized corrosion response.
To conclude, at pH ≈ 12.5, 304L shows better performance than 316L in terms of lower corrosion current density and lower passive current densities. Conversely, at pH ≈ 8, 316L shows superior performance to 304L in terms of lower corrosion current density and lower passive current densities.

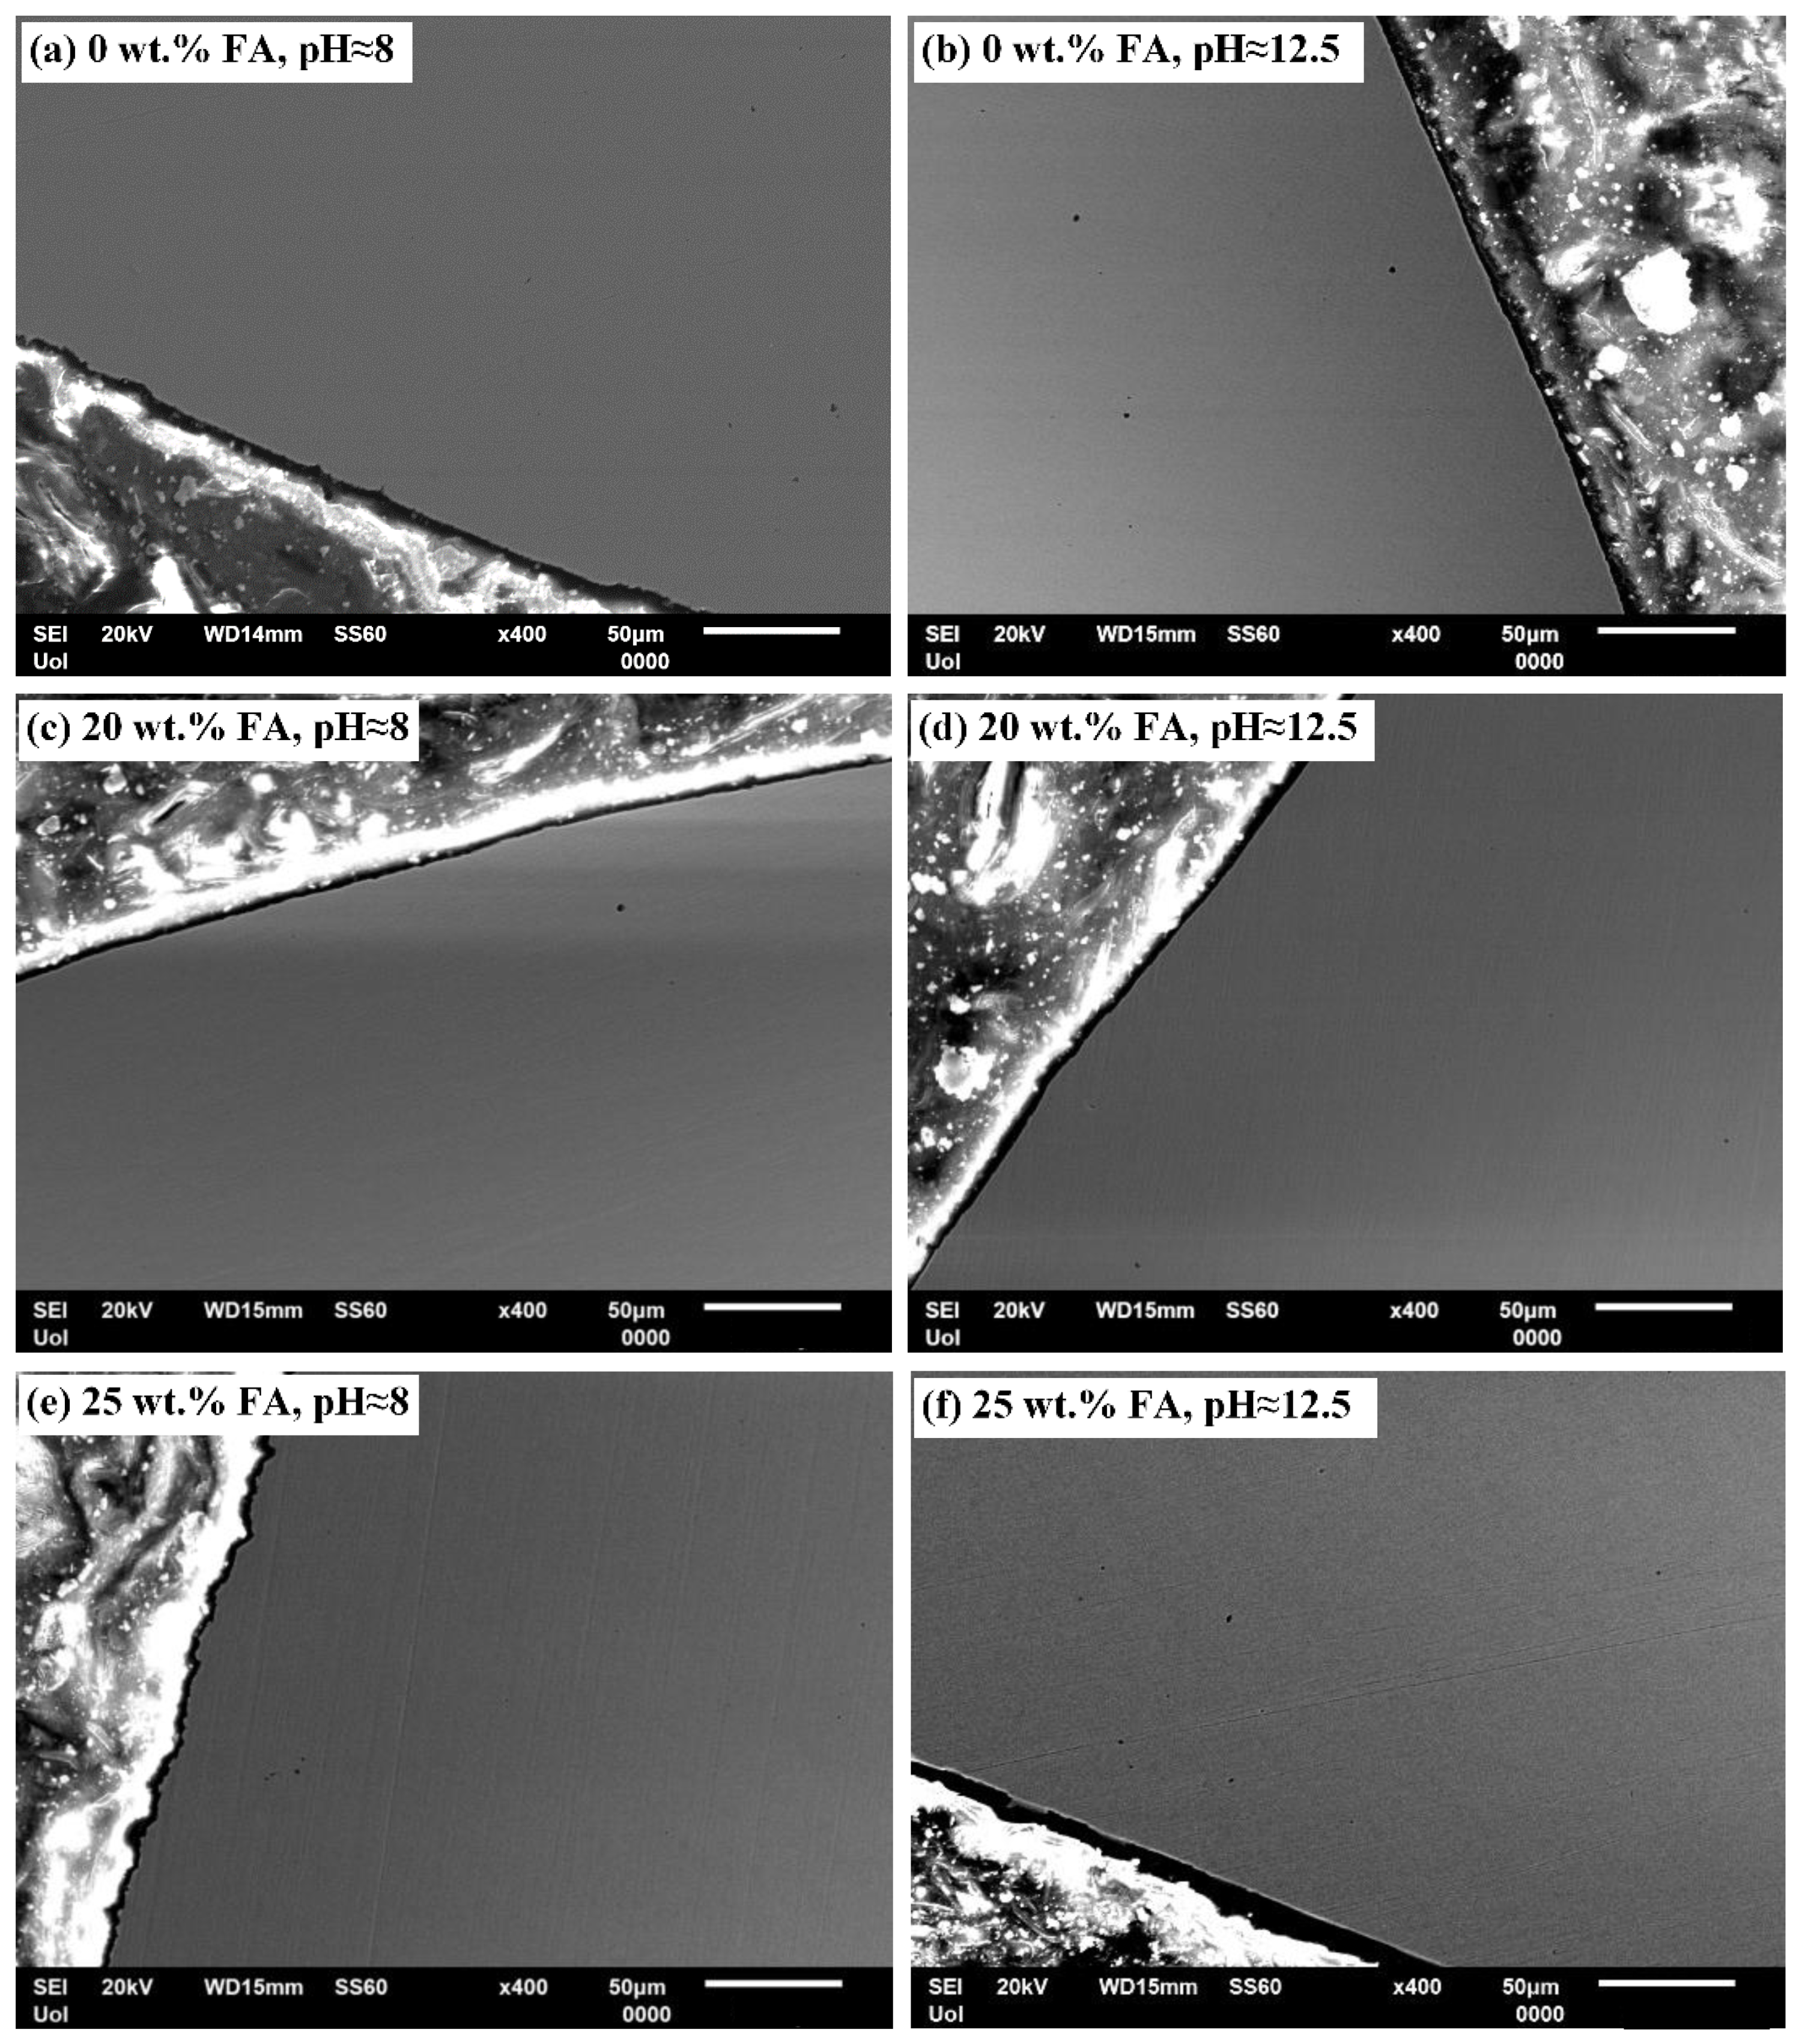
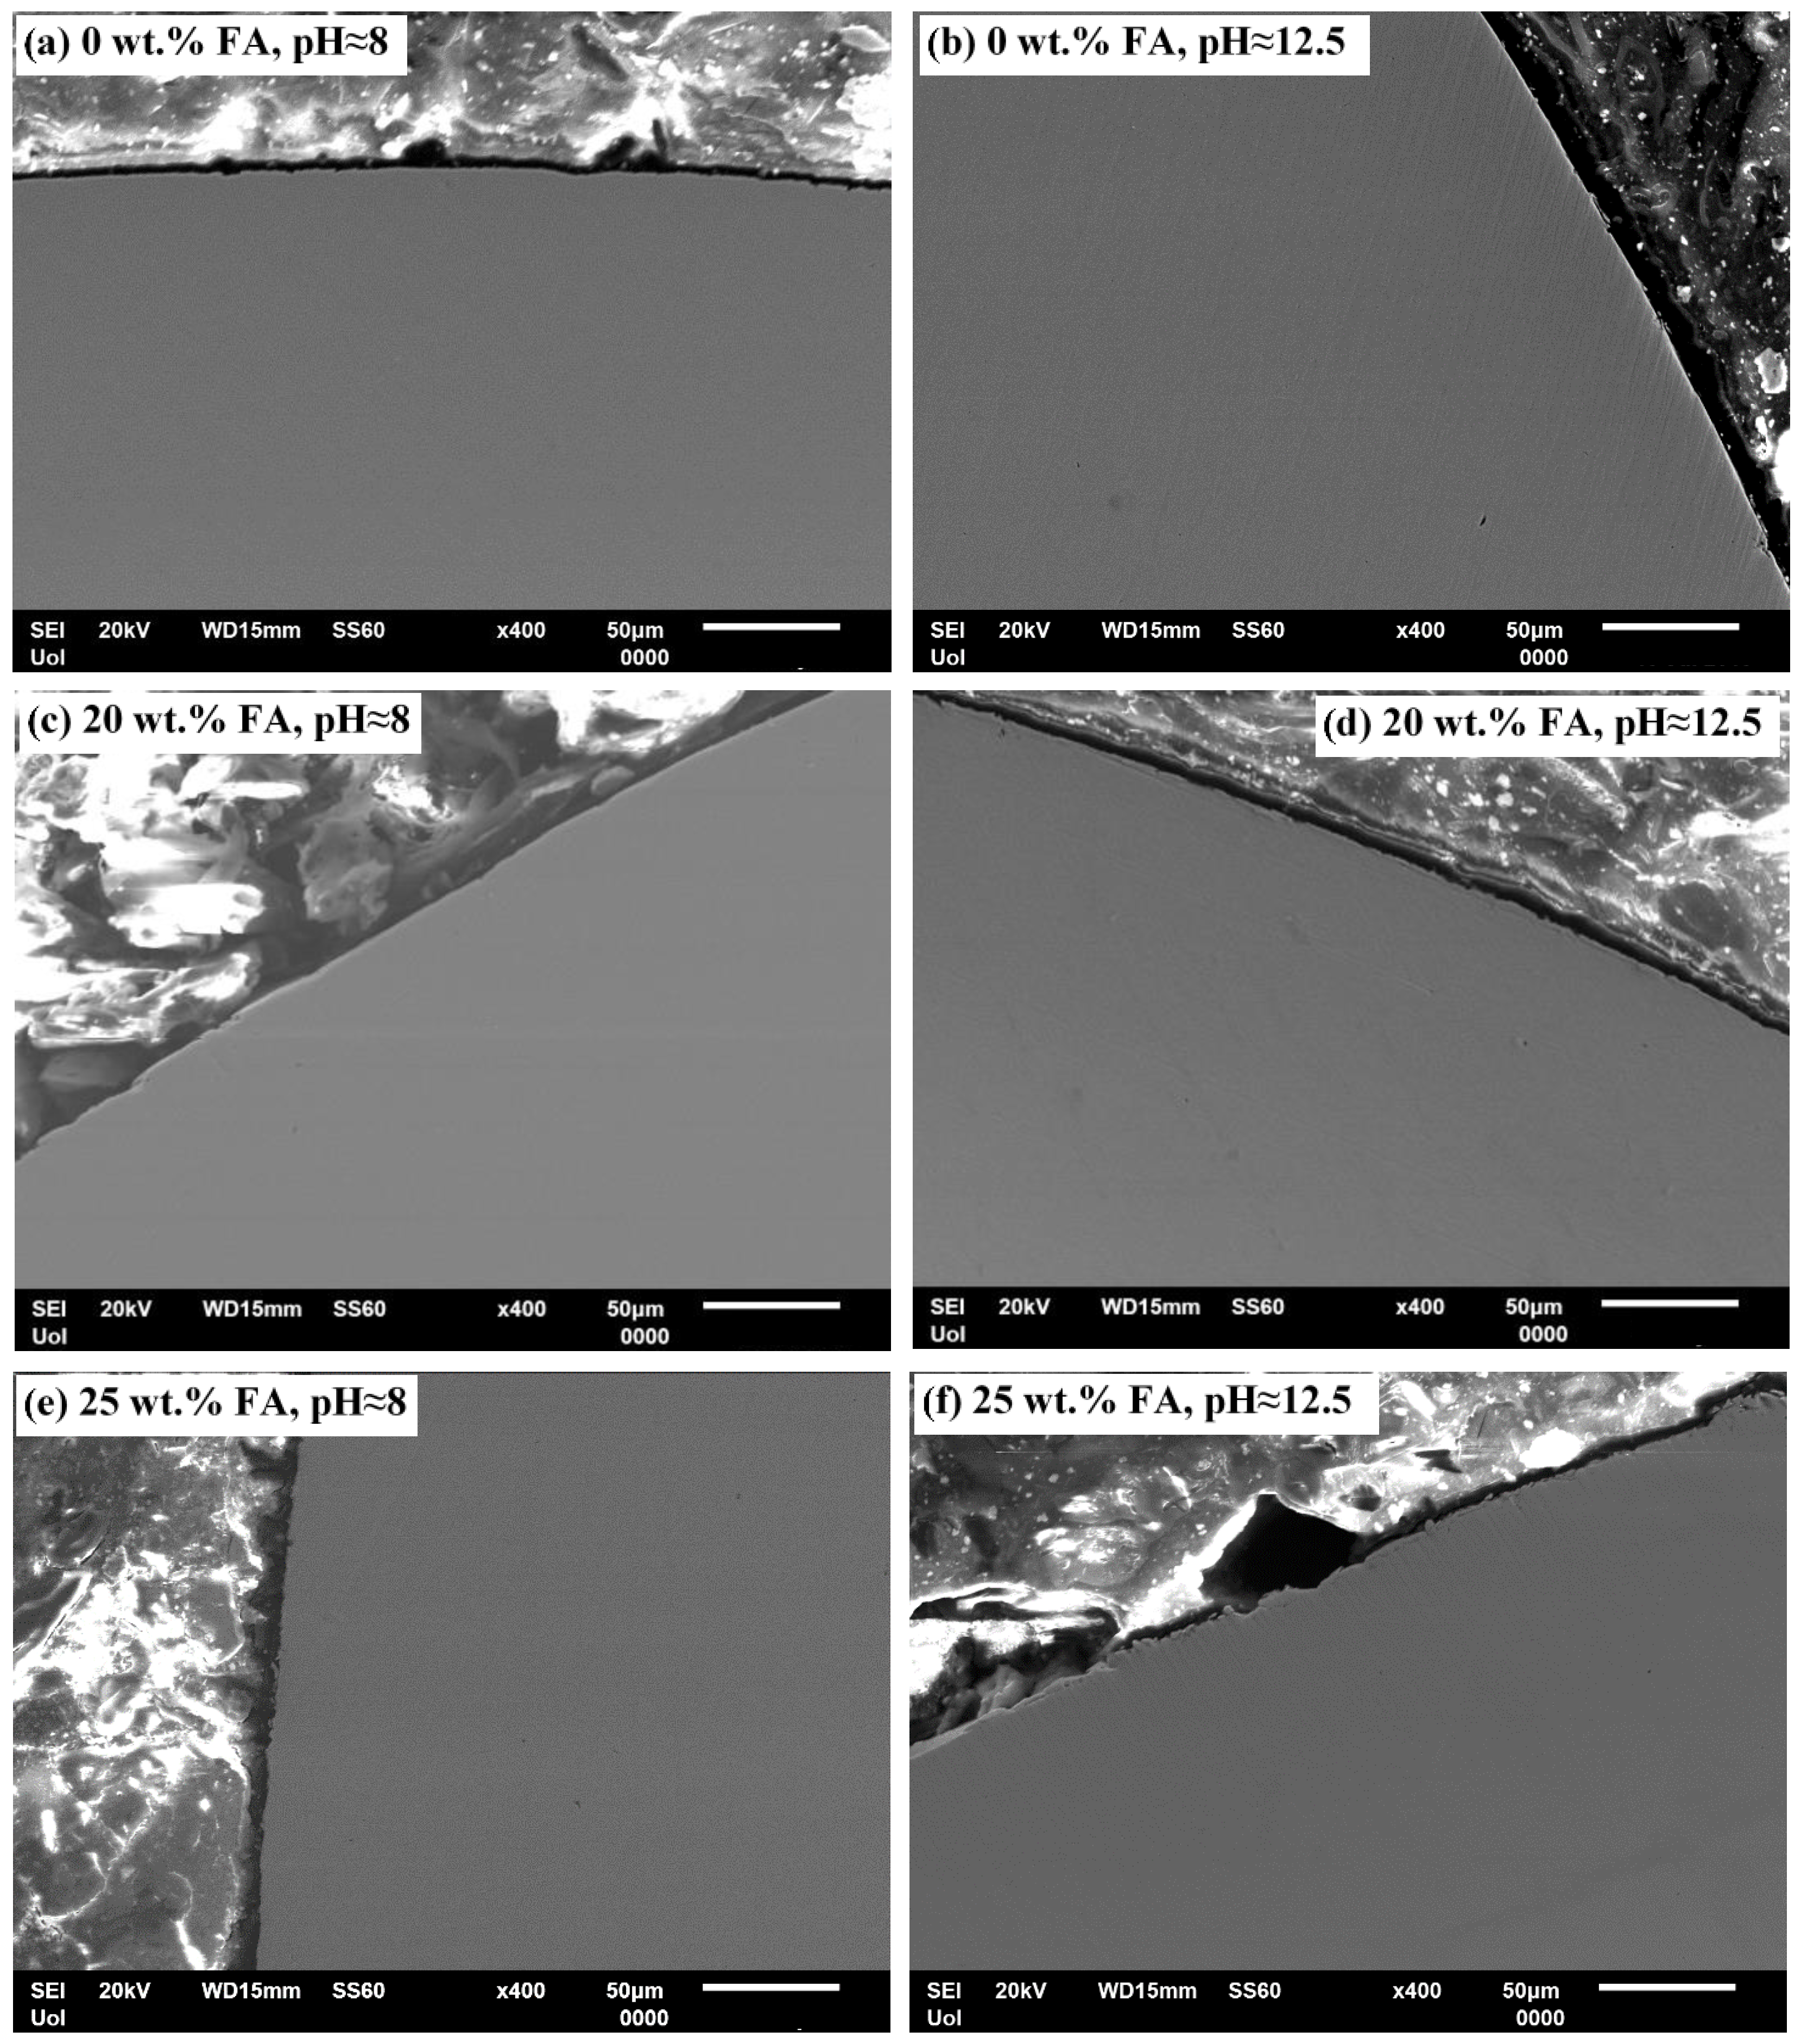
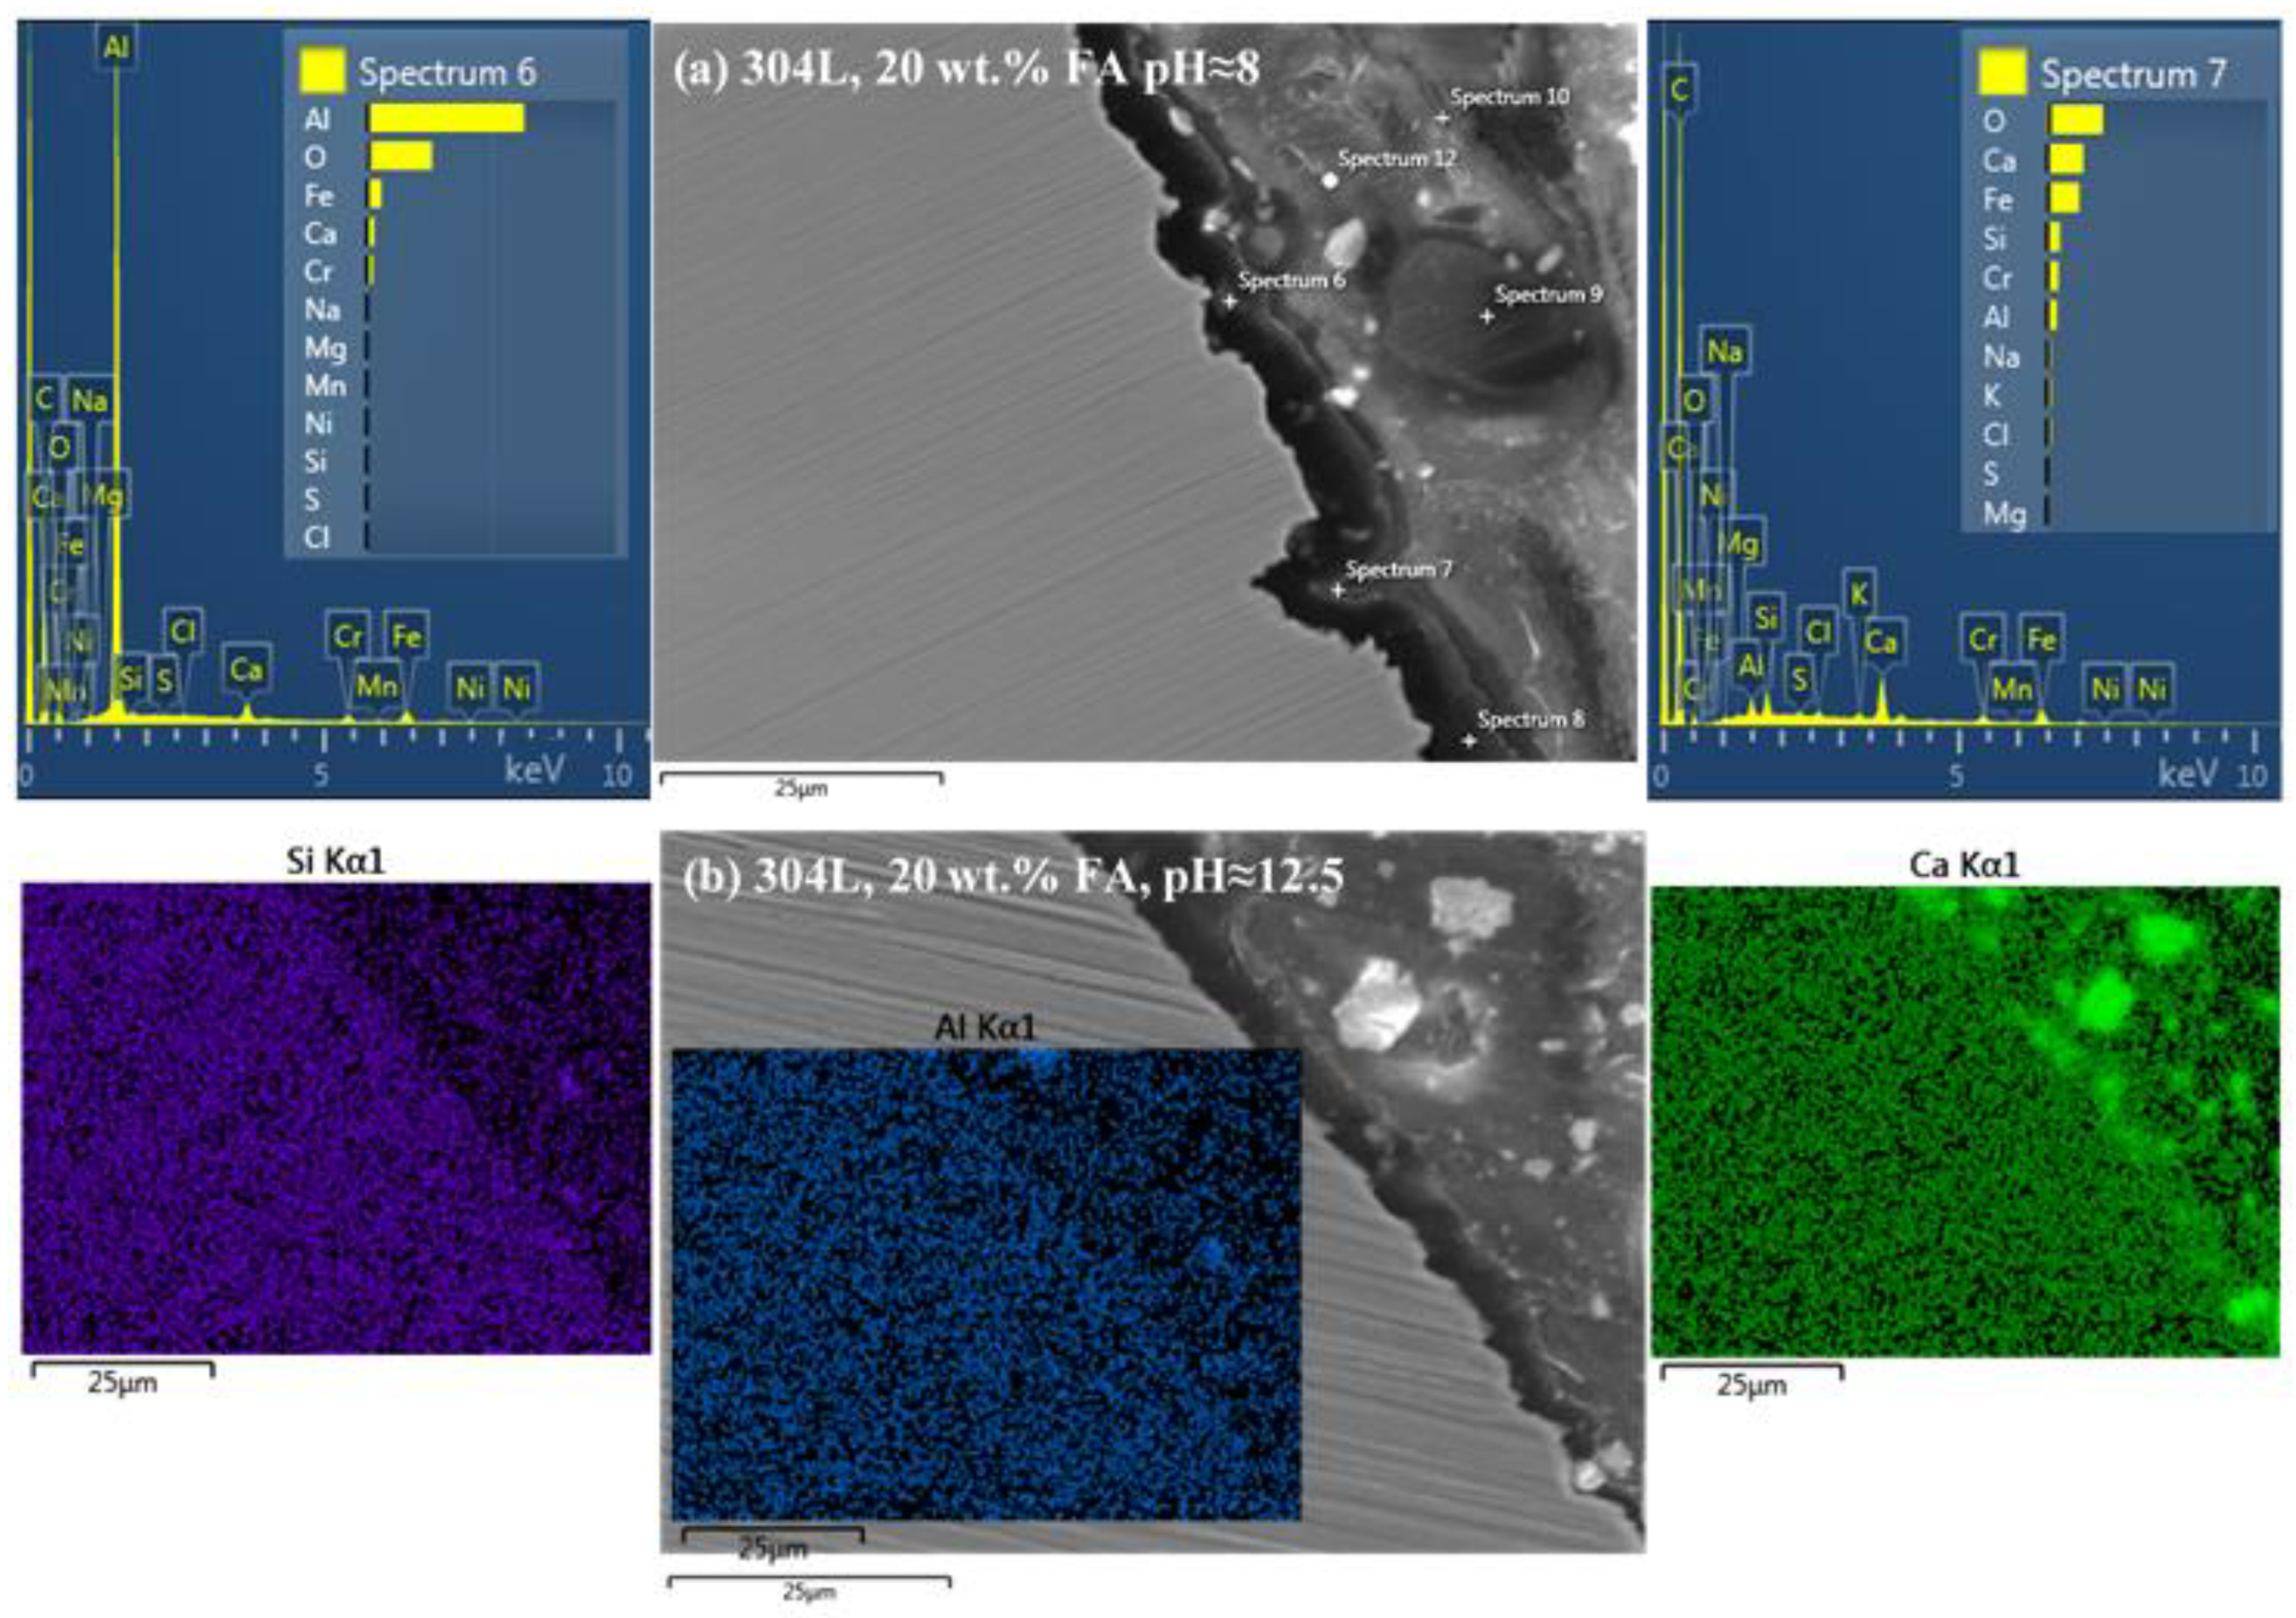
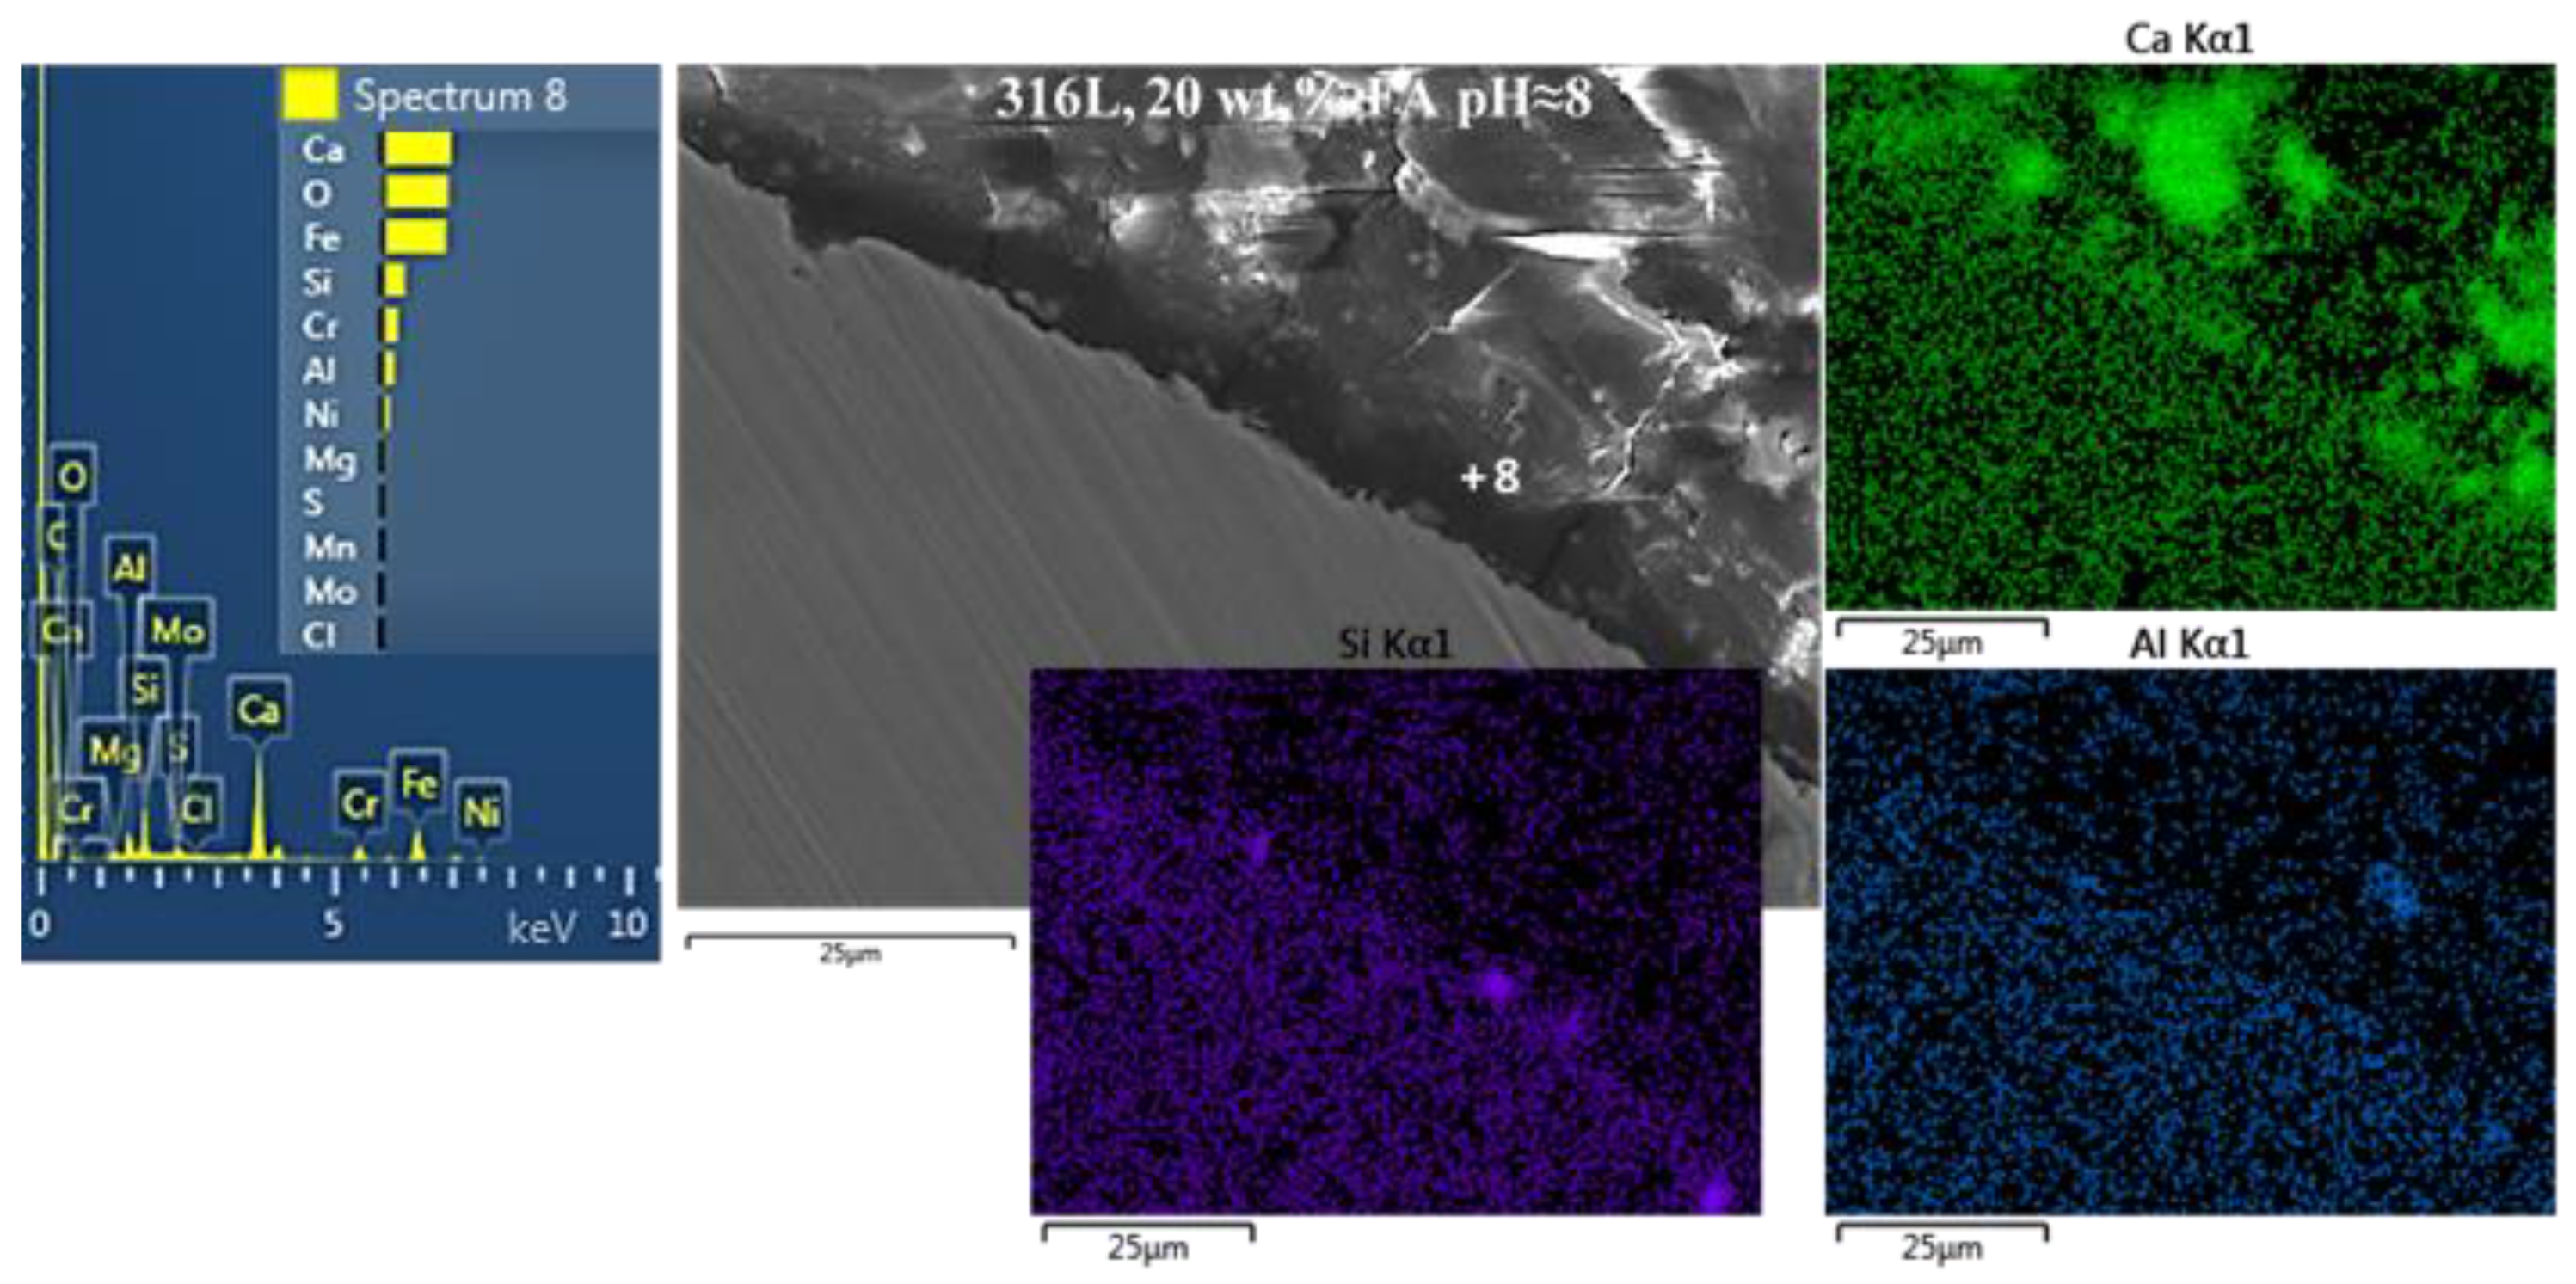
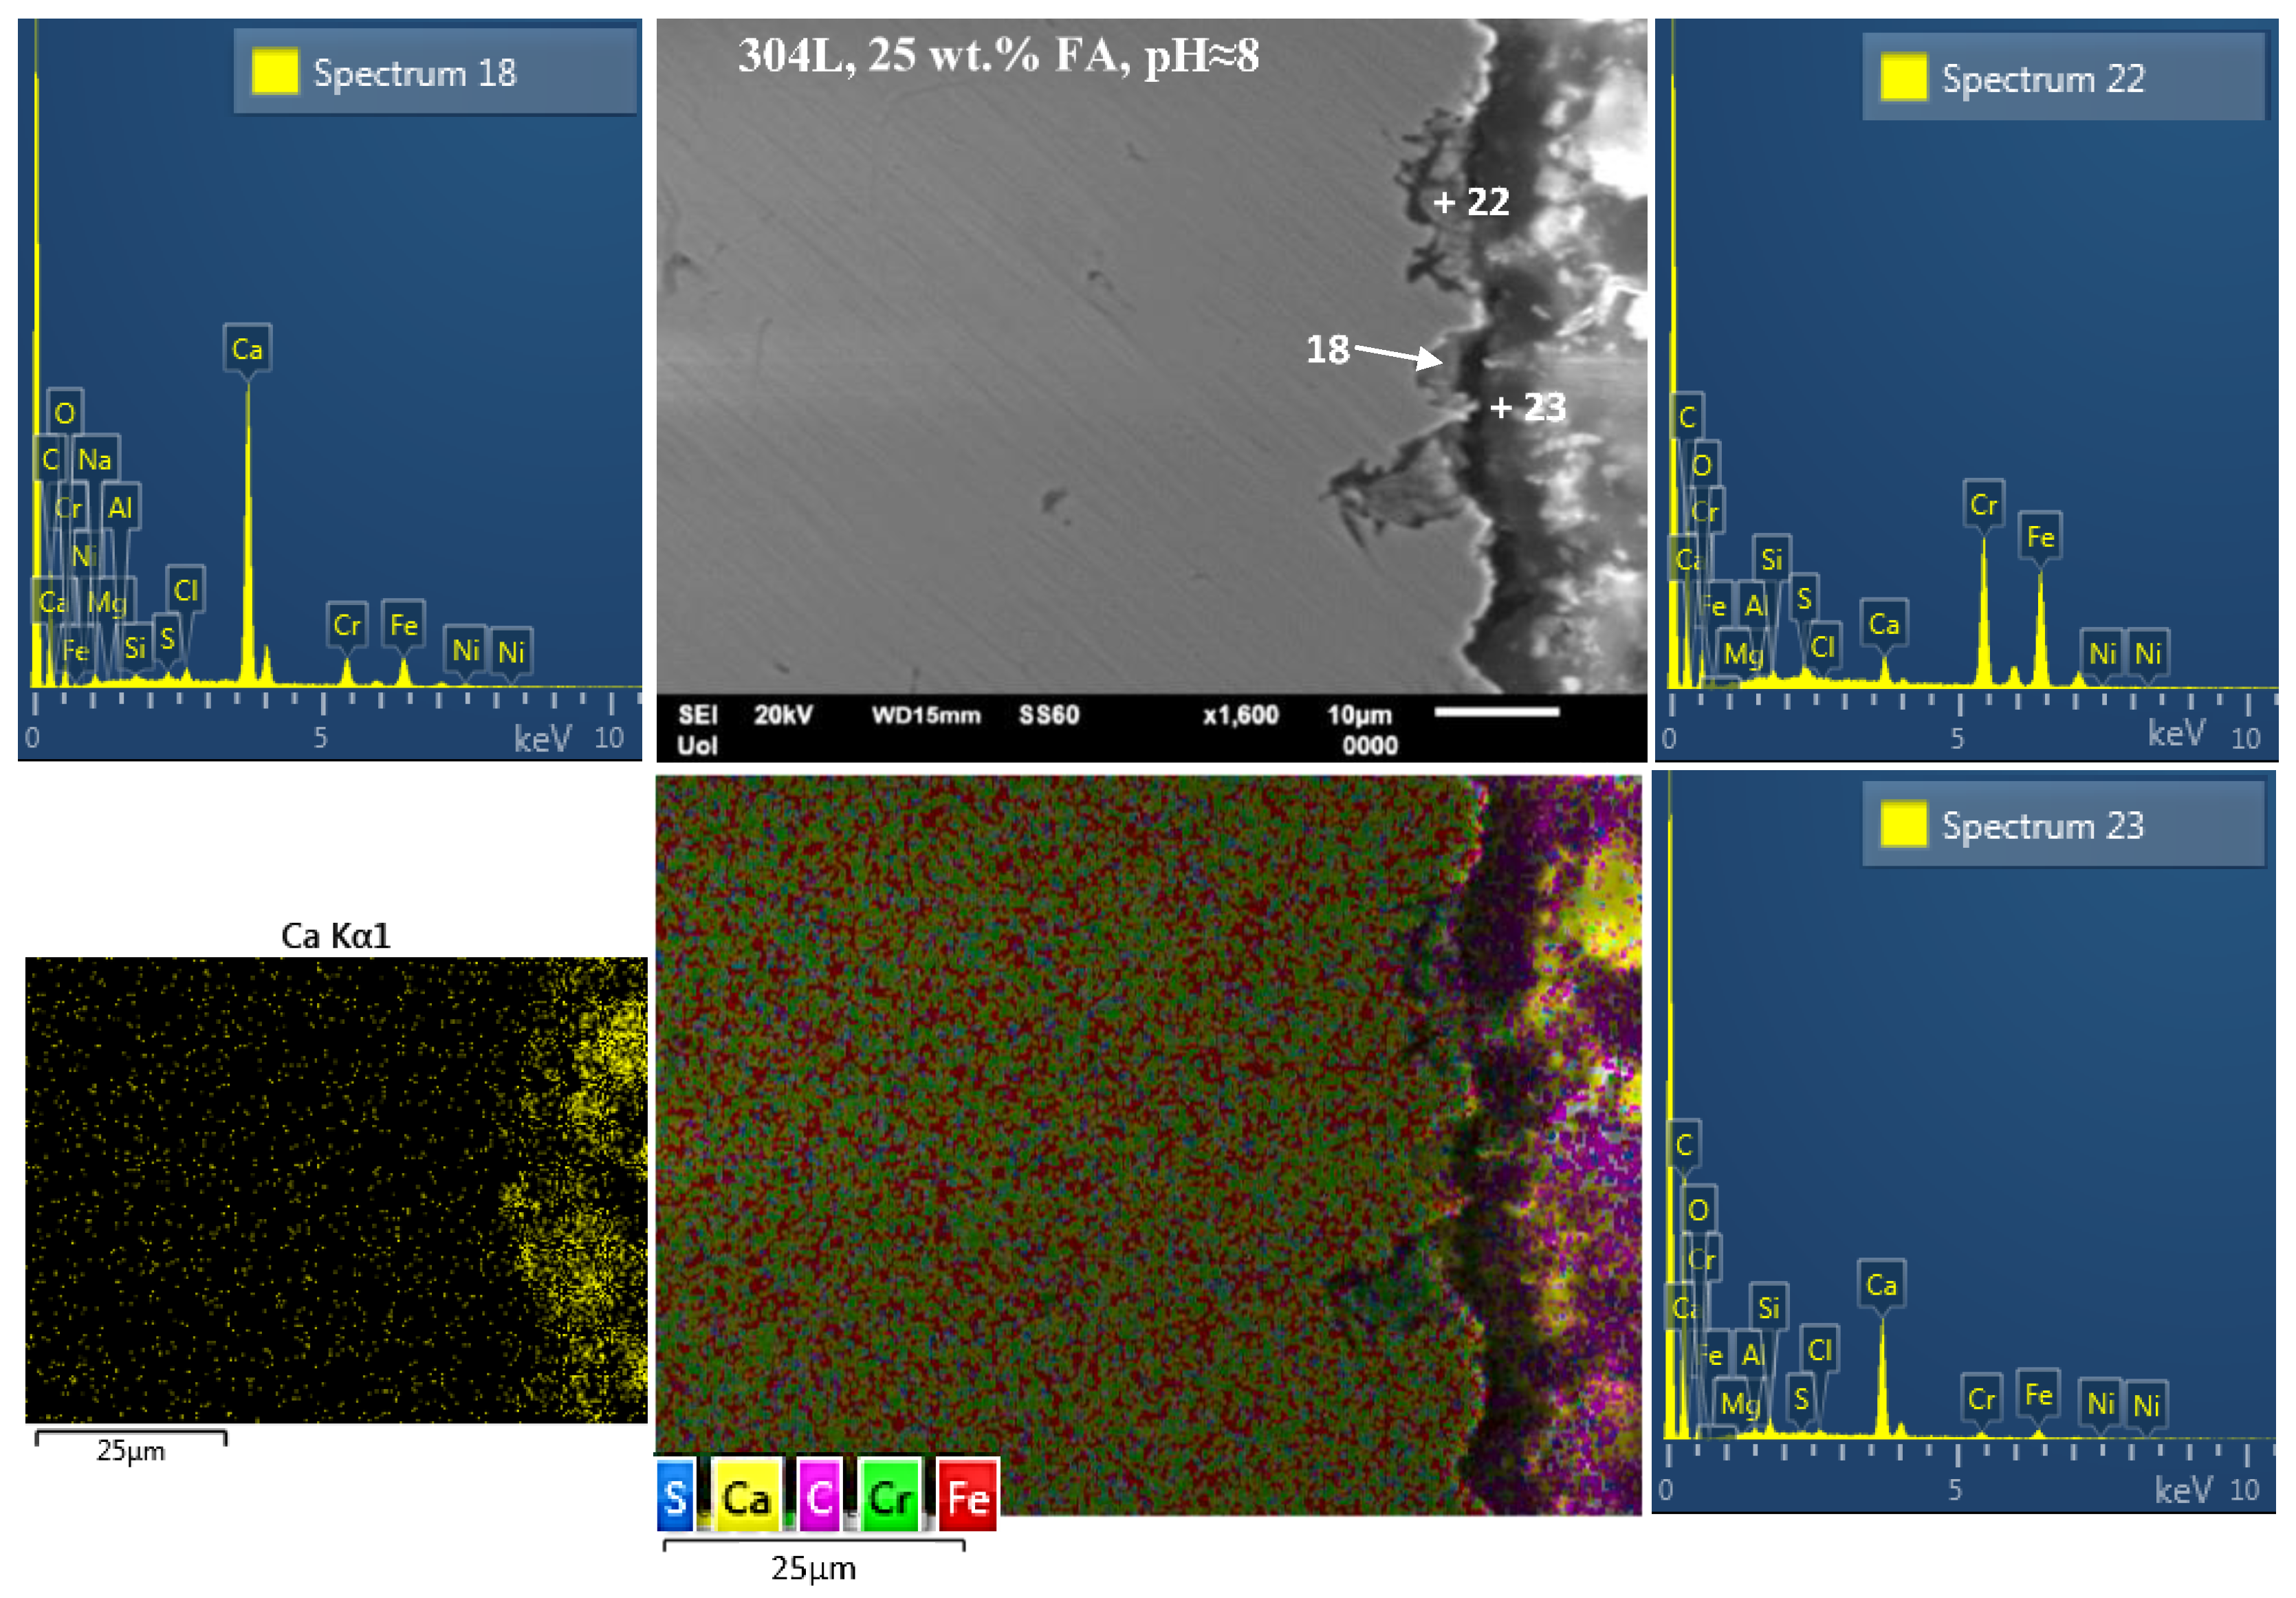
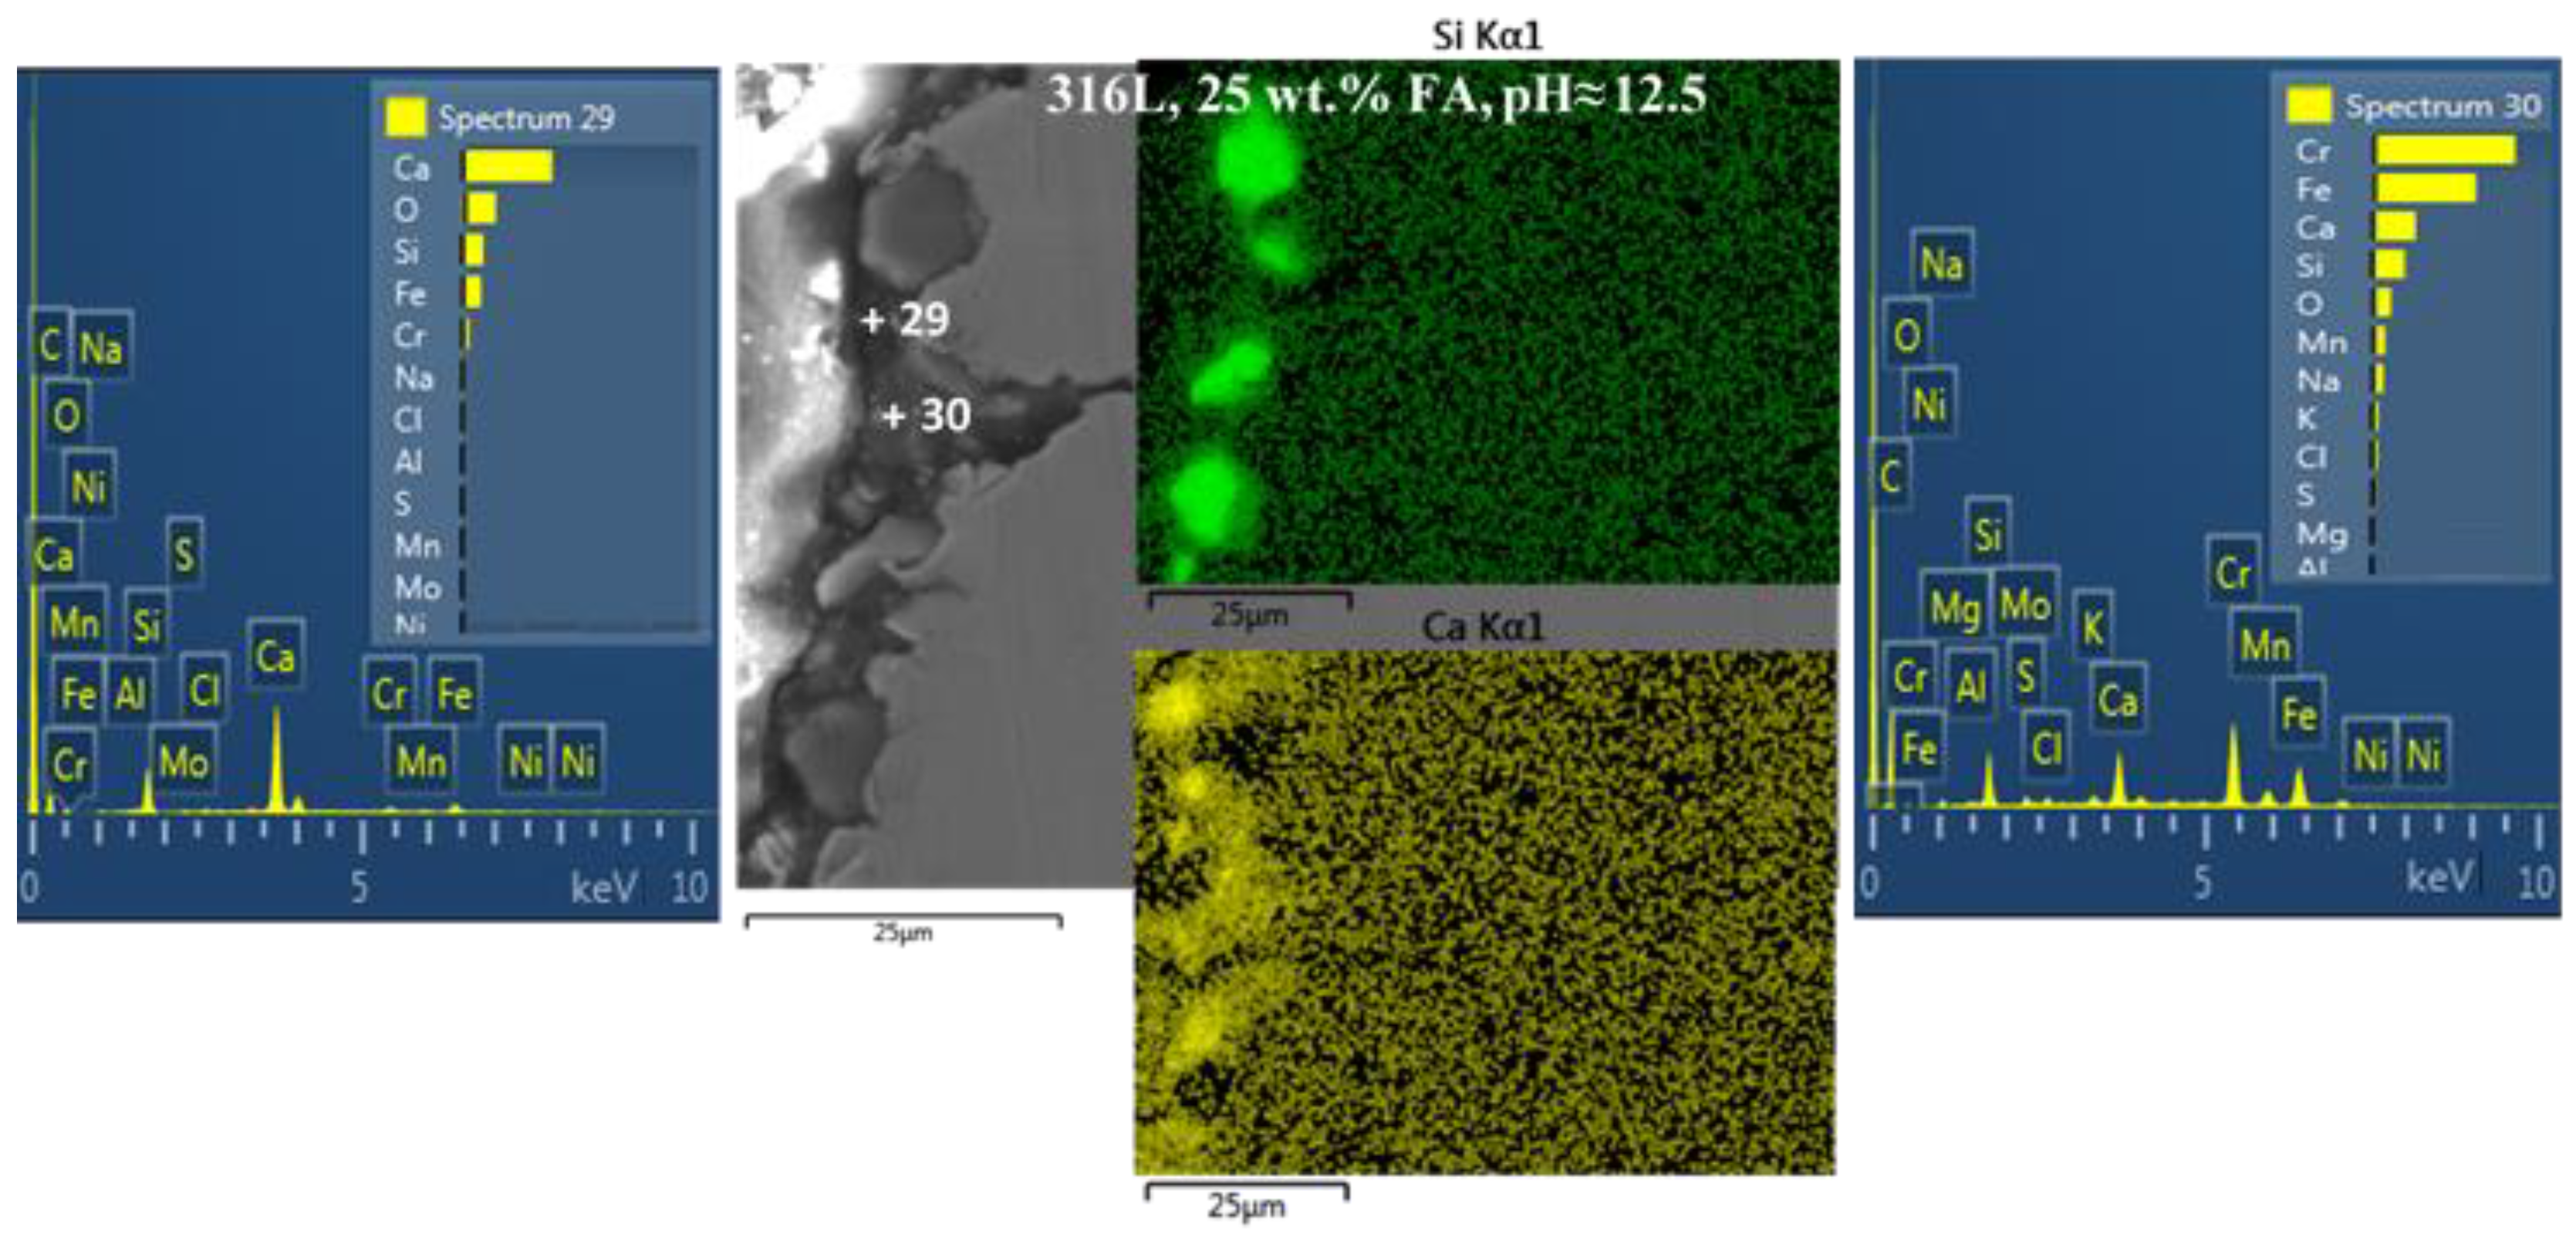
3.2. Microstructural Study of the Corroded Reinforcements: The Effect of Fly Ash

Figure 5 and Figure 6 present SEM cross-sectional micrographs of 304L rebars and 316L rebars, respectively, after cyclic polarization in the two electrolytes of pH ≈ 8 and pH ≈ 12.5. The magnification is relatively low for a general view. In all cases, a fine surface state is manifested.
Higher-magnification, cross-sectional micrographs are illustrated in Figure 7, Figure 8, Figure 9 and Figure 10 in order to reveal characteristic aspects of the microstructure of the corroded specimens in regard to the effect of fly ash. The microstructural states of specimens presenting the best (20 wt.% FA) and the worst (25 wt.% FA) electrochemical performance amongst the 10–25 wt.% range are shown herein, in order to elucidate the existence of a maximum beneficial effect of FA addition.
Figure 7 reveals the formation of a compact film on the surface of 304L after CYP in the electrolyte containing 20 wt.% FA, at pH ≈ 8 (Figure 7a) and pH ≈ 12.5 (Figure 7b). The film has been formed by the interaction between steel, Ca(OH)2, FA, and AR. The participation of FA in the film is suggested by the presence of Al, Si, and traces of S and K (EDX spectra 6 and 7 in Figure 7a, and EDX maps of Al and Si in Figure 7b). The high-lime FA, derived from lignite coal, participates in the surface film by forming calcium silicate hydrates (C-S-H) and calcium aluminate hydrates (C-A-H) through pozzolanic reactions (i.e., reactions with Ca(OH)2) and/or cementitious (hydraulic) reactions (i.e., direct reactions with water) [77]. The interaction with AR is indicated by the presence of traces of Cl, S, and Na (EDX spectra 6 and 7 in Figure 7a). The interaction with steel is shown by the presence of significant amounts of Fe and Cr in the Ca-oxide based film (EDX spectra 6 and 7 in Figure 7a). A similar state for 316L after CYP at pH ≈ 8 is presented in Figure 8; a compact film, rich in Ca, O, Fe, Si, Cr, Al, and Ni has been formed on the surface of the steel. The detection of Si, Al, and traces of Mg suggest the participation of FA in the surface film.
On the other hand, localized manifestations of corrosion in the form of pits are observed on the surface of 304L after CYP in the electrolyte containing 25 wt.% FA at pH ≈ 8 (Figure 9). The minor presence of Si, Al, and S in spectrum 23 (Figure 9) shows that FA participates in the Ca-rich film on the steel surface through pozzolanic and/or cementitious reactions. The presence of Fe, Cr, and Ni-traces in the film shows the interaction between Ca(OH)2 and FA with steel. The film has been attacked by Cl and possibly SO42− at defective sites, such as MnS/(Fe,Cr) interfaces [21] and/or FA agglomerates/steel-substrate boundaries; the latter sites are suggested by the electron micrograph of Figure 9, its EDX layered map, and spectra 18 and 22, showing pits filled with agglomerated particles of FA. More analytically, the detection of Cl in the pits (see spectra 18 and 22 in Figure 9) suggests an attack by Cl. Furthermore, the increased presence of Ca, S, Si, and minor/traces of Al and Mg in the pits associates pitting with agglomerates of FA. In agreement with previous works [31,32,33,78], it is postulated that FA in large amounts (such as 25 wt.%) tends to form agglomerates, especially when the individual particles are nano- or submicron-sized due to their high surface energy. These agglomerates cannot yield such an intensive pozzolanic or cementitious reaction with Ca(OH)2/water as fine individual particles do, owing to their low specific surface area. Hence, they cannot extensively form corrosion resistant surface deposits (e.g., C-S-H, C-A-H). Instead, they participate through the above reactions in surface films, which, however, are not locally compact enough due to incoherent interfaces between poorly reacted FA agglomerates and Ca(OH)2. The aggressive ions of the electrolyte (Cl and SO42−) penetrate the passive film at these defective sites, eventually causing pitting. The steel below the agglomerates, where Cl concentration is high and pH is low, has limited access to oxygen, thereby acting as a small anode next to a large cathode. The large cathodic surface is adjacent steel that remains passive in the alkaline environment of Ca(OH)2, and also contains C-S-H compounds from the interaction of finely divided FA with Ca(OH)2. Deepening of the pits occurs auto-catalytically due to the great reduction of pH through hydrolysis reactions. This increase in acidity causes an acceleration in the dissolution rate inside the pit [79].
A similar situation is observed in Figure 10 illustrating pitting at the surface of a 316L rebar having been subjected to CYP in the electrolyte that contains Ca(OH)2 partially replaced by fly ash (25 wt.% FA) at pH ≈ 12.5. Coarse agglomerates of FA appear to have accumulated above or inside pits. EDX spectra 29 and 30 present the chemical interaction of FA (Ca, Si, K, S) with the steel surface (Fe, Cr, Mn) and the electrolyte (Ca, Na, Cl, S).
Nevertheless, in the case of 25 wt.% FA (as well as 0 wt.% FA), corrosion is highly localized and rare, as deduced from the low magnification images of Figure 5 and Figure 6, which are free of corrosion signs. Moreover, it should be noted that although small pits may actively corrode, they may not cause massive accumulation of corrosion products over a large area of rebar, consequent stresses at the concrete–rebar interface, and eventual cracking of the concrete [80].

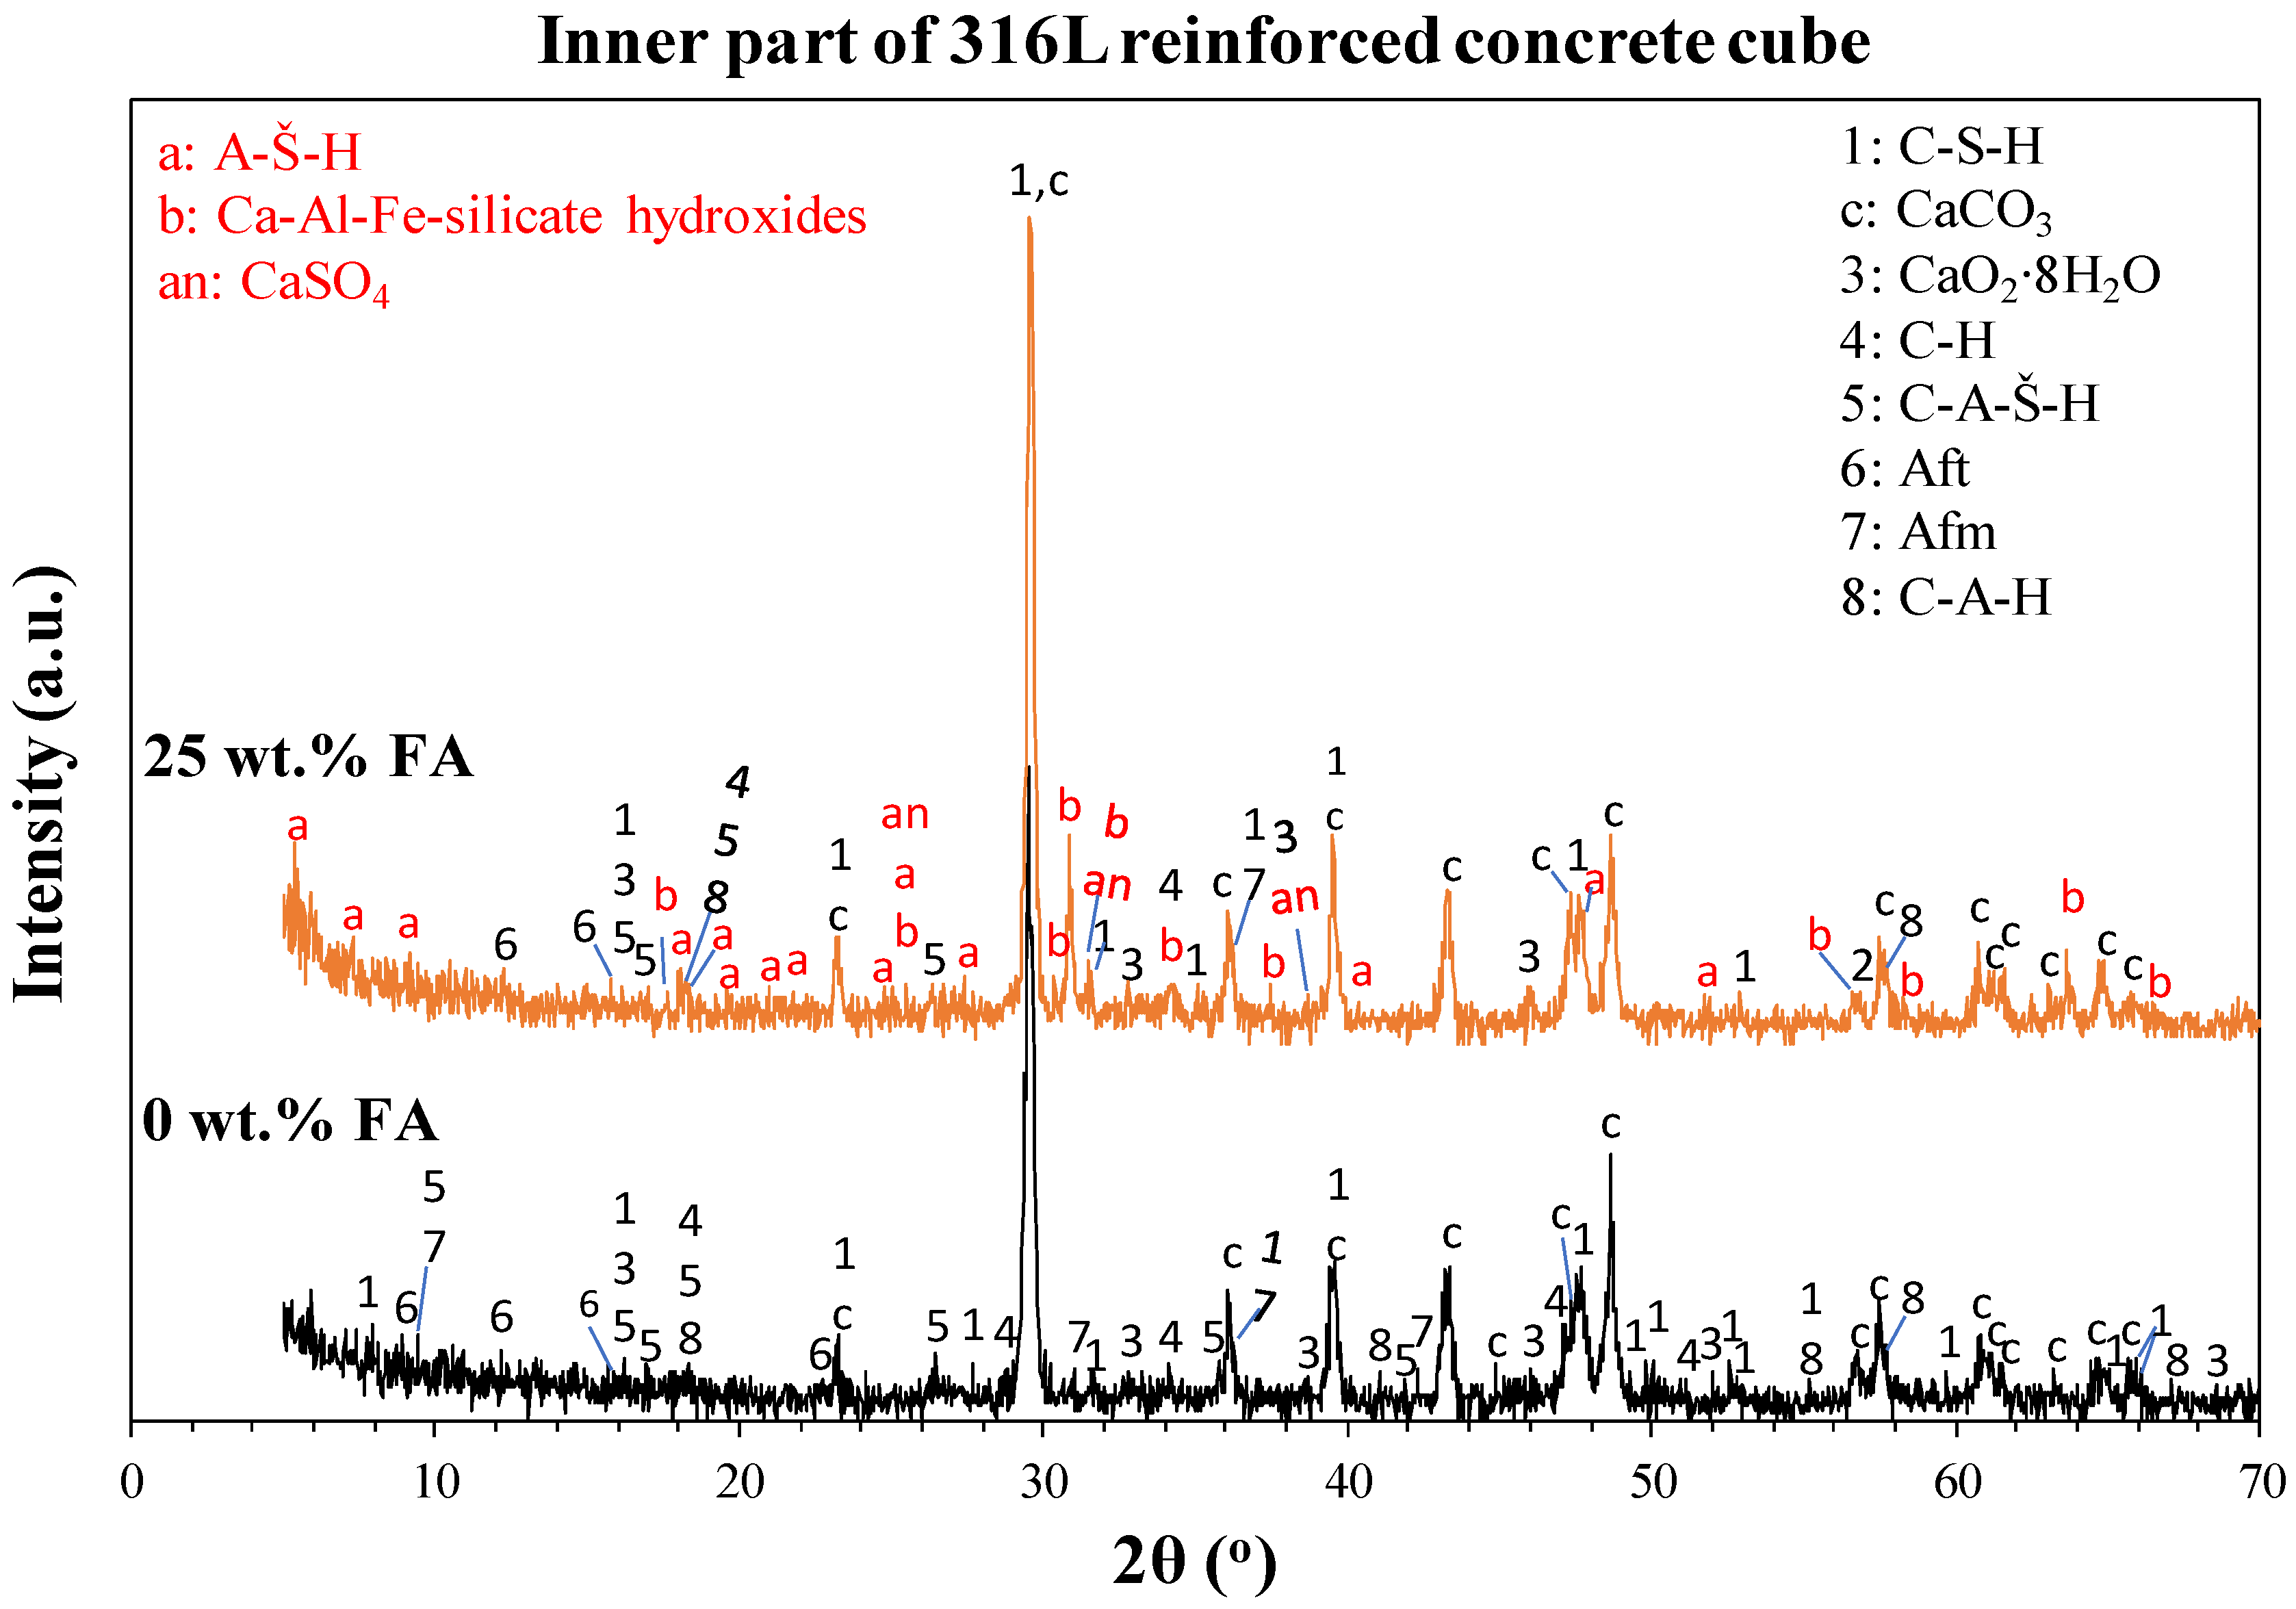
3.3. The Effect of Fly Ash on the Corrosion Resistance of Concrete

The simultaneous presence of Ca, Si, Al, K, S, Mg, and O in the Ca-rich film deposited on the surface of the steel indicates the participation of FA in the film (Figure 7, Figure 8, Figure 9 and Figure 10). The benefits of such participation stem from the mineralogical composition of the FA employed in this work, which, from a qualitative viewpoint, is presented in the X-ray diffractogram of Figure 11. In particular, Figure 11 reveals: (i) the high content of reactive calcium bearing phases in FA that may induce cementitious reactions; (ii) the presence of amorphous phases of pozzolanic character; and (iii) the occurrence of a great part of the Al2O3 contained in the FA in inert minerals of the FA.
Analytically, the main mineral phases detected were (powder diffraction file (PDF) numbers in parentheses): calcite (CaCO3 (5-586)), anhydrite (CaSO4 (37-1496)), quartz (SiO2 (46-1045)), lime (CaO (37-1497)), and hematite (Fe2O3 (33-664)). Minerals with a minor presence include: brownmillerite (Ca2(Al,Fe)2O5 (30-226)), periclase (MgO (74-1225)), merwinite (Ca3Mg(SiO4)2 (74-382)), portlandite (Ca(OH)2 (44-148)), K-feldspars including primarily microcline (KAlSi3O8 (19-926)), and secondarily sanidine (KAlSi3O8 (71-1544)), other K-Al-silicates (26-893, 79-1823, 50-1679), illite (K0.7Al2(Si,Al)4O10(OH)2 (29-1496) and KAl2(Si3Al)O10(OH)2 (43-685)), and traces of plagioclase (calcian-albite (Na,Ca)Al(Si,Al)3O8 (41-1480)). All of the above phases have been reported to occur in Greek lignite fly ashes [37,38,39,40]. Anhydrite, lime, brownmillerite, periclase, and portlandite are reactive minerals; quartz, hematite, K-feldspars, illite, plagioclases, and other K-Al silicates are inert minerals [37,41]. The peaks in the approximate range of 2θ ≈ 19°–35.5° are protruding from a humpy base, which indicates the presence of amorphous phases. These phases are mainly glass and the remains of clay minerals of lignite decomposed by burning. Some of them may render pozzolanic or latent hydraulic activit, through the reaction of the silica and alumina contained in the glasses with C-H from the hydration of cement to form C-S-H and C-A-H binder compounds [37,41]. Hence, the intensive presence of reactive minerals (especially anhydrite and lime) and glassy phases in the fly ash render hydraulic and pozzolanic properties, making the employed fly ash a potentially good binding agent [37,38]. On the other hand, the inert crystalline silicates that are present in the FA engage a large part of Al2O3; therefore, less Al2O3 is available to form Ca-aluminate hydrates (C-A-H) or monosulfoaluminate (Afm), which might react in a sulfate environment to form ettringite [41,42].
In order to further explore and confirm the beneficial effect of the Greek lignite FA as a corrosion inhibitor in reinforced concrete, XRD was carried out on the inner part (i.e., a few mm away from the steel reinforcement) of concrete cubes with 0 and 25 wt.% FA, in cement that had been hydrated for 28 d. The aim was to bring out the boosting abilities of FA with respect to: (a) the supersulfating state of the concrete; and (b) the pozzolanic reactions (with Ca(OH)2) or self-cementitious reactions (with water) in the concrete, in the context of the relevant literature addressed in the Introduction.
The XRD pattern of the FA-free concrete in Figure 12 shows the expected hydration products [81,82]. More analytically, various C-S-H phases have been detected that constitute the main hydration product of cement. The C-S-H minerals detected were (their PDF numbers in parentheses): 2CaO∙SiO2∙H2O (3-594), 2CaO∙SiO2∙0.30H2O (15-584), CaO∙SiO2∙H2O (9-210), 6CaO∙6SiO2∙H2O (23-125), CaO∙2SiO2∙2H2O (12-739), 5CaO∙6SiO2∙H2O (29-329), and 5CaO∙3SiO2∙2H2O (12-475). For simplicity, all the above C-S-H minerals are represented in the diffactogram of Figure 12 by the number 1. Other hydration products detected were: CaO2∙8H2O (47-703), C-H (Ca(OH)2, 44-1481), C-A-Š-H (6CaO∙Al2O3∙2SO2∙33H2O, 46-70), Aft (ettringite 3CaO∙Al2O3∙3CaSO4∙32H2O, 72-646), Afm (monosulfoaluminate 3CaO∙Al2O3∙CaSO4∙14H2O, 42-62), and C-A-H (12CaO∙3.5(Al1.98Fe0.02)2O3∙H2O, 45-565). The marked presence of calcite (CaCO3) is mainly attributed to the significant presence of calcite in OPC-SEM II/A-M 42.5R. Unreacted C2S (2CaO∙SiO2), C3S (3CaO∙SiO2), C3A (3CaO∙Al2O3), and C4AF (4CaO∙Al2O3∙Fe2O3) phases were not detected.
The XRD pattern of the FA-containing cube in Figure 12 shows that the partial replacement of cement by FA has caused the formation of new phases. For a clearer distinction, the new phases in the 25 wt.% FA cube are noted by red Latin alphabet letters in Figure 12. Hence, the formation of new aluminum sulfate (and sulfite) hydrates (A- S ¯ -H phases), along with the pre-existing C-A-Š-H, Aft, and Afm phases, is observed in the “25 wt.% FA” diffractogram. Analytically, the new sulfate (and sulfite) hydrates detected were: Al12(SO4)5(OH)26 (29-88), Al2(SO4)3∙14H2O (49-1097), 13Al2O3∙6SO3∙79H2O (74-1414), (H3O)Al3(SO4)2(OH)6 (16-409), and Al2SO4(OH)4∙5H2O (32-27). For simplicity, all the above A-Š-H phases are represented in the diffractogram of Figure 12 by the letter “a”. Therefore, the amount of SO42− available to participate in expansive sulfate–alumina reactions due to AR attacks may be reduced, in compatibility with [30,41]. Furthermore, peaks corresponding to the Afm phase, which may react with sulfate ions to form ettringite [36], are notably reduced in the “25 wt.% FA” diffractogram in comparison with the “0 wt.% FA” diffractogram. The contribution of the FA in supersulfating the concrete is, thereby, confirmed.
In addition, newly formed Ca–Al–Fe–silicate hydroxides (Ca2Al2FeSi3O12(OH), 72-3775 and Ca10Fe5Al27Si18O89(OH)5, 11-127) denoted by the letter “b” in Figure 12) were detected, which are more stable than C-H. The formation of such phases, along with a decrease in peaks uniquely assigned to C-H, confirm the pozzolanic activity of the employed FA.

4. Conclusions

The following conclusions are drawn from this investigation on the cyclic potentiodynamic polarization of 316L and 304L corrugated stainless steel rebars in a slightly alkaline electrolyte (pH ≈ 8) and a strongly alkaline electrolyte (pH ≈ 12.5) containing Ca(OH)2 partially replaced by fly ash (0–25 wt.%) and an acid rain simulating solution:
  • Both steels show high resistance to localized corrosion at both pH values, regardless of the fly ash (FA) content. Passivity takes place in two stages (clearly distinct at pH ≈ 12.5, whilst hardly distinct at pH ≈ 8). The passive film formation in the first stage breaks down due to the transpassive dissolution of Cr2O3. The secondary passivity, owing to chromate-based film formation, breaks down due to O2 evolution.
  • With regards to the effect of fly ash, the partial replacement of Ca(OH)2 with FA up to 20 wt.% has a positive effect on the polarization behavior of the stainless steel rebars in terms of thermodynamic tendency for corrosion, corrosion kinetics, and the stability of passive film. Replacement of Ca(OH)2 with 20 wt.% FA leads to the highest localized corrosion resistance amongst the 0–25 wt.% FA content; however, replacement with 25 wt.% FA leads to the lowest localized corrosion resistance amongst the 10–25 wt.% FA content.
  • With regards to the effect of pH, the high pH Value results in a lower corrosion potential and a lower corrosion current density for both steels and all FA contents compared to the low pH value. Furthermore, the high pH value induces higher passive currents compared to the low pH Value in the case of 316L, but lower passive currents in the case of 304L, for all FA additions.
  • With regards to the type of stainless steel, at pH ≈ 12.5, 304L shows better performance than 316L in terms of lower corrosion current density and lower passive current densities, attributed to the absence of Mo. Conversely, at pH ≈ 8, 304L shows worse performance than 316L in terms of higher corrosion current density and higher passive current densities.
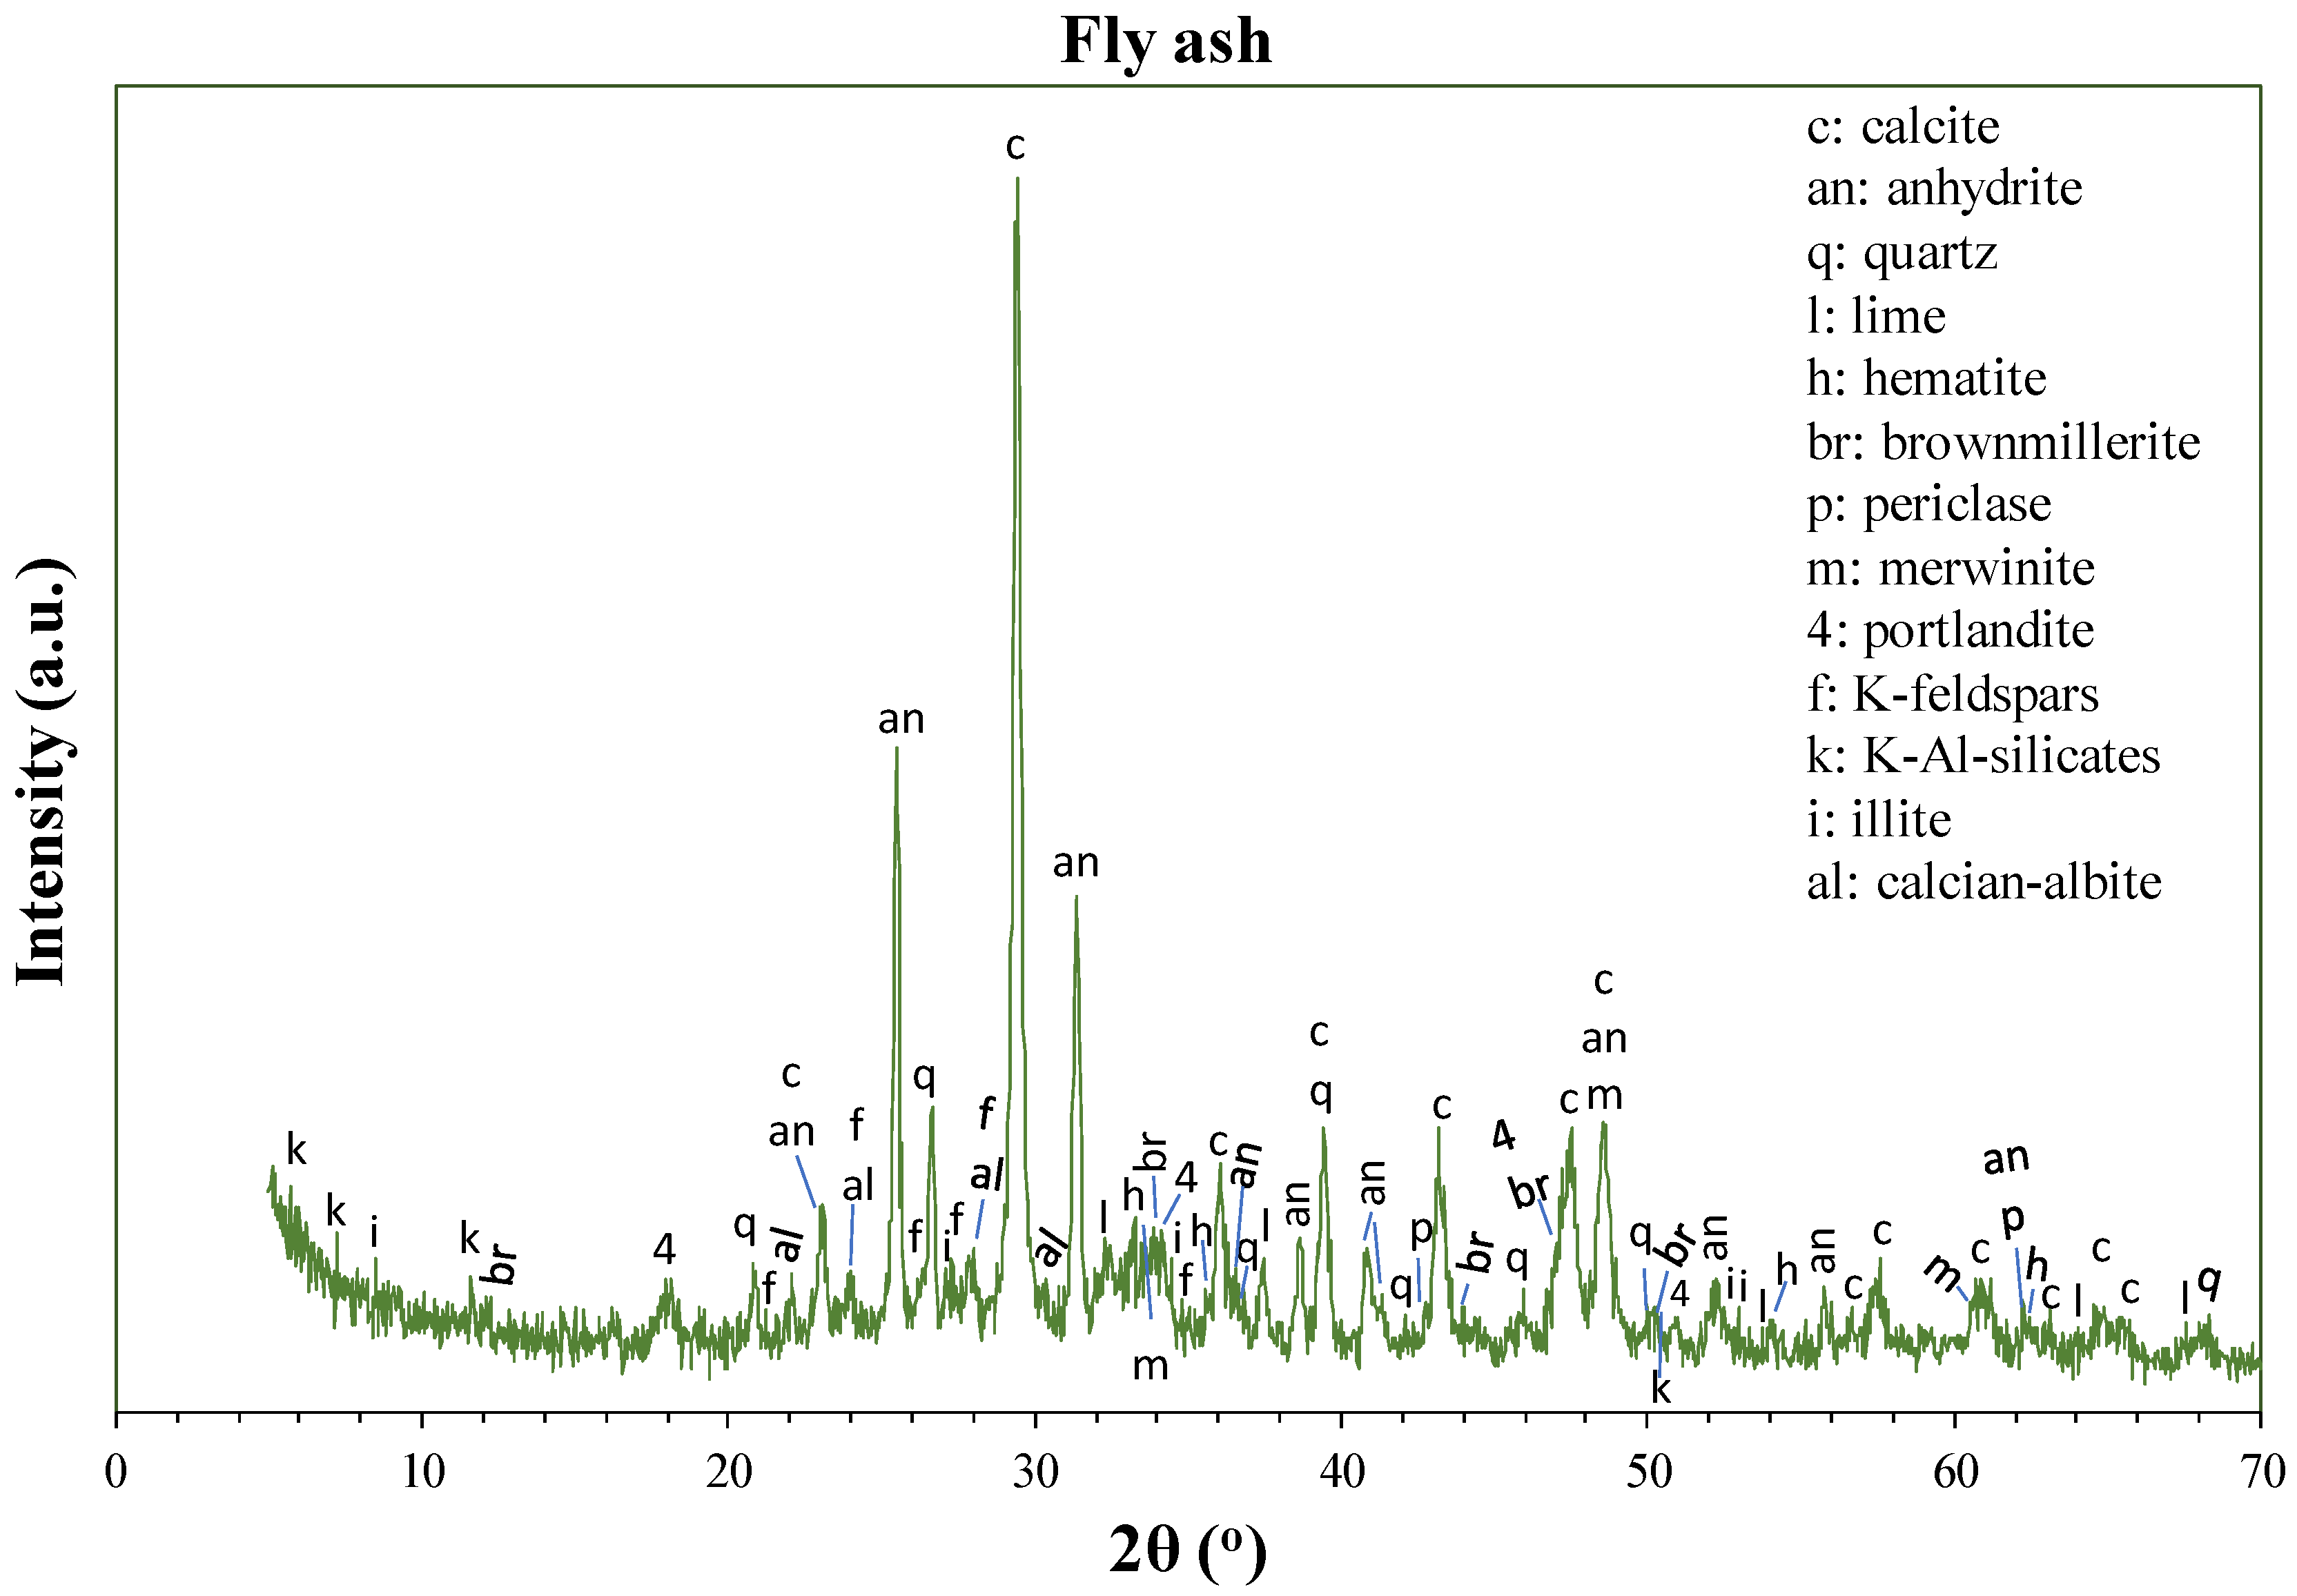
  • The beneficial effect of the FA on the electrochemical behavior of stainless steel is justified by the participation of FA in the Ca-rich film deposited on the steel surface. The benefits from such participation may stem from the mineralogical composition of the FA employed in this work, particularly: (i) the high content of reactive phases in FA with hydraulic and pozzolanic properties; and (ii) the engagement of a large part of Al2O3 in inert K-Al silicate minerals, thus limiting the availability of alumina to react in a sulfate environment to form ettringite. Moreover, the boosting abilities of FA with respect to: (a) the supersulfating state of the concrete and (b) the pozzolanic reactions in the concrete, are confirmed by (a) the detection of new A- S ¯ -H phases and the reduction of Afm phases in FA-containing concrete cubes, and (b) the detection of new C-F-A-S-H phases, respectively.
  • Nonetheless, the trend of corrosion resistance increasing with increasing FA addition reverses at 25 wt.% FA. The reason is the formation of agglomerates at high FA contents with a low tendency for pozzolanic/cementitious reactions, that induce the generation of differential aeration cells on the steel below them (although of highly localized occurrence).

Author Contributions

Conceptualization, A.G.L.; methodology, A.G.L.; validation, A.G.L. and S.T.; investigation, S.T.; data curation, S.T.; writing—original draft preparation, A.G.L.; writing—review and editing, A.G.L.; visualization, S.T. and A.G.L.; supervision, A.G.L. All authors have read and agreed to the published version of the manuscript.

Funding

This research received no external funding.

Institutional Review Board Statement

Not applicable.

Informed Consent Statement

Not applicable.

Data Availability Statement

Data sharing is not applicable to this article.

Conflicts of Interest

The authors declare no conflict of interest.

References

  1. Apostolopoulos, C.A.; Papadakis, V.G. Consequences of steel corrosion on the ductility properties of reinforcement bar. Constr. Build. Mater. 2008, 22, 2316–2324. [Google Scholar] [CrossRef]
  2. Monticelli, C.; Natali, M.E.; Balbo, A.; Chiavari, C.; Zanotto, F.; Manzi, F.; Bignozzi, M.C. Corrosion behavior of steel in alkali-activated fly ash mortars in the light of their microstructural, mechanical and chemical characterization. Cem. Concr. Res. 2016, 80, 60–68. [Google Scholar] [CrossRef]
  3. Ai, Z.; Sun, W.; Jiang, J.; Song, D.; Ma, H.; Zhang, J.; Wang, D. Passivation characteristics of alloy corrosion-resistant steel Cr10Mo1 in simulating concrete pore solutions: Combination effects of pH and chloride. Materials 2016, 9, 749. [Google Scholar] [CrossRef] [Green Version]
  4. Batis, G.; Rakanta, E. Corrosion of steel reinforcement due to atmospheric pollution. Cem. Concr. Compos. 2005, 27, 269–275. [Google Scholar] [CrossRef]
  5. Demis, S.; Pilakoutas, K.; Apostolopoulos, C.A. Effect of corrosion on bond strength of steel and non-metallic reinforcement. Mater. Corros. 2010, 61, 328–331. [Google Scholar] [CrossRef]
  6. Sæther, I. Bond deterioration of corroded steel bars in concrete. Struct. Infrastruct. Eng. 2011, 7, 415–429. [Google Scholar] [CrossRef]
  7. Yalciner, H.; Marar, K. Experimental study on the bond strength of different geometries of corroded and uncorroded reinforcement bars. J. Mater. Civ. Eng. 2017, 29, 05017002. [Google Scholar] [CrossRef]
  8. Apostolopoulos, C.A.; Demis, S.; Papadakis, V.G. Chloride-induced corrosion of steel reinforcement–Mechanical performance and pit depth analysis. Constr. Build. Mater. 2013, 38, 139–146. [Google Scholar] [CrossRef]
  9. Wang, Y.; Niu, D.; Song, Z. Effect of acid rain erosion on steel fiber reinforced concrete. J. Wuhan Univ. Technol. Mater. Sci. Ed. 2017, 32, 121–128. [Google Scholar] [CrossRef]
  10. Zivica, V.; Bajzab, A. Acidic attack of cement based materials-A review: Part 1. Principle of acidic attack. Constr. Build. Mater. 2001, 15, 331–340. [Google Scholar] [CrossRef]
  11. Webster, R.P.; Kukacka, L.E. Effects of Acid Deposition on Portland Cement Concrete. In Materials Degradation Caused by Acid Rain; Baboian, R., Ed.; American Chemical Society Publications: Washington, DC, USA, 1986; Volume 318, pp. 239–249. [Google Scholar] [CrossRef]
  12. Suksawang, N.; Zhang, S. Performance of High Performance Concrete (HPC) in Low pH and Sulfate Environments; Final Report, Contract No. BDK80 977-16; Department Civil & Environmental Engineering, Florida International University: Miami, FL, USA, 2013; p. 169. [Google Scholar]
  13. Barbhuiya, S.; Kumala, D. Behaviour of a sustainable concrete in acidic environment. Sustainability 2017, 9, 1556. [Google Scholar] [CrossRef] [Green Version]
  14. Chen, M.-C.; Wang, K.; Xie, L. Deterioration mechanism of cementitious materials under acid rain attack. Eng. Fail. Anal. 2013, 27, 272–285. [Google Scholar] [CrossRef]
  15. Kepler, J.L.; Darwin, D.; Locke, C.E., Jr. Evaluation of Corrosion Protection Methods for Reinforced Concrete Highway Structures; Structural Engineering and Engineering Materials SM Rep. No. 58; University of Kansas Center for Research, INC.: Lawrence, KS, USA, 2000; p. 221. [Google Scholar]
  16. Head, M.; Ashby-Bey, E.; Edmonds, K.; Efe, S.; Grose, S.; Mason, I.; Clarence, C.M., Jr. Stainless Steel Prestressing Strands and Bars for Use in Prestressed Concrete Girders and Slabs; Rep. No. MD-13-SP309B4G; Maryland State Highway Administration: Baltimore, MD, USA, 2015; p. 41.
  17. Wang, X.; Nguyen, M.; Stewart, M.G.; Syme, M.; Leitch, A. Analysis of Climate Change Impacts on the Deterioration of Concrete Infrastructure. Part 1: Mechanisms, Practices, Modelling and Simulations-A Review; CSIRO: Canberra, Australia, 2010; p. 84. ISBN 97804310365 8.
  18. Montemor, M.F.; Simões, A.M.P.; Ferreira, M.G.S.; Cunha Belo, M.D. The role of Mo in the chemical composition and semiconductive behaviour of oxide films formed on stainless steels. Corros. Sci. 1999, 41, 17–34. [Google Scholar] [CrossRef]
  19. Freire, L.; Carmezim, M.J.; Ferreira, M.G.S.; Montemor, M.F. The passive behaviour of AISI 316 in alkaline media and the effect of pH: A combined electrochemical and analytical study. Electrochim. Acta 2010, 55, 6174–6181. [Google Scholar] [CrossRef]
  20. Luo, H.; Su, H.; Dong, C.; Li, X. Passivation and electrochemical behavior of 316L stainless steel in chlorinated simulated concrete pore solution. Appl. Surf. Sci. 2017, 400, 38–48. [Google Scholar] [CrossRef]
  21. Freire, L.; Carmezim, M.J.; Ferreira, M.G.S.; Montemor, M.F. The electrochemical behaviour of stainless steel AISI 304 in alkaline solutions with different pH in the presence of chlorides. Electrochim. Acta 2011, 56, 5280–5289. [Google Scholar] [CrossRef]
  22. Wang, Z.; Zhou, Z.-Q.; Zhang, L.; Hu, J.Y.; Zhang, Z.R.; Lu, M.X. Effect of pH on the electrochemical behaviour and passive film composition of 316L stainless steel. Acta Metall. Sin. 2019, 32, 585–598. [Google Scholar] [CrossRef] [Green Version]
  23. Bassuoni, M.T.; Nehdi, M.L. Resistance of self-consolidating concrete to sulfuric acid attack with consecutive pH reduction. Cem. Concr. Res. 2007, 37, 1070–1084. [Google Scholar] [CrossRef]
  24. Shi, C.; Stegemann, J.A. Acid corrosion resistance of different cementing materials. Cem. Concr. Res. 2000, 30, 803–808. [Google Scholar] [CrossRef]
  25. Murthi, P.; Sivakumar, V. Studies on acid resistance of ternary blended concrete. Asian J. Civ. Eng. 2008, 9, 473–486. [Google Scholar]
  26. Van Nguyen, C.; Lambert, P.; Tran, Q.H. Effect of Vietnamese fly ash on selected physical properties, durability and probability of corrosion of steel in concrete. Materials 2019, 12, 593. [Google Scholar] [CrossRef] [PubMed] [Green Version]
  27. Nie, Q.; Zhou, C.; Shu, X.; He, Q.; Huang, B. Chemical, mechanical, and durability properties of concrete with local mineral admixtures under sulfate environment in Northwest China. Materials 2014, 7, 3772–3785. [Google Scholar] [CrossRef] [PubMed]
  28. Saraswathy, V.; Song, H.-W. Corrosion performance of fly ash blended cement concrete: A state-of-art review. Corros. Rev. 2006, 24, 87–122. [Google Scholar] [CrossRef]
  29. Liu, K.; Deng, M.; Mo, L. Effect of fly ash on resistance to sulfate attack of cement-based materials. Key Eng. Mater. 2013, 539, 124–129. [Google Scholar] [CrossRef]
  30. Siddique, R. Coal Fly Ash. In Waste Materials and By-Products in Concrete; Siddique, R., Ed.; Springer: Berlin, Germany, 2008; pp. 177–234. [Google Scholar] [CrossRef]
  31. Tsouli, S.; Lekatou, A.G.; Kleftakis, S.; Matikas, T.E.; Dalla, P.T. Corrosion behavior of 304L stainless steel concrete reinforcement in acid rain using fly ash as corrosion inhibitor. Procedia Struct. Integr. 2018, 10, 41–48. [Google Scholar] [CrossRef]
  32. Tsouli, S.; Lekatou, A.G.; Nikolaidis, C.; Kleftakis, S. Corrosion and tensile behavior of 316L stainless steel concrete reinforcement in harsh environments containing a corrosion inhibitor. Procedia Struct. Integr. 2019, 17, 268–275. [Google Scholar] [CrossRef]
  33. Lekatou, A.G.; Tsouli, S.; Nikolaidis, C.; Kleftakis, S.; Tragazikis, I.K.; Matikas, T.E. Effect of fly ash on the corrosion performance and structural integrity of stainless steel concrete rebars in acid rain and saline environments. Frat. Integr. Strutt. 2019, 50, 423–437. [Google Scholar] [CrossRef] [Green Version]
  34. Tsouli, S.; Lekatou, A.G.; Kleftakis, S. The Effect of Fly Ash on the Corrosion Performance of AISI 316L Stainless Steel Reinforced Concrete for Application to Restoration Works of Ancient Monuments. In Conservation of Monuments in the Mediterranean Basin. Natural and Anthropogenic Hazards and Sustainable Preservation; Koui, M., Zezza, F., Kouis, D., Eds.; Springer: Cham, Switzerland, 2018; pp. 171–178. [Google Scholar] [CrossRef]
  35. Fu, Y.; Ding, J.; Beaudoin, J.J. Expansion of Portland cement mortar due to internal sulfate attack. Cem. Concr. Res. 1997, 27, 1299–1306. [Google Scholar] [CrossRef]
  36. Ghafoori, N.; Najimi, M.; Diawara, H.; Islam, M.S. Effects of class F fly ash on sulfate resistance of Type V Portland cement concretes under continuous and interrupted sulfate exposures. Constr. Build. Mater. 2015, 78, 85–91. [Google Scholar] [CrossRef]
  37. Kostakis, G. Characterization of the fly ashes from the lignite burning power plants of northern Greece based on their quantitative mineralogical composition. J. Hazard. Mater. 2009, 166, 972–977. [Google Scholar] [CrossRef]
  38. Filippidis, A.; Georgakopoulos, A. Mineralogical and chemical investigation of fly ash from the Main and Northern lignite fields in Ptolemais, Greece. Fuel 1992, 71, 373–376. [Google Scholar] [CrossRef]
  39. Fernandez-Turiel, J.-L.; Georgakopoulos, A.; Gimeno, D.; Papastergios, G.; Kolovos, N. Ash deposition in a pulverized coal-fired power plant after high-calcium lignite combustion. Energy Fuels 2004, 18, 1512–1518. [Google Scholar] [CrossRef] [Green Version]
  40. Chousidis, N.; Ioannou, I.; Rakanta, E.; Koutsodontis, C.; Batis, G. Effect of fly ash chemical composition on the reinforcement corrosion, thermal diffusion and strength of blended cement concretes. Constr. Build. Mater. 2016, 126, 86–97. [Google Scholar] [CrossRef]
  41. Tikalsky, P.J.; Carrasquillo, R.L. The Effect of Fly Ash on the Sulfate Resistance of Concrete; Report No FHWA/TX-90+481-5; Center for Transportation Research, The University of Texas at Austin: Austin, TX, USA, 1989; p. 318. [Google Scholar]
  42. Mehta, P.K. Effect of fly ash composition on sulfate resistance of cement. J. Am. Concr. Inst. 1986, 83, 994–1000. [Google Scholar] [CrossRef]
  43. Tiburzi, Ν.Β.; Garcia, J.; Drimalas, T.; Folliard, K.J. Sulfate resistance of Portland-limestone cement systems containing greater than 15% limestone. Cem. Concr. Compos. 2019, 100, 60–73. [Google Scholar] [CrossRef]
  44. Berodier, E.; Scrivener, K. Understanding the filler effect on the nucleation and growth of C-S-H. J. Am. Ceram. Soc. 2014, 97, 3764–3773. [Google Scholar] [CrossRef]
  45. Mesquita, T.J.; Chauveau, E.; Mantel, M.; Kinsman, N.; Nogueira, R.P. Influence of Mo alloying on pitting corrosion of stainless steels used as concrete reinforcement. Rem. Rev. Esc. Minas 2013, 66, 173–178. [Google Scholar] [CrossRef]
  46. Lekatou, A.; Sioulas, D.; Karantzalis, A.E.; Grimanelis, D. A comparative study on the microstructure and surface property evaluation of coatings produced from nanostructured and conventional WC-Co powders HVOF-sprayed on Al 7075. Surf. Coat. Technol. 2015, 276, 539–556. [Google Scholar] [CrossRef]
  47. Lekatou, A.; Sfikas, A.K.; Petsa, C.; Karantzalis, A.E. Al-Co alloys prepared by vacuum arc melting: Correlating microstructure evolution and aqueous corrosion behaviour with Co content. Metals 2016, 6, 46. [Google Scholar] [CrossRef] [Green Version]
  48. Sfikas, A.K.; Lekatou, A.G. Electrochemical behavior of Al-Al9Co2 alloys in sulfuric acid. Corros. Mater. Degrad. 2020, 1, 249–272. [Google Scholar] [CrossRef]
  49. Silverman, D.C. Tutorial on Cyclic Potentiodynamic Polarization Technique. In Proceedings of the Corrosion 98 Research Topical Symposium, San Diego, CA, USA, 22–27 March 1998; NACE Research Committee, Ed.; NACE International: San Diego, CA, USA, 1998. [Google Scholar]
  50. Roberge, P.R. Handbook of Corrosion Engineering; McGraw-Hill: New York, NY, USA, 2000; pp. 486–576. [Google Scholar]
  51. Ragab, K.A.; Abdel-Karim, R.; Farag, S.; El-Raghy, S.M.; Ahmed, H.A. Influence of SiC, SiO2 and graphite on corrosive wear of bronze composites subjected to acid rain. Tribol. Int. 2010, 43, 594–601. [Google Scholar] [CrossRef]
  52. Nnadi, E.O.; Asce, M.; Lizarazo-Marriaga, J. Acid corrosion of plain and reinforced concrete sewage systems. J. Mater. Civ. Eng. 2013, 25, 1353–1356. [Google Scholar] [CrossRef]
  53. Pérez-Quiroz, J.T.; Terán, J.; Herrera, M.J.; Martínez, M.; Genescá, J. Assessment of stainless steel reinforcement for concrete structures rehabilitation. J. Constr. Steel Res. 2008, 64, 1317–1324. [Google Scholar] [CrossRef]
  54. Fan, Y.-F.; Luan, H.-Y. Pore structure in concrete exposed to acid deposit. Constr. Build. Mater. 2013, 49, 407–416. [Google Scholar] [CrossRef]
  55. Pourbaix, M. Atlas of Electrochemical Equilibria in Aqueous Solutions, 2nd ed.; NACE International: Houston, TX, USA, 1974; pp. 256–279, 307–321, 330–342. [Google Scholar]
  56. Fattah-Alhosseini, A.; Saatchi, A.; Golozar, M.A.; Raeissi, K. The transpassive dissolution mechanism of 316L stainless steel. Electrochim. Acta 2009, 54, 3645–3650. [Google Scholar] [CrossRef]
  57. Scully, J.C. The Fundamentals of Corrosion, 3rd ed.; Pergamon Press: Oxford, UK, 1990; p. 209. [Google Scholar]
  58. Bardwell, J.A.; Sproule, G.I.; MacDougall, B.; Graham, M.J.; Davenport, A.J.; Isaacs, H.S. In situ XANES detection of Cr(VI) in the passive film on Fe-26Cr. J. Electrochem. Soc. 1992, 139, 371–373. [Google Scholar] [CrossRef] [Green Version]
  59. Långberg, M.; Örnek, C.; Evertsson, J.; Harlow, G.S.; Linpé, W.; Rullik, L.; Carlà, F.; Felici, R.; Bettini, E.; Kivisäkk, U.; et al. Redefining passivity breakdown of super duplex stainless steel by electrochemical operando synchrotron near surface X-ray analyses. npj Mater. Degrad. 2019, 3, 22. [Google Scholar] [CrossRef]
  60. Li, T.; Zhang, H.; He, Y.; Wang, X. Comparison of corrosion behavior of Mg-1.5Zn-0.6Zr and AZ91D alloys in a NaCl solution. Mater. Corros. 2015, 66, 7–15. [Google Scholar] [CrossRef]
  61. Esmailzadeh, S.; Aliofkhazraei, M.; Sarlak, H. Interpretation of cyclic potentiodynamic polarization test results for study of corrosion behavior of metals: A review. Protect. Met. Phys. Chem. Surf. 2018, 54, 976–989. [Google Scholar] [CrossRef]
  62. Li, L.; Sagüés, A.A. Chloride corrosion threshold of reinforcing steel in alkaline solutions-Cyclic polarization behavior. Corrosion 2002, 58, 305–316. [Google Scholar] [CrossRef]
  63. Abreu, C.M.; Cristóbal, M.J.; Losada, R.; Nóvoa, X.R.; Pena, G.; Pérez, M.C. Comparative study of passive films of different stainless steels developed on alkaline medium. Electrochim. Acta 2004, 49, 3049–3056. [Google Scholar] [CrossRef]
  64. Alonso, C.; Andrade, C.; Izquierdo, M.; Nóvoa, X.R.; Pérez, M.C. Effect of protective oxide scales in the macrogalvanic behaviour of concrete reinforcements. Corros. Sci. 1998, 40, 1379–1389. [Google Scholar] [CrossRef]
  65. Bautista, A.; Blanco, G.; Velasco, F.; Gutiérrez, A.; Soriano, L.; Palomares, F.J.; Takenouti, H. Changes in the passive layer of corrugated austenitic stainless steel of low nickel content due to exposure to simulated pore solutions. Corros. Sci. 2009, 51, 785–792. [Google Scholar] [CrossRef]
  66. Stansbury, E.E.; Buchanan, R.A. Fundamentals of Electrochemical Corrosion; ASM International: Materials Park, OH, USA, 2000; p. 309. [Google Scholar]
  67. Garcés, P.; Andrade, M.C.; Saez, A.; Alonso, M.C. Corrosion of reinforcing steel in neutral and acid solutions simulating the electrolytic environments in the micropores of concrete in the propagation period. Corros. Sci. 2005, 47, 289–306. [Google Scholar] [CrossRef]
  68. Wang, K.; Li, Y.S. In situ identification of surface species on molybdenum in different media. Electrochim. Acta 1998, 43, 2459–2467. [Google Scholar] [CrossRef]
  69. Refaey, S.A.M.; Taha, F.; Abd El-Malak, A.M. Corrosion and inhibition of stainless steel pitting corrosion in alkaline medium and the effect of Cl and Br anions. Appl. Surf. Sci. 2005, 242, 114–120. [Google Scholar] [CrossRef]
  70. Luo, H.; Dong, C.F.; Li, X.G.; Xiao, K. The electrochemical behaviour of 2205 duplex stainless steel in alkaline solutions with different pH in the presence of chloride. Electrochim. Acta 2012, 64, 211–220. [Google Scholar] [CrossRef]
  71. Olsson, C.-O.A.; Landolt, D. Passive films on stainless steels-chemistry, structure and growth. Electrochim. Acta 2003, 48, 1093–1104. [Google Scholar] [CrossRef]
  72. Schmutz, P.; Landolt, D. In-situ microgravimetric studies of passive alloys: Potential sweep and potential step experiments with Fe–25Cr and Fe–17Cr–33Mo in acid and alkaline solution. Corros. Sci. 1999, 41, 2143–2163. [Google Scholar] [CrossRef]
  73. Davalos Monteiro, R.; van de Wetering, J.; Krawczyk, B.; Engelberg, D.L. Corrosion behaviour of type 316L stainless steel in hot caustic aqueous environments. Met. Mater. Int. 2020, 26, 630–640. [Google Scholar] [CrossRef] [Green Version]
  74. Bhattacharya, A.; Singh, P.M. Electrochemical behaviour of duplex stainless steels in caustic environment. Corros. Sci. 2011, 53, 71–81. [Google Scholar] [CrossRef]
  75. Sun, Y.-T.; Tan, X.; Lei, L.-L.; Li, J.; Jiang, Y.M. Revisiting the effect of molybdenum on pitting resistance of stainless steels. Tungsten 2021, 3, 329–337. [Google Scholar] [CrossRef]
  76. Hashimoto, K.; Naka, M.; Asami, K.; Masumoto, T. An X-ray photo-electron spectroscopy study of the passivity of amorphous Fe-Mo alloys. Corros. Sci. 1979, 19, 165–170. [Google Scholar] [CrossRef]
  77. Marsh, B.K.; Day, R.L. Pozzolanic and cementitious reactions of fly ash in blended cement pastes. Cem. Concr. Res. 1988, 18, 301–310. [Google Scholar] [CrossRef]
  78. Tsouli, S.; Lekatou, A.G.; Kleftakis, S.; Gkoutzos, P.; Tragazikis, I.K.; Matikas, T.E. Combined corrosion inhibitors and mechanical properties of concrete embedded steel (AISI 316L) during accelerated saline corrosion test. Mater. Proc. 2021, 5, 72. [Google Scholar] [CrossRef]
  79. Ibrahim, M.A.M.; Abd El Rehim, S.S.; Hamza, M.M. Corrosion behavior of some austenitic stainless steels in chloride environments. Mater. Chem. Phys. 2009, 115, 80–85. [Google Scholar] [CrossRef]
  80. Hurley, M.F.; Scully, J.R. Threshold chloride concentrations of selected corrosion-resistant rebar materials compared to carbon steel. Corrosion 2006, 62, 892–904. [Google Scholar] [CrossRef]
  81. Kontoleontos, M.; Tsakiridis, P.; Marinos, A.; Katsiotis, N.; Kaloidas, V.; Katsioti, M. Dry-grinded ultrafine cements hydration. physicochemical and microstructural characterization. Mater. Res. 2013, 16, 404–416. [Google Scholar] [CrossRef]
  82. Hoshino, S.; Yamada, K.; Hirao, H. XRD-Rietveld analysis of the hydration and strength development of slag and limestone blended cement. J. Adv. Concr. Technol. 2006, 4, 357–367. [Google Scholar] [CrossRef] [Green Version]
Figure 1. The effect of fly ash content on the cyclic potentiodynamic polarization behavior of austenitic stainless steel rebars in an electrolyte of pH ≈ 8 (7.5–7.9) which contains Ca(OH)2 partially replaced by fly ash (0–25 wt.% FA) and an acid rain simulating solution. (a) 316L; (b) 304L.
Cmd 03 00005 g001
Figure 2. The effect of fly ash content on the cyclic potentiodynamic polarization behavior of austenitic stainless steel rebars in an electrolyte of pH ≈ 12.5 (12.3–12.7) which contains Ca(OH)2 partially replaced by fly ash (0–25 wt.% FA) and an acid rain simulating solution. (a) 316L; (b) 304L.
Cmd 03 00005 g002
Figure 3. The effect of pH on the potentiodynamic polarization behavior of austenitic stainless steel rebars in an electrolyte that contains Ca(OH)2 partially replaced by fly ash (0–25 wt.% FA) and an acid rain simulating solution. (a) 316L; (b) 304L.
Cmd 03 00005 g003
Figure 4. The effect of stainless steel type on the potentiodynamic polarization behavior of austenitic stainless steel rebars in an electrolyte that contains Ca(OH)2 partially replaced by fly ash (0–25 wt.% FA) and an acid rain simulating solution. (a) pH ≈ 8 (7.5–7.9); (b) pH ≈ 12.5 (12.3–12.7).
Cmd 03 00005 g004
Figure 5. SEM cross-sectional micrographs of 304L rebars after cyclic polarization in an electrolyte that contains Ca(OH)2 partially replaced by fly ash and an acid rain simulating solution.
Cmd 03 00005 g005
Figure 6. SEM cross-sectional micrographs of 316L rebars after cyclic polarization in an electrolyte that contains Ca(OH)2 partially replaced by fly ash and an acid rain simulating solution.
Cmd 03 00005 g006
Figure 7. SEM cross-sectional micrographs of 304L after cyclic polarization in an electrolyte that contains Ca(OH)2 partially replaced by fly ash (20 wt.% FA) and an acid rain simulating solution. The micrographs are accompanied by point EDX spectra and EDX elemental maps showing the formation of a relatively compact film on the steel surface, via the interaction between steel, Ca(OH)2, fly ash, and acid rain. (a) pH ≈ 8 (7.5–7.9); (b) pH ≈ 12.5 (12.3–12.7).
Cmd 03 00005 g007
Figure 8. SEM cross-sectional micrographs of 316L after cyclic polarization in an electrolyte that contains Ca(OH)2 partially replaced by fly ash (20 wt.% FA) and an acid rain simulating solution, at pH ≈ 8. The micrograph is accompanied by point EDX spectra and EDX elemental maps showing the formation of a relatively compact film on the steel surface, via the interaction between steel, Ca(OH)2, fly ash, and acid rain.
Cmd 03 00005 g008
Figure 9. SEM cross-sectional micrographs of 304L rebar after cyclic polarization in an electrolyte that contains Ca(OH)2 partially replaced by fly ash (25 wt.% FA) and an acid rain simulating solution at pH ≈ 8, showing pits below the CaO-based surface film that are filled with FA agglomerates or compounds of FA–steel surface–AR interactions. The micrographs are accompanied by point EDX spectra and EDX elemental maps showing the interaction between FA–steel surface–AR.
Cmd 03 00005 g009
Figure 10. SEM cross-sectional micrographs of 316L rebar after cyclic potentiodynamic polarization in an electrolyte that contains Ca(OH)2 partially replaced by fly ash (25 wt.% FA) and an acid rain simulating solution at pH ≈ 12.5, showing pits below FA coarse agglomerates. The micrographs are accompanied by point EDX spectra and EDX elemental maps showing the interaction between FA–steel surface–AR.
Cmd 03 00005 g010
Figure 11. The XRD pattern of the lignite fly ash.
Cmd 03 00005 g011
Figure 12. X-Ray diffraction patterns of 316L reinforced concrete cubes (0 and 25 wt.% FA in cement) hydrated at 28 days (samples close to the rebar).
Cmd 03 00005 g012
Table 1. Electrochemical values for 316L and 304L rebars immersed in the mildly alkaline electrolyte (pH ≈ 8), containing Ca(OH)2, the AR simulating solution, and FA (0–25 wt.%). Ecorr: corrosion potential; Ecp: critical passivation potential; Eb2: breakdown potential; Ea/c tr: anodic-to-cathodic transition potential; icorr: corrosion current density; ip: current density in the middle of the passive stage.
316L
FA (wt.%)Ecorr
(mV vs. Ag/AgCl)
Ecp
(mV vs. Ag/AgCl)
Ecp − Ecorr (mV vs. Ag/AgCl)Eb2
(mV vs. Ag/AgCl)
Eb2 − Ecp (mV vs. Ag/AgCl)Ea/c tr
(mV vs. Ag/AgCl)
Ea/c tr − Ecorr (mV vs. Ag/AgCl)icorr
(mA/cm2)
ip
(mA/cm2)
0−267 ± 6−106 ± 141611040 ± 411146−250 ± 27170.0019 ± 0.00060.0033 ± 0.0010
10−255 ± 28−115 ± 331401088 ± 411203−232 ± 65230.0013 ± 0.00030.0032 ± 0.0010
15−233 ± 17−101 ± 261321099 ± 201200−208 ± 26250.0011 ± 0.00030.0025 ± 0.0010
20−229 ± 12−107 ± 291221100 ± 161207−158 ± 35710.0007 ± 0.00020.0014 ± 0.0006
25−245 ± 31−113 ± 221321050 ± 211163−230 ± 65150.0013 ± 0.00060.0044 ± 0.0010
304L
FA (wt.%)Ecorr
(mV vs. Ag/AgCl)
Ecp
(mV vs. Ag/AgCl)
Ecp − Ecorr (mV vs. Ag/AgCl)Eb
(mV vs. Ag/AgCl)
Eb − Ecp (mV vs. Ag/AgCl)Ea/c tr
(mV vs. Ag/AgCl)
Ea/c tr − Ecorr (mV vs. Ag/AgCl)icorr
(mA/cm2)
ip
(mA/cm2)
0−275 ± 33−125 ± 201501025 ± 221150−301 ± 47−260.0024 ± 0.00010.0076 ± 0.0030
15−258 ± 41−98 ± 101601057 ± 271155−297 ± 35−390.0023 ± 0.00030.0074 ± 0.0007
20−251 ± 23−120 ± 391311081 ± 71201−258 ± 33−70.0016 ± 0.00020.0070 ± 0.0010
25−262 ± 13−88 ± 241741070 ± 311158−280 ± 57−180.0027 ± 0.00080.0220 ± 0.0030
Table 2. Electrochemical values for 316L and 304L rebars immersed in the strongly alkaline electrolyte (pH ≈ 12.5), containing Ca(OH)2, the AR simulating solution, and FA (0–25 wt.%). Ecorr: corrosion potential; Ecp: critical passivation potential; Eb1,2: breakdown potential; Ea/c tr: anodic-to-cathodic transition potential; icorr: corrosion current density; ip1,2: current densities in the middle of the current limiting stages preceding Eb1 and Eb2, respectively.
316L
FA (wt.%)Ecorr
(mV vs. Ag/AgCl)
Ecp
(mV vs. Ag/AgCl)
Ecp − Ecorr (mV vs. Ag/AgCl)Eb1
(mV vs. Ag/AgCl)
Eb2
(mV vs. Ag/AgCl)
Eb2 − Ecp (mV vs. Ag/AgCl)Ea/c tr
(mV vs. Ag/AgCl)
Ea/c tr − Ecorr (mV vs. Ag/AgCl)icorr
(mA/cm2)
ip1
(mA/cm2)
ip2
(mA/cm2)
0−391 ± 34−248 ± 20143286 ± 30607 ± 20855−328 ± 51630.0009 ± 0.00010.0040 ± 0.00050.0130 ± 0.0003
10−378 ± 60−271 ± 85107262 ± 46644 ± 14915−331 ± 53470.0007 ± 0.00010.0030 ± 0.00100.0095 ± 0.0015
15−372 ± 33−255 ± 39117267 ± 49653 ± 14908−302 ± 39700.0006 ± 0.00020.0028 ± 0.00100.0100 ± 0.0020
20−355 ± 26−265 ± 1290248 ± 21662 ± 20927−271 ± 48840.0004 ± 0.00010.0022 ± 0.00080.0062 ± 0.0020
25−368 ± 18−217 ± 45151270 ± 23634 ± 14851−318 ± 85500.0010 ± 0.00040.0038 ± 0.00120.0127 ± 0.0040
304L
FA (wt.%)Ecorr
(mV vs. Ag/AgCl)
Ecp
(mV vs. Ag/AgCl)
Ecp − Ecorr (mV vs. Ag/AgCl)Eb1
(mV vs. Ag/AgCl)
Eb2
(mV vs. Ag/AgCl)
Eb2 − Ecp (mV vs. Ag/AgCl)Ea/c tr
(mV vs. Ag/AgCl)
Ea/c tr − Ecorr (mV vs. Ag/AgCl)icorr
(mA/cm2)
ip1
(mA/cm2)
ip2
(mA/cm2)
0−435 ± 11−324 ± 12111272 ± 47654 ± 4978−374 ± 60610.0004 ± 0.000080.0018 ± 0.00050.0040 ± 0.0010
10−398 ± 34−297 ± 32101264 ± 11660 ± 9957−315 ± 64830.0002 ± 0.000050.0014 ± 0.00040.0057 ± 0.0020
15−366 ± 63−236 ± 85130273 ± 28667 ± 21903−346 ± 59200.0001 ± 0.000040.0009 ± 0.00020.0036 ± 0.0006
20−334 ± 36−268 ± 6166260 ± 31679 ± 11947−238 ± 47960.0001 ± 0.000030.0003 ± 0.00010.0033 ± 0.0008
25−401 ± 13−225 ± 54176271 ± 12654 ± 15879−400 ± 10110.0003 ± 0.000070.0013 ± 0.00040.0046 ± 0.0010
Publisher’s Note: MDPI stays neutral with regard to jurisdictional claims in published maps and institutional affiliations.

