1. Introduction
Superalloys, the metallic alloys with outstanding high-temperature properties in the fields of mechanical behavior and corrosion resistance [
1,
2,
3,
4], are most often based on nickel [
5,
6,
7] and cobalt [
8,
9,
10], which are more and more considered to be critical [
11,
12,
13]. The recent appearance of high-entropy compositions allows for the expectation of the moderate replacement of Ni and Co with cheaper and more abundant elements without dramatic losses of properties and even, contrarily, with a possible increase in these properties. Among the high-entropy alloys (HEAs), the chemical compositions of which stay rather close to the superalloy bases, there is the {Co, Ni, Fe, Mn, Cr} quinary system [
14,
15,
16]. In this system, the presence of the five elements in equal atomic quantities [
17,
18,
19], known as the Cantor’s composition, is certainly the best known. Although this equimolar quinary alloy was not really considered as a possible base for-high temperature applications, the first attempts at reinforcement with refractory carbides of the MC-type were undertaken [
20,
21]. They led to promising creep resistance potential [
22]. Unfortunately, it also appeared that these new alloys presented serious problems with oxidation. The detrimental role of manganese and the deleterious effect of a too low content of chromium were pointed out [
23].
These two elements are of interest in the present work, which explores the consequences on the oxidation behavior of these alloys at 1000 °C of a 50% reduction in the manganese content simultaneously with a 50% augmentation of the chromium content. Despite these changes, which induce the loss of equimolarity, the new alloys investigated in this work can be still considered as high-entropy alloys. They will be, thereafter, named “Hea/TaC” for the 3.7 Ta, 0.25 C, wt.%-added version, “Hea/HfC” for the 3.7 Hf, 0.25 C, wt.%-added version, and simply “Hea” for the carbide-free CoNiFeMn0.5Cr1.5 reference alloy.
2. Materials and Methods
The three alloys (ovoid ingots weighing 40 g) were elaborated from pure elements (purity > 99.9%, Alfa Aesar, Haverhill, MA, USA) by high frequency induction melting (CELES furnace, Lautenbach, France; 50 kW, 100 kHz, 5 kV) under an inert atmosphere (300 millibars of pure argon). After the initial embedding ((XF40) + hardener (XH40) from NX MET) for easy handling and the first cutting, the parts were metallographically prepared (second embedding in cold resin mixture, grinding from #240- to #1200-grit SiC papers, rinsing, final polishing with 1 µm alumina hard particles). The obtained mirror-like state metallographic samples allowed us to observe the as-cast microstructures of these new alloys using a scanning electron microscope (SEM) (JEOL, Tokyo, Japan; JSM 6010–LA model), mainly in back scattered electrons (BSE) mode and under a 20 kV acceleration voltage. The chemical compositions were controlled using the energy dispersion spectrometer (EDS) attached to the SEM.
Parallel-piped samples with 10 mm × 10 mm × 2 mm as approximate dimensions were cut from the remaining parts of the ingots and ground all around with up to #1200-grit SiC papers to obtain the same initial surface state prior to the oxidation test as for many earlier oxidation tests to allow for comparisons. Special attention was given to edges and corners, which were softened with the same #1200 papers to prevent possible local over-oxidation.
The oxidation tests were carried out in a synthetic air flow (dry 80%N2–20%O2, Alphagaz 1), with thermogravimetric follow-up of the oxidation progress. The used thermobalance was a TGA 92-16.18 from SETARAM (Caluire, France) The applied thermal cycle was composed of a 20 K min−1 heating, a 50 h-isothermal stage at 1000 °C, and a −5 K min−1 cooling.
The oxidized samples were subjected to X-ray diffraction (XRD) using a BRUKER D8 Advance spectrometer, working with a copper source (Kα, λ = 1.5406 Å). They were, thereafter, embedded in the same cold resin mixture as above. Each embedded sample was cut using a metallographic saw in two equal parts, which were ground (SiC papers from #240-grit to #1200-grit), then polished (1 µm alumina hard particles) to obtain the mirror-like state compulsory for the metallographic examination. These metallographic preparations of the oxidized samples were observed with the SEM, mainly in BSE mode, under 20 kV. The external and internal oxides were imaged and analyzed with spot analyses carried out using EDS. Concentration profiles were acquired in the subsurface perpendicular to the oxide scale/alloy interface. Elemental EDS cartography was also performed to better observe the distribution of the different elements in oxides and in the alloy over the zone affected by oxidation.
3. Results
3.1. Characteristics of the Alloys Available for This Study
Despite their modified chemical compositions (weight contents in
Table 1, atomic contents in
Table 2) from the equimolar original alloys [
20,
21], the microstructures of the as-cast CoNiFeMn
0.
5Cr
1.
5-TaC (Hea/TaC) or -HfC (Hea/HfC) alloys stayed obviously unchanged (
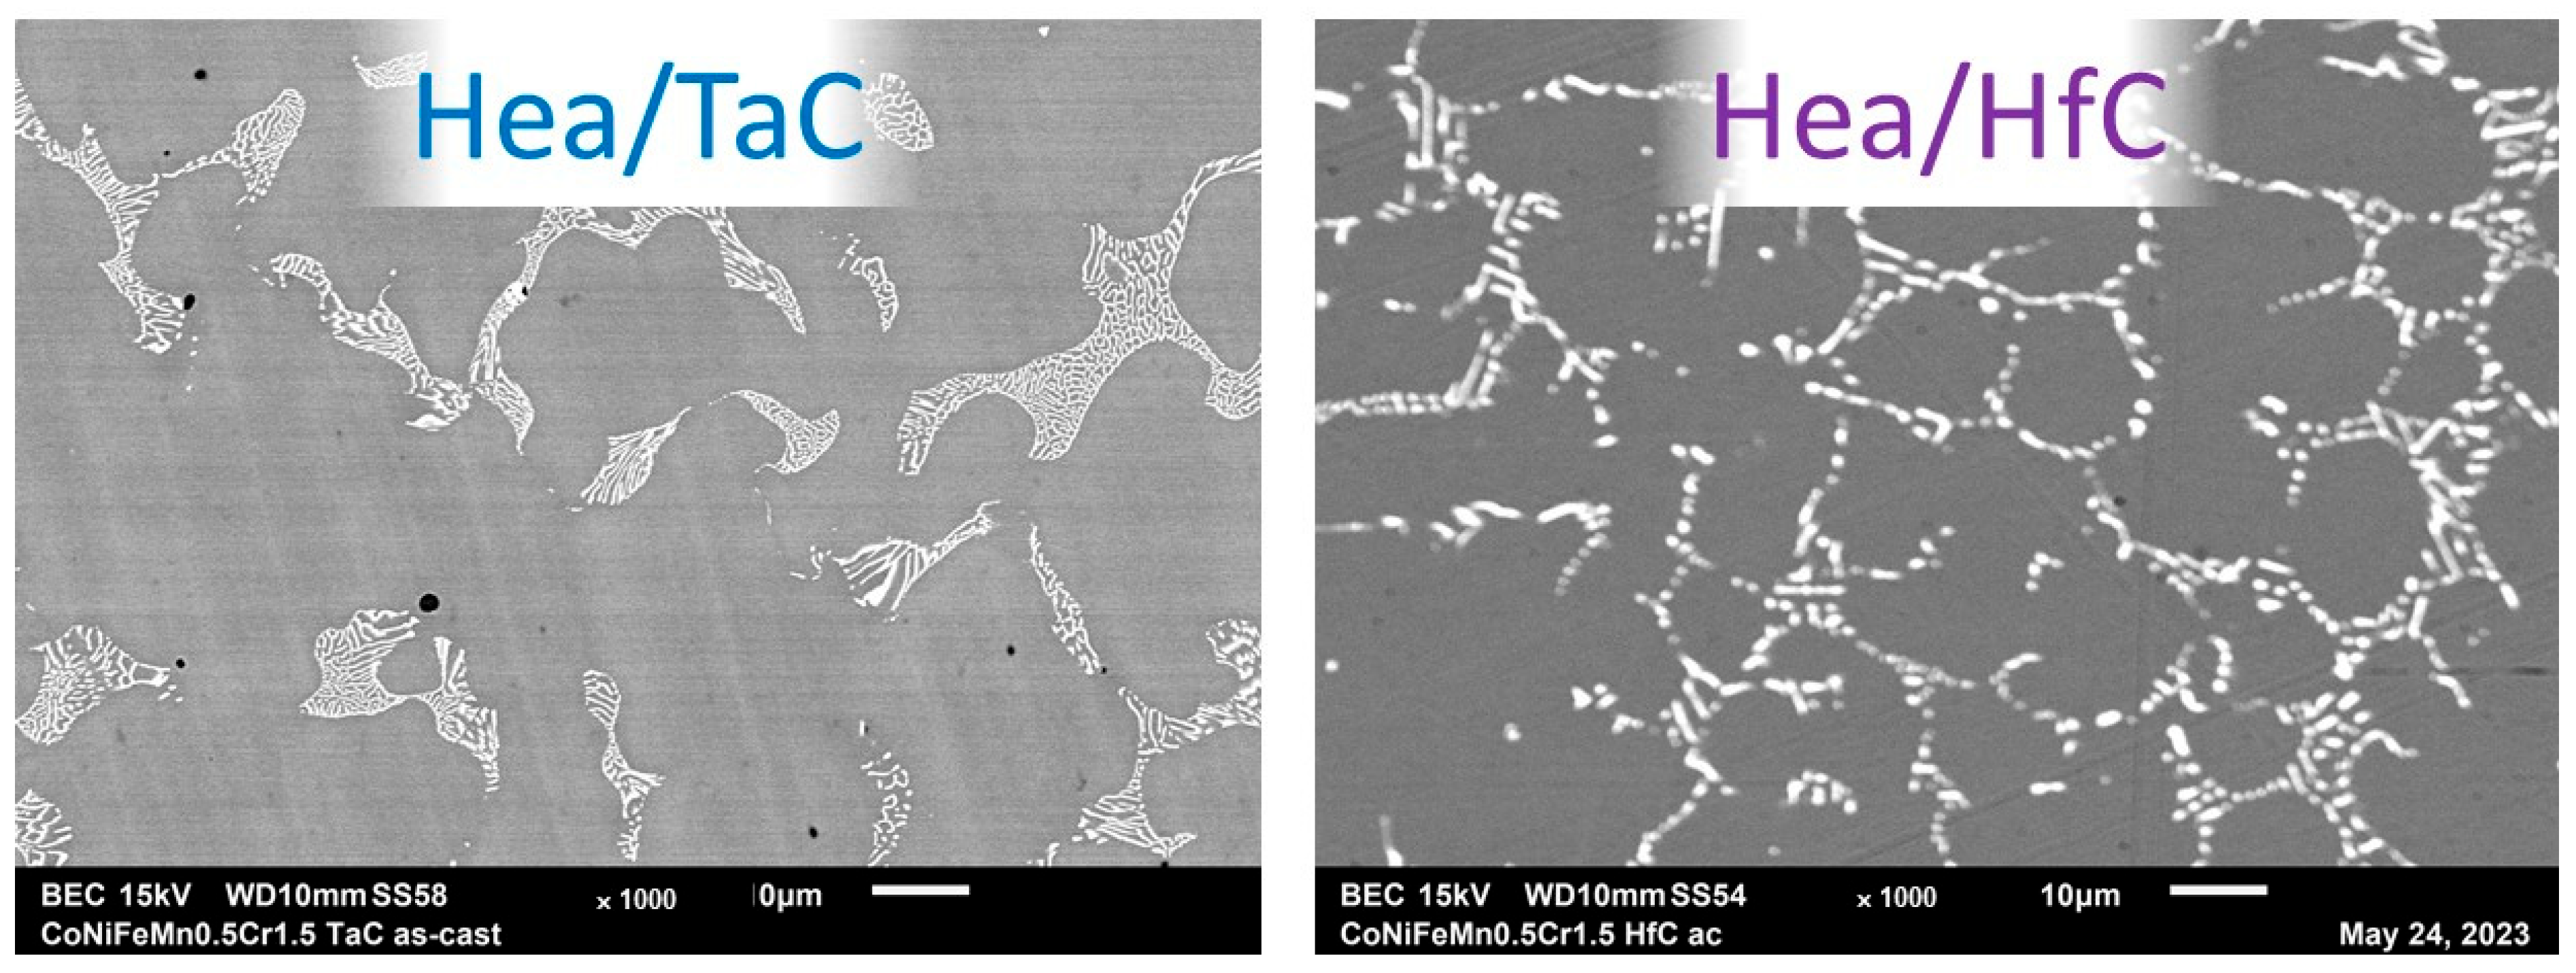
Figure 1) by comparison with the initial equimolar versions. Indeed, one can see that (1) the Hea alloy is seemingly single-phased (polycrystalline solid solution of all elements with a FCC crystalline network); (2) the Hea/TaC alloy has a dendritic matrix and script-like interdendritic TaC carbides, which are exclusively of a eutectic nature; and (3) the Hea/HfC alloy presents eutectic script-like HfC carbides in the interdendritic spaces and also blocky pre-eutectic HfC carbides gathered as clusters. The image analysis carried out using the GIMP 2.10 software showed that the Hea/TaC Hea/HfC alloys contain 5.5 ± 0.7 surf.% and 5.2 ± 1.5 surf.%, respectively. In absence of any particularly elongated shape and of any particular orientation of the carbide network, these values can be, in both cases, taken also as values of the volume fractions.
The recent X-ray diffraction runs and electron microscopy observations demonstrated that the Hea alloy is still single-phased (FCC), the Hea/TaC alloy is double-phased (FCC matrix + interdendritic eutectic script-like TaC) and the Hea/HfC alloy is double-phased as well (FCC matrix + HfC carbides). In the later alloy, the HfC carbides are present with two distributions and shapes: clusters of some pre-eutectic compact carbides (minor part) and interdendritic eutectic script-like carbides (major part). The higher magnification electron micrographs are provided in
Figure 2. They allow for better distinguishing of the script-like shapes of the eutectic TaC and HfC carbides present in the interdendritic and intergranular spaces.
3.2. Thermogravimetry
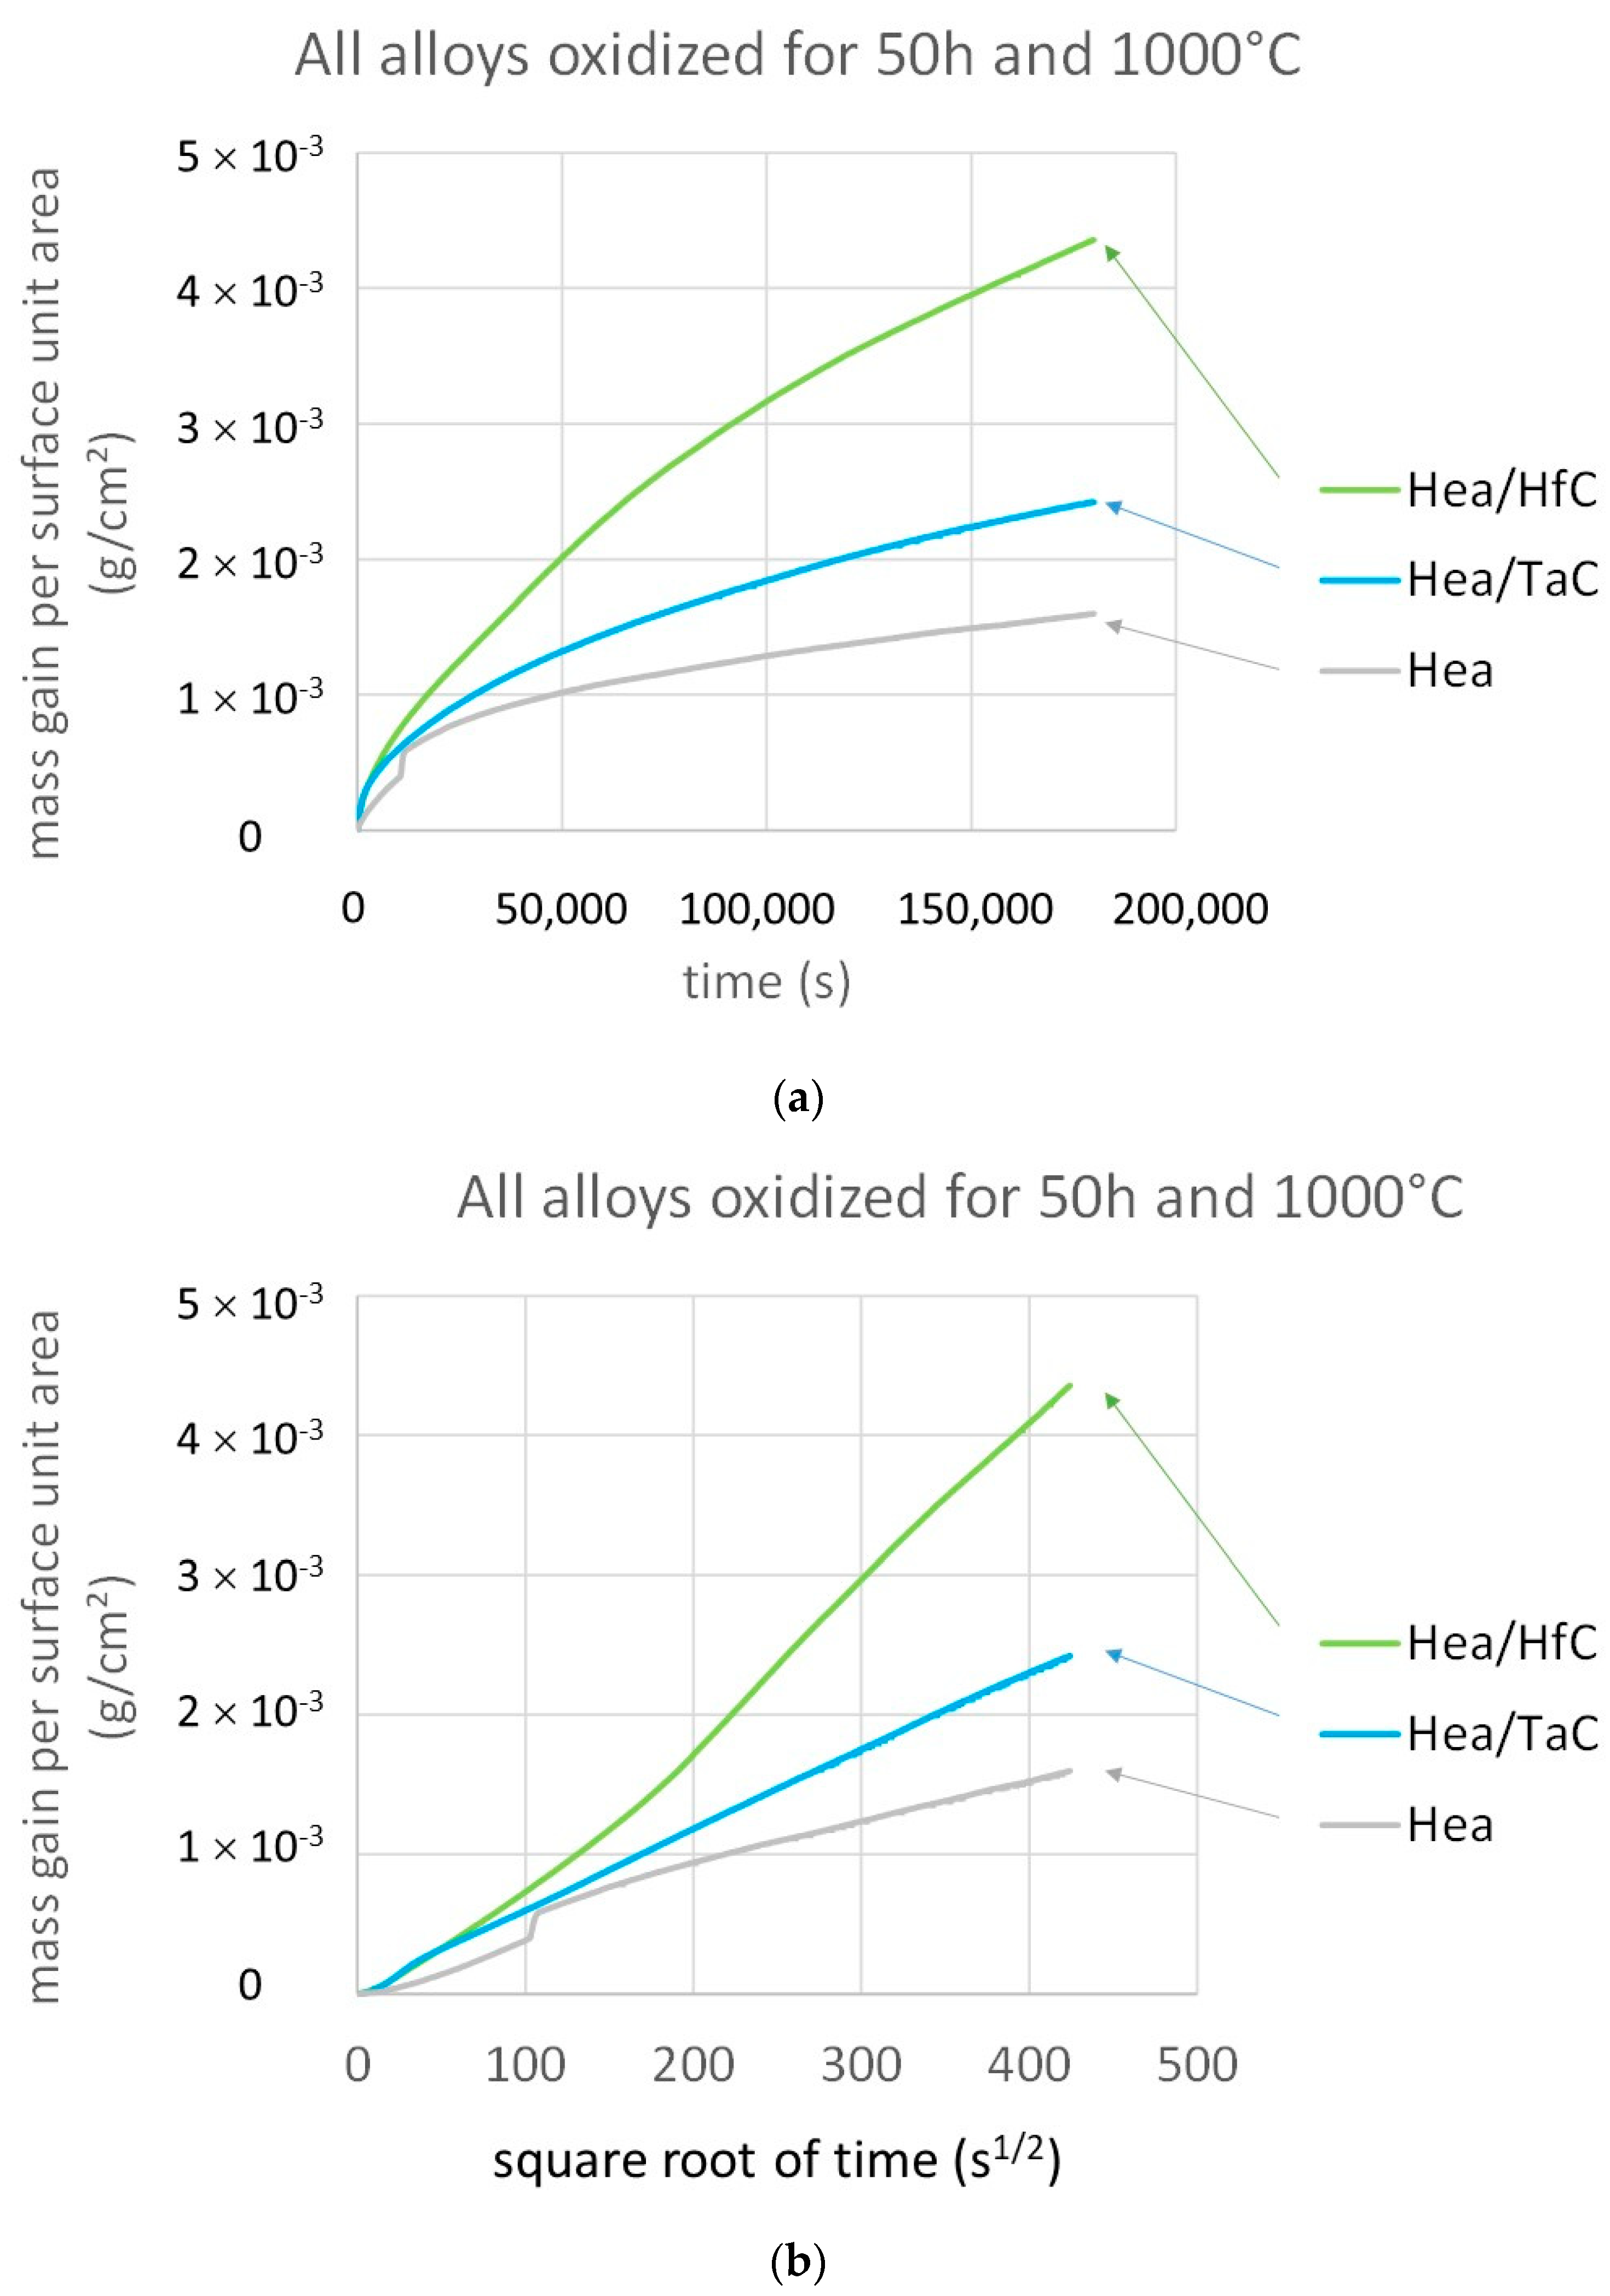
The three obtained curves are first all plotted together versus time in
Figure 3a and versus the square root of time in
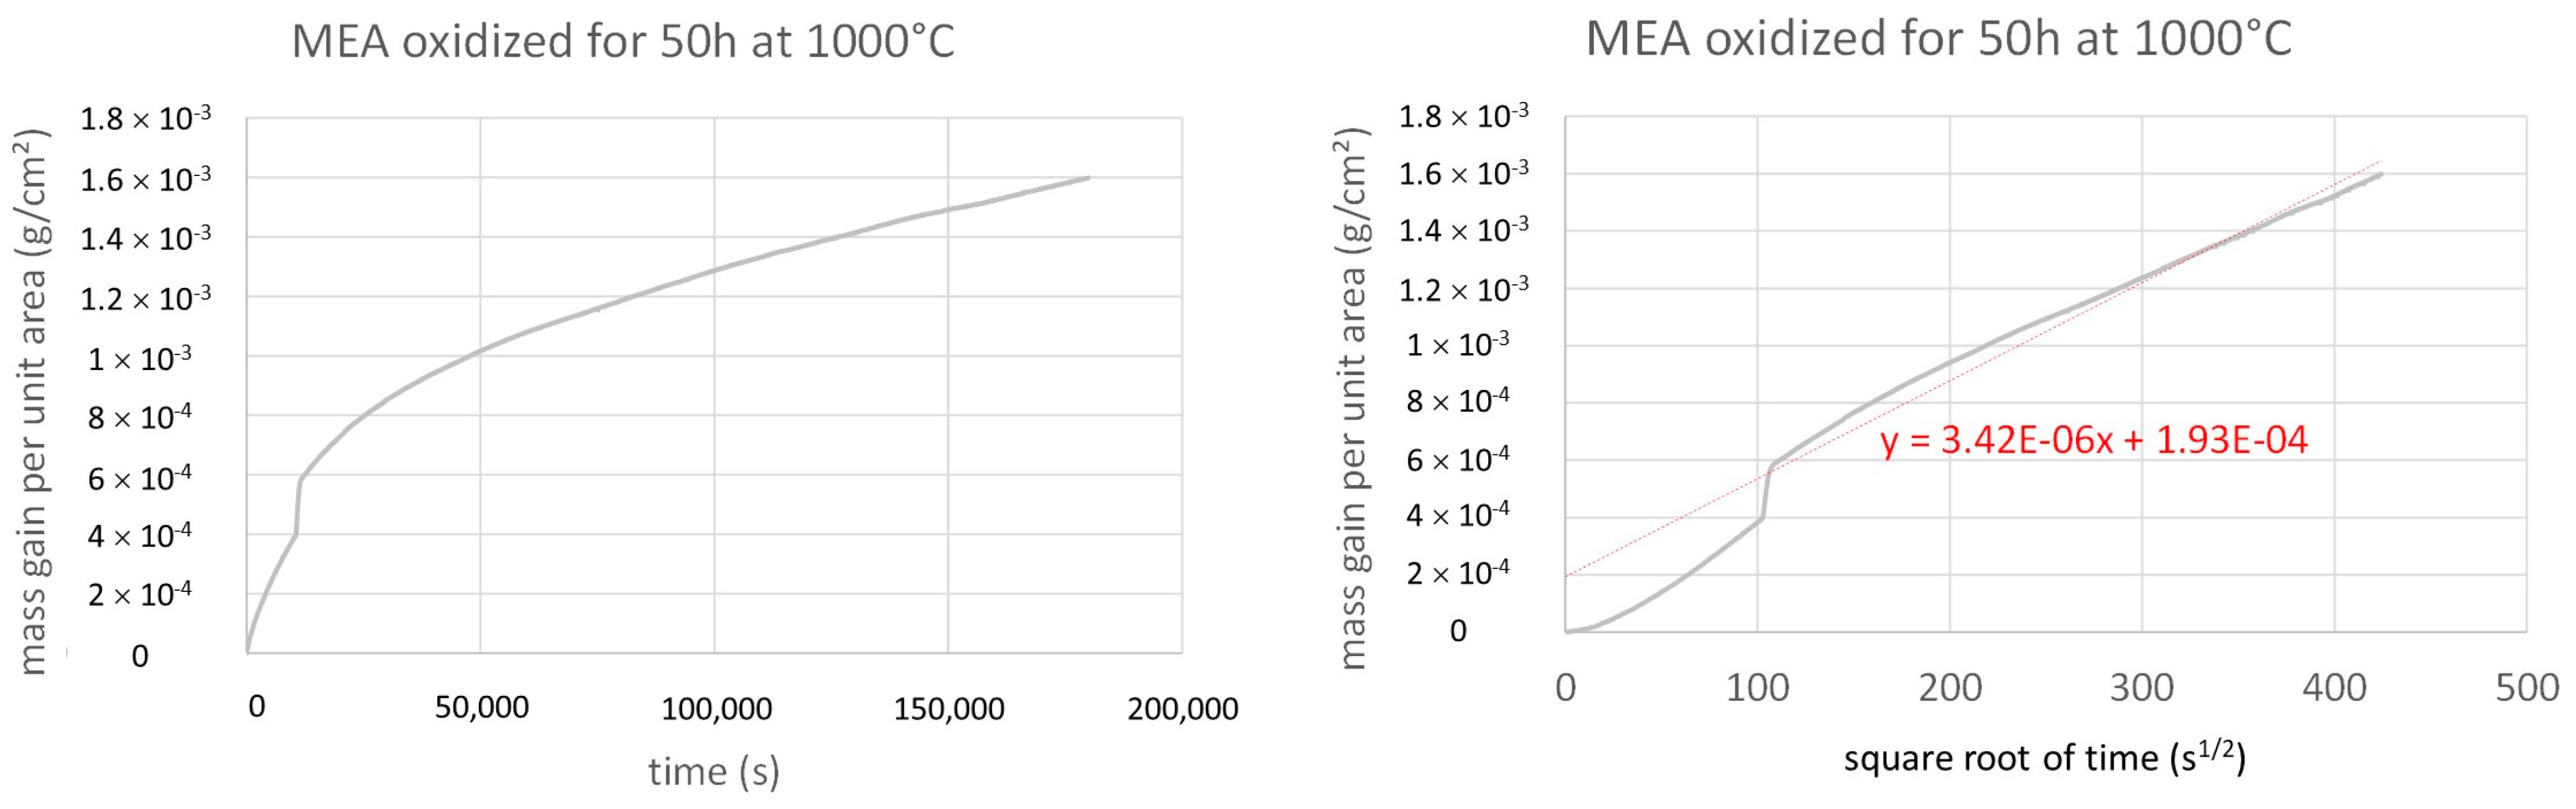
Figure 3b for comparison between the three alloys at a glance and for seeing that their oxidation kinetics are different from one another. The mass gain curves obtained for the Hea alloy only, plotted versus time and plotted versus the square root of time (with the regression line and equation), are presented in
Figure 4 for the better observation of the parabolic regime of the mass gain. The equivalent graphs are given for the Hea/TaC alloy in
Figure 5 and for the Hea/HfC alloy in
Figure 6.
The three mass gain curves plotted versus time are obviously parabolic. This strongly suggests that a continuous external oxide scale developed all around the samples and isolated the alloy from hot air at the early beginning of the isothermal stage. It appears obvious that the isothermal oxidation obeys Wagner’s law without apparent linear oxidation nor linear oxide evaporation. This led to plot them versus the square root of time in order to estimate the corresponding parabolic constants (Kp). In this second representation mode, a tenuous linear mass loss—superposed to the parabolic mass gain—seems to exist for the Hea alloy (the last half of the curve is slightly concave) while a linear mass gain—tenuous as well, superposed to the parabolic regime—can be suspected for the Hea/HfC alloy (the last half of the curve is slightly convex). Despite these observations, it was decided to access a valuable estimation of the parabolic constants, from the slope of the regression straight lines drawn in the mass gain versus square root of time representations. The results are given in
Table 3.
3.3. Surface Analysis Prior to Cutting
Before the cross-sectional metallographic preparation for the phase’s imagining and chemical analysis, the oxidized samples were exposed to Cu Kα radiations for XRD analysis. The obtained diffractograms are displayed in
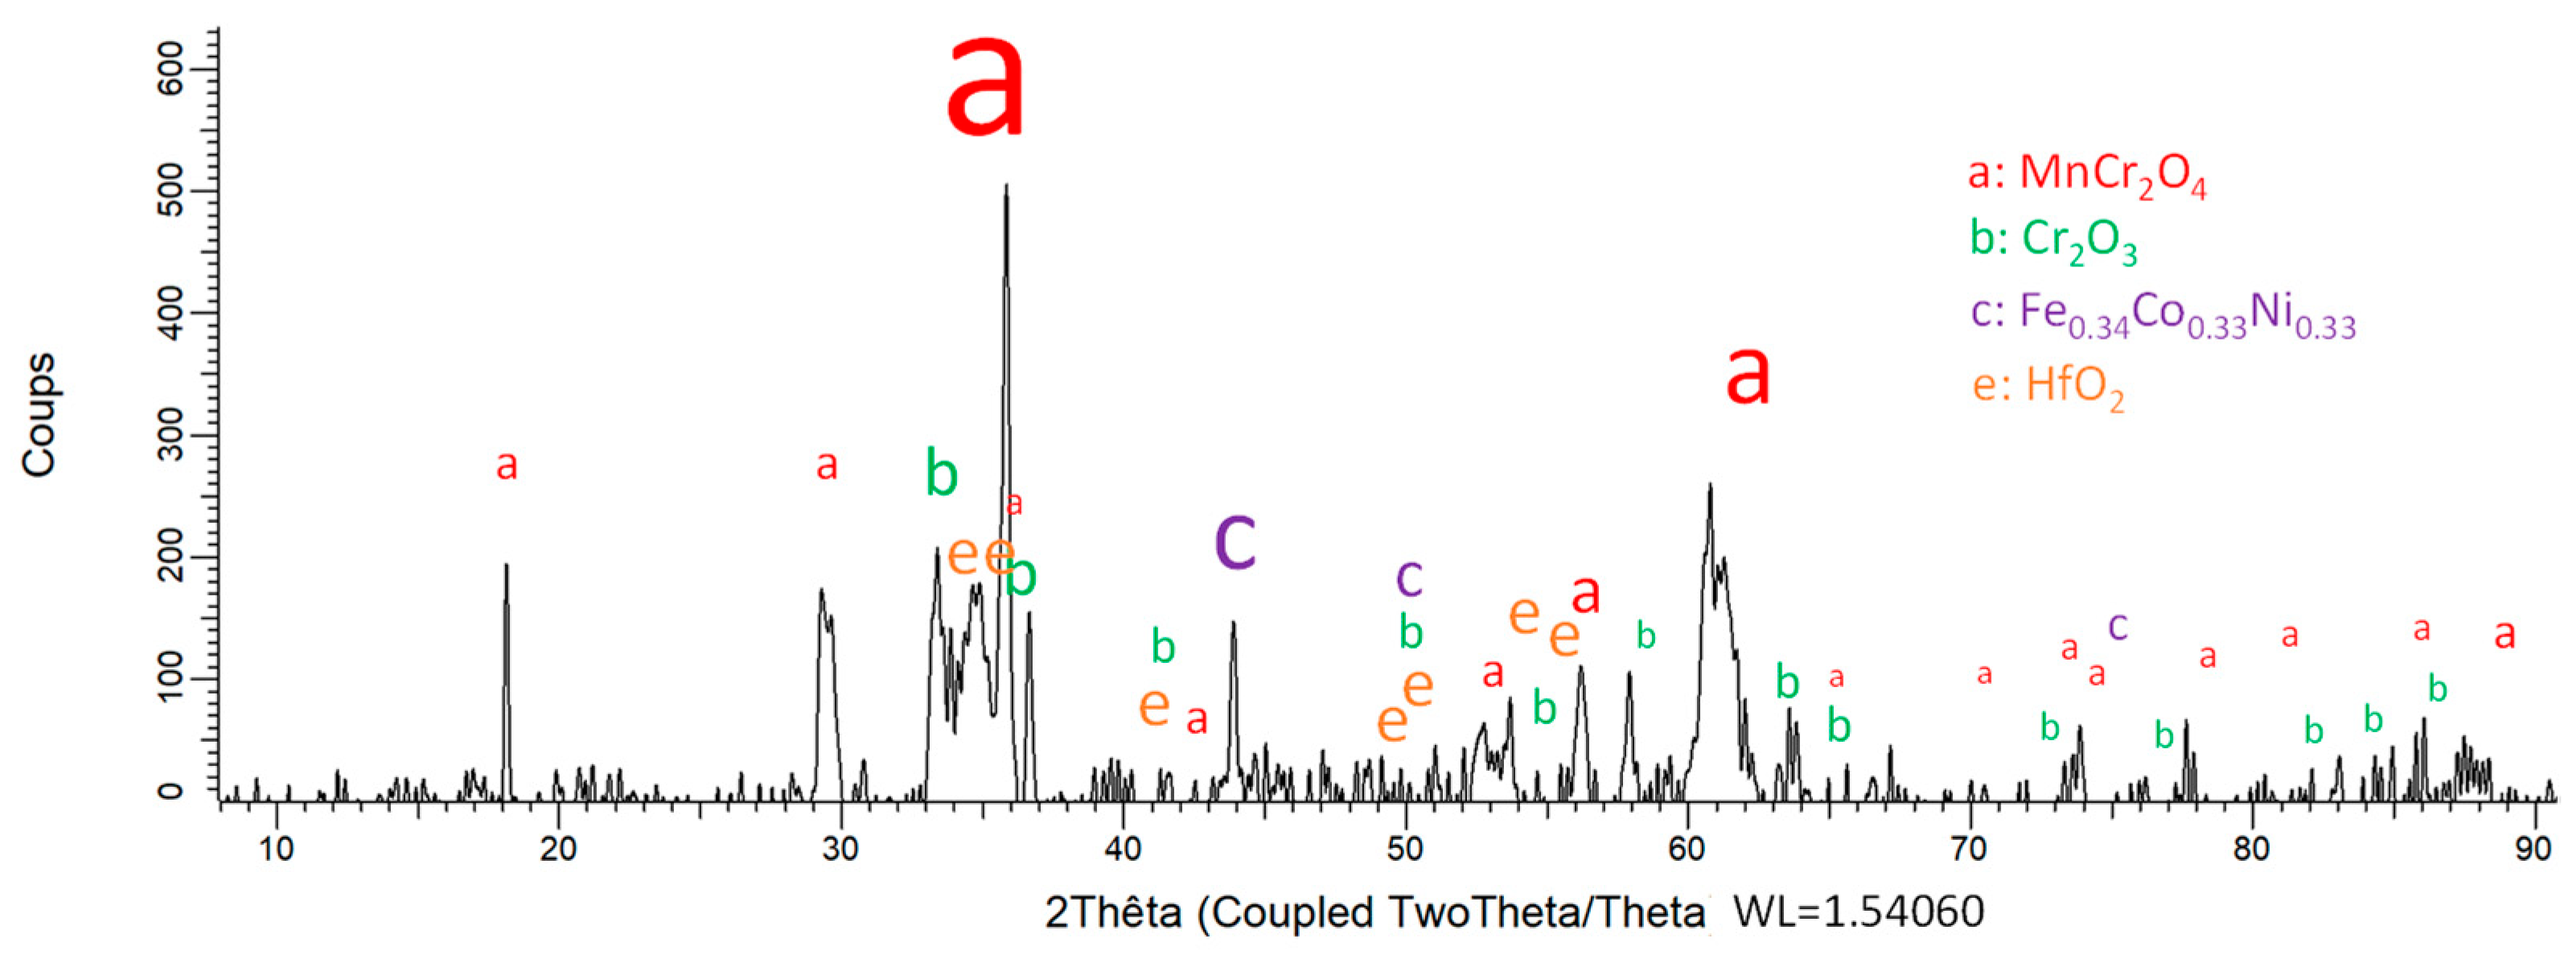
Figure 7 for the Hea alloy, in
Figure 8 for the Hea/TaC alloy, and in
Figure 9 for the Hea/HfC alloy (the size of the “a” to “e” characters are related to the theoretical intensities).
Because a more or less extended oxide spallation occurred during the cooling, the alloys were exposed to XRD in the denuded parts of the surface. Several of the obtained peaks correspond, thus, to the FCC matrix, while the other peaks can be attributed to the formed oxides. Obviously the MnCr2O4 spinel oxide, which is present in the three diffraction patterns, is the most present oxide, according to the particularly high intensities of its corresponding peaks. This spinel oxide involves a great part of chromium, at the expense of chromia (Cr2O3), which is present in all cases too, but with much lower intensities. Other oxides seems to be present, albeit with low peak heights as well: CrTaO4 for the Hea/TaC alloy and HfO2 for the Hea/HfC alloy.
3.4. Metallography in Cross-Section
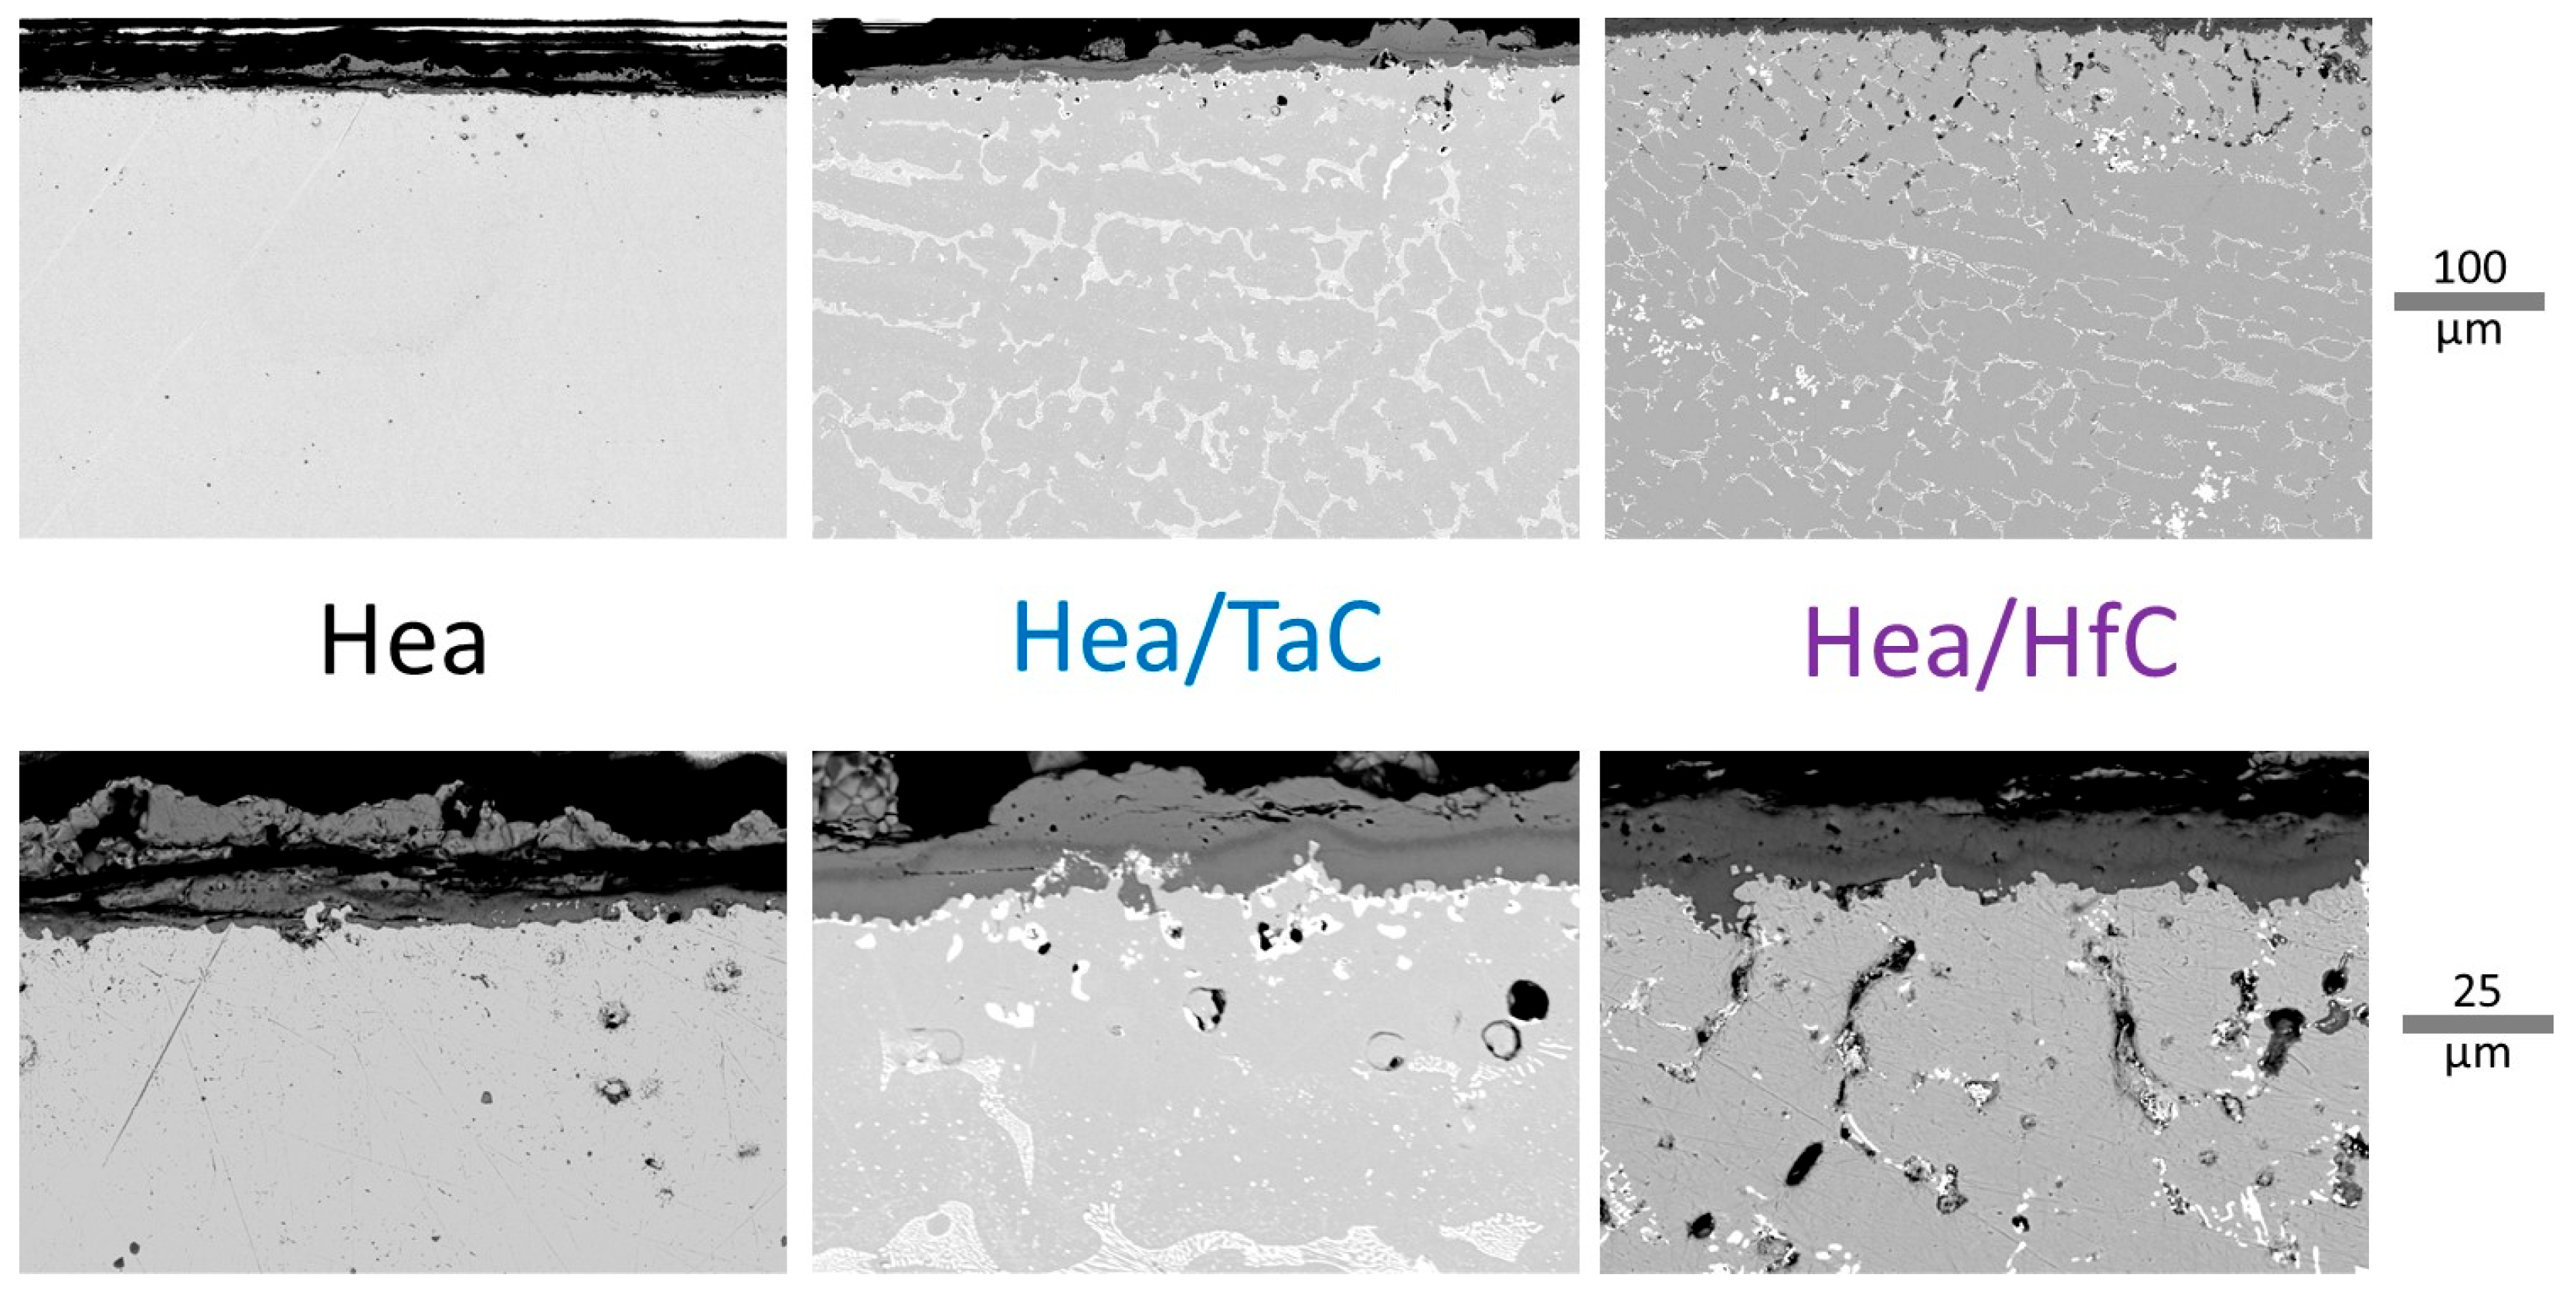
Figure 10 illustrates the oxidation products and indirect effects with low magnification and high magnification SEM/BSE micrographs. First, the oxide scales formed externally have obviously suffered from spallation during cooling for all alloys. Second, no internal oxidation occurred in the subsurface of the Hea alloy, while for the Hea/TaC alloy, several particles of CrTaO
4 oxide appeared on the oxidation front (oxide scale/alloy interface) and in the subsurface region close to the oxidation front. At the same time, a TaC-free zone developed from the scale/alloy interface. The subsurface oxidation features are different for the Hea/HfC alloy since oxidation seems to penetrate into the alloy in addition to the external oxidation. The elemental cartography of these zones was realized for the three alloys and the corresponding X-maps are displayed in
Figure 11,
Figure 12 and
Figure 13 for the Hea alloy, Hea/TaC alloy, and Hea/HfC alloys, respectively.
The X-maps corresponding to the oxidized Hea alloy (
Figure 11) clearly show a particular structure in the external scale, with an outer part much richer in Mn than in Cr and an inner one especially rich in Cr. The latter includes a thin layer of chromia (with an absence of Mn in this thin layer), the low thickness and location of which explains its low response to X-ray diffraction (Cr
2O
3 covered by the Mn-rich Cr-poor oxide). Fe seems also to be a little present with Mn in the outer part. In the subsurface, one can observe the impoverishment in Mn and also in Cr over a lower depth. In contrast, Co, Ni, and even Fe seem to stay homogeneous in the subsurface, which is logical since they do not take part in the oxide formation. Concerning the Hea/TaC alloy (
Figure 12), the outermost Mn-rich mixed oxide and the thin Mn-free internal chromia layer are evidenced again (as in the Hea alloy). The mixed oxides of Cr and Ta, and deeper into the TaC carbides, are also visible, as well as the subsurface impoverishment in Mn and in Cr. We also found again the still homogeneous repartition of Co, Ni, and Fe, which was not influenced by the oxidation taking place nearby.
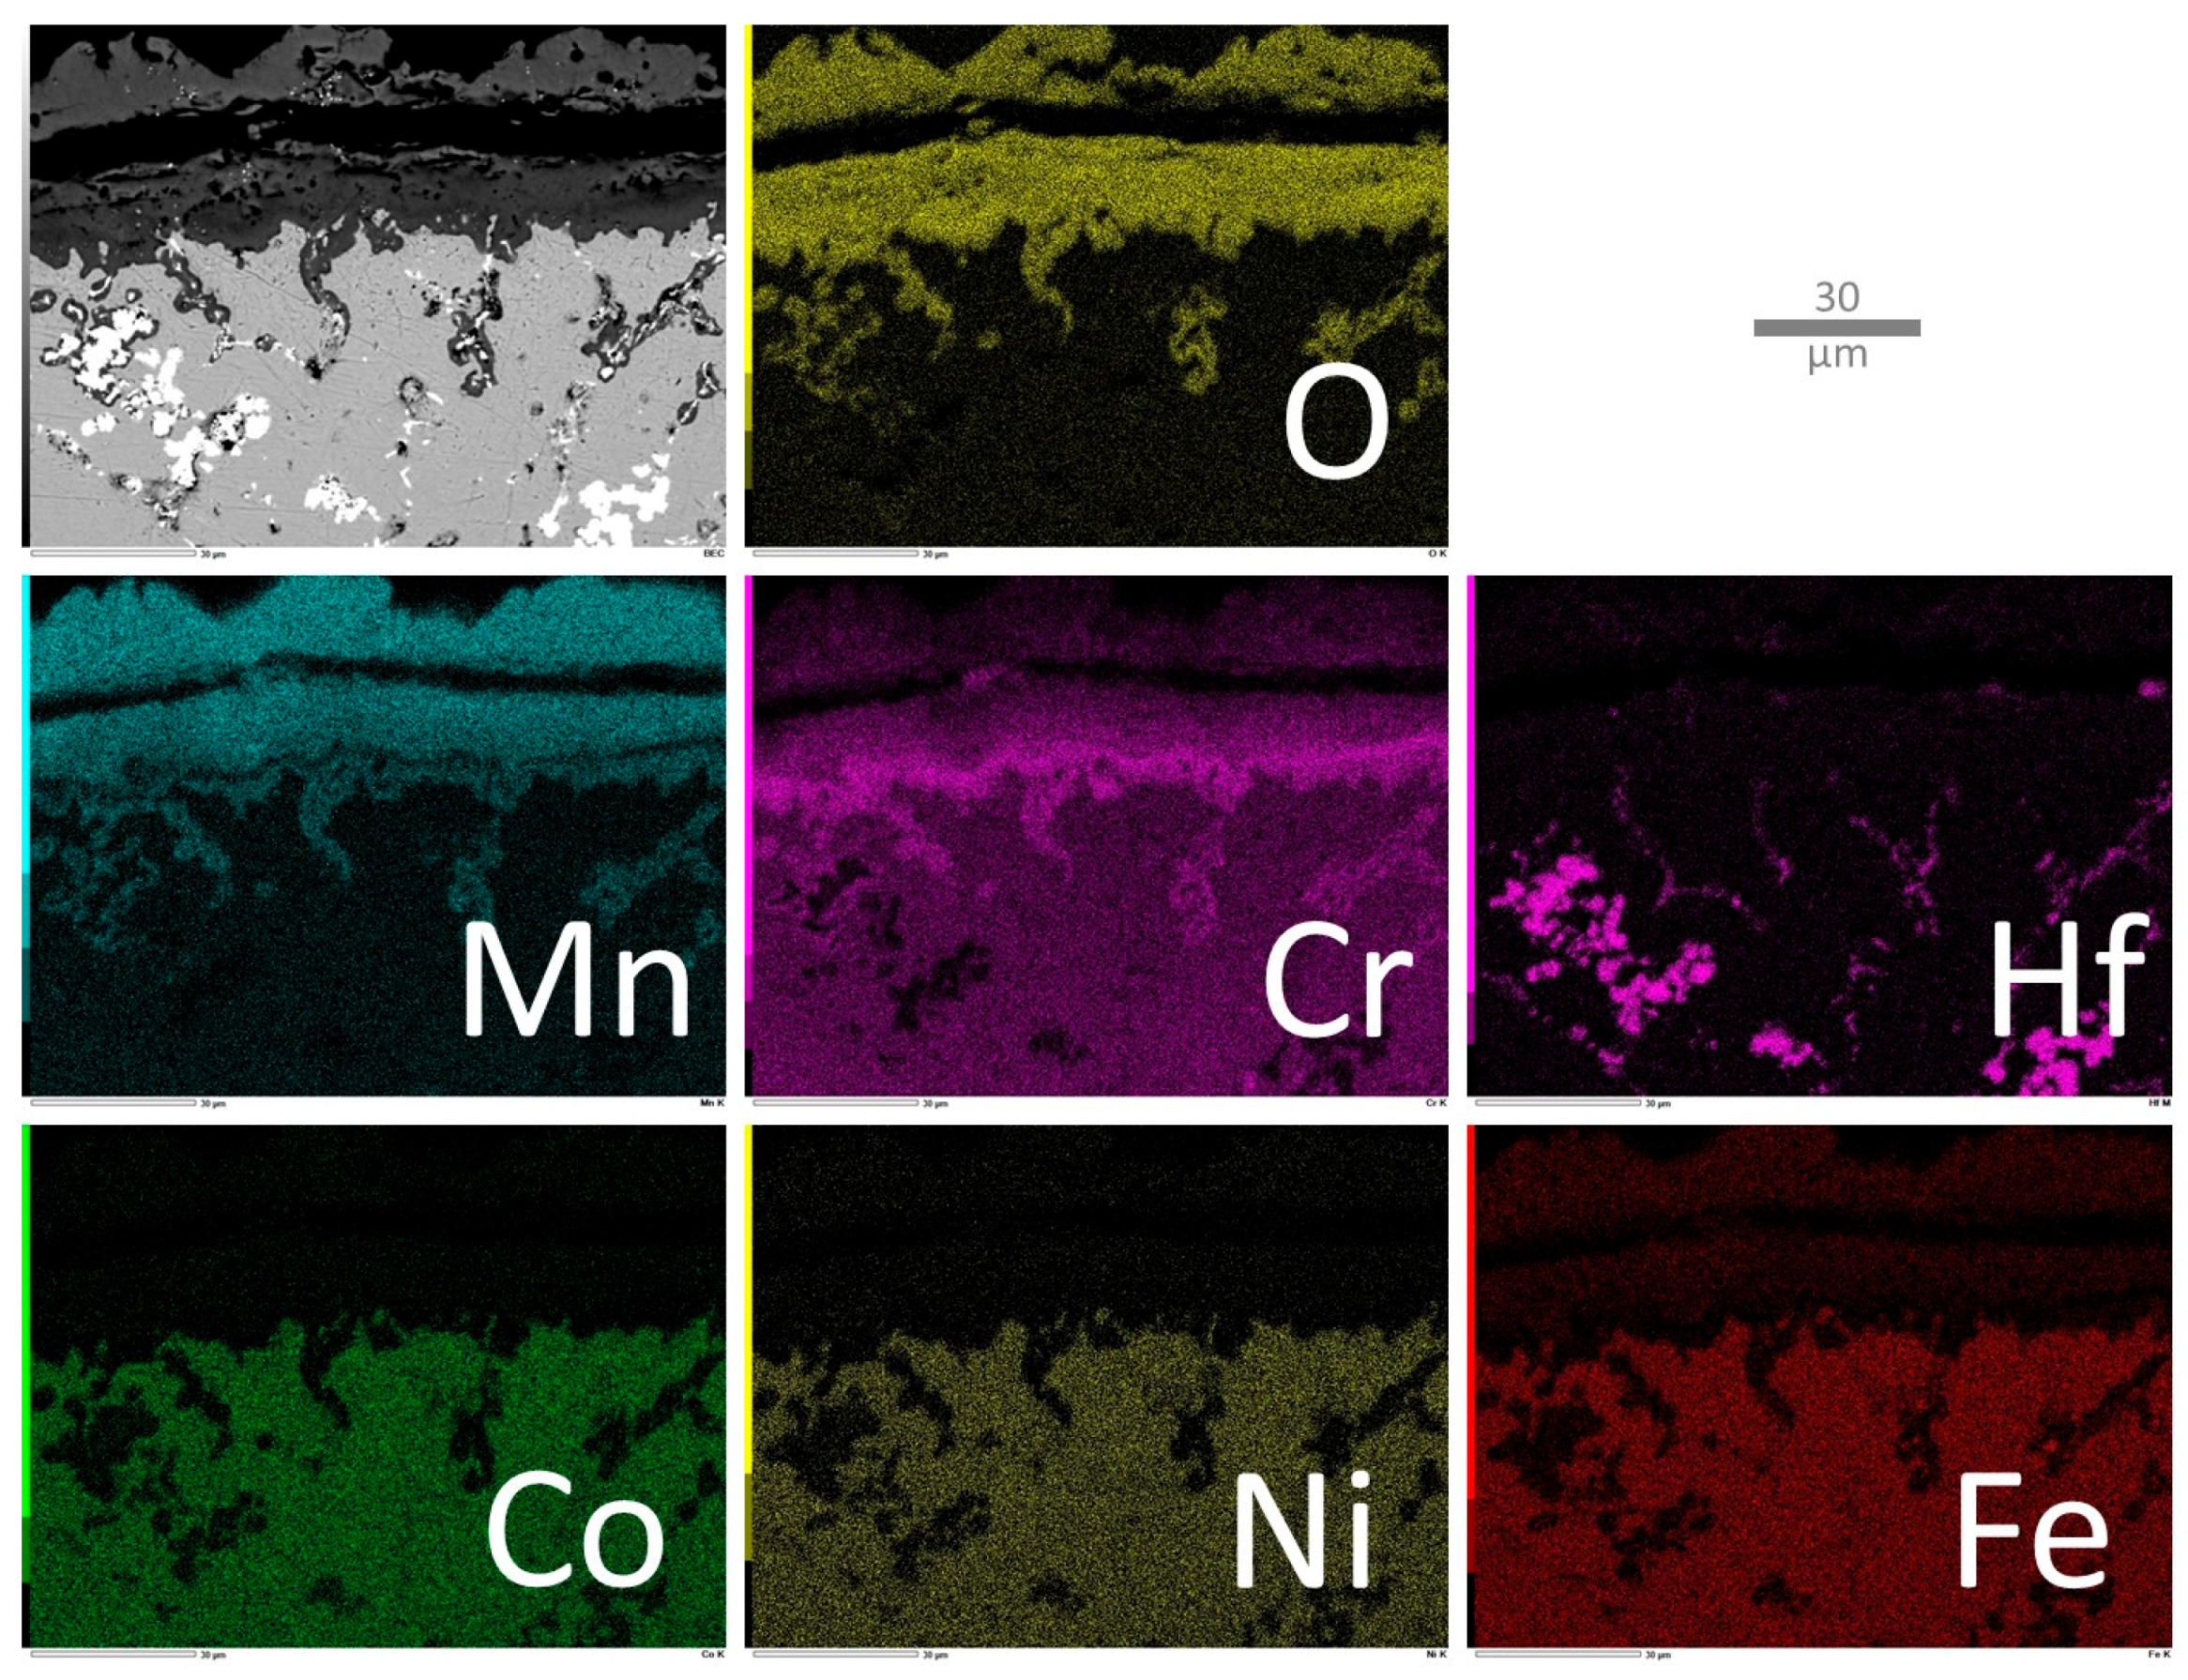
In the case of the Hea/HfC alloy (
Figure 13), the same configuration of the external oxide scale concerning manganese and chromium is found again. The internal thin chromia scale totally free of Mn is visible here too. In addition, X-mapping evidences the internal oxidation of Mn and Cr, as well as the in situ oxidation of the HfC carbides next to the oxidation front, with the progressive conversion of carbide into oxide (visible when comparing the O and Hf maps). The consequences of the Mn and Cr diffusion towards the oxidation front and the gradients of the concentrations of these elements are also clearly evidenced. Again, the distributions of Co, Ni, and Fe are homogeneous.
The progressive impoverishment in Mn and Cr when going closer and closer to the oxidation front is more quantitatively revealed by the EDS profiles acquired perpendicularly to the front (
Figure 14). The decrease in both elements led to very low content values next to the interface with the external surface. These values were a little scattered, as well as the depleted depths, depending on the analysis location along the oxidation front. The ranges of the measured values [min, MAX] are given in
Table 4.
The lowest values of Cr contents close to the oxidation front are observed for the two carbide-containing alloys, with approximately 21 wt.%Cr against 25 wt.%Cr for the quinary alloy. The same hierarchy exists concerning the minimal Mn content (1 to 1.5 wt.%Mn for the Hea/TaC and Hea/HfC alloys against more than 3 wt.%Mn for the Hea alloy). Concerning the Cr and Mn impoverishment depths, there are no significant difference between the Hea and the Hea/TaC alloys. In contrast, the Cr- and Mn-depleted zones extend deeper for the Hea/HfC alloy.
4. Discussion
Thus, having first checked that the chemical composition changes tested here had no visible consequences on the microstructure (notably, on the characteristics of the reinforcing MC carbides network), it was a good surprise (but expected) to observe that the oxidation behavior at 1000 °C was significantly improved in comparison to the equimolar base versions of these alloys. This was essentially demonstrated by the parabolic kinetics, which are much slower than the ones for the equimolar CoNiFeMnCr-based alloys previously tested [
24]: 6, 16, and 65 × 10
−12 g
2 cm
−4 s
−1 for the Hea, Hea/TaC, and Hea/HfC present alloys against 60, 75, and 162 × 10
−12 g
2 cm
−4 s
−1 for their corresponding equimolar versions, respectively. However, they are still higher than for the chromia-forming alloys as the binary Ni–30 wt.%Cr at the same temperature (<3 × 10
−12 g
2 cm
−4 s
−1). The fact that the kinetics of the present CoNiFeMn
0.
5Cr
1.
5-based alloys are intermediate between the fast kinetics of the corresponding equimolar alloys [
24] and the slow kinetics of a chromia-forming alloy is possibly due to the presence of the internal thin layer of (seemingly pure) chromia which is much more continuous than the internal chromia parts observed in the case of the equimolar versions [
24]. The thin continuous chromia scales observed here are Mn-free, in contrast with the chromia formed in the equimolar versions, which contained a little part of Mn [
24]. Their presence is to be attributed to the high contents in Cr in the present alloys by comparison with the ones of the equimolar versions. Nevertheless the chromia scale did not grow as fast as for chromia-forming alloys because of the simultaneous involvement of Mn in the oxidation phenomenon. Despite its low thickness, this continuous internal scale of pure chromia acts as a very efficient diffusion and is certainly helped a little in this role by the presence of a continuous double layer of (Cr,Mn)-oxide (close to the MnCr
2O
4 stoichiometry). The latter is not so efficient as the intrinsic diffusion barrier but is much thicker than the thin chromia scale. Of course, with a thickness of approximately 2–3 µm, which can be estimated from the X-maps, this chromia scale is not as thick as for a Ni–30 Cr oxidized in the same conditions of air composition and pressure, temperature, and duration, but its protective effect, associated with the one from the (Cr,Mn)-oxide, is nevertheless significant. In this hypothesis, the fact that the straight lines representing the mass gains versus the square root of time are globally rectilinear all along the isothermal stage suggests that this internal chromia scale was continuous rather early in the isothermal stage. In the case of the Hea alloy, the unique other oxide to form beside chromia was a complex oxide mixing Mn and Cr. It formed both more internally (minor part) and more externally (major part) than the thin chromia scale. This oxide, to which its two times higher Kp (i.e., oxide scale four times thicker) than for the Ni–30 Cr alloy can be attributed, has obviously grown inwards (limited anionic diffusion) and outwards (faster cationic diffusion). This demonstrates that the thin chromia scale was probably neither thick enough nor impervious enough to hinder the participation of Mn in the oxidation phenomenon.
The detection (XRD) and observation (SEM, EDS) of CrTaO4 and HfO2 oxides, respectively, in the Hea/TaC and Hea/HfC alloys showed that carbides also contributed to oxidation. Obviously, the TaC dissolved in the alloy part close to the oxidation front, and Ta was oxidized in the subsurface, while the HfC seemingly helped inwards oxygen diffusion, allowing for the significant internal oxidation of Cr and Mn in the interdendritic boundaries. Hf was itself also moderately oxidized. These formations of the internal oxides, added to the external oxide scale growth, are certainly at the origin of the faster mass gains observed for the Hea/TaC and particularly Hea/HfC alloys.
In addition to the traditional behavior of Cr in the chromium-rich alloys, Mn was obviously heavily involved in the oxidation process. Minimal Mn contents close to the oxidation front are almost the same for the present alloys as the equimolar versions, despite the lower initial Mn contents in the alloys studied here. In contrast, the minimal Cr contents, which are still above 20 wt.% (i.e., the content allowing for classical superalloys to stay longer in the chromia-forming stage), while the minimal Cr contents of the equimolar versions were lower than 10 wt.% and even 5 wt.%. This is maybe the difference in chromia behavior between the present alloys and their equimolar versions: here, Cr was still available enough to sustain the continuity of the thin chromia layer, while this was no longer possible for the equimolar versions, thus, similar to the well-known difference between superalloys rich enough in Cr and the ones that contain insufficient chromium.
Concerning the integrity of the external oxide scale when temperature varies, one noted that the oxide scale structure is complex and, consequently, not resistant enough to growth compression stresses and/or to shear stresses induced by differential thermal contraction. In contrast with the compact and adherent chromia oxide scales developed on the Ni–30 wt.%Cr alloy and on many other chromia-forming alloys and superalloys, the oxide scales developed over the present modified Cantor’s alloys, which are neither compact nor tough, and they too easily suffer spallation.
5. Conclusions
Therefore, decreasing the presence of Mn and increasing Cr have, obviously, a very positive influence on the behavior of oxidation at high temperature in the Cantor’s alloy and its derived versions strengthened by MC carbides. However, despite these changes in chemical compositions, these alloys are still not really protected by chromia (Cr2O3 is continuous but too thin), in contrast with what is possible with approximately 30 wt.%Cr. Their oxidation kinetics are still faster than really chromia-forming alloys and the oxides scales, heterogeneous in oxide nature and presenting multiple defects (including shear cracks), suggest catastrophic behavior in the thermal cycling conditions, which are commonly met in service for high-temperature industrial components. The new decrease in Mn is to be envisaged, maybe down to close to 2 or 1 wt.%, values which may induce positive effects (such as lowering the volatilization of chromia at T > 1000 °C). With such a low Mn content, the quinary base should become almost a quaternary alloy. Mn can be also totally removed and replaced by another element. Cu can be a candidate, as well as Al, which is otherwise, as Cr, useful to combat hot oxidation. The further work will soon deal with such substitution tests.
Author Contributions
Conceptualization, P.B.; methodology, P.B. and L.A.; software, P.B.; validation, P.B., C.R. and L.A.; formal analysis, P.S., C.G., N.C., L.A., G.M. and P.B.; investigation, P.S., C.G., N.C., L.A., G.M. and P.B.; resources, A.V. and L.A.; data curation, P.B. and L.A.; writing—original draft preparation, P.B.; writing—review and editing, P.B.; visualization, P.B.; supervision, P.B.; project administration, P.B. All authors have read and agreed to the published version of the manuscript.
Funding
This research received no external funding.
Data Availability Statement
The data presented in this study are available in the article.
Acknowledgments
The authors wish to thank Erwan Etienne for his help fin several aspects of the sample preparation.
Conflicts of Interest
The authors declare no conflict of interest.
References
- Sims, C.T.; Hagel, W.C. The Superalloys; Wiley-Interscience: New York, NY, USA, 1972. [Google Scholar]
- Donachie, M.S.; Donachie, S.J. Superalloys: A Technical Guide, 2nd ed.; ASM International: Materials Park, OH, USA, 2002. [Google Scholar]
- Kofstad, P. High Temperature Corrosion; Elsevier Applied Science: London, UK, 1988. [Google Scholar]
- Young, D.J. High Temperature Oxidation and Corrosion of Metals; Elsevier Corrosion Series: Amsterdam, The Netherlands, 2008. [Google Scholar]
- Zhao, K. Prediction of TCP phases in nickel-base superalloys. Adv. Mater. Res. 2014, 941–944, 120–123. [Google Scholar] [CrossRef]
- Semiatin, S.L.; Levkulich, N.C.; Saurber, A.E.; Mahaffey, D.W.; Payton, E.J.; Senkov, O.N. The Kinetics of Precipitate Dissolution in a Nickel-Base Superalloy. Metall. Mater. Trans. A Phys. Metall. Mater. Sci. 2017, 48, 5567–5578. [Google Scholar] [CrossRef]
- Balikci, E.; Altincekic, A. Fine precipitates in nickel base superalloys. J. Mater. Sci. Technol. Res. 2019, 6, 1–8. [Google Scholar]
- Wei, Z.; Zhao, W.; Zhou, J.; Liu, C.; Zheng, Z.; Qu, S.; Tao, C. Microstructure Evolution of K6509 Cobalt-base Superalloy for Over-temperature. Procedia Eng. 2015, 99, 1302–1310. [Google Scholar]
- Gui, W.; Zhang, X.; Zhang, H.; Sun, X.; Zheng, Q. Melting of primary carbides in a cobalt-base superalloy. J. Alloys Compd. 2019, 787, 152–157. [Google Scholar] [CrossRef]
- Liu, C.; Jiang, H.; Dong, J.; Yao, Z.; Niu, Y. Cold deformation mechanism of cobalt-base superalloy GH5605. Mater. Lett. 2020, 267, 127533. [Google Scholar] [CrossRef]
- Ilyas, S.; Srivastava, R.R.; Singh, V.K.; Chi, R.; Kim, H. Recovery of critical metals from spent Li-ion batteries: Sequential leaching, precipitation, and cobalt-nickel separation using Cyphos IL104. Waste Manag. 2022, 154, 175–186. [Google Scholar] [CrossRef] [PubMed]
- Kriese, F.; Lassen, S.; Niemeyer, B. Recovery process for critical metals: Selective adsorption of nickel(II) from cobalt(II) at acidic condition and elevated temperature. Adsorpt. Sci. Technol. 2023, 2023, 5334353. [Google Scholar] [CrossRef]
- Lughofer, C.; Tost, M. Lithium and Cobalt-Opportunities and Problems Regarding Two Critical Raw Materials in the EU. BHM Berg-Und Hüttenmännische Monatshefte 2023, 186, 305–308. [Google Scholar] [CrossRef]
- Bracq, G.; Laurent-Brocq, M.; Perrière, L.; Pirès, R.; Joubert, J.-M.; Guillot, I. The fcc solid solution stability in the Co-Cr-Fe-Mn-Ni multi-component system. Acta Mater. 2017, 128, 327–336. [Google Scholar] [CrossRef]
- Liu, S.F.; Wu, Y.; Wang, H.T.; He, J.Y.; Liu, J.B.; Chen, C.X.; Wang, H.; Liu, X.J.; Lu, Z.P. Stacking fault energy of face-centered-cubic high entropy alloys. Intermetallics 2018, 93, 269–273. [Google Scholar] [CrossRef]
- Wei, D.; Li, X.; Jiang, J.; Heng, W.; Koizumi, Y.; Choi, W.-M.; Lee, B.-J.; Kim, H.S.; Kato, H.; Chiba, A. Novel Co-rich high performance twinning-induced plasticity (TWIP) and transformation-induced plasticity (TRIP) high-entropy alloys. Scr. Mater. 2019, 165, 39–43. [Google Scholar] [CrossRef]
- Choi, W.M.; Jung, S.; Jo, Y.H.; Lee, S.; Lee, B.J. Design of new face-centered cubic high entropy alloys by thermodynamic calculation. Met. Mater. Int. 2017, 23, 839–847. [Google Scholar] [CrossRef]
- Kauffmann, A.; Stüber, M.; Leiste, H.; Ulrich, S.; Schlabach, S.; Szabó, D.V.; Seils, S.; Gorr, B.; Chen, H.; Seifert, H.-J.; et al. Combinatorial exploration of the high entropy alloy system Co-Cr-Fe-Mn-Ni. Surf. Coat. Technol. 2017, 325, 174–180. [Google Scholar] [CrossRef]
- Teramoto, T.; Yamada, K.; Ito, R.; Tanaka, K. Monocrystalline elastic constants and their temperature dependences for equi-atomic Cr-Mn-Fe-Co-Ni high-entropy alloy with the face-centered cubic structure. J. Alloys Compd. 2019, 777, 1313–1318. [Google Scholar] [CrossRef]
- Berthod, P. As-Cast microstructures of high entropy alloys designed to be TaC-strengthened. J. Met. Mater. Res. 2022, 5, 4685. [Google Scholar] [CrossRef]
- Berthod, P. As–cast microstructures of HEA designed to be strengthened by HfC. J. Eng. Sci. Innov. 2022, 7, 305–314. [Google Scholar] [CrossRef]
- Berthod, P. Strengthening against Creep at Elevated Temperature of HEA Alloys of the CoNiFeMnCr Type Using MC-Carbides. In Supplemental Proceedings of the TMS 2023, San Diego, CA, USA, 19–23 March 2023; Springer: Cham, Switzerland, 2023. [Google Scholar]
- Berthod, P. High Temperature Oxidation of CoNiFeMnCr High Entropy Alloys Reinforced by MC-Carbides. In Supplemental Proceedings of the TMS 2023, San Diego, CA, USA, 19–23 March 2023; Springer: Cham, Switzerland, 2023. [Google Scholar]
- Berthod, P. Consequences of the additional presence of MC carbides on the behavior in oxidation at 1000 °C of a cast Cantor high entropy alloy. Mater. Corros. 2023, 74, 1312–1323. [Google Scholar] [CrossRef]
Figure 1.
The as-cast microstructures of the three as-cast CoNiFeMn0.5Cr1.5-based alloys (low magnification electron microscopy images taken in back scattered electrons mode).
Figure 1.
The as-cast microstructures of the three as-cast CoNiFeMn0.5Cr1.5-based alloys (low magnification electron microscopy images taken in back scattered electrons mode).
Figure 2.
The as-cast microstructures of the two MC-containing CoNiFeMn0.5Cr1.5-based alloys (high magnification electron microscopy images taken in back scattered electrons mode).
Figure 2.
The as-cast microstructures of the two MC-containing CoNiFeMn0.5Cr1.5-based alloys (high magnification electron microscopy images taken in back scattered electrons mode).
Figure 3.
(a) The three mass gain curves plotted together versus time for easy comparison between the oxidation kinetics of the three alloys; (b) The three mass gain curves plotted together versus the square root of time for easy comparison between the oxidation kinetics of the three alloys.
Figure 3.
(a) The three mass gain curves plotted together versus time for easy comparison between the oxidation kinetics of the three alloys; (b) The three mass gain curves plotted together versus the square root of time for easy comparison between the oxidation kinetics of the three alloys.
Figure 4.
The isothermal mass gain kinetic of the Hea alloy at 1000 °C (left: versus time, right: versus the square root of time).
Figure 4.
The isothermal mass gain kinetic of the Hea alloy at 1000 °C (left: versus time, right: versus the square root of time).
Figure 5.
The isothermal mass gain kinetic of the Hea/TaC alloy at 1000 °C (left: versus time, right: versus the square root of time).
Figure 5.
The isothermal mass gain kinetic of the Hea/TaC alloy at 1000 °C (left: versus time, right: versus the square root of time).
Figure 6.
The isothermal mass gain kinetic of the Hea/HfC alloy at 1000 °C (left: versus time, right: versus the square root of time).
Figure 6.
The isothermal mass gain kinetic of the Hea/HfC alloy at 1000 °C (left: versus time, right: versus the square root of time).
Figure 7.
Diffractogram resulting from the XRD analysis of the oxidized surface of the Hea alloy.
Figure 7.
Diffractogram resulting from the XRD analysis of the oxidized surface of the Hea alloy.
Figure 8.
Diffractogram resulting from the XRD analysis of the oxidized surface of the Hea/TaC alloy.
Figure 8.
Diffractogram resulting from the XRD analysis of the oxidized surface of the Hea/TaC alloy.
Figure 9.
Diffractogram resulting from the XRD analysis of the oxidized surface of the Hea/HfC alloy.
Figure 9.
Diffractogram resulting from the XRD analysis of the oxidized surface of the Hea/HfC alloy.
Figure 10.
Cross-sectional imaging of the oxide scales and oxidation-affected subsurfaces.
Figure 10.
Cross-sectional imaging of the oxide scales and oxidation-affected subsurfaces.
Figure 11.
Elemental EDS cartography acquired on the oxide scale and the part of the subsurface modified by oxidation in the case of the Hea alloy.
Figure 11.
Elemental EDS cartography acquired on the oxide scale and the part of the subsurface modified by oxidation in the case of the Hea alloy.
Figure 12.
Elemental EDS cartography acquired on the oxide scale and the part of the subsurface modified by oxidation in the case of the Hea/TaC alloy.
Figure 12.
Elemental EDS cartography acquired on the oxide scale and the part of the subsurface modified by oxidation in the case of the Hea/TaC alloy.
Figure 13.
Elemental EDS cartography acquired on the oxide scale and the part of the subsurface modified by oxidation in the case of the Hea/HfC alloy.
Figure 13.
Elemental EDS cartography acquired on the oxide scale and the part of the subsurface modified by oxidation in the case of the Hea/HfC alloy.
Figure 14.
EDS concentration profiles acquired perpendicularly to the oxidation front for the oxidized Hea (top), Hea/TaC (bottom, left), and Hea/HfC (bottom, right) alloys.
Figure 14.
EDS concentration profiles acquired perpendicularly to the oxidation front for the oxidized Hea (top), Hea/TaC (bottom, left), and Hea/HfC (bottom, right) alloys.
Table 1.
The chemical compositions of the three alloys (determined from five ×250 full frame EDS analyses per alloy); weight contents in all elements except carbon (for C: 0.25 wt.% for the Hea/TaC and Hea/HfC alloys); corresponding atomic contents (bottom).
Table 1.
The chemical compositions of the three alloys (determined from five ×250 full frame EDS analyses per alloy); weight contents in all elements except carbon (for C: 0.25 wt.% for the Hea/TaC and Hea/HfC alloys); corresponding atomic contents (bottom).
Hea
Full frame
(wt.%) | Co | Ni | Fe | Mn | Cr | M |
| Average | 20.0 | 20.5 | 19.8 | 8.3 | 31.3 | / |
| Std dev. | 0.1 | 0.3 | 0.18 | 0.5 | 0.4 | / |
Hea/TaC
Full frame
(wt.%) | Co | Ni | Fe | Mn | Cr | Ta * |
| Average | 19.5 | 20.0 | 19.1 | 8.4 | 28.5 | 4.6 |
| Std dev. | 0.2 | 0.5 | 0.3 | 0.2 | 0.3 | 0.2 |
Hea/HfC
Full frame
(wt.%) | Co | Ni | Fe | Mn | Cr | Hf * |
| Average | 19.7 | 20.1 | 19.1 | 8.8 | 27.8 | 4.5 |
| Std dev. | 0.4 | 0.3 | 0.3 | 0.3 | 0.7 | 0.6 |
Table 2.
The atomic chemical compositions of the three alloys corresponding to the weight compositions presented above in
Table 1.
Table 2.
The atomic chemical compositions of the three alloys corresponding to the weight compositions presented above in
Table 1.
| at.% | Co | Ni | Fe | Mn | Cr | C | Ta * | Hf * |
|---|
| Hea | 18.89 | 19.44 | 19.74 | 8.41 | 33.51 | 0 | 0 | 0 |
| Hea/TaC | 18.42 | 18.97 | 19.04 | 8.51 | 30.5 | 1.16 | 1.42 | 0 |
| Hea/HfC | 18.61 | 19.07 | 19.04 | 8.92 | 29.77 | 1.16 | 0 | 1.40 |
Table 3.
Values of the parabolic constants determined from the slopes of the regression lines present in
Figure 3,
Figure 4 and
Figure 5 (dm/dt = Kp/m ⇔ m = (2 × Kp)
1/2 × t
1/2 and, thus, Kp = ½ × slope
2).
Table 3.
Values of the parabolic constants determined from the slopes of the regression lines present in
Figure 3,
Figure 4 and
Figure 5 (dm/dt = Kp/m ⇔ m = (2 × Kp)
1/2 × t
1/2 and, thus, Kp = ½ × slope
2).
Kp
×1012 g2 cm−4 s−1 | Hea Alloy | Hea/TaC Alloy | Hea/HfC Alloy |
| 6 | 16 | 65 |
Table 4.
Minimal Cr and Mn contents close to the oxidation front and the corresponding impoverished depths; for each, “min” is the lowest value, and “MAX” is the highest one.
Table 4.
Minimal Cr and Mn contents close to the oxidation front and the corresponding impoverished depths; for each, “min” is the lowest value, and “MAX” is the highest one.
| Alloy | Cr Mini (wt.%) | Cr–Depleted Depth (µm) | Mn Mini (wt.%) | Mn–Depleted Depth (µm) |
|---|
| Hea | MAX | 25.1 | 62 | 3.4 | 93 |
| min | 22.0 | 45 | 0.7 | 47 |
| Hea/TaC | MAX | 20.3 | 59 | 1.2 | 122 |
| min | 18.0 | 46 | 0.8 | 104 |
| Hea/HfC | MAX | 21.63 | 95 | 1.39 | 175 |
| min | 21.00 | 61 | 0.96 | 107 |
| Disclaimer/Publisher’s Note: The statements, opinions and data contained in all publications are solely those of the individual author(s) and contributor(s) and not of MDPI and/or the editor(s). MDPI and/or the editor(s) disclaim responsibility for any injury to people or property resulting from any ideas, methods, instructions or products referred to in the content. |
© 2023 by the authors. Licensee MDPI, Basel, Switzerland. This article is an open access article distributed under the terms and conditions of the Creative Commons Attribution (CC BY) license (https://creativecommons.org/licenses/by/4.0/).


