Article

Porous Aluminium Oxide Coating for the Development of Spectroscopic Ellipsometry Based Biosensor: Evaluation of Human Serum Albumin Adsorption

by
Vincentas Maciulis
1,
Uldis Malinovskis
2,
Donats Erts
2,
Arunas Ramanavicius
1,3,
Almira Ramanaviciene
3,
Saulius Balevicius
1,
Silvija Juciute
3 and
Ieva Plikusiene
1,3,*
1
Center for Physical Sciences and Technology, LT-10225 Vilnius, Lithuania
2
Institute of Chemical Physics, University of Latvia, LV-1586 Riga, Latvia
3
Faculty of Chemistry and Geoscience, Vilnius University, LT-03225 Vilnius, Lithuania
*
Author to whom correspondence should be addressed.
Submission received: 29 September 2020 / Revised: 19 October 2020 / Accepted: 21 October 2020 / Published: 23 October 2020
(This article belongs to the Special Issue Thin Films and Surface Optics)

Abstract

:
An electrochemically synthesised porous anodic aluminium oxide (pAAO) layer has been analysed by means of spectroscopic ellipsometry. The determined thickness of the formed pAAO layer obtained from spectroscopic ellipsometry measurements and modelling was 322.75 ± 0.12 nm. The radius of the nanopores estimated from SEM images was 39 ± 5 nm and the distance between nanopores was 107 ± 6 nm. The investigation of human serum albumin (HSA) adsorption on the pAAO coating showed that: (i) the protein concentration inside nanopores, depending on exposure time, approximately was from 200 up to 600 times higher than that determined in buffer solution; (ii) the initial phase of the adsorption process is slow (3.23 mg·cm−3·min−1) in comparison with the protein desorption rate (21.2 mg·cm−3·min−1) by means of pAAO layer washing; (iii) conventional washing with PBS solution and deionised water does not completely remove HSA molecules from pAAO pores and, therefore, the HSA concentration inside nanopores after 16 h of washing still remains almost 100 times higher than that present in PBS solution. Thus, due to such binding ability, HSA can be successfully used for the blocking of the remaining free surface, which is applied for the reduction in non-specific binding after the immobilisation of biorecognition molecules on the pAAO surface. It was determined that some desorption of HSA molecules from the pAAO layer occurred during the sensor’s surface washing step; however, HSA concentration inside the nanopores still remained rather high. These results recommend the continued application of pAAO in the development of biosensors.

1. Introduction

The investigation of protein adsorption/desorption to/from various nanoporous materials is an important task due to the ability to use such materials for proteins separation, purification, and in the development of biosensors, which can be applicable for the determination of various analytes that are important in biology, biochemistry, medical diagnostics, pharmacy, or food industry [1]. The ability of large molecules such as proteins to adsorb within nanopores significantly depends on hydrophobicity/hydrophility and pore sizes. As it was shown in some research works [2,3,4,5], the pore size range of such porous materials should be equal or greater than the size of adsorbed protein molecules [6].
Highly sensitive biosensors based on nanomaterial coatings that are dedicated to the determination of specific proteins attract significant attention [7]. Nanoporous coatings are especially important in the development of such biosensors due to the valuable physical and chemical properties of protein-modified nanoporous surfaces [8]; for example, nanoporous anodic aluminium oxide (pAAO) presents exclusive features for the development of various biosensors due to its highly ordered structure, desirable pore geometry, outstanding optical and electrical properties, high mechanical and thermal stability, chemical resistance, the large amount of hydroxyl groups present on its porous surface, large surface-to-volume ratio, and biocompatibility [9,10,11,12]. An additional advantage of pAAO coating is based on the electrochemical anodization procedure, which enables the formation of uniform nanochannels within the Al2O3 matrix [12]. During the last decade, various biosensing platforms based on pAAO coatings were applied in optical and electrochemical biosensors [7,10,13].
Bovine serum albumin (BSA) and human serum albumin (HSA) are proteins, which mostly are used in various bioanalytical systems as “blocking agents” [14,15], which reduce non-specific interactions and increase the selectivity and sensitivity of bioanalytical systems. The main problem related to this kind of modification is possible removal of adsorbed HSA during washing and regeneration of biosensors after each analyte determination step. Therefore, it is highly important to assess how strongly HSA interacts with surfaces applied in the design of bioanalytical systems and how washing procedures influence the stability of the adsorbed HSA layer. As it was shown in some research works, HSA-modified pAAO substrate was used as a sensing layer for the determination of cathepsin B [16].
The method of spectroscopic ellipsometry can be successfully applied for optical biosensing because it is a non-destructive method, measurements do not need any labelling, and light does not affect or destroy the samples [14,15,16,17,18,19]. In addition, high sensitivity can be achieved due to phase shift measurements, particularly if samples are inhomogeneous [17]. As was shown by other authors [16], HSA-modified pAAO substrate was applied as a sensing layer for the designed optical biosensors. In this case, the researchers have used Reflective Interferometric Fourier Transform Spectroscopy (RIFTS), which was suitable for the determination of low protein concentrations. However, according to [18], this method has several drawbacks. The modulation amplitude is somewhat less well fit in part due to the difficulty of obtaining a suitable background spectrum to compensate the variation of light source intensity with wavelength. Additionally, significant differences in the predicted and observed modulation depth of the reflectivity appear due to the effects of surface roughness on the reflectivity of the aluminium foil substrate. This is a result of the RIFTS method, which uses only one s-polarisation measurement that in the case of the porous layer, produces partial transformation of s-polarised light to p-polarisation, resulting in discrepancies of reflected light amplitude. This disadvantage can be avoided using spectroscopic ellipsometry (SE), as this method enables the determination of relative values of reflected electric field amplitudes Ψ and phase differences Δ, which makes it possible to perform simultaneous measurement of both s and p polarisation and consequently, to obtain better agreement between the experiment and modelling [19]. The SE method was successfully used for the investigation of HSA binding by porous Si [19]. Meanwhile, the possibilities to analyse the HSA adsorption/desorption to/from pAAO coating using the SE method were not demonstrated yet. Therefore, this kind of evaluation has been determined as the main aim of the present research.

2. Materials and Methods

Phosphate-buffered saline (PBS) solution was prepared using PBS tablets (0.14 M NaCl, 0.0027 M KCl, and 0.01 M phosphate buffer pH 7.4). All salts were purchased from Sigma-Aldrich (St. Louis, MO, USA). Human serum albumin (HSA) was purchased from ABCAM (Cambridge, UK). The HSA concentration in 0.01 M PBS, pH 7.4, used for all experiments, was 1 mg/mL.
The porous anodic aluminium oxide (pAAO) layer was formed on high purity (99.999%, 100 mm × 100 mm × 0.32 mm, Good Fellow, Lille, France) aluminium substrate, using a standard two step anodization protocol [20,21,22]. The aluminium substrate was cut into 10 mm × 18 mm size pieces, degreased, and electrochemically polished in an ice cold perchloric acid–ethanol mixture (1 part 60% HClO4; 4 parts 96% C2H5OH) at 15 V. Then, the electrochemically polished aluminium substrate was anodized for 2 h in 0.3 M oxalic acid electrolyte at a constant 40 V anodization potential. The obtained pAAO layer was removed using a chromic–orthophosphoric acid mixture (4% H2CrO4; 11% H3PO4) at 70 °C. The removal of the pAAO coating creates a pattern of concaves on the surface of the aluminium substrate. This patterned aluminium substrate was anodized again to create a more uniform pAAO coating. pAAO with ~300 nm thickness was synthesised during the 80 s lasting second anodization step under the same conditions as was performed during the first anodization step. After the second anodization step, pores of oxide were cleaned and widened by immersion into 5% orthophosphoric acid solution for 1 min at room temperature, washed with deionised water, and then, dried in the air.
Ellipsometric measurements were performed using a J.A. Woollam M2000X spectroscopic ellipsometer (Lincoln, NE, USA) with a rotating compensator and an angle of incidence was 70°. All spectra were recorded in a 200–1000 nm wavelength range. Appropriate optical models for characterisation of optical properties of all layers were performed using Complete EASE software (version 5.08gcs) from J.A. Woollam (Lincoln, NE, USA).
In this work, two samples were analysed: pAAO and Al2O3. The pAAO substrate was used as a sensing surface for non-specific HSA adsorption to nanopores. Ellipsometric data of Al2O3 were simulated using “Complete EASE” software in order to reveal the differences in optical properties between pAAO and Al2O3. Before incubation of the pAAO substrate in the HSA-containing solution, the optical properties of pAAO in air were determined by spectroscopic ellipsometry. After this, the same substrate was immersed into PBS solution for 5 min, and then, incubated in the HSA-containing solution for 1, 2, and 3 h periods. Immediately after an incubation lasting 3 h, the pAAO coating was removed from the solution and “washed” with PBS for 15 min. After each pAAO immersion in HSA solution and washing step, ellipsometric parameters Ψ(λ) and Δ(λ) were registered. Optical models were constructed in order to calculate the thickness of pAAO and refractive index dispersion for the effective pAAO layers and refractive index inside nanopores.

3. Results

In order to evaluate the differences of the sensing substrates as Al2O3 and pAAO, scanning electron microscope images and ellipsometric study (measurements and simulations) were performed. SEM images of pAAO were used for the first approximation of the thickness and porosity. Then, ellipsometric measurements of pAAO/air, pAAO/HSA(1 h incub.), pAAO/HSA(2 h incub.), pAAO/HSA(3 h incub. + 15 min wash), and data simulation for Al2O3 and Al2O3/HSA were performed in order to compare the spectral shift for non-structured (Al2O3) and nanostructured (pAAO) substrates, which were used as sensing layers for HSA protein adsorption.

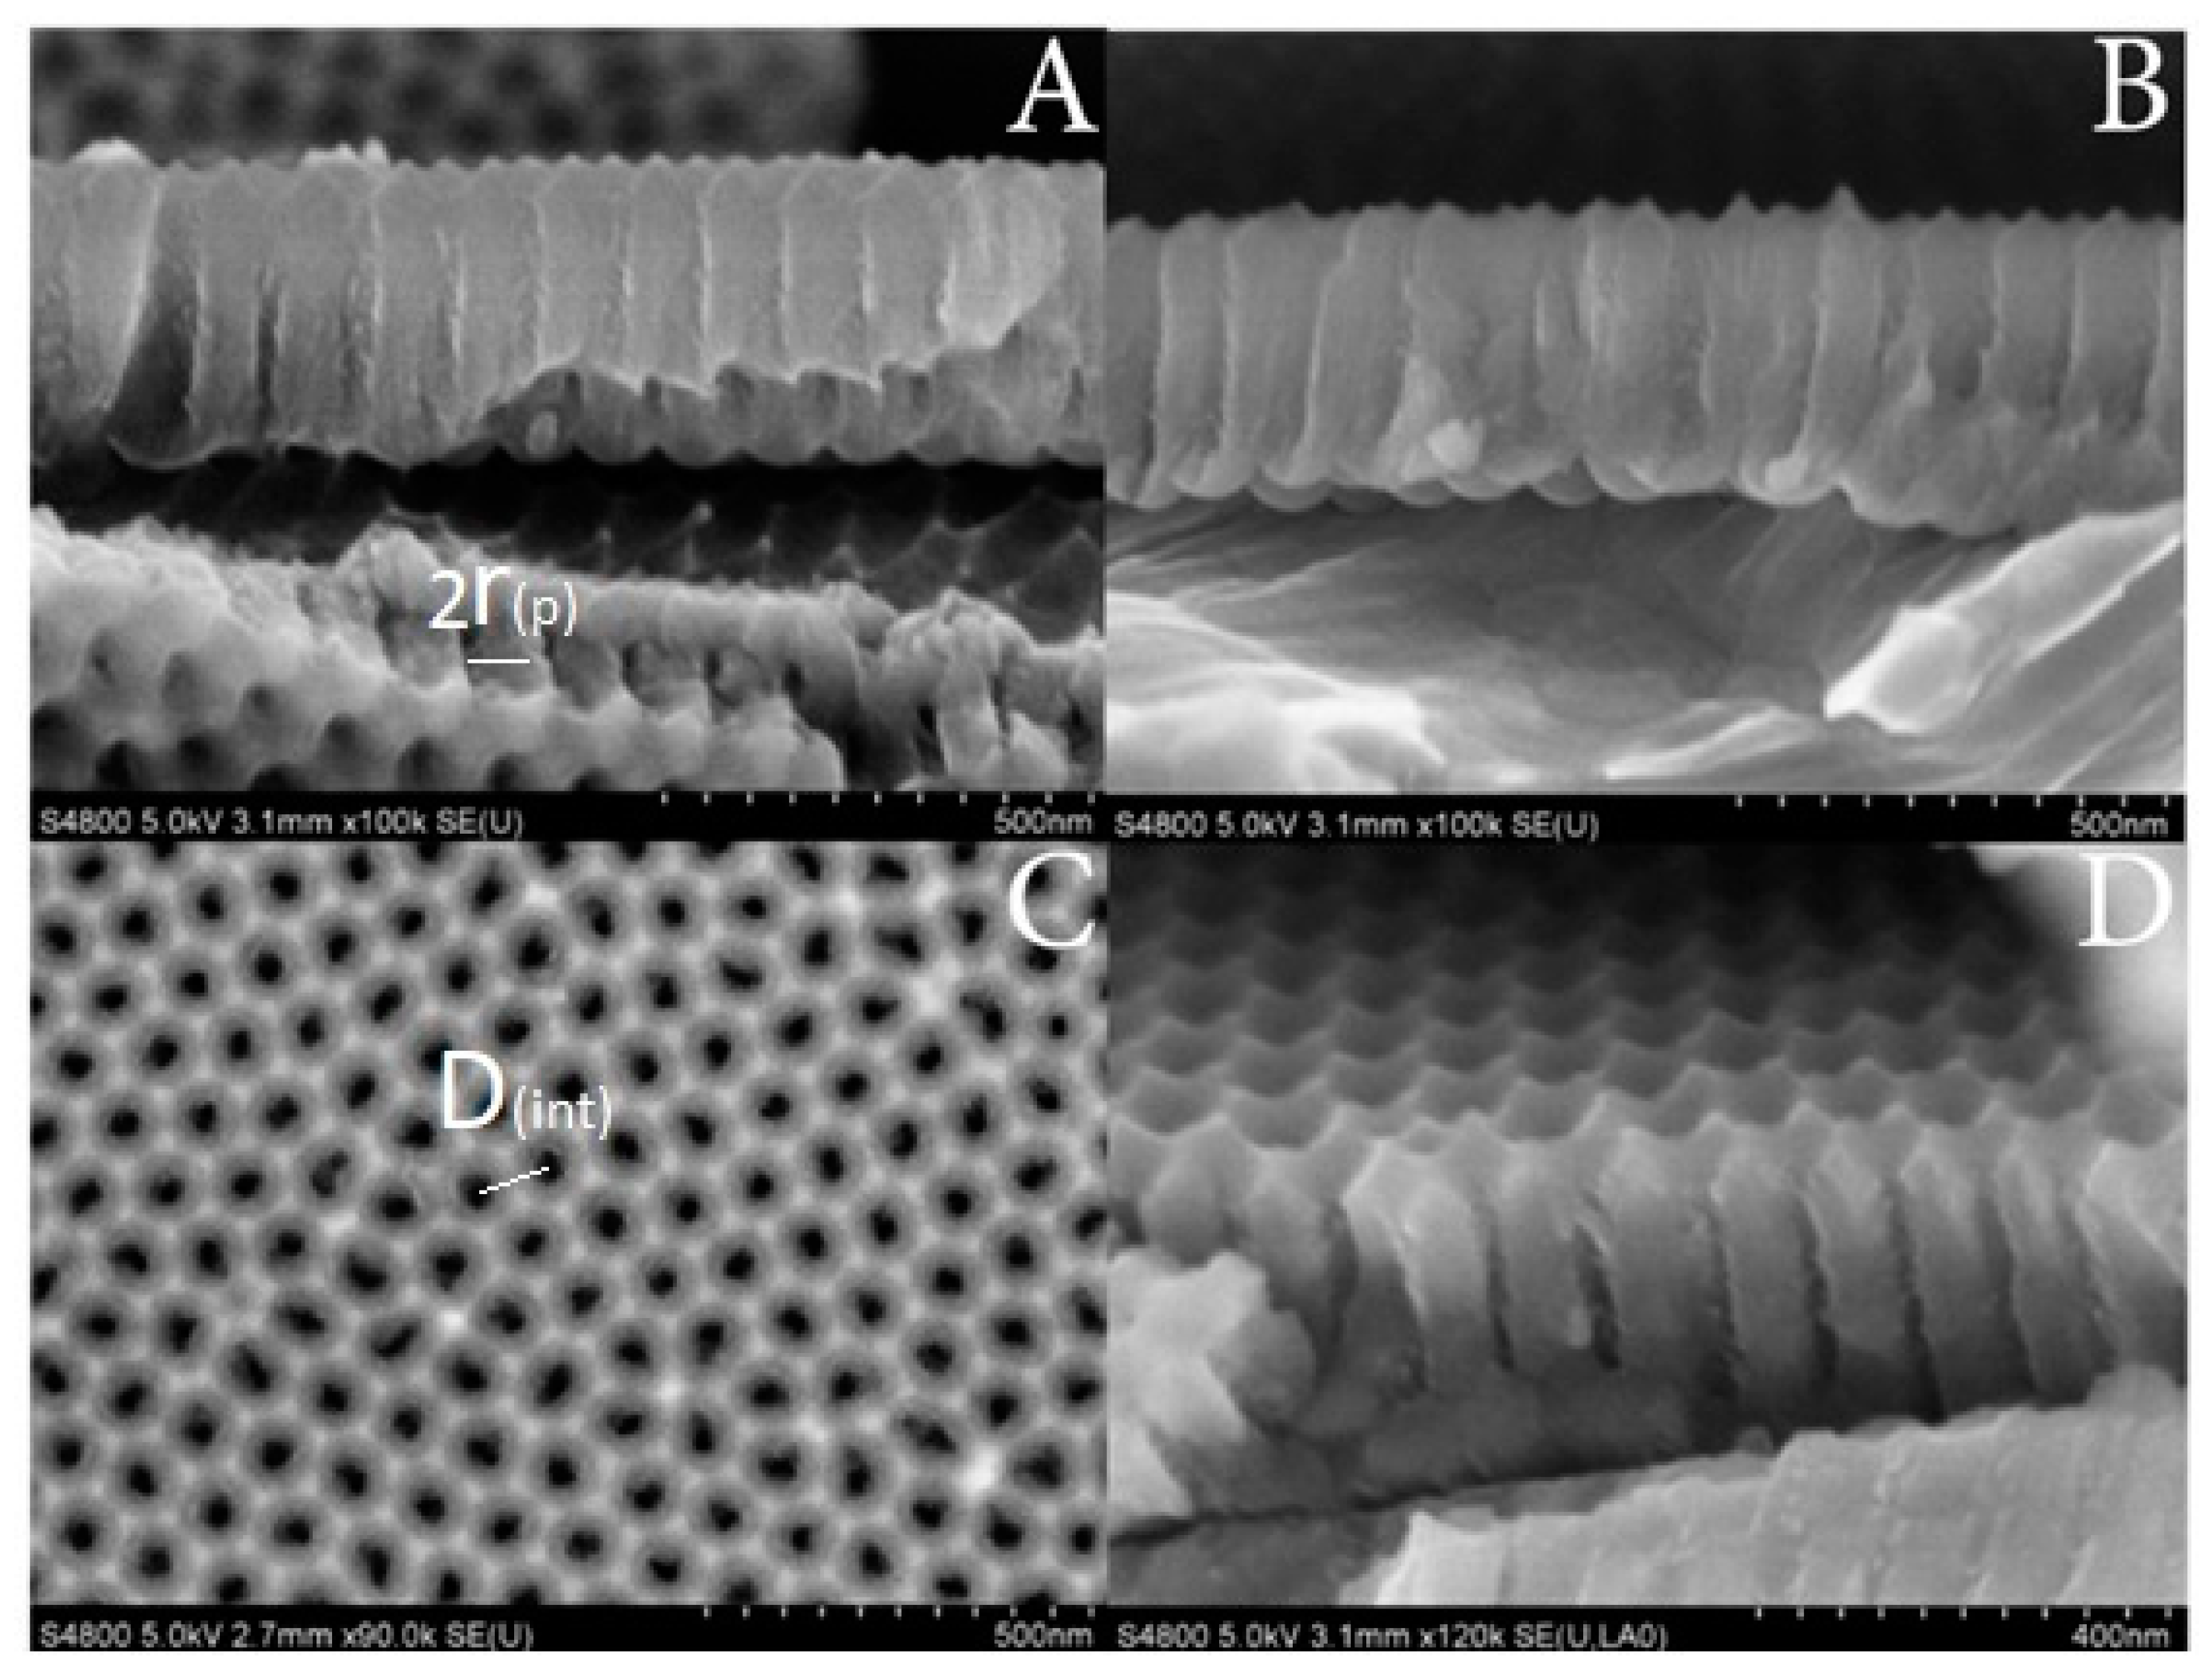
3.1. SEM Measurements

The morphology of pAAO was investigated using a scanning electron microscope (SEM). As can be seen from Figure 1A,B, the obtained substrate thickness (including the intermediate Al/Al2O3 layer) was of 339 ± 10 nm. Pore radius (rp) and distance between pores (Dint) were estimated using SEM micrographs presented in Figure 1A,C, considering that pore diameter represents a larger (less intensive) spot in Figure 1C and the width of the trench visible in the cut-off of the layer (see bottom of Figure 1A). It was determined that rp ≈ 39 ± 5 nm and Dint ≈ 107 ± 6 nm. The porosity (P) of the pAAO layer was evaluated using the formula for the hexagonal structure of pores displacement [23].
P = 2 π 3 × ( r p D int ) 2 × 100 %
Using this formula, it was calculated that in this case, P was about 51% ± 10%.

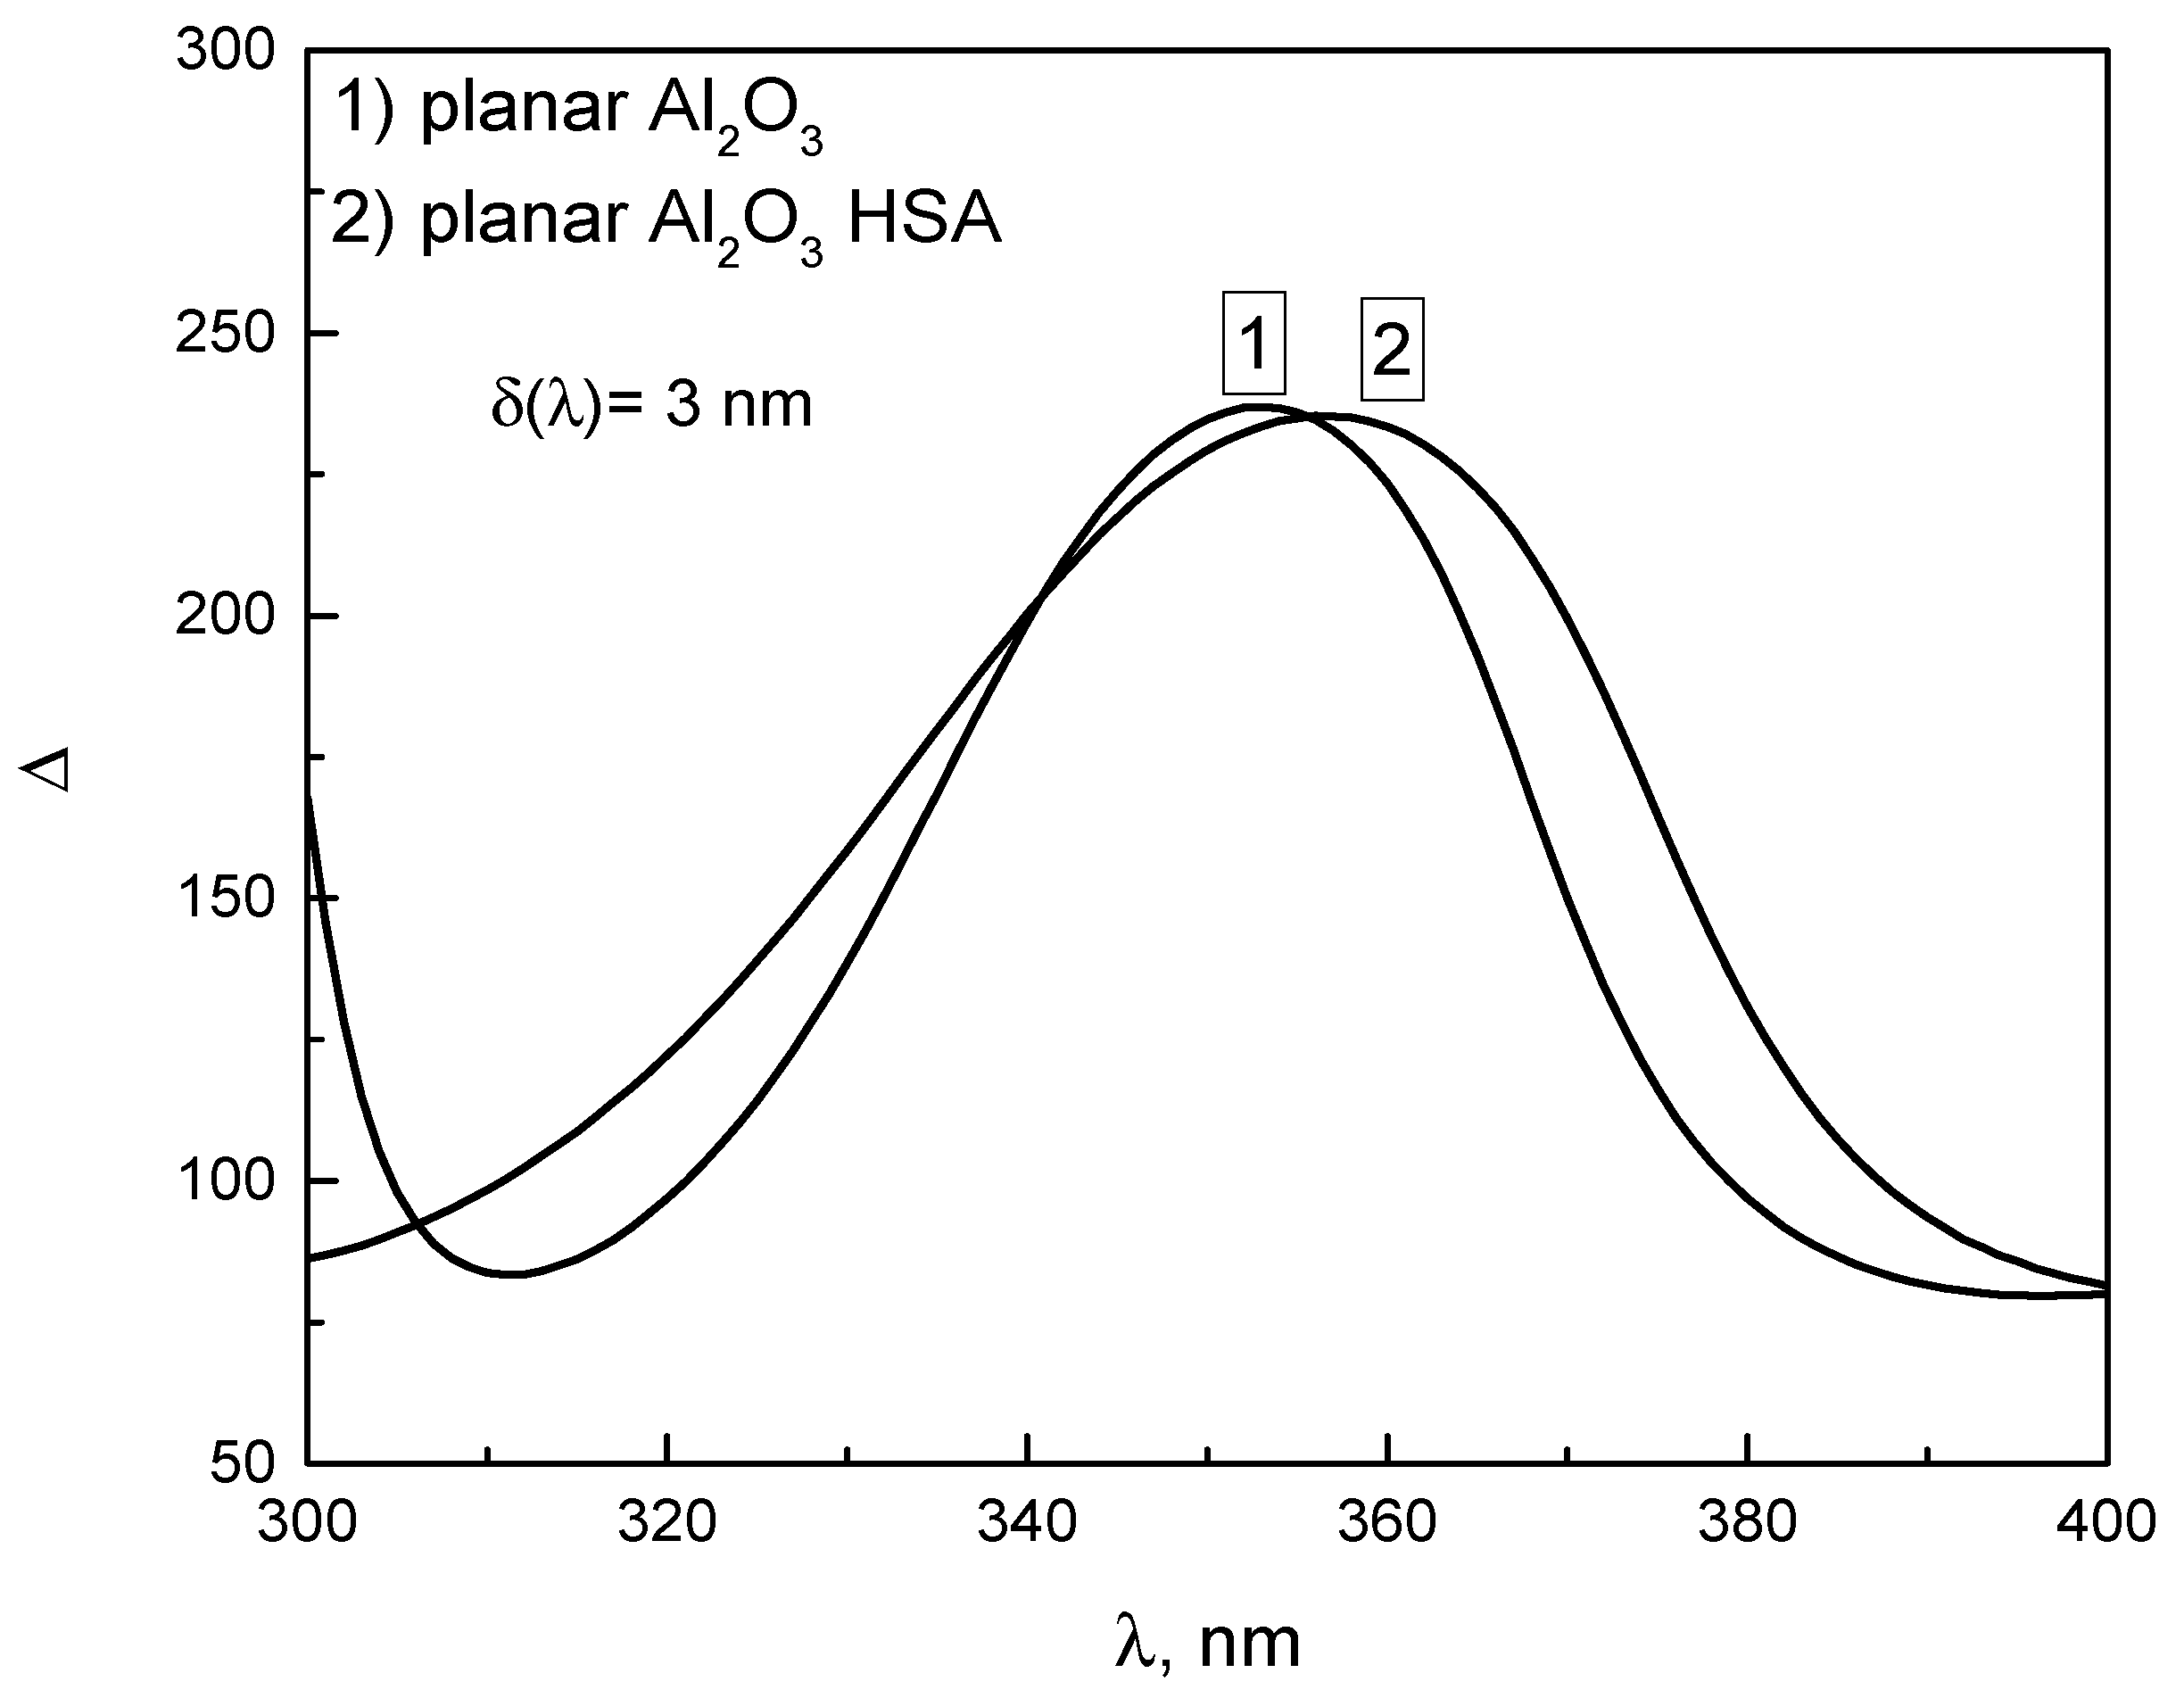
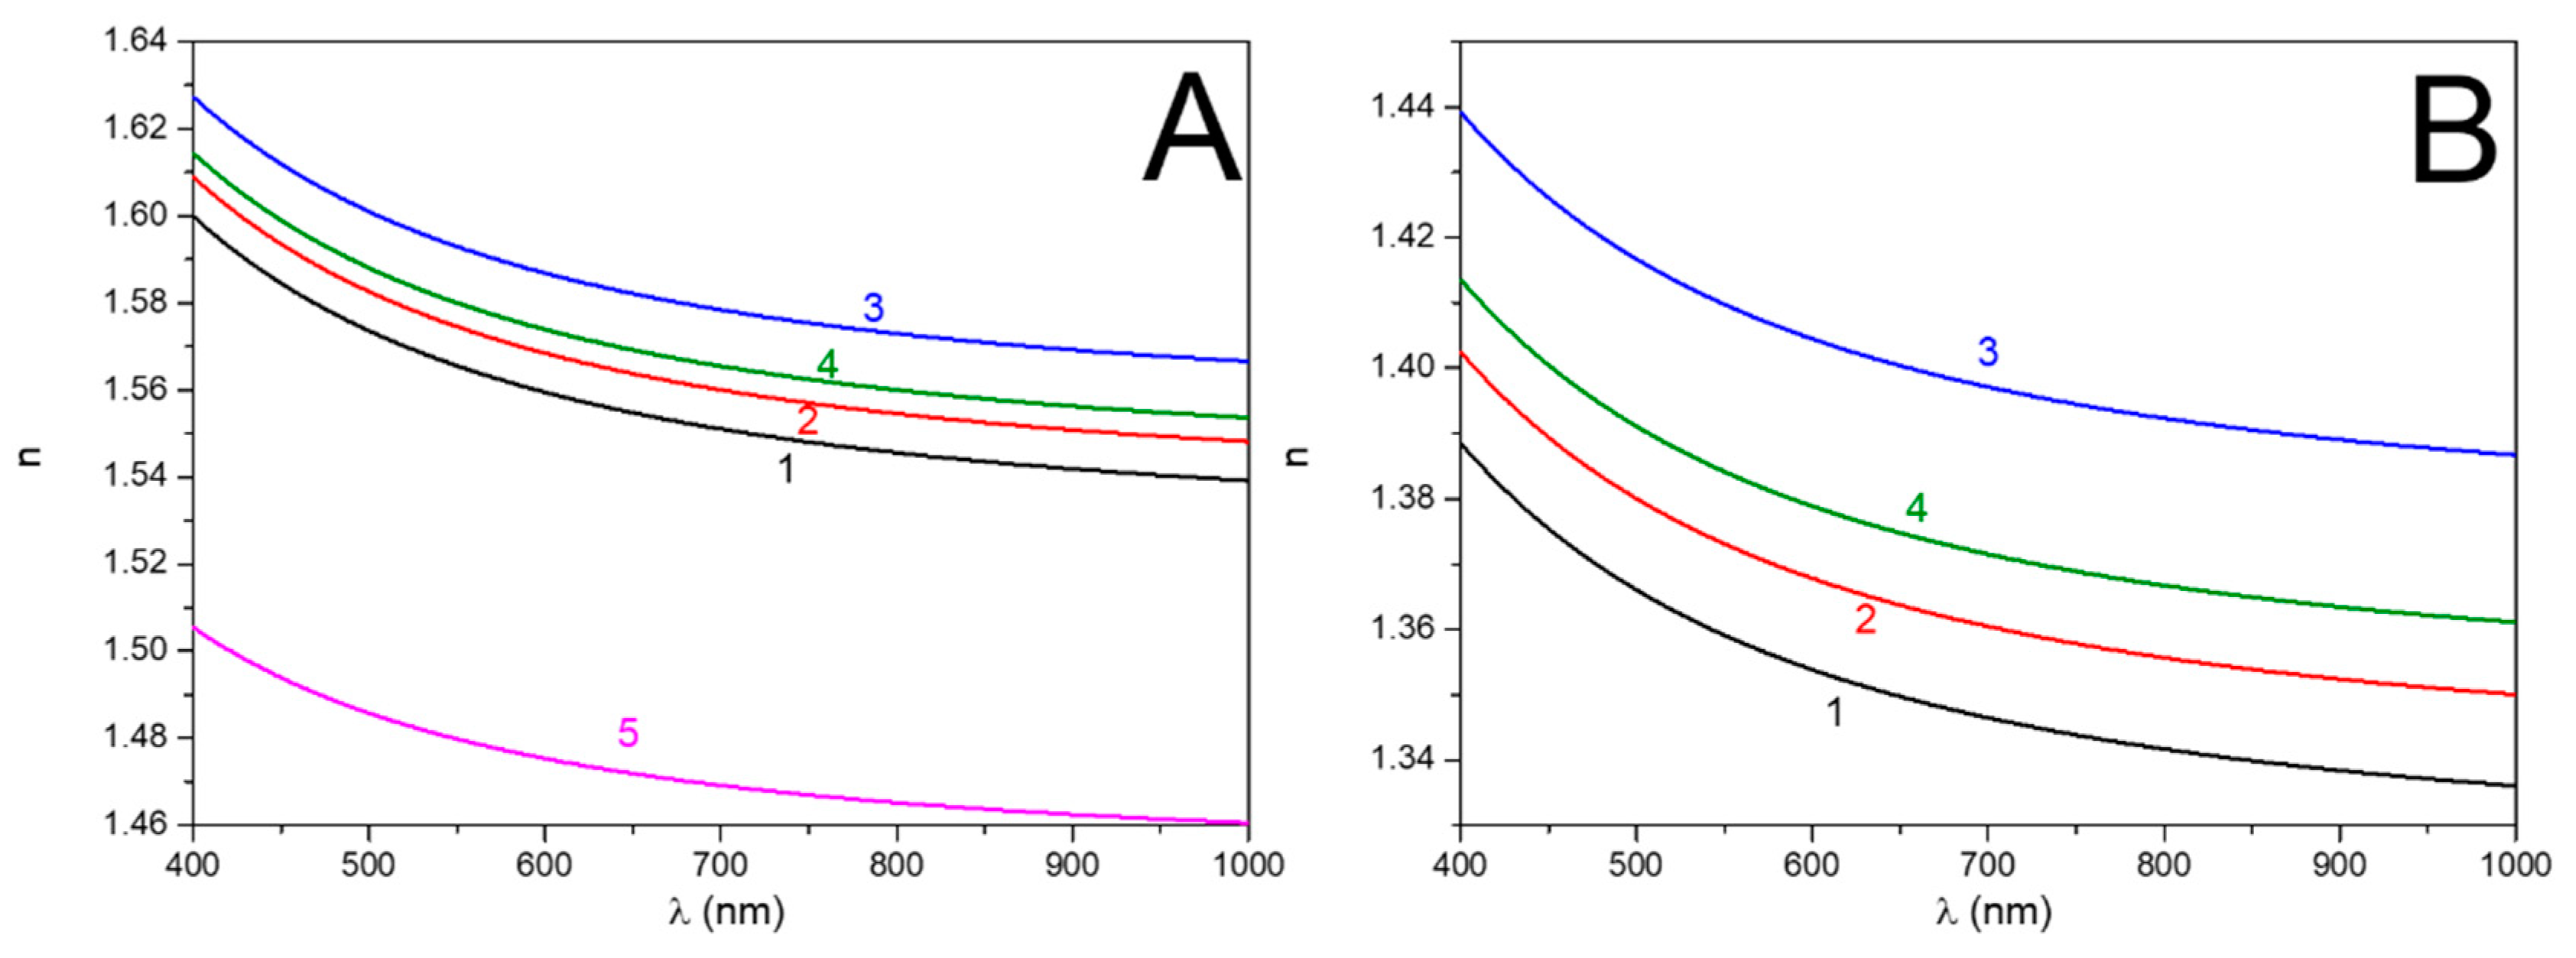
3.2. Simulation of Non-Structured Al2O3 Optical Properties

A comparison of the optical properties for the two different samples, pAAO and Al2O3, was performed. Values of ellipsometric parameters vs. wavelength were measured for the pAAO substrate before and after immersion into PBS with 1 mg/mL of HSA in order to determine the wavelength shift of the ellipsometric parameters when a higher amount of proteins adsorbs to the nanopores. For the same reason, simulation of the Al2O3 ellipsometric parameters spectra before and after the formation of the HSA layer was performed. As was noticed in the introduction part, the ellipsometric parameter Δ is more sensitive when it is used for the analysis of non-homogeneous samples. Due to this, in this research, only ellipsometric parameter Δ vs. λ is presented. These data are zoomed to a spectral range from 300 to 400 nm because in this range, the spectral shift was clearly noticeable. The simulated structure consisted of aluminium substrate, an intermix layer of 13.5 nm, and a 322.75 nm Al2O3 layer (Figure 2, curve 1). Then, an additional HSA layer with the thickness of 8 nm (the average dimension of a HSA molecule [24,25]) was simulated on top of Al2O3 (Figure 2, curve 2 A2O3/HSA). The simulation of ellipsometric parameter Δ(λ) of the Al2O3 layer and Al2O3/HSA is presented in Figure 2 in order to reveal the effect of the nanopores on proteins adsorption. Thus, such simulated substrate was considered as a closely packed and planar Al2O3 layer. As can be seen from Figure 2, the Al2O3 peak of the ellipsometric parameter Δ is located at λ = 353 nm. In the case of HSA adsorption on the Al2O3 layer, there was a shift of 3 nm towards longer wavelengths and a peak was observed at λ = 356 nm. During the simulations, aluminium and Al2O3 refractive index values were taken from the database of the software. In this case, the HSA layer was simulated as a Cauchy function, which is typically used in ellipsometry for dielectric materials as proteins:
n ( λ ) = A + B λ 2 + C λ 4 +
where Cauchy coefficients were applied as A = 1.575; B = 0.01; C = 9.8 × 10⁻⁵; n(λ) refractive index dependence on wavelength.

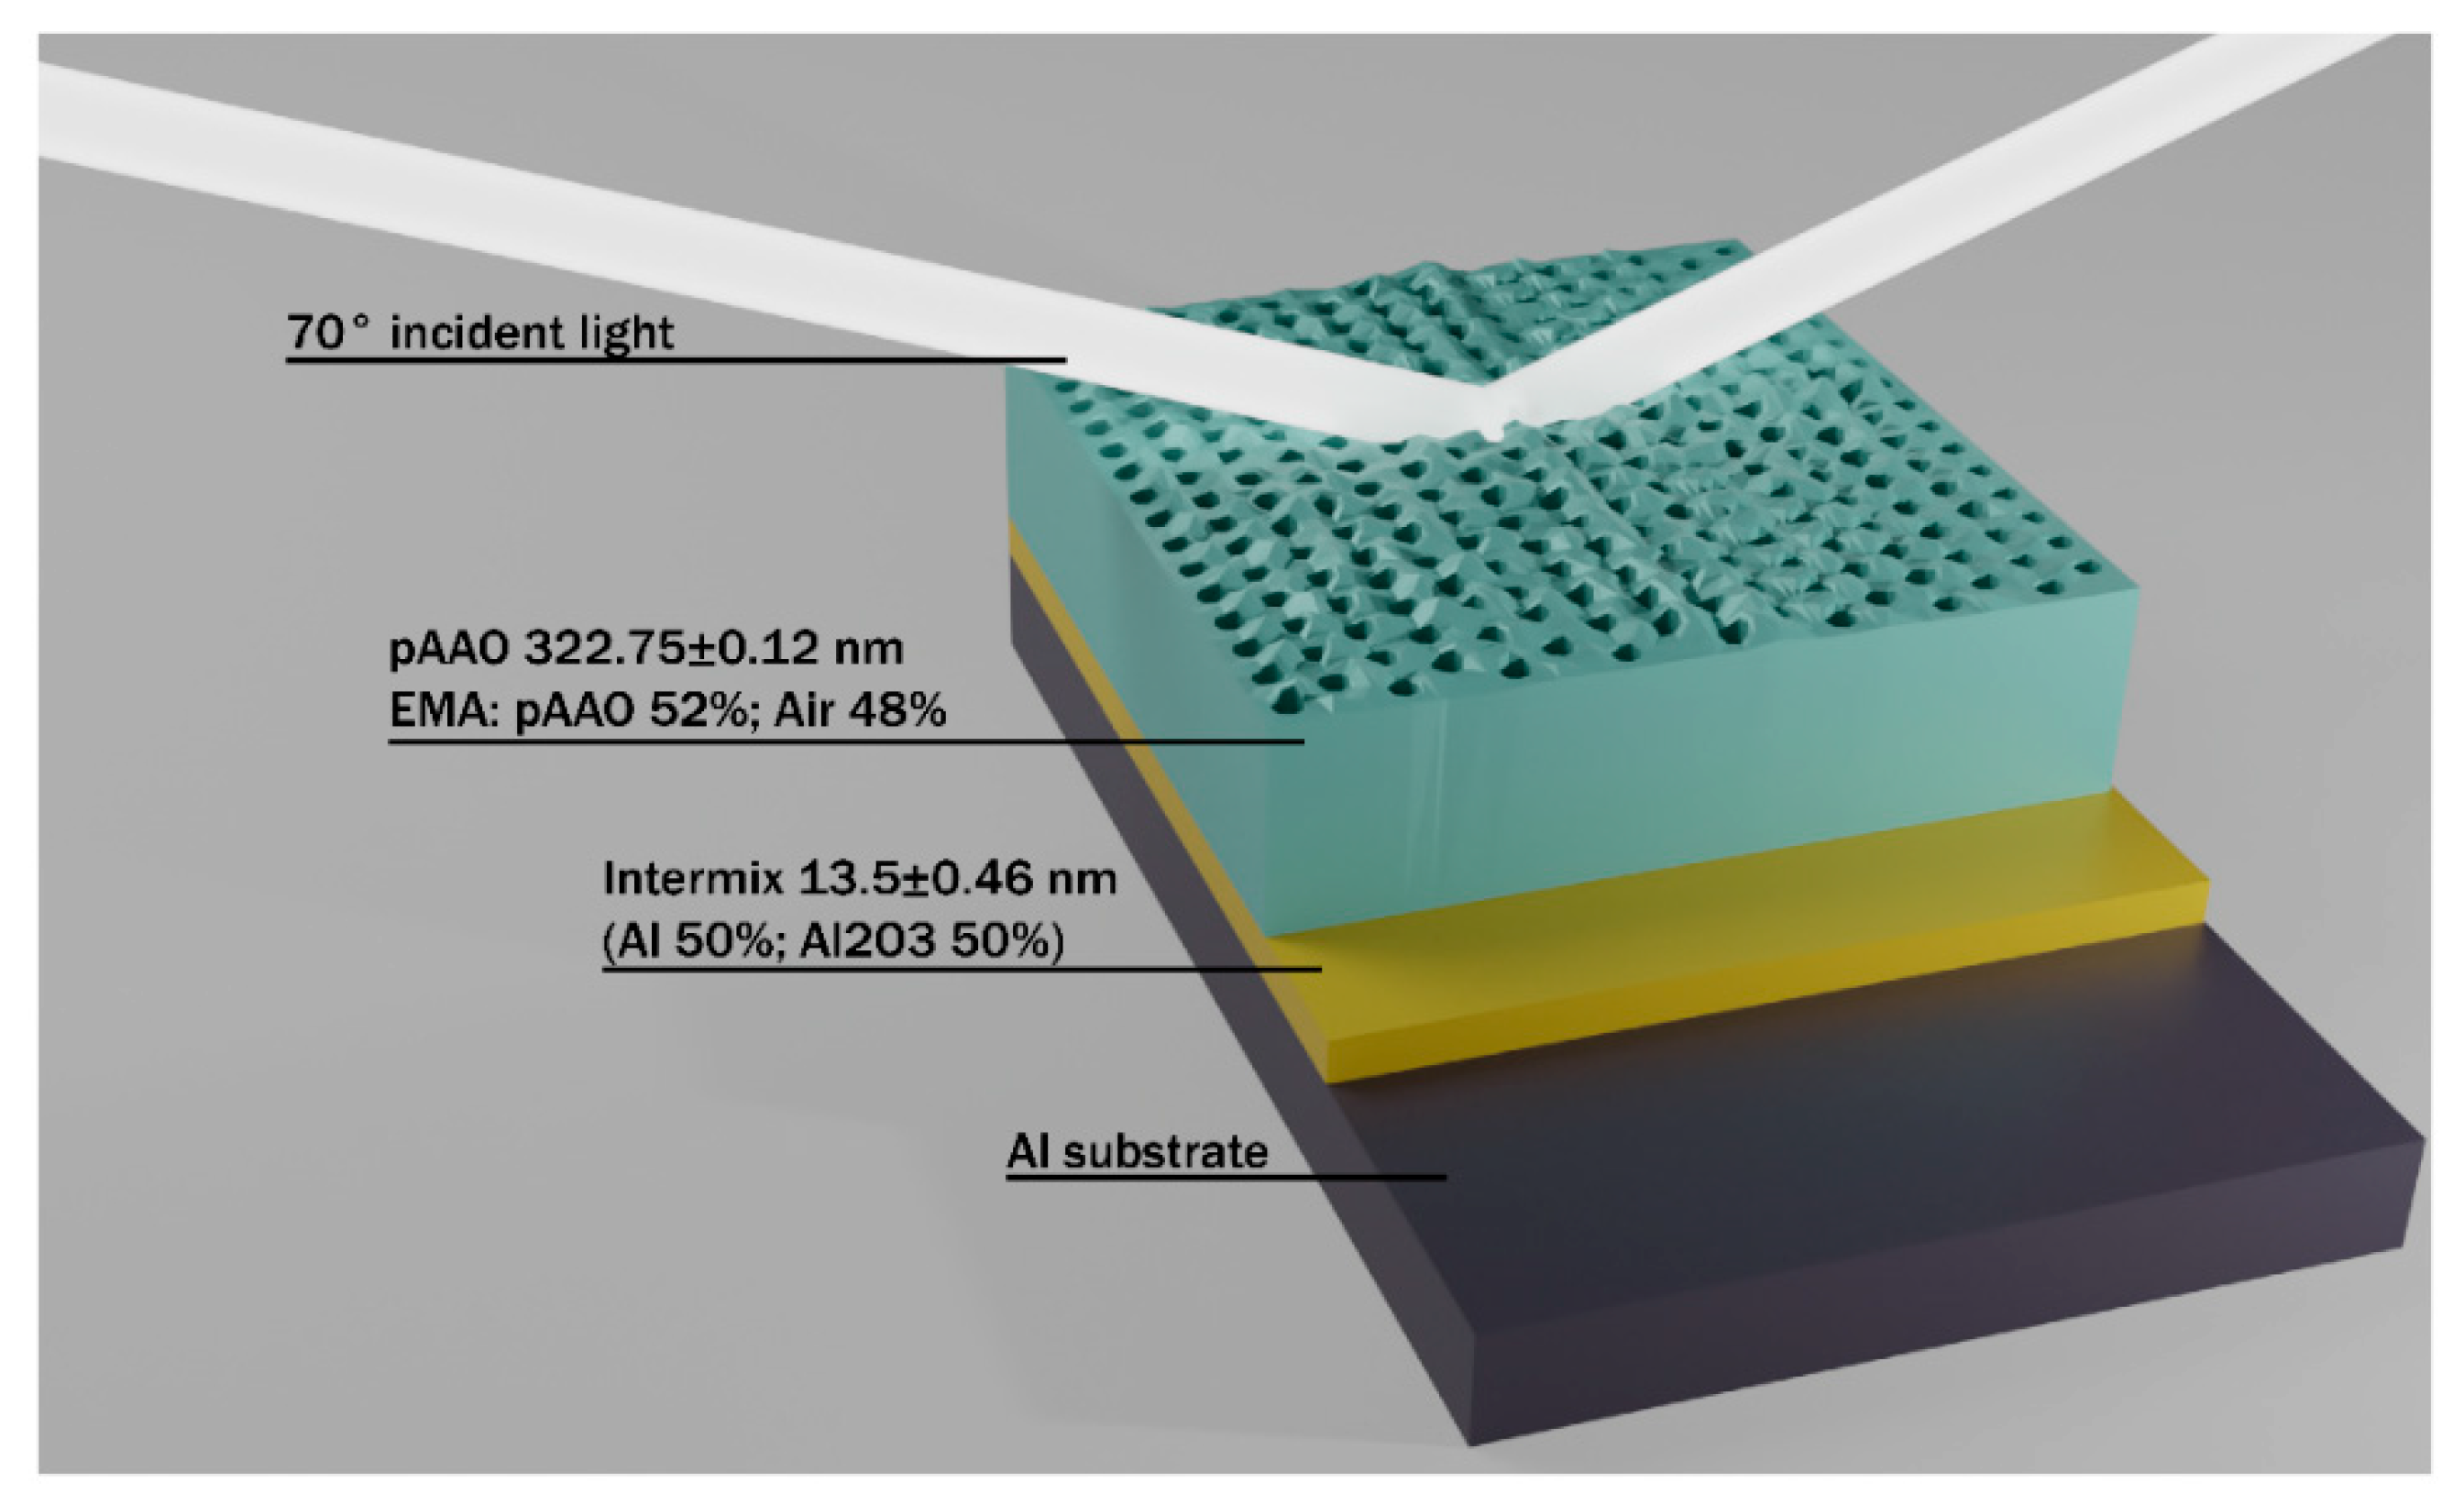
3.3. Optical Properties of pAAO

A schematic representation of pAAO formed on aluminium substrate is presented in Figure 3. pAAO layer thickness calculated using the optical model applied for the analysis of ellipsometric measurements was estimated to be of 322.75 ± 0.12 nm and surface roughness was 39.4 ± 3 nm. Bruggeman effective media approximation (EMA) was used in order to calculate the porosity of pAAO, as was described by other authors [26]. The effective media layer (EMA) of pAAO was modelled as a layer consisting of two materials: Al2O3 and air (52% and 48%, respectively). EMA was used in order to include the porosity of pAAO. Starting values of thickness and surface roughness, which were applied for fitting, were taken from SEM images. During the regression analysis, thickness and surface roughness were treated as free fitting values and the refractive index of Al2O3 as a fixed value.
The intermix layer of 13.5 ± 0.46 nm in the optical model was applied to simplify the approximation of the intermediate layer between aluminium and pAAO, and this includes the Al2O3 “barrier layer”, which is formed on aluminium substrate. In the optical model, it was estimated that this “barrier layer” consisted of 50% Al2O3 and 50% aluminium. The presence of this “barrier layer” in the design of the optical model significantly improved the calculation quality and reduced the mean square error (MSE) of the calculated values. MSE in this case was in the range of 31–34. Optical models were designed to calculate the refractive index dispersion of the pAAO sample before and after the incubation of the pAAO substrate in the HSA-containing solution. The same pAAO substrate was investigated in the following way: firstly, the optical properties of the pAAO coating in air were registered. Then, the sample was immersed into 1 mg/mL of HSA-containing solution in PBS, pH 7.4, for 1 h. After that, the spectra of both ellipsometric parameters (Δ and Ψ) were recorded; then, the same sample again was immersed into the HSA solution for 2 h and again, the spectra of ellipsometric parameters were recorded. The same procedure was performed after 3 h immersion followed by 15 min washing in PBS solution. It was determined that when pAAO layer nanopores were filled with air, the determined ratio of pAAO layer composition according to calculations using the EMA-based optical model was 52% pAAO and 48% air.

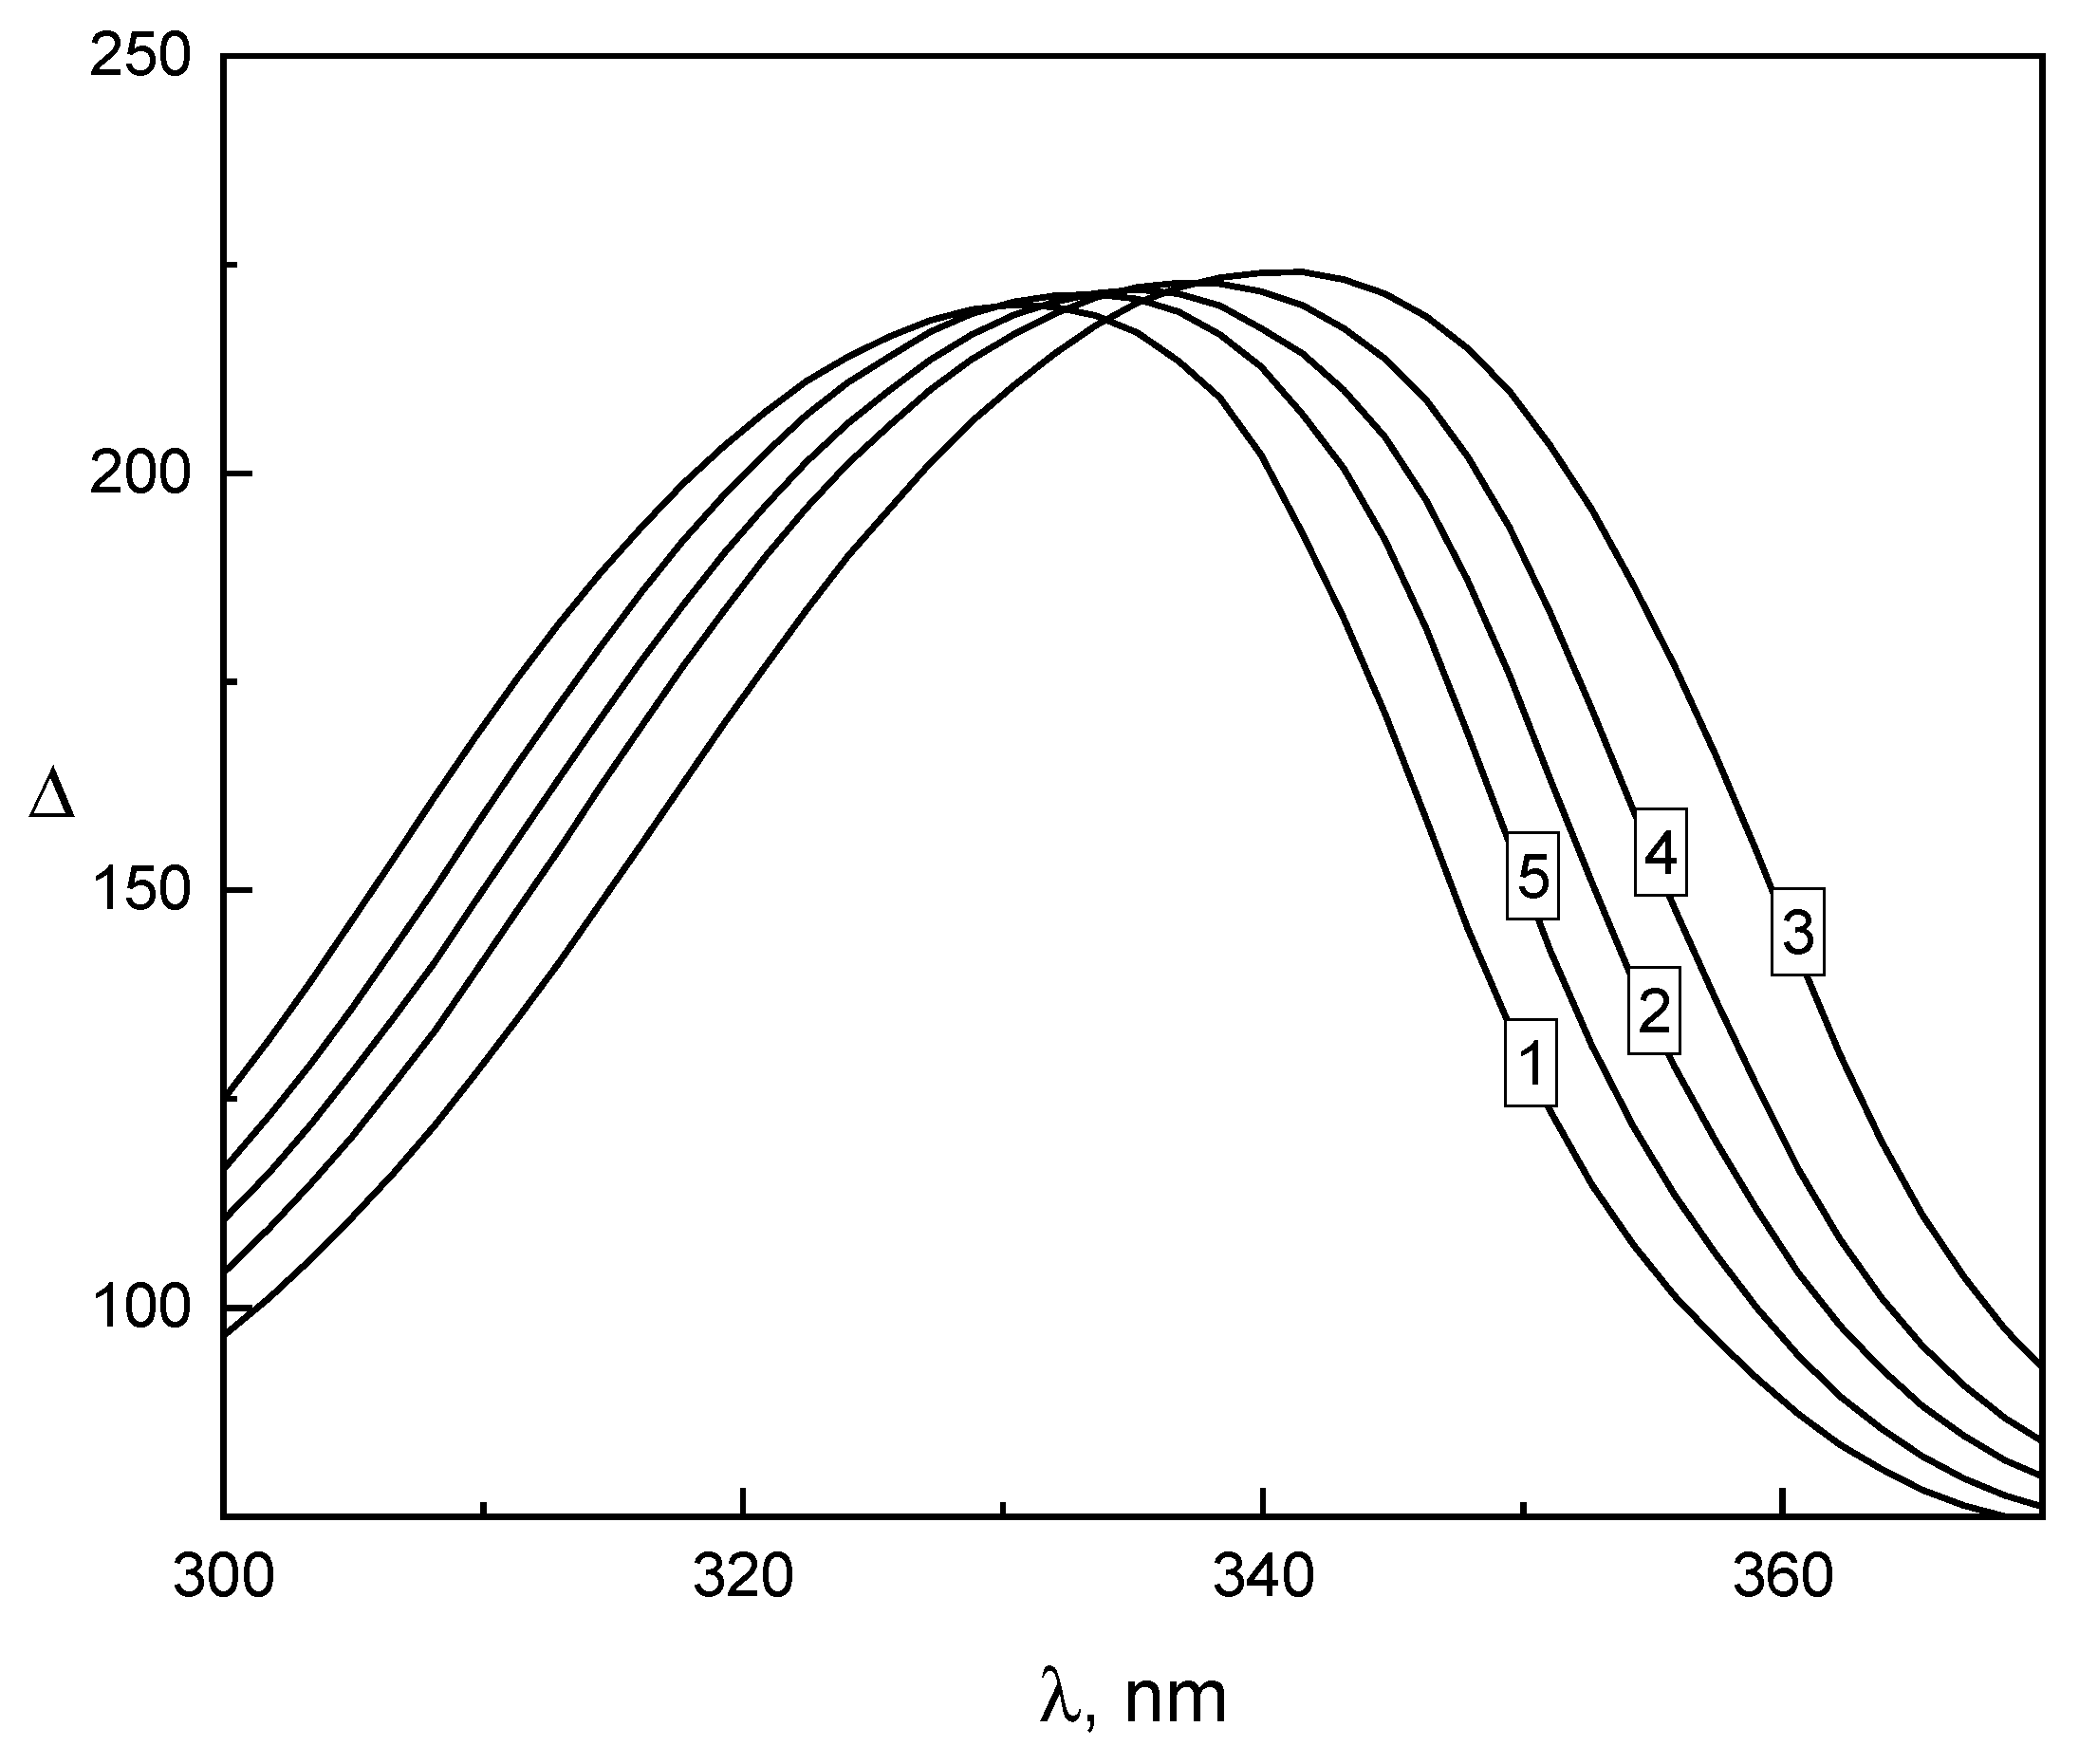
3.4. HSA Adsorption to pAAO

HSA adsorption to pAAO was evaluated by assessment of “Δ spectral shift” and regression analysis, which are presented in Figure 4 and Figure 5. Here, we present only the spectra of ellipsometric parameter Δ zoomed from λ = 300 to λ = 370 nm, because in this range, a clear shift of the Δ peak is observed. The determined shift of peaks’ wavelength is compared to shifts of the peaks in simulated spectra for the Al2O3 layer, presented in Figure 2. Starting with pAAO/air, the peak of ellipsometric parameter Δ is observed at λ = 330 nm (Figure 4, curve 1). After 1 h of incubation in solution containing 1 mg/mL of HSA, ellipsometric parameter Δ shifted towards longer wavelengths, resulting in the appearance of the peak at λ = 335 nm (Figure 4, curve 2); after 2 h of incubation in solution containing 1 mg/mL of HSA, the peak shifted even more significantly and appeared at λ = 341 nm (Figure 4, curve 3). After 3 h incubation in HSA solution and 15 min washing with PBS solution, a shift of ellipsometric parameter Δ to a shorter wavelength was observed at λ = 336 nm and it indicated that part of the HSA molecules had desorbed from the pAAO surface (Figure 4, curve 4). Finally, after washing with deionised water lasting 30 min, the peak position shifted even more to shorter wavelengths and appeared at λ = 333 nm (Figure 4, curve 5).
Results obtained after the washing of HSA-modified pAAO substrate with PBS and deionised water show that the interaction of HSA protein with pAAO substrate is reversible. Additionally, this process depends on the composition of the selected washing solution. It was determined that pAAO/HSA structure more sensitive to deionized water because more HSA molecules were removed from the substrate by washing using deionized water, than by 0.01 M PBS, pH 7.4. Despite that, the desorption of HSA proteins from the surface of pAAO takes a long time due to the inclusion of proteins within nanopores in the Al2O3 layer.
In order to assess changes in refractive index for the measured sample when using the EMA-based optical model for the pAAO layer, regression analysis was performed after all modification steps, namely after the formation of pAAO/air, pAAO/HSA(1 h incub.), pAAO/HSA(2 h incub.), and pAAO/HSA(3 h incub. + 15 min wash) structures. During the regression analysis, such parameters as thickness, roughness, and intermix layer thickness, which were applied in the EMA-based optical layer, were fixed values, which were calculated by modelling of the pAAO/air structure. Cauchy function parameters A, B, and the ratio of HSA and Al2O3 in the EMA-based optical model were applied as free fitting parameters. Regression analysis resulted in a dispersion of refractive index, which is presented in Figure 5A,B for all evaluated structures: pAAO/air, pAAO/HSA(1 h incub.), pAAO/HSA(2 h incub.), pAAO/HSA(3 h incub. + 15 min wash), and pAAO/PBS. Figure 5A shows the dispersion of effective refractive index for the pAAO layer, when this layer was modelled using the EMA-based optical model for the structures mentioned here: (i) pAAO in PBS while estimating that pAAO pores are filled with PBS (Figure 5A, curve 1); (ii) pAAO incubated in PBS containing HSA for 1 h (HSA(1 h incub.)) (Figure 5A, curve 2); (iii) pAAO incubated in PBS containing HSA for 2 h (HSA(2 h incub.)) (Figure 5A, curve 3); (iv) pAAO incubated in air (Figure 5A, curve 4); (v) pAAO incubated in PBS containing HSA for 3 h followed by an additional 15 min washing procedure (HSA(3 h incub. + 15 min wash)) (Figure 5A, curve 5). Figure 5B shows refractive index dispersion inside nanopores of pAAO when pores were filled with: (i) PBS (Figure 5B, curve 1), (ii) HSA after the incubation of pAAO in PBS containing HSA for 1 h (Figure 5B, curve 2), (iii) after the incubation of pAAO in PBS containing HSA for 2 h, (iv) after the incubation of pAAO in PBS containing HSA for 3 h and followed by a 15 min wash with PBS. In order to visualise differences between refractive indexes, the values at λ = 600 nm wavelength, which were taken for calculations, are presented in Table 1. Refractive indexes values at λ = 600 nm wavelength were taken in order to simplify the evaluation; these values are at the end of the abrupt part of dependence of the refractive index vs. wavelength.
In order to evaluate the HSA concentration inside the pores (CHSA), we used the well-known fact that the refractive index of protein in water solution is the linear function of protein concentration. For this reason, the CHSA can be calculated by means of the formula obtained after a simple transformation of mathematical expression used for refractive index calculation at a known concentration [27]:
CHSA = (npnPBS)/In
Here, nPBS is a refractive index of PBS, which is equal to 1.333; In is refractive index increment (the derivative dn/dc) according to the protein’s concentration [28]. For the calculation of CHSA, we used In = 0.18 mL/g that was determined at λ= 632.2 nm.
The results presented in Table 1 show the following important features of HSA adsorption on/within pAAO coating: (a) the protein concentration inside nanopores, depending on exposure time, is approximately 200–600 times higher than that in buffer solution; (b) the beginning of the absorption process is slow (3.23 mg·cm−3·min−1 ) in comparison with the desorption of proteins (21.2 mg·cm−3·min−1) during the washing of the pAAO/HSA structure; (c) the conventional washing procedure does not enable the desorption of all adsorbed HSA molecules.

4. Conclusions

A standard anodization protocol was successfully applied for the formation of pAAO coating of 322.75 ± 0.12 nm thickness. SEM images illustrate that the pores of pAAO are displaced in a regular hexagonal structure. The radius of the nanopores estimated using SEM micrographs was 39 ± 5 nm and the distance between nanopores was 107 ± 6 nm. These dimensions fit well the size of the HSA proteins molecules, as the average diameter of HSA is in the range of 8 nm. In this research, the evaluation of non-specific and reversible adsorption of HSA onto the pAAO layer was performed. Ellipsometric measurements showed that a part of HSA remained inside of the pAAO pores after washing with PBS solution and deionised water. Therefore, during the application of pAAO-based optical sensors, it should be taken into account that some of the HSA, which is rather fast adsorbed on/within pAAO, might desorb during washing of the sensor. However, it was determined that conventional washing with PBS solution does not fully desorb all the HSA molecules from pAAO pores and even after washing with deionised water lasting 16 h, HSA concentration inside nanopores still remains approximately 100 times higher than that in PBS solution. Hence, pores of pAAO operate as “traps” for HSA proteins, cumulating molecules of this material. However, HSA should be carefully used for the blocking of the remaining free surface of signal transducers based on pAAO when significant reduction in non-specific binding is expected.

Author Contributions

Conceptualization, I.P., V.M., A.R. (Almira Ramanaviciene), and S.B.; methodology, I.P. and V.M.; software, I.P. and V.M.; validation, V.M., U.M., and I.P.; formal analysis, V.M., U.M., and I.P.; investigation, V.M., U.M., I.P., and S.J.; resources, A.R. (Almira Ramanaviciene) and D.E.; data curation V.M., U.M., and I.P.; writing—original draft preparation, V.M., I.P., A.R. (Almira Ramanaviciene), and A.R. (Arunas Ramanavicius); writing—review and editing, V.M., I.P., U.M., A.R. (Almira Ramanaviciene), and A.R. (Arunas Ramanavicius); visualization, V.M., I.P., and S.J.; supervision, A.R. (Almira Ramanaviciene), A.R. (Arunas Ramanavicius), D.E., and S.B.; project administration, A.R. (Almira Ramanaviciene) and D.E.; funding acquisition, A.R. (Almira Ramanaviciene) and D.E. All authors have read and agreed to the published version of the manuscript.

Funding

This work is part of a project that has received funding from the European Union’s Horizon 2020 research and innovation programme under grant agreement No. 778157 CanBioSe.

Conflicts of Interest

The authors declare no conflict of interest.

References

  1. Puziy, A.M.; Poddubnaya, O.I.; Derylo-Marczewska, A.; Marczewski, A.W.; Blachnio, M.; Tsyba, M.M.; Sapsay, V.I.; Klymchuk, D.O. Kinetics of protein adsorption by nanoporous carbons with different pore size. Adsorption 2016, 22, 541–552. [Google Scholar] [CrossRef]
  2. Vinu, A.; Miyahara, M.; Ariga, K. Biomaterial immobilization in nanoporous carbon molecular sieves: Influence of solution pH, pore volume, and pore diameter. J. Phys. Chem. B 2005, 109, 6436–6441. [Google Scholar] [CrossRef] [PubMed]
  3. Vinu, A.; Miyahara, M.; Sivamurugan, V.; Mori, T.; Ariga, K. Large pore cage type mesoporous carbon, carbon nanocage: A superior adsorbent for biomaterials. J. Mater. Chem. 2005, 15, 5122–5127. [Google Scholar] [CrossRef]
  4. Vinu, A.; Miyahara, M.; Mori, T.; Ariga, K. Carbon nanocage: A large-pore cage-type mesoporous carbon material as an adsorbent for biomolecules. J. Porous Mater. 2006, 13, 379–383. [Google Scholar] [CrossRef]
  5. Yushin, G.; Hoffman, E.N.; Barsoum, M.W.; Gogotsi, Y.; Howell, C.A.; Sandeman, S.R.; Phillips, G.J.; Lloyd, A.W.; Mikhalovsky, S.V. Mesoporous carbide-derived carbon with porosity tuned for efficient adsorption of cytokines. Biomaterials 2006, 27, 5755–5762. [Google Scholar] [CrossRef]
  6. Katiyar, A.; Ji, L.; Smirniotis, P.; Pinto, N.G. Protein adsorption on the mesoporous molecular sieve silicate SBA-15: Effects of pH and pore size. J. Chromatogr. A 2005, 1069, 119–126. [Google Scholar] [CrossRef]
  7. Santos, A.; Kumeria, T.; Losic, D. Nanoporous anodic aluminum oxide for chemical sensing and biosensors. TrAC Trends Anal. Chem. 2013, 44, 25–38. [Google Scholar] [CrossRef]
  8. Dai, Z.; Ju, H. Bioanalysis based on nanoporous materials. TrAC Trends Anal. Chem. 2012, 39, 149–162. [Google Scholar] [CrossRef]
  9. Md Jani, A.M.; Losic, D.; Voelcker, N.H. Nanoporous anodic aluminium oxide: Advances in surface engineering and emerging applications. Prog. Mater. Sci. 2013, 58, 636–704. [Google Scholar] [CrossRef]
  10. Rajeev, G.; Prieto Simon, B.; Marsal, L.F.; Voelcker, N.H. Advances in nanoporous anodic alumina-based biosensors to detect biomarkers of clinical significance: A Review. Adv. Healthc. Mater. 2018, 7, 1–18. [Google Scholar] [CrossRef]
  11. Reta, N.; Saint, C.P.; Michelmore, A.; Prieto-Simon, B.; Voelcker, N.H. Nanostructured electrochemical biosensors for label-free detection of water- and food-borne pathogens. ACS Appl. Mater. Interfaces 2018, 10, 6055–6072. [Google Scholar] [CrossRef] [PubMed]
  12. Rajeev, G.; Melville, E.; Cowin, A.J.; Prieto-Simon, B.; Voelcker, N.H. Porous alumina membrane-based electrochemical biosensor for protein biomarker detection in chronic wounds. Front. Chem. 2020, 8, 1–11. [Google Scholar] [CrossRef] [PubMed] [Green Version]
  13. Krismastuti, F.S.H.; Bayat, H.; Voelcker, N.H.; Schönherr, H. Real time monitoring of layer-by-layer polyelectrolyte deposition and bacterial enzyme detection in nanoporous anodized aluminum oxide. Anal. Chem. 2015, 87, 3856–3863. [Google Scholar] [CrossRef] [PubMed]
  14. Pacioni, N.L.; Poblete, H. Human serum albumin as protecting agent of silver nanoparticles: Role of the protein conformation and amine groups in the nanoparticle stabilization. J. Nanoparticle Res. 2013, 15. [Google Scholar] [CrossRef]
  15. Vogt, R.V.; Phillips, D.L.; Omar Henderson, L.; Whitfield, W.; Spierto, F.W. Quantitative differences among various proteins as blocking agents for ELISA microtiter plates. J. Immunol. Methods 1987, 101, 43–50. [Google Scholar] [CrossRef]
  16. Amouzadeh Tabrizi, M.; Ferré-Borrull, J.; Marsal, L.F. An optical biosensor for the determination of cathepsin B as a cancer-associated enzyme using nanoporous anodic alumina modified with human serum albumin-thionine. Microchim. Acta 2020, 187. [Google Scholar] [CrossRef]
  17. Tikhonravov, A.V.; Trubetskov, M.K.; Masetti, E.; Krasilnikova, A.V.; Kochikov, I.V. Sensitivity of the ellipsometric angles Psi and Delta to the surface inhomogeneity. Adv. Opt. Interf. Coat. 1999, 3738, 173–182. [Google Scholar] [CrossRef]
  18. Pan, S.; Rothberg, L.J. Interferometric sensing of biomolecular binding using nanoporous aluminum oxide templates. Nano Lett. 2003, 3, 811–814. [Google Scholar] [CrossRef]
  19. Hans, A. Ellipsometry on thin organic layers of biological interest: Characterization and applications. Thin Solid Films 2000, 377–378, 48–56. [Google Scholar] [CrossRef]
  20. Masuda, H.; Satoh, M. Fabrication of gold nanodot array using anodic porous alumina as an evaporation mask. Jpn. J. Appl. Phys. Part 2 Lett. 1996, 35. [Google Scholar] [CrossRef]
  21. Malinovskis, U.; Poplausks, R.; Apsite, I.; Meija, R.; Prikulis, J.; Lombardi, F.; Erts, D. Ultrathin anodic aluminum oxide membranes for production of dense sub-20 nm nanoparticle arrays. J. Phys. Chem. C 2014, 118, 8685–8690. [Google Scholar] [CrossRef]
  22. Kunakova, G.; Meija, R.; Andzane, J.; Malinovskis, U.; Petersons, G.; Baitimirova, M.; Bechelany, M.; Bauch, T.; Lombardi, F.; Erts, D. Surface structure promoted high-yield growth and magnetotransport properties of Bi2Se3 nanoribbons. Sci. Rep. 2019, 9. [Google Scholar] [CrossRef] [PubMed] [Green Version]
  23. Nielsch, K.; Choi, J.; Schwirn, K.; Wehrspohn, R.B. Self-ordering regimes of porous alumina: The 10% porosity rule. Nano Lett. 2002, 2, 677–680. [Google Scholar] [CrossRef]
  24. Min He, X.; Carter, D.C. Atomic structure and chemistry of human serum albumin. Nature 1992, 358, 209–215. [Google Scholar] [CrossRef] [Green Version]
  25. Sugio, S.; Kashima, A.; Mochizuki, S.; Noda, M. Crystal structure of human serum albumin at 2.5 Å resolution. Protein Eng. 1999, 12, 439–446. [Google Scholar] [CrossRef]
  26. Thompson, D.W.; Snyder, P.G.; Castro, L.; Yan, L.; Kaipa, P.; Woollam, J.A. Optical characterization of porous alumina from vacuum ultraviolet to midinfrared. J. Appl. Phys. 2005, 97. [Google Scholar] [CrossRef] [Green Version]
  27. Ball, V.; Ramsden, J.J. Buffer dependence of refractive index increments. Biopolymers 1998, 46, 489–492. [Google Scholar] [CrossRef]
  28. Vörös, J. The density and refractive index of adsorbing protein layers. Biophys. J. 2004, 87, 553–561. [Google Scholar] [CrossRef] [Green Version]
Figure 1. SEM micrographs of porous anodic aluminium oxide (pAAO): (A,B)—cross sections; (C)—top view; (D)—tilted view.
Coatings 10 01018 g001
Figure 2. Simulated data of ellipsometric parameter Δ for: (1) Al2O3 (1st peak) at 353 nm and (2) Al2O3/HSA (2nd peak) at 356 nm.
Coatings 10 01018 g002
Figure 3. Schematic representation of pAAO formed on aluminium substrate.
Coatings 10 01018 g003
Figure 4. Ellipsometric parameter Δ vs. λ peak position at different time instances: (1) pAAO/air at λ = 330 nm; (2) pAAO/HSA(1 h incub.) at λ = 335 nm; (3) pAAO/HSA(2 h incub.) at λ = 341 nm; (4) pAAO/HSA(3 h incub. + 15 min wash) at λ = 336 nm; (5) pAAO after washing with deionised water at λ = 333 nm.
Coatings 10 01018 g004
Figure 5. Refractive index dispersion of pAAO/X (A): (1) pAAO/PBS, (2) pAAO/HSA(1 h incub.), (3) pAAO/HSA(2 h incub.), (4) pAAO/HSA(3 h incub. + 15 min wash), and (5) pAAO/air; (B) Refractive index dispersion inside nanoporous layer filled with: (1) PBS, (2) HSA after one 1 h incubation, (3) HSA after 2 h incubation, and (4) HSA after 3 h incubation followed by 15 min wash.
Coatings 10 01018 g005
Table 1. Values of refractive indexes of pAAO layer and trapped HSA concentration calculated inside nanopores.
Incubation Time (tex, h)01230.25 Washing24 Washing
Effective refractive index nEMA1.4861.56781.58651.59851.57331.5594
Refractive index of HSA solution in pores np1 (void)1.36791.40421.431.37881.3538
Concentration of HSA in pores CHSA (mg/mL)0194395572254115
tex—pAAO substrate incubation time in 1 mg/mL HSA solution in PBS.
Publisher’s Note: MDPI stays neutral with regard to jurisdictional claims in published maps and institutional affiliations.

