
Environmental Impact of Wood Modification


1
JCH Industrial Ecology Ltd., Bangor, Gwynedd LL57 1LJ, UK
2
Norwegian Institute of Bioeconomy Research (NIBIO), P.O. Box 115, NO-1431 Ås, Norway
3
Department of Bioproducts and Biosystems, Aalto University, Vuorimiehentie 1, FI-002150 Espoo, Finland
4
Abodo Wood Ltd., Mangere, Auckland 2022, New Zealand
*
Author to whom correspondence should be addressed.
Coatings 2021, 11(3), 366; https://0-doi-org.brum.beds.ac.uk/10.3390/coatings11030366
Submission received: 15 February 2021
/
Revised: 4 March 2021
/
Accepted: 20 March 2021
/
Published: 23 March 2021
(This article belongs to the Special Issue Wood Modification: Characterization, Modelling and Applications)
Abstract
:The modification of wood involves extra processing over and above what is associated with un-modified material and this will involve an associated environmental impact. There is now a body of information on this due to the presence in the public domain of a number of environmental product declarations (EPDs). Using these data, it is possible to determine what the extra impact associated with the modification is. The process of modification results in a life extension of the product, which has implications regarding the storage of sequestered atmospheric carbon in the harvested wood products (HWP) materials’ pool and also extended maintenance cycles (e.g., longer periods between applying coatings). Furthermore, the life extension benefits imparted by wood modification need to be compared with the use of other technologies, such as conventional wood preservatives. This paper analysed the published data from a number of sources (peer-reviewed literature, published EPDs, databases) to compare the impacts associated with different modification technologies. The effect of life extension was examined by modelling the carbon flow dynamics of the HWP pool and determining the effect of different life extension scenarios. Finally, the paper examined the impact of different coating periods, and the extensions thereof, imparted by the use of different modified wood substrates.
1. Introduction
The production and use of materials in construction has an associated environmental burden and requires the use of energy in order to transform them from the state in which they exist in nature, transport them and process them to create products which have the desired functionality. Life cycle assessment is the methodology that is used to determine the environmental impacts, but it must be used appropriately, especially when making comparative assertions.
The use of wood in construction can potentially provide environmental benefits compared with the use of non-renewable materials. These potential benefits arise from:
- The reduced environmental footprint associated with the production of timber-based building materials when compared with non-renewable alternatives
- The use of timber in construction as a store of atmospheric carbon during the lifetime of the timber product
- The recovery of the inherent solar energy stored in the timber material, which can be recovered at the end of life and be substituted for the use of fossil-derived energy sources
Greater environmental benefits are realised by increasing the longevity of timber products in construction. This is because over the lifetime of a building there is a reduced requirement to replace components, and there may also be an associated reduction in maintenance requirements. In order to make appropriate choices for using materials in construction, it is necessary to evaluate the whole life of a product from creation to final disposal, which requires knowledge not only of the environmental impacts associated with the manufacture of a product but of all parts of the lifecycle, including installation, maintenance, potential replacement and disposal, or re-use at the end of the product lifetime. Although the cradle to factory gate part of the lifecycle can be determined with some confidence, complete lifecycle analyses can be extremely difficult to make accurately and often rely on assumptions regarding service life of the product and the building in which it is installed.
One approach to examining the potential benefits provided by wood modification is to employ the concept of “environmental payback period” [1]. In economics, the payback period is the amount of time required in order to recover the cost of an investment. The same idea can be used when making an investment in a new energy technology, where the initial investment in embodied energy to create the new infrastructure can be recovered over a period of time by the energy savings which are achieved by employing the new technology. It is also possible to apply this idea to environmental burdens, such as global warming potential (GWP). For example, the impacts associated with the production of a parquet flooring made from a siloxane-based modified wood were compared to an unmodified wood-based equivalent. However, it was noted that the outcome of such an analysis was highly sensitive to the assumptions that were made regarding in-service performance [1]. A carbon payback time approach was adopted by Hill and Norton [2] in order to determine the benefits arising from the use of a modified wood in cladding applications. They used published data of the environmental burdens of the modified wood and calculated a carbon payback time based upon the methods recommended in the International Life Cycle Data System (ILCD) Handbook for determining the temporal storage of atmospheric carbon in wood products, using a 100-year discounting period. This showed that longer payback times to “carbon neutrality” were required for modified, compared with unmodified wood. However, the analysis did not include any effects of lifetime extension or reduced maintenance upon the whole life performance of the different products. Moreover, there has not been any internationally accepted method for determining the effects of different product lifetimes upon the climate change impacts in life cycle assessment [3], making the use of the ILCD (or any discounting) approach to payback time unsatisfactory.
An important aspect to be considered when looking at product lifetimes is the issue of durability. Durability is defined as the length of time that a product is able to fulfil its intended function. Wood in service is subjected to different stressors, and how it resists these will be determined by its durability. These stresses can be environmental (e.g., fungal, rain, sunlight, insect attack) or mechanical (e.g., fatigue, loading, wear). The purpose of wood modification is to improve the durability properties of wood with respect to one or more of these stressors, with the expectation that the modified wood will have a longer service lifetime. One way to determine this is to place the modified wood samples with unmodified comparisons in exterior environments and observe the behaviour over many years (probably decades), but this is hardly a practical proposition. A more appropriate approach is to use accelerated tests in order to determine likely service lives. The challenge is how to predict what the extension in service life will be due to a modification, usually based upon laboratory or accelerated tests. Regarding biological durability, this has been discussed comprehensively by Meyer-Veltrup et al. [4], where the issue of service life prediction was considered by using a dose–response model.
Differences in life cycle costs or environmental impacts associated with a system based upon modified wood compared with unmodified wood are determined by:
- Material costs/impacts—related to material composition of the different systems and any differences in the processing requirements
- Inspection intervals—longer times between inspections will result in lower lifetime costs
- Changes in limit states for maintenance—either a longer time taken to reach a specific limit state or a more relaxed limit state will result in longer times between maintenance intervals or longer times between replacement, leading to lower lifetime costs
- Changes in limit states for replacement—a longer time to reach or a more relaxed limit state will result in lower lifetime costs
Failure models can be divided into three main types:
- Failure is modelled using a probability distribution with no assumptions made about the deterioration process that leads to failure. In this model, the condition of the component can only be in one of two states—functioning or non-functioning.
- The deterioration process leading to the failure is modelled. The deterioration should be observable directly or indirectly by the relevant indicative properties. Typically, there are three modelling approaches: (a) three-state models in which the time to potential failure and time to failure are modelled by probability distributions, (b) Markov chain models, where there are several defined degradation states, or (c) continuous stochastic processes, such as Wiener or Gamma processes.
- The physical process causing the deterioration is modelled using a stress input factor (such as load) in order to determine the deterioration of the system over time. This requires the relationship between the likelihood of failure and the stress input factor to be well understood.
The choice of model depends upon the physical processes behind the deterioration and the amount of information that is available on the condition and behaviour of the system. One approach to the problem is to use probabilistic methods and sensitivity analysis to establish the benefits of different inspection and maintenance regimes [5]. Such approaches are useful where there is a clear criterion for expressing a limit state for failure or replacement; the situation for timber in service is often more complex.
With coatings on wood, the failure is more likely to be progressive, with properties such as cracking or gloss changing gradually and with time to failure being highly variable, depending upon exposure conditions and weather. In addition, the definition of failure may be more associated with perception or aesthetic criteria, even though the functionality of the component has not yet been compromised. An example of this would be mould growth on claddings, where the underlying wood has not been degraded but is replaced because the appearance is unsatisfactory. The lifetimes of coated timber products are determined by the performance of the wood coating system and the risk factors related to the exposure conditions.
Tellnes et al. [6] reported on the effect of wood modification upon the service life of decking products by comparing carbon footprints and concluded that this had a significant influence on the results. At the present time, there has not been a comparison of the potential environmental benefits that might be achieved through the use of modified wood as a cladding material in the built environment, nor has the potential benefit of the extended lifetime of coatings on modified wood been examined. The purpose of this study was to determine the environmental consequences of the use of timber as a cladding material and in particular to determine whether the use of modified wood provides any additional environmental benefits compared with the use of unmodified timber equivalents. This paper examines the relevant published data in this area and considers what information is required in order to make a proper evaluation of the research question.
2. Materials and Methods
The first step of this study was to examine the published environmental impact data on modified wood. This was largely based upon environmental product declarations which are currently published. It was decided to examine two parameters—embodied energy (EE) and global warming potential (GWP). Data for the lifecycle stages A1–A3 were collected, as defined in EN15804 (Table 1)(EN15805+A2:2019, Sustainability of construction works. Environmental product declarations. Core rules for the product category of construction products).
The results for the GWP data and sequestered atmospheric carbon are reproduced in Table 2. In many cases, the GWP impact data were not reported directly and had to be calculated, based upon the reported total GWP and the reported sequestered atmospheric carbon (in kg carbon dioxide equivalents per cubic meter of wood product). The embodied energy data are reproduced in Table 3.
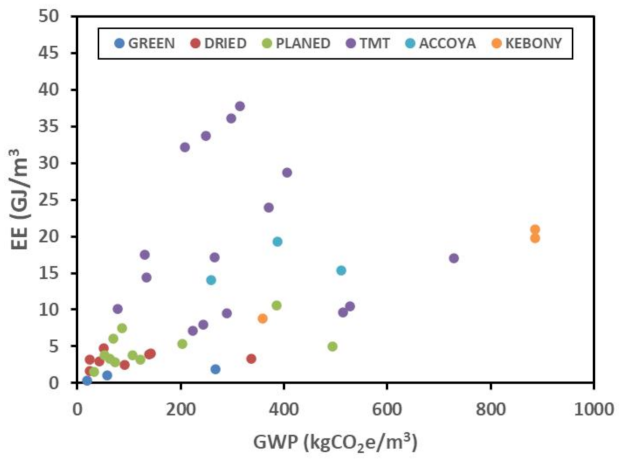
A comparison of the relationship between the GWP and embodied energy for the modified and unmodified solid wood products is shown in Figure 1.
In principle, there should be an increase in both embodied energy and GWP emissions as the degree of wood processing increases. This trend is apparent in the data, but there are some obvious outliers which have considerably higher GWP compared with the main group and others which have much higher embodied energy than might be predicted from a trend-line. Those with a higher GWP belong to wood processed in Australia, where the higher carbon footprint of the Australian grid mix is presumably the main cause of the higher GWP values. One data point is associated with the production of sawn and planed Siberian larch, and the higher embodied energy (10.57 GJ/m3) and GWP (386 kgCO2e/m3) is due to the long transport distances involved. Since the analysis was performed in a European context, these data were removed from the next part of the study. Some of the data for TMT also exhibit much higher embodied energies than might be predicted from a trend line (data were included in the analysis). The reasons for this are not known but are considered further in the Discussion section.
There has been very little work on LCAs of modified wood published in the literature [7], although a study of the LCA of TMT production has been published [8]. The declared unit was 1m3 and the embodied energy was 14.38 GJ (production in Portugal) and 17.55 GJ (Spain), with a corresponding GWP of 133 kg CO2e (Portugal) and 131 kg CO2e (Spain). These data are considered typical for production of TMT in a European context and were accordingly included in the analysis and in Figure 1.
Since this was a preliminary study, it was decided to use average values for the different product groups. The average values for GWP are reported in Table 4 for 1 m3 of unmodified wood (dried, sawn and planed), TMT, Accoya and Kebony, along with the standard deviations. These values were then used in the model.
The initial question asked was “what should the lifetime of the modified wood product be in order to compensate for the extra GWP associated with the modification process?” (modules A1–A3). This requires consideration of the initial impact associated with modules A1–A3 and then determining the number of replacements of the unmodified wood that are required before the GWP of the unmodified wood and modified wood are equal (modules A1–A3 plus B4).
Such an analysis only considers the GWP impact associated with materials’ production (modules A1–A3) but takes no account of the impacts associated with the transport to construction site (A4) and installation (A5). Typical GWP impact data for these parts of the product lifecycle were obtained from two published EPDs (registration numbers: S-P-01718, BREG EN EPD No.:000124). GWP impacts of 6.9 kg CO2e/m3 (A4) and 46.7 kg CO2e/m3 (A5) were used as representative, although other values can be used. Therefore, adding the GWP values for modules A1–A5 gives the total impact for production and installation on site. For uncoated products, no maintenance was assumed during the product lifetime (zero impact for modules B1–B7).
The additional effect of applying a coating was also investigated (module B4). For this purpose, a thickness for the cladding boards of 30 mm was assumed, which results in an exposed surface area of approximately 33 m2; it was assumed that only one side of each board was coated with a water-based alkyd paint but that two coats were applied. A coverage of 3m2 per litre of paint and a paint density of 1.1 kg/litre were assumed, resulting in a usage of 60 kg of paint per m3 of wood product. The GWP impact of the wood coating was determined using Ecoinvent 3.1 and using “Alkyd paint, white, without water, in 60% solution state {RER}| alkyd paint production, white, water-based, product in 60% solution state | Alloc Def, S” with the method “IPCC 2013 GWP 100a V1.03”.
3. Results and Discussion
3.1. Relationship between Embodied Energy and GWP
The embodied energy of a material or product used in a structure or product is often defined as the primary energy used in the manufacture, which includes all of the energy used in the production, as well as the primary energy used in the transport of materials and goods required for the production process. This definition relates to the initial embodied energy, which is related to the cradle to factory gate stage (modules A1–A3, EN15804) of the product life cycle, as reported in the work herein. This is sometimes referred to as the initial embodied energy. In some definitions, the transport to construction site (A4) and the energy used on site for the erection or installation of the product (A5) are also included. The energy used in the maintenance and refurbishment of the product is referred to as the recurring embodied energy, and where end of life is also considered, there is a contribution from demolition energy. Embodied energy does not include operational energy, which may be associated with the product, e.g., heating a building. The units used are generally MJ (or GJ) per unit mass, or volume, or per defined functional unit, although some workers report this as kWh (=3.6 MJ). Transport of materials to site can have a major impact on the embodied energy and GWP impact of the construction materials.
The embodied energy is invariably reported according to the cumulative energy demand (CED) method, which states that the embodied energy is assessed as the primary energy used for the manufacture, use and disposal of an economic good (product or service), or which may be attributed to it with justification. The method distinguishes between non-renewable and renewable energy use. The cumulative energy demand (CED) represents the primary energy used (both direct and indirect) during the life cycle of a product [9]. This includes the energy consumed during the extraction, manufacturing and the disposal of the product and raw and auxiliary materials. Different methods for determining the primary energy demand exist. For example, the lower or higher heating values of primary energy sources may be used; the use of renewable energy resources may not be included, or it may be reported separately. Primary energy is defined as “the energy requiredfrom nature” (e.g., coal) embodied in the energy consumed by the purchaser (for example, electricity) and the energy used by the consumer as “delivered energy”. This means that a process using 1 MJ of electricity in one region of the world may have a different embodied energy compared with an identical process using 1 MJ of electrical energy in another part because the grid mix in the two regions is different.
The current standards do not provide complete guidance and do not address important issues regarding embodied energy reporting. For example, EN15804 does not mention embodied energy, although it does require the reporting of energy inputs as primary energy and requires the reporting of the following categories describing resource use:
- Use of renewable primary energy, excluding renewable primary energy resources used as raw materials
- Use of non-renewable primary energy, excluding non-renewable primary energy resources used as raw materials
It is important to distinguish between embodied energy, which is associated with the production of a good or service, and the inherent (or embedded) energy, which is a physical property of the material. The terms embodied and embedded are sometimes confused in the literature. As noted previously, the embodied energy of a material is the primary energy that is associated with the extraction, processing and transportation of that material from the cradle to the factory gate. In contrast, the embedded energy of a material is a property of that material and can be directly measured. For example, the inherent energy in a wood product can be recovered at the end of its life cycle by incineration, whereas the inherent energy of concrete is zero. The inherent (embedded) energy is reported in EN15804 in the following categories:
- Use of renewable primary energy resources used as raw materials
- Use of non-renewable primary energy resources used as raw materials
However, different LCA practitioners report data for these categories in different ways. In addition, the inherent energy is reported as primary energy in these categories, which does not necessarily represent the true value of the recoverable energy, which is usually more accurately reported for wood as the lower heating value (LHV).
There should be a relationship between GWP and embodied energy because energy production does result in carbon emissions, but the greenhouse gas (GHG) emissions per unit of energy vary enormously, depending on the primary energy source used. For example, there is a very large difference in the GWP associated with the generation of 1 kWh of electricity if coal or wind are used as the primary energy sources. Therefore, the relationship between EE and GWP will exhibit scatter. Other reasons for different GWP impacts per unit of energy are related to processes, such as wood drying using different primary energy sources and differences in efficiency.
3.2. Impact of Modified Wood versus Unmodified (Uncoated)
Comparisons of modified versus unmodified wood are shown in Table 5. The data are shown in terms of a payback time for the use of unmodified wood. The time in years refers to the lifetime that the modified wood product would have to achieve before the GWP impacts for the use of modified wood and unmodified became identical. This is based upon the assumption that the unmodified wood has a lifetime in service of 20 years. Any advantage in terms of GHG emissions would only be realised if the lifetimes of the modified wood products exceeded these threshold values. The first row shows the payback times only taking into account the production of the materials. The second row includes the impacts from material production and installation onsite.
The more realistic scenario is the one including modules A1 through to A5, but the required lifetimes for the modified wood in order to achieve parity in terms of GWP impact is quite challenging. Re-examination of the data presented in Figure 1 shows that there is considerable scatter in the GWP and EE values. The data for Accoya and Kebony are limited (unsurprisingly), and although the average value has been assumed to be representative, other values could be used in the analysis. Closer inspection of the EPDs for Kebony (NEPD-407-287, NEPD-408-287, NEPD-410-288) reveals two distinctly different GWP values (+886 kg CO2e/m3 for Kebony Clear produced from southern yellow pine or from radiata pine, or +359 kg CO2e/m3 for Kebony Character produced from Scots pine). These absolute values for GWP impact take no account of the sequestered atmospheric carbon that is stored in the wood and furfuryl polymer of the product. In the EPD, these data have been combined to yield an overall negative GWP impact. This approach to dealing with sequestered carbon requires consideration of the end of life of the product and the ultimate fate of the carbon but is not able to deal with the temporal aspects of carbon storage [3]. For example, the climate change mitigation effects associated with atmospheric carbon storage are quite different for a product lifetime of 5 years, compared with 100 years. At this stage of the analysis, the carbon storage benefits have not been included and the impacts due to GHG emissions were either based on those reported in the EPD or calculated using those data. If the GWP impact for Kebony Character produced from Scots pine is used in the analysis, the payback time (considering A1–A5) becomes 64 years. The important issue of sequestered atmospheric carbon is dealt with later. A similar consideration of the Accoya EPD data (NEPD-376-262) also shows that there are large differences in the reported GWP for Accoya (Accys, Arnhem) made from radiata pine (source—New Zealand), Scots pine (Sweden) and beech (Germany). The GWP impact associated with the production of Accoya was not reported directly and had to be calculated based on the information supplied in the EPD (Table 6).
If the use of by-product acetic acid is included in the LCA, then the total GWP impact is reduced, in some cases giving an overall negative impact. From the data provided in the EPD, this indicates that the recovery of acetic acid by-product from the production of 1m3 of acetylated wood provides a GWP credit of 276 (radiata), 389 (Scots) and 530 kg CO2e/m3 (beech). Furthermore, negative GWP values are obtained for the whole process even when the sequestered carbon is removed from the wood in two cases. Acetic acid is produced as a by-product of the reaction of acetic anhydride with wood. Acetic anhydride is produced by the reaction of acetic acid via the carbonylation process.An overall negative GWP value, even when including system expansion and acetic acid credits, does not seem credible. Without access to the details of the process and the underlying LCA, it is not possible to examine this claim further. In addition, there is a considerable difference between the species when credits are included. Due to these apparent discrepancies, the data including acetic acid credits were not considered further.
The sequestered carbon in the Accoya products used in this EPD were estimated based upon the reported density of the Accoya products (replicated in the table). Using the methodology of EN16449 and these densities and an equilibrium moisture content of 0%, and an assumed carbon content of 50%, the calculated sequestered atmospheric carbon content was close to that reported in the EPD (935, 990, 1384 kg CO2e/m3 for radiata, Scots, beech, respectively). However, these values should not be derived directly from the modified wood density since the modified wood has larger dimensions than unmodified and also weighs more due to the presence of bonded acetyl groups (which are derived from a fossil feedstock). The correct procedure to determine the atmospheric carbon content of the Accoya product is to use the density of the wood before acetylation. Table 7 shows the sequestered carbon determined using EN16449 at a moisture content of 10% with densities typical of the unmodified wood species.
These values are lower than those quoted in the EPD by approximately 150–200 kgCO2e/m3. However, based on the data quoted in the EPD, the payback time varies from 68 to 135 years.
3.3. Impact of Modified versus Unmodified Wood (Coated)
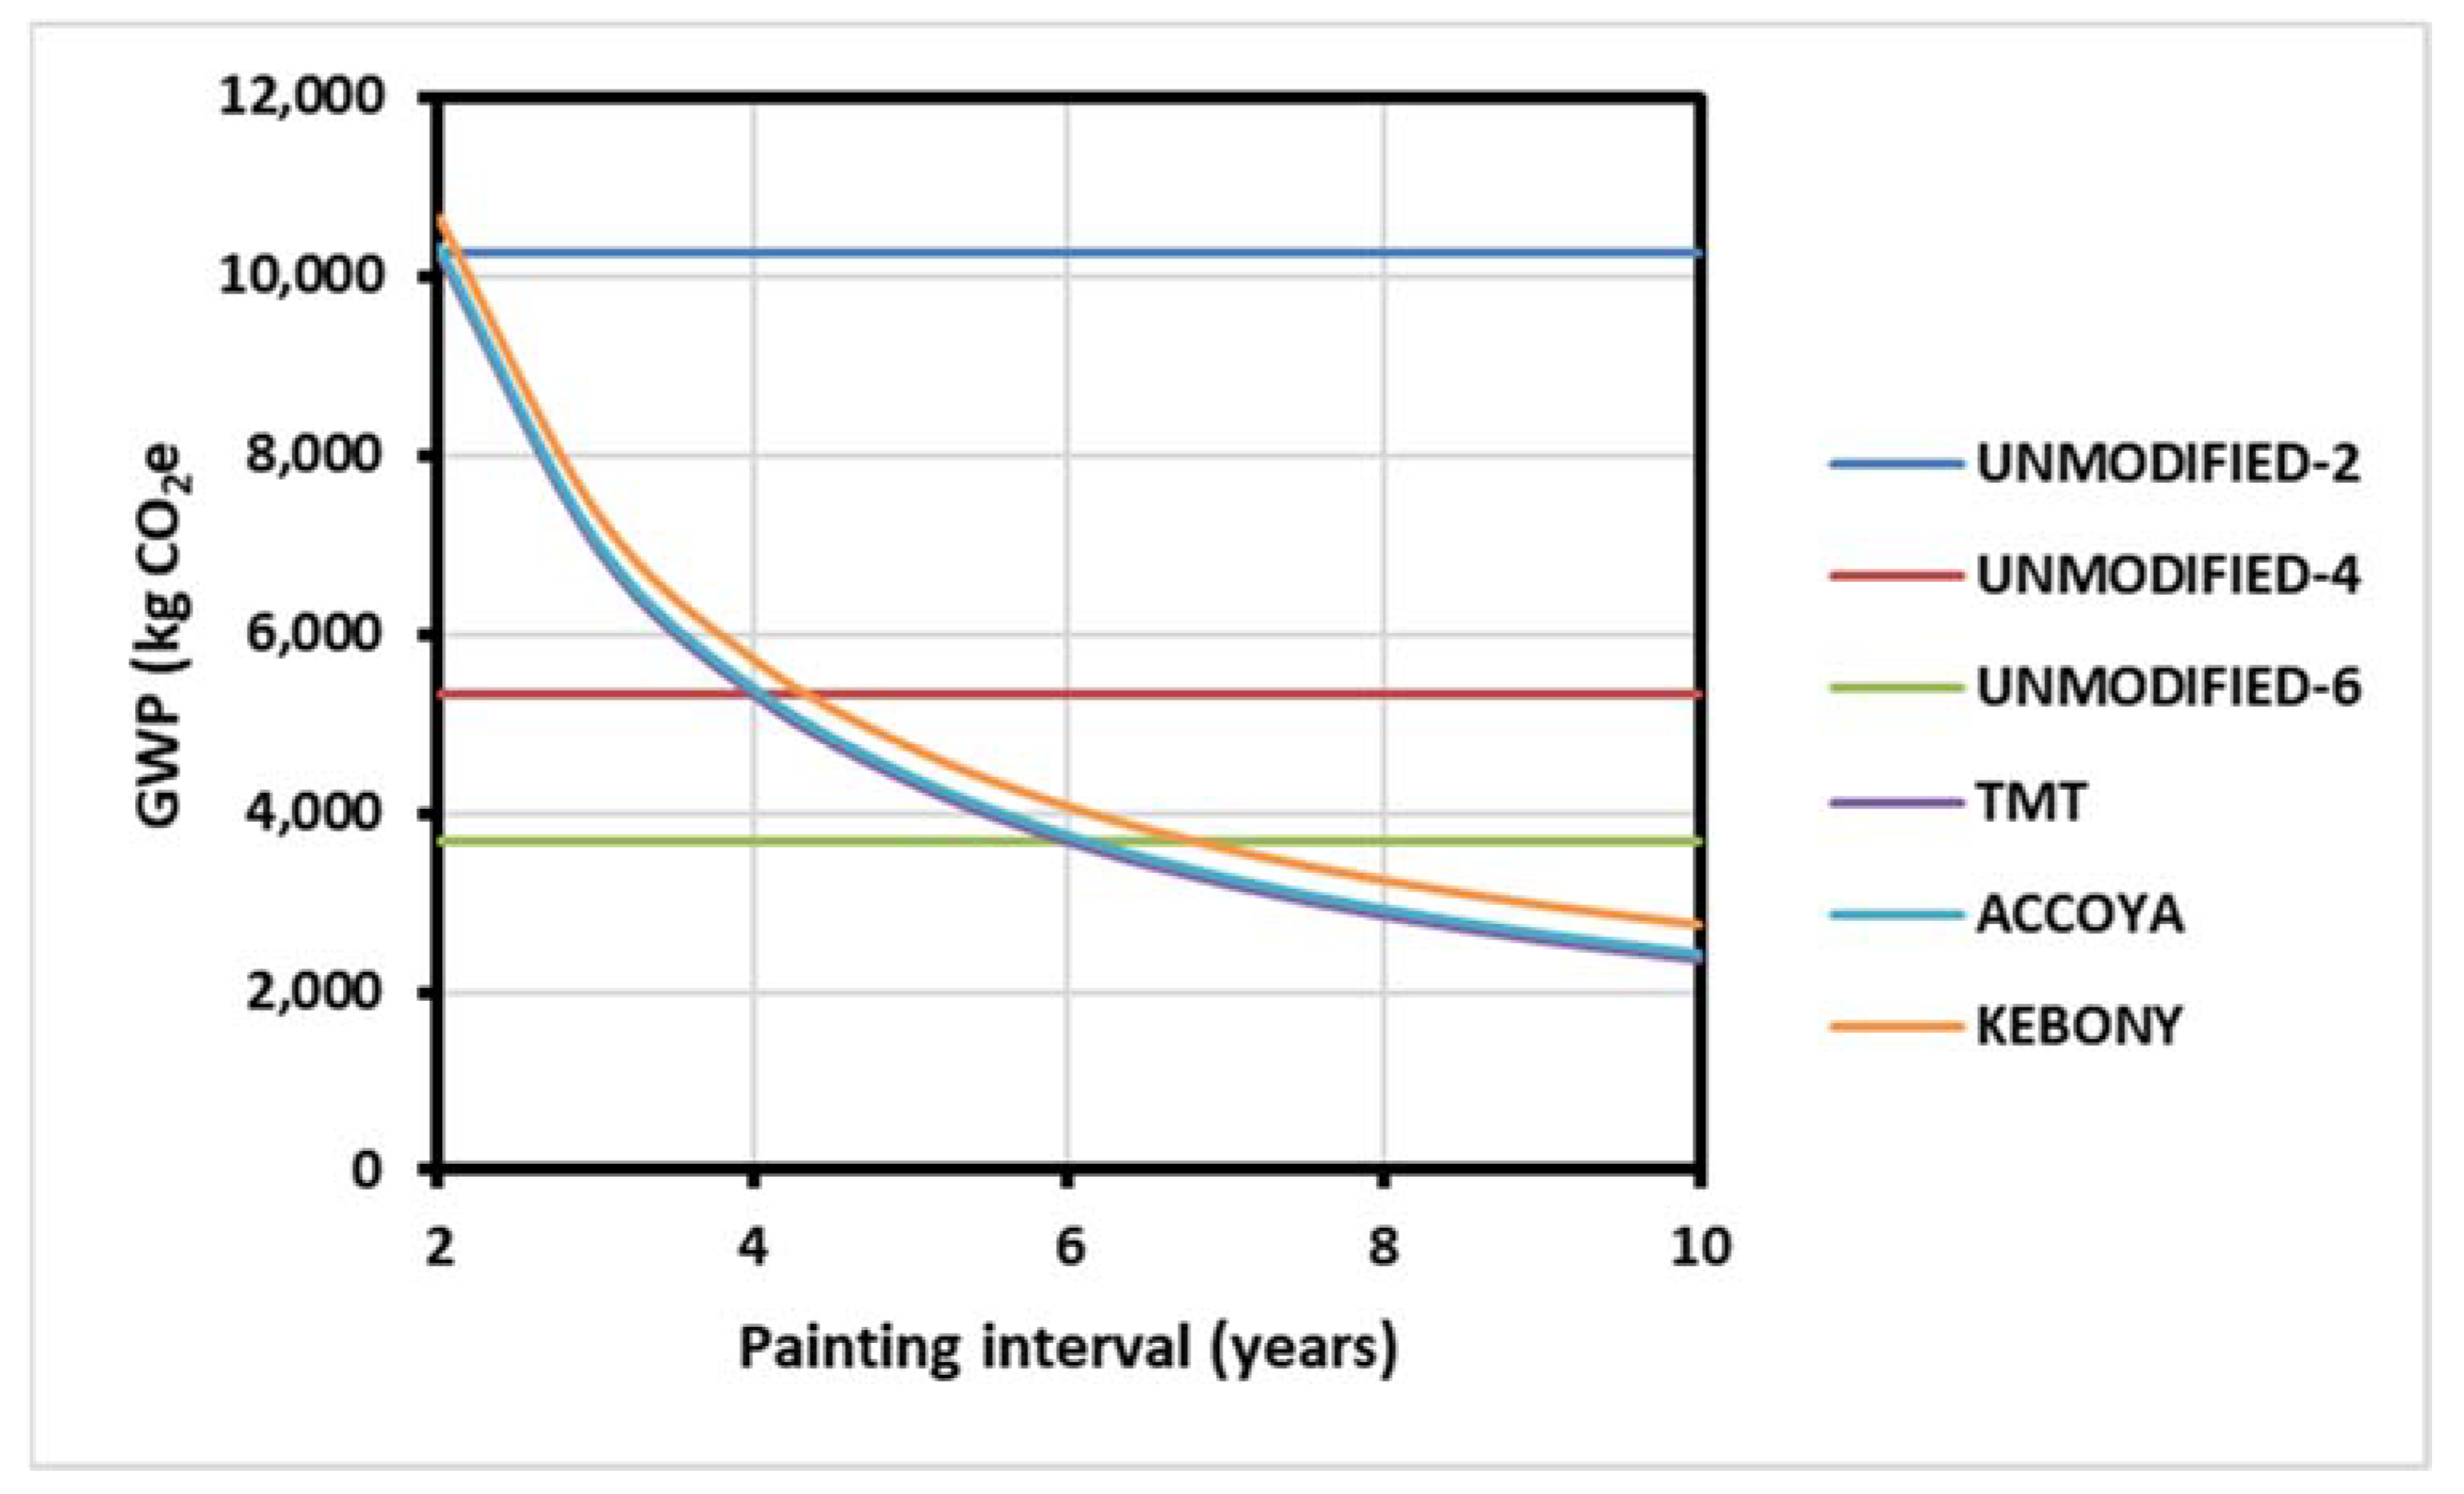
In some markets, cladding is painted, and the impact of this and any improvement in properties due to wood modification was studied by assuming that a water-based alkyd paint was applied as two coats to the exposed face of the board. A coating was applied before installation and then at pre-determined intervals during an assumed 60-year lifetime. As with the previous model, a service life of 20 years was assumed for the unmodified wood. For a total lifetime of 60 years for the building, three replacements of the unmodified wood were accordingly assumed, whereas the modified wood was assumed to have a lifetime of 60 years. For the modified wood cladding, a coating interval of 10 years was assumed, due to the improved dimensional stability imparted by wood modification. The results from this analysis are shown in Table 8. The benefits of extended coating lifetimes are clear from this analysis.
The assumptions made regarding coating intervals may not be realistic and the analysis was improved by assuming three different coating intervals for unmodified wood (2, 4, 6 years) and examining the effect of changing the coating intervals on the modified wood (from 2 to 10 years). The results from this analysis are shown in Figure 2.
This shows that the impacts associated with coating (ignoring travelling to site, scaffolding, disruption, etc.) have a very important contribution to the overall impact. The potential for modified wood to provide a more stable substrate for coating systems and consequently for there to be an extension in maintenance intervals is significant and further studies are warranted.
3.4. Dealing with Sequestered Carbon
There is no agreed method for incorporating sequestered carbon into life cycle assessment [3]. The problem is that the period of time that the sequestered carbon is held in storage is not properly accounted for, and there is considerable debate as to the best way to do this. The most recent version of EN15804 incorporating A2:2019 includes a specific category for reporting GWP-biogenic, in which sequestered atmospheric carbon can be included and reported separately from the GWP-fossil, as well as a table in which the biogenic carbon in the product due to conversion of atmospheric CO2 into biomass can be reported. The GWP-biogenic indicator accounts not only for removals of atmospheric CO2 into living biomass (not including native forest) into the product system but also includes any emissions of biogenic carbon into the atmosphere from all sources (except native forests), arising from combustion or disposal. The mandatory information that is provided in Table 9 of the document of the standard EN15804 and it is therefore essential for reporting the biogenic carbon content of the product, so as not to introduce ambiguities. However, other than reporting these values, the standard makes no recommendations regarding the reporting of the time of storage of the atmospheric carbon.
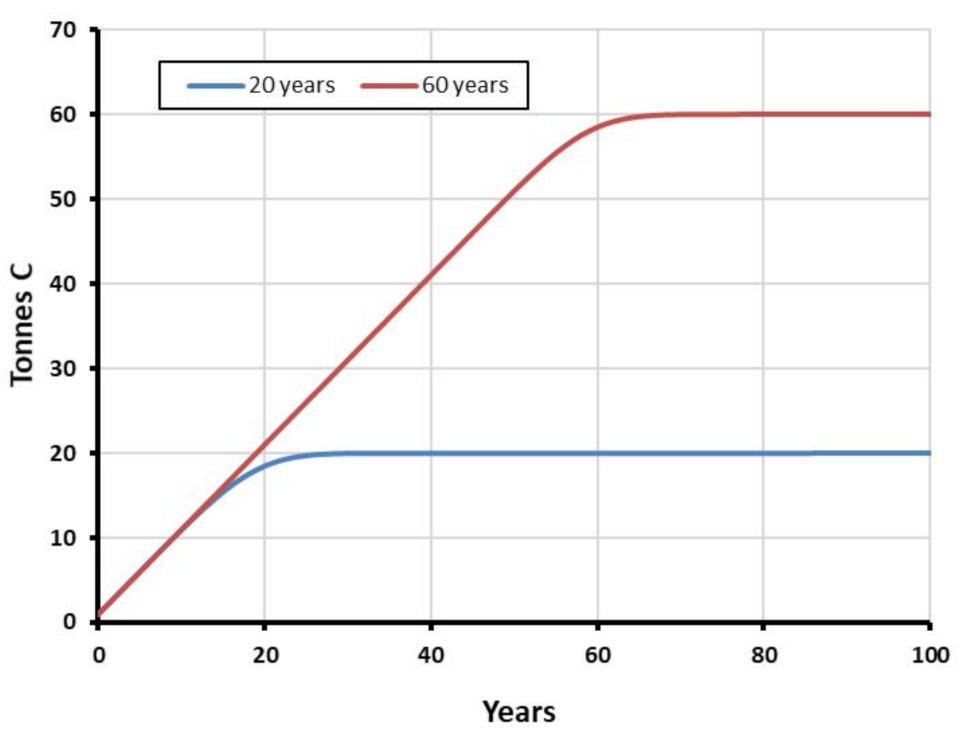
The benefits of carbon storage and extended lifetimes can be illustrated by the use of a simple model which considers the flows of atmospheric carbon into and out of a carbon pool that represents the built environment. Climate change mitigation occurs during the period that the inflows of carbon into the pool exceed the outflows (exactly as would occur with a forest). Although the carbon enters the pool each year as a single pulse as buildings are constructed from wood, the actual residence time or lifetime of the wood products in buildings is much more accurately represented by a distribution, so that the outflow of the carbon now takes place over a number of years. Many different functions can be used to represent this distribution, with an exponential decay often being chosen by default [10,11]. However, an exponential function over-estimates the losses for short time intervals and under-estimates losses over extended time periods [12]. For the purposes of this illustrative model, a normal distribution was chosen to represent the carbon outflow. Two average product lifetimes (+/−standard deviation) were selected: 20 (+/−5 years) and 60 (+/−5 years). The model was based upon an inflow of carbon of one tonne per year, with the outflow being modelled by the standard deviation. Thus, eventually all of the carbon associated with the inflow exits the pool into the atmosphere (assumed to be 100% oxidation of the carbon inflow). The results from such an analysis are illustrated in Figure 3.
This shows very clearly that a tripling of the product lifetime leads to a 3-fold increase in the total amount of carbon stored and the time to reach equilibrium. Dealing with sequestered atmospheric carbon using this “stocks and flows” approach shows that eventually the flow of carbon out of the product pool equals the inflow, but there is a crucial period during which there is an increase in carbon stored, resulting in a mitigation effect. Depending on the longevity of the timber products, this mitigation period can be extended. The point here is that this buys time while a low carbon economics is created. Attempts to include the carbon storage benefits into a conventional LCA approach have many difficulties, and a consensus has not been reached as to the best way to do this. A stock and flow approach shows the benefits very clearly. The choice of function to represent the outflow may affect the time to equilibrium and total amount stored to a limited extent but does not change the overall findings. Applying this approach to a real-life situation requires accurate data regarding the lifetimes of timber products in the built environment. To some extent, this can be based on models that use laboratory and accelerated data, but examination of timber stocks and flows in the built environment receives very little attention. This analysis has concentrated on an analysis of average values and compared modified wood with unmodified in a European context. The impact of the treatment of wood with biocides has not been considered. For low hazard applications, the use of wood without coatings and biocides is sufficient, but for more demanding situations the use of biocides would be essential. At the present time, there are no satisfactory published data which could be used to examine the impacts of biocide use.
This study has only examined the GWP impacts for the purposes of comparison of modified with unmodified wood. Other impact categories should not be neglected when performing an analysis of the sustainability of different technologies. For example, in cases where timber is extracted from native forests, impacts upon land use and biodiversity may be a serious issue. At this time EN15804 does not include consideration of such impacts, apart from possible GWP implications of land use change. There is no impact category listed for impacts on biodiversity, apart from potential comparative toxic unit for ecosystems and potential soil quality index (SQP) as a land use related impact. However, these are listed with the disclaimer “The results of this environmental impact indicator shall be used with care as the uncertainties on these results are high or as there is limited experienced with the indicator”. Until the scientific data and methodology supporting such impact categories improves, other impacts concerning land use and land use change should not be included in a comparative analysis. Other points that should be included in the comparative analysis are a more comprehensive consideration of the environmental impacts associated with installation, including potential disruption of other activities.
4. Conclusions
The results from this preliminary analysis have shown that any potential environmental benefit that might be realized from the use of modified wood is very clear when there is an extended time between coatings. The benefits of life extension of the wooden products is less clear if the sequestered carbon is not considered. The modification of wood has an associated environmental burden associated with the process over and above that for the production of unmodified wood. There is a considerable range of GWP values reported in the currently valid published environmental product declarations for unmodified and modified wood. In this preliminary analysis average values were taken for different product groups, and these averages were used to examine what the lifetime of the modified wood has to be so that the extra impact is equal to replacing unmodified wood over several lifetimes (herein called a payback time). When the environmental burdens associated with installation are not included, these payback times vary from 80 to 190 years. These payback times are reduced somewhat when the GWP impacts associated with installation are included in the analysis. Closer analysis of the EPDs for the chemical modification processes (Kebony, Accoya) shows that there are reductions possible, particularly when European-sourced wood is used (the study is in a European context). However, this more detailed analysis has also revealed inconsistencies in the Accoya EPD. Further work is needed to clarify the potential benefits (if any). When coated products are included in the analysis, a doubling of the time between re-painting (5 to 10 years) produces clear benefits in terms of a reduced GWP impact. The potential benefits of extending lifetime due to the use of a modified wood results in a much higher total storage of atmospheric carbon in the built environment carbon pool, and a longer time until equilibrium is reached. There is currently no agreed methodology for combining the LCA with the carbon storage benefits. It is essential that the difference in impacts due to material substitution and the effect on carbon storage dynamics are both considered when undertaking an analysis of the total impact on global warming potential. One further point to be considered here is that end of life, or multiple lives due to cascading of timber products, has not yet been considered in the analysis. This will be included in due course as the sophistication of the modelling improves. A particular problem with using the stock and flow approach is the choice of an appropriate model that accurately describes the outflow (oxidation) of carbon from the built environment pool. Current recommendations regarding building lifetimes, maintenance and replacement of components are not based upon scientific studies but upon assumptions. Thus, although qualitatively demonstrating the benefits of carbon sequestration are straightforward, measuring the benefits of carbon storage in timber products in the built environment are much more challenging. Further analysis is required to determine the effects of biocide use and to investigate other environmental impacts, as well as modelling the impacts associated with installation and maintenance in more detail.
Author Contributions
The individual contributions by the authors were as follows: conceptualization, C.H. and D.G.; methodology, C.H.; validation, C.H., D.G. and M.H.; formal analysis, C.H.; writing—original draft preparation, C.H.; writing—review and editing, D.G. and M.H. All authors have read and agreed to the published version of the manuscript.
Funding
Callum Hill wishes to thank Abodo Wood Ltd. for funding part of this study. Part of the work reported in this paper was carried out under the CircWood (Increasing the climate change mitigation potential of wood used in construction) project supported by the Growth and Development from Wood Program of the Finnish Ministry of the Environment under grant decision number VN/5272/2018. Mark Hughes and Callum Hill gratefully acknowledge financial support from this source.
Institutional Review Board Statement
Not applicable.
Informed Consent Statement
Not applicable.
Data Availability Statement
Data was sourced from publicly-available environmental product declarations published by program operators.
Conflicts of Interest
The authors declare no conflict of interest.
References
- Hesser, F.; Wohner, B.; Meints, T.; Stern, T.; Windsperger, A. Integration of LCA in R&D by Applying the Concept of Payback Period: Case Study of a Modified Multilayer Wood Parquet. Int. J. Life Cycle Assess. 2017, 22, 307–316. [Google Scholar] [CrossRef] [Green Version]
- Hill, C.; Norton, A.J. The Environmental Impacts Associated with Wood Modification Balanced by the Benefits of Life Extension. In Proceedings of the Seventh European Conference on Wood Modification, Lisbon, Portugal, 10–12 March 2014. [Google Scholar]
- Tellnes, L.; Ganne-Chedeville, C.; Dias, A.; Dolezal, F.; Hill, C.; Zea Escamilla, E. Comparative Assessment for Biogenic Carbon Accounting Methods in Carbon Footprint of Products: A Review Study for Construction Materials Based on Forest Products. iForest 2017, 10, 815–823. [Google Scholar] [CrossRef] [Green Version]
- Meyer-Veltrup, L.; Brischke, C.; Alfredsen, G.; Humar, M.; Flæte, P.-O.; Isaksson, T.; Brelid, P.L.; Westin, M.; Jermer, J. The Combined Effect of Wetting Ability and Durability on Outdoor Performance of Wood: Development and Verification of a New Prediction Approach. Wood Sci. Technol. 2017, 51, 615–637. [Google Scholar] [CrossRef]
- Besnard, F.; Nilsson, J.; Bertling, L. On the Economic Benefits of Using Condition Monitoring Systems for Maintenance Management of Wind Power Systems. In Proceedings of the 2010 IEEE 11th International Conference on Probabilistic Methods Applied to Power Systems, Singapore, 14–17 June 2010; IEEE: Singapore, 2010; pp. 160–165. [Google Scholar]
- Tellnes, L.G.F.; Alfredsen, G.; Flæte, P.O.; Gobakken, L.R. Effect of Service Life Aspects on Carbon Footprint: A Comparison of Wood Decking Products. Holzforschung 2020, 74, 426–433. [Google Scholar] [CrossRef] [Green Version]
- Candelier, K.; Dibdiakova, J. A Review on Life Cycle Assessments of Thermally Modified Wood. Holzforschung 2020. [Google Scholar] [CrossRef]
- Ferreira, J.; Herrera, R.; Labidi, J.; Esteves, B.; Domingos, I. Energy and Environmental Profile Comparison of TMT Production from Two Different Companies—A Spanish/Portuguese Case Study. iForest 2018, 11, 155–161. [Google Scholar] [CrossRef]
- Huijbregts, M.A.J.; Rombouts, L.J.A.; Hellweg, S.; Frischknecht, R.; Hendriks, A.J.; van de Meent, D.; Ragas, A.M.J.; Reijnders, L.; Struijs, J. Is Cumulative Fossil Energy Demand a Useful Indicator for the Environmental Performance of Products? Environ. Sci. Technol. 2006, 40, 641–648. [Google Scholar] [CrossRef] [PubMed] [Green Version]
- Marland, E.; Marland, G. The Treatment of Long-Lived, Carbon-Containing Products in Inventories of Carbon Dioxide Emissions to the Atmosphere. Environ. Sci. Policy 2003, 6, 139–152. [Google Scholar] [CrossRef]
- Pingoud, K.; Ekholm, T.; Soimakallio, S.; Helin, T. Carbon Balance Indicator for Forest Bioenergy Scenarios. GCB Bioenergy 2016, 8, 171–182. [Google Scholar] [CrossRef] [Green Version]
- Marland, E.S.; Stellar, K.; Marland, G.H. A Distributed Approach to Accounting for Carbon in Wood Products. Mitig. Adapt. Strateg. Glob Chang. 2010, 15, 71–91. [Google Scholar] [CrossRef]
Figure 1.
Relationship between embodied energy and global warming potential for unmodified and modified solid wood products, from published EPDs and literature.
Figure 1.
Relationship between embodied energy and global warming potential for unmodified and modified solid wood products, from published EPDs and literature.

Figure 2.
Effect of different coating intervals upon the GWP impact for unmodified and modified wood for a total area of 33.3 m2. For unmodified wood, the horizontal lines represent the impact for a single coating interval of 2, 4, or 6 years. A total lifetime of 60 years is considered and life-time of 20 years for the unmodified wood, and 60 years for the modified wood was assumed.

Figure 3.
Effect on total carbon stored and time to equilibrium for a carbon pool with an input of 1 tonne C per year and a carbon loss represented by a normal distribution of time.
Figure 3.
Effect on total carbon stored and time to equilibrium for a carbon pool with an input of 1 tonne C per year and a carbon loss represented by a normal distribution of time.


Table 1.
Lifecycle stages divided into modules according to EN15804.
| Module | Lifecycle Stage | Description |
|---|---|---|
| A1 | Production | Raw material supply |
| A2 | Production | Transport |
| A3 | Production | Manufacturing |
| A4 | Construction | Transport |
| A5 | Construction | Installation |
| B1 | Use | Use |
| B2 | Use | Maintenance |
| B3 | Use | Repair |
| B4 | Use | Replacement |
| B5 | Use | Refurbishment |
| B6 | Use | Operational energy use |
| B7 | Use | Operational water use |
| C1 | End of life | Deconstruction/demolition |
| C2 | End of life | Transport |
| C3 | End of life | Waste processing |
| C4 | End of life | Disposal |
| D | Beyond the life cycle | Reuse/recovery/recycling |
Table 2.
Global warming potential (GWP) data for modules A1–A3 (forest to factory gate) (declared unit 1 m3) (GWP in kg CO2 eq.). Abbreviations: EPD (environmental product declaration), MC (moisture content), EPD (environmental product declaration), TMT (thermally modified timber).
Table 2.
Global warming potential (GWP) data for modules A1–A3 (forest to factory gate) (declared unit 1 m3) (GWP in kg CO2 eq.). Abbreviations: EPD (environmental product declaration), MC (moisture content), EPD (environmental product declaration), TMT (thermally modified timber).
| EPD Registration Number | Date | Country | Description | Density (kg/m3) | MC (%) | TOTAL (Reported) | Sequestered | GWP (Calculated) (Reported) | |
|---|---|---|---|---|---|---|---|---|---|
| Wood for Good 1 | 2014 | GBR | Fresh sawn softwood | 672 | 60 | −713 | −770 2 | +57 | |
| S-P-00561 | 2017 | AUS | Fresh sawn hardwood | 768 | 26 | −851 | −1118 2 | +267 | |
| EPD-EGG-20140246-IBA2-EN | 2018 | AUT | Sawn timber green | 740 | 70 | −779 | −798 2 | +19 | |
| Wood for Good 1 | 2014 | GBR | Sawn dried softwood | 483 | 15 | −679 | −770 2 | +91 | |
| Wood for Good 1 | 2014 | GBR | Sawn dried hardwood | 698 | 12 | −878 | −902 | +24 | |
| NEPD 307 179 EN | 2015 | NOR | Sawn dried softwood | 450 | 15 | −672 | −715 | +43 | |
| S-P-00560 | 2017 | AUS | Sawn dried softwood | 551 | 12 | −760 | −902 2 | +142 | |
| S-P-00561 | 2017 | AUS | Sawn dried hardwood | 735 | 10 | −888 | −1225 2 | +337 | |
| EPD-EGG-20140247-IBA2-EN | 2017 | AUT | Sawn timber dried softwood | 507 | 15 | −784 | −808 | +24 | |
| S-P-01325 | 2018 | SWE | Sawn dried softwood | 455 | 16 | −577 | −719 2 | +138 | |
| S-P-00997 | 2019 | NZD | Sawn dried radiata pine | 488 | 11.6 | −747 | −798 | +51 | |
| 13CA24184.102.1 | 2013 | USA | Dried planed softwood lumber | 434 | 0 | −795 | +73 | ||
| NEPD 00247N | 2014 | DNK | Sawn dried planed Siberian larch | 650 | 18 | −624 | −1010 | +386 | |
| (BRE) 000124 | 2017 | GBR | Sawn dried planed softwood | 479 | 15 | −712 | −764 | +52 | +107 |
| S-P-00560 | 2017 | AUS | Sawn + dressed dried softwood | 551 | 12 | −699 | −902 2 | +203 | |
| SP-00561 | 2017 | AUS | Sawn + dressed dried hardwood | 735 | 10 | −731 | −1225 | +494 | |
| Wood for Good 1 | 2014 | GBR | Sawn dried planed softwood | 482 | 15 | −646 | −768 | +122 | |
| NEPD 308 179 EN | 2015 | NOR | Sawn dried planed softwood | 420 | 17 | −607 | −660 | +53 | |
| S-P-00997 | 2019 | NZD | Sawn dried planed radiata | 486 | 11.6 | −728 | −795 | +69 | |
| S-P-00997 | 2019 | NZD | Sawn dried planed jointed radiata | 475 | 10.5 | −697 | −784 | +87 | |
| S-P-02153 | 2020 | CZE | Sawn dried planed jointed softwood | 450 | 15 | −685 | −717 | +32 | |
| 4788424634.102.1 | 2020 | USA | Dried planed softwood lumber | 460 | 15 | +63 3 | −733 2 | +63 | |
| NEPD 00259N | 2014 | EST | TMT spruce | 350 | 5 | −97 | −611 | +514 | |
| NEPD 00259N | 2014 | EST | TMT pine | 450 | 5 | −258 | −786 | +528 | |
| NEPD 00260N | 2014 | EST | TMT ash | 670 | 6 | −430 | −1159 | +729 | |
| S-P-01718 | 2019 | GBR | TMT (Brimstone) poplar | 409 | 5 | −453 | −719 | +266 | |
| S-P-01718 | 2019 | GBR | TMT (Brimstone) sycamore | 571 | 5 | −639 | −1010 | +371 | |
| S-P-01718 | 2019 | GBR | TMT (Brimstone) ash | 631 | 5 | −704 | −1110 | +406 | |
| RTS_44_19 | 2019 | FIN | TMT Thermo-D Lunawood rough | 430 | 5 | −426 | −724 | +298 | |
| RTS_44_19 | 2019 | FIN | TMT Thermo-D Lunawood planed | 390 | 5 | −342 | −657 | +315 | |
| RTS_44_19 | 2019 | FIN | TMT Thermo-S Lunawood rough | 430 | 5 | −516 | −724 | +208 | |
| RTS_44_19 | 2019 | FIN | TMT Thermo-S Lunawood planed | 390 | 5 | −409 | −657 | +248 | |
| S-P-01543 | 2020 | NZL | TMT Vulcan radiata sawn | 420 | 7 | −535 | −758 | +224 | |
| S-P-01543 | 2020 | NZL | TMT Vulcan radiata surfaced | 420 | 7 | −516 | −758 | +243 | |
| S-P-01543 | 2020 | NZL | TMT Vulcan radiata finger-jointed | 420 | 7 | −469 | −758 | +290 | |
| NEPD-376-262-EN | 2015 | NLD | Accoya (radiata) | 510 | 4 | −433 | −944 | +511 | |
| NEPD-376-262-EN | 2015 | NLD | Accoya (Scots pine) | 540 | 4 | −741 | −999 | +258 | |
| NEPD-376-262-EN | 2015 | NLD | Accoya (beech) | 755 | 4 | −1010 | −1397 | +387 | |
| NEPD-407-287- | 2016 | NOR | Kebony Clear (radiata) | 480 | 12 | −549 | −1435 4 | +886 | |
| NEPD-408-287-EN | 2016 | NOR | Kebony Clear (SYP) | −646 | −1532 4 | +886 | |||
| NEPD-410-288-EN | 2016 | NOR | Kebony character (Scots pine) | −738 | −1097 4 | +359 | |||
| NEPD-411-288-EN | 2016 | NOR | Kebony character (Scots pine) roofing | −738 | −1097 | +359 | |||
1 Not registered as an EPD, but follows the EN15804 PCR. 2 data not supplied in the EPD, calculated using EN16449. 3 Not clear how this value is calculated. 4 Includes biogenic carbon in the furfuryl polymer.
Table 3.
Embodied energy and inherent energy data for modules A1–A3 (forest to factory gate) (declared unit 1 m3). Abbreviations: PERE (primary energy renewable energy), PENRE (primary energy non-renewable energy), PERM (primary renewable energy in the materials).
Table 3.
Embodied energy and inherent energy data for modules A1–A3 (forest to factory gate) (declared unit 1 m3). Abbreviations: PERE (primary energy renewable energy), PENRE (primary energy non-renewable energy), PERM (primary renewable energy in the materials).
| EPD Registration Number | Date | Country | Description | PERE (MJ) | PENRE (MJ) | Embodied Energy (MJ) | PERM (MJ) |
|---|---|---|---|---|---|---|---|
| Wood for Good 1 | 2014 | GBR | Fresh sawn softwood | 34 | 1040 | 1074 | 8090 |
| S-P-00561 | 2017 | AUS | Fresh sawn hardwood | 111 | 1810 | 1921 | 11,300 |
| EPD-EGG-20140246-IBA2-EN | 2018 | AUT | Sawn timber green | 97 | 250 | 347 | 8050 |
| Wood for Good 1 | 2014 | GBR | Sawn dried softwood | 853 | 1650 | 2503 | 8120 |
| Wood for Good 1 | 2014 | GBR | Sawn dried hardwood | 328 | 2840 | 3168 | 11,300 |
| NEPD 307 179 EN | 2015 | NOR | Sawn dried softwood | 2270 | 685 | 2955 | 7410 |
| S-P-00560 | 2017 | AUS | Sawn dried softwood | 2480 | 1610 | 4090 | 9290 |
| S-P-00561 | 2017 | AUS | Sawn dried hardwood | 879 | 2510 | 3389 | 12,600 |
| EPD-EGG-20140247-IBA2-EN | 2017 | AUT | Sawn timber dried softwood | 1330 | 330 | 1660 | 8160 |
| S-P-01325 | 2018 | SWE | Sawn dried softwood | 3170 | 748 | 3918 | 6750 |
| S-P-00997 | 2019 | NZD | Sawn dried radiata pine | 4200 | 552 | 4752 | 8260 |
| 13CA24184.102.1 | 2013 | USA | Dried planed softwood lumber | 1640 | 1228 | 2868 | |
| NEPD 00247N | 2014 | DNK | Sawn dried planed Siberian larch | 3724 | 6842 | 10,566 | 9180 |
| (BRE) 000124 | 2017 | GBR | Sawn dried planed softwood | 2270 | 1570 | 3840 | 8440 |
| S-P-00560 | 2017 | AUS | Sawn + dressed dried softwood | 3050 | 2260 | 5310 | 9290 |
| S-P-00561 | 2017 | AUS | Sawn + dressed dried hardwood | 1190 | 3840 | 5030 | 12,600 |
| Wood for Good 1 | 2014 | GBR | Sawn dried planed softwood | 1060 | 2130 | 3190 | 8080 |
| NEPD 308 179 EN | 2015 | NOR | Sawn dried planed softwood | 2930 | 902 | 3832 | 6840 |
| S-P-00997 | 2019 | NZD | Sawn dried planed radiata | 5330 | 720 | 6050 | 8240 |
| S-P-00997 | 2019 | NZD | Sawn dried planed jointed radiata | 6530 | 991 | 7521 | 8140 |
| S-P-02153 | 2020 | CZE | Sawn dried planed jointed softwood | 1050 | 472 | 1522 | 7500 |
| 4788424634.102.1 | 2020 | USA | Dried planed softwood lumber | 2381 | 1000 | 3381 | 10,959 |
| NEPD 00259N | 2014 | EST | TMT spruce | 2184 | 7426 | 9610 | 9180 |
| NEPD 00259N | 2014 | EST | TMT pine | 2761 | 7697 | 10,458 | 9180 |
| NEPD 00260N | 2014 | EST | TMT ash | 6678 | 10,302 | 16,980 | 11,990 |
| S-P-01718 | 2019 | GBR | TMT (Brimstone) poplar | 13,000 | 4180 | 17,180 | 7460 |
| S-P-01718 | 2019 | GBR | TMT (Brimstone) sycamore | 18,100 | 5810 | 23,910 | 10,400 |
| S-P-01718 | 2019 | GBR | TMT (Brimstone) ash | 22,200 | 6480 | 28,680 | 9250 |
| RTS_44_19 | 2019 | FIN | TMT Thermo-D Lunawood rough | 30782 | 5270 | 36,052 | 8353 |
| RTS_44_19 | 2019 | FIN | TMT Thermo-D Lunawood planed | 31,163 | 6565 | 37,728 | 7604 |
| RTS_44_19 | 2019 | FIN | TMT Thermo-S Lunawood rough | 27,924 | 4177 | 32,101 | 8354 |
| RTS_44_19 | 2019 | FIN | TMT Thermo-S Lunawood planed | 28,483 | 5174 | 33,657 | 7605 |
| S-P-01543 | 2020 | NZL | TMT Vulcan radiata sawn | 4200 | 2970 | 7170 | 7560 |
| S-P-01543 | 2020 | NZL | TMT Vulcan radiata surfaced | 4740 | 3230 | 7970 | 7560 |
| S-P-01543 | 2020 | NZL | TMT Vulcan radiata finger-jointed | 5680 | 3850 | 9530 | 7560 |
| NEPD-376-262-EN | 2015 | NLD | Accoya (radiata) | 847 | 14,559 | 15,406 | 6574 |
| NEPD-376-262-EN | 2015 | NLD | Accoya (Scots pine) | 932 | 13,137 | 14,069 | 10,372 |
| NEPD-376-262-EN | 2015 | NLD | Accoya (beech)( | 1256 | 18,069 | 19,325 | 7596 |
| NEPD-407-287-EN | 2016 | NOR | Kebony Clear (radiata) | 5576 | 15,354 | 20,930 | 16,476 |
| NEPD-408-287-EN | 2016 | NOR | Kebony Clear (SYP) | 6407 | 13,335 | 19,742 | 17,473 |
| NEPD-410-288-EN | 2016 | NOR | Kebony character (Scots pine) | 3078 | 5691 | 8769 | 12,302 |
1 Not registered as an EPD, but follows the EN15804 PCR.
Table 4.
Average values of GWP impact used for the comparison.
| Parameter | Unmodified | TMT | Accoya | Kebony |
|---|---|---|---|---|
| Average GWP | 75.6 | 311.4 | 385.3 | 710.33 |
| Standard deviation | 29.1 | 168.0 | 126.5 | 304.3 |
Table 5.
Calculated payback times based upon average GWP values for each product group.
| Scenario | Unmodified | TMT | Accoya | Kebony |
|---|---|---|---|---|
| A1–A3 | 20 | 82.3 | 101.9 | 187.9 |
| A1–A5 | 20 | 56.5 | 68.0 | 118.3 |
Table 6.
Data obtained from the Accoya EPD (NEPD-376-262), the density, sequestered carbon and GWP total were reported in the EPD, whereas the GWP impact was calculated from these data.
Table 6.
Data obtained from the Accoya EPD (NEPD-376-262), the density, sequestered carbon and GWP total were reported in the EPD, whereas the GWP impact was calculated from these data.
| Species | Density (kg/m3) | Seq. C | GWP Total | GWP Impact | GWP Total 1 | GWP Impact |
|---|---|---|---|---|---|---|
| (kg CO2e/m3) | ||||||
| radiata | 510 | −944 | −433 | 511 | −709 | 235 |
| Scots | 540 | −999 | −741 | 258 | −1130 | −131 |
| beech | 755 | −1397 | −1010 | 387 | −1540 | −143 |
1 Includes acetic acid credits allocated on an economic basis
Table 7.
Sequestered atmospheric carbon content of radiata pine, Scots pine and European beech, based upon typical densities and a moisture content of 10%.
Table 7.
Sequestered atmospheric carbon content of radiata pine, Scots pine and European beech, based upon typical densities and a moisture content of 10%.
| Species | Density (kg/m3) | Sequestered C (kgCO2e/m3) |
|---|---|---|
| radiata pine | 488 | −813 |
| Scots pine | 455 | −758 |
| European beech | 710 | −1183 |
Table 8.
The total GWP impact associated a reference service life of 60 years. For the unmodified wood, a lifetime of 20 years was assumed, and coatings were applied every five years. For the modified wood, a lifetime of 60 years was assumed, and coatings were applied every 10 years.
Table 8.
The total GWP impact associated a reference service life of 60 years. For the unmodified wood, a lifetime of 20 years was assumed, and coatings were applied every five years. For the modified wood, a lifetime of 60 years was assumed, and coatings were applied every 10 years.
| Material | Total GWP (kgCO2e/m3) over 60 years |
|---|---|
| Unmodified | 4343 |
| TMT | 2342 |
| Accoya | 2416 |
| Kebony | 2741 |
Publisher’s Note: MDPI stays neutral with regard to jurisdictional claims in published maps and institutional affiliations. |
© 2021 by the authors. Licensee MDPI, Basel, Switzerland. This article is an open access article distributed under the terms and conditions of the Creative Commons Attribution (CC BY) license (http://creativecommons.org/licenses/by/4.0/).
Share and Cite
MDPI and ACS Style
Hill, C.; Hughes, M.; Gudsell, D. Environmental Impact of Wood Modification. Coatings 2021, 11, 366. https://0-doi-org.brum.beds.ac.uk/10.3390/coatings11030366
AMA Style
Hill C, Hughes M, Gudsell D. Environmental Impact of Wood Modification. Coatings. 2021; 11(3):366. https://0-doi-org.brum.beds.ac.uk/10.3390/coatings11030366
Chicago/Turabian StyleHill, Callum, Mark Hughes, and Daniel Gudsell. 2021. "Environmental Impact of Wood Modification" Coatings 11, no. 3: 366. https://0-doi-org.brum.beds.ac.uk/10.3390/coatings11030366
Note that from the first issue of 2016, this journal uses article numbers instead of page numbers. See further details here.