
A Fault Feature Extraction Method Based on LMD and Wavelet Packet Denoising


1
School of Big Data, Baoshan University, Baoshan 678000, China
2
School of Information Science and Technology, Yunnan Normal University, Kunming 650500, China
*
Author to whom correspondence should be addressed.
Coatings 2022, 12(2), 156; https://0-doi-org.brum.beds.ac.uk/10.3390/coatings12020156
Submission received: 23 December 2021
/
Revised: 22 January 2022
/
Accepted: 24 January 2022
/
Published: 27 January 2022
(This article belongs to the Special Issue Friction, Vibration and Dynamic Properties of Transmission System under Wear Progression)
Abstract
:Aiming at the problem of fault feature extraction of a diaphragm pump check valve, a fault feature extraction method based on local mean decomposition (LMD) and wavelet packet transform is proposed. Firstly, the collected vibration signal was decomposed by LMD. After several amplitude modulation (AM) and frequency modulation (FM) components were obtained, the effective components were selected according to the Kullback-Leible (K-L) divergence of all component signals for reconstruction. Then, wavelet packet transform was used to denoise the reconstructed signal. Finally, the characteristics of the fault signal were extracted by Hilbert envelope spectrum analysis. Through experimental analysis, the results show that compared with other traditional methods, the proposed method can effectively overcome the phenomenon of mode aliasing and extract the fault characteristics of a check valve more effectively. Experiments show that this method is feasible in the fault diagnosis of check valve.
1. Introduction
With the vigorous development of mineral pipeline transportation technology, high-pressure diaphragm pump operation, maintenance, and fault monitoring have become a concern. The high-pressure diaphragm pump provides the power required in the process of mineral transportation [1], and most of its failures are caused by one of the core components of the pump check valve. The check valve is a directional element used to control the feeding and discharging, so that the conveying medium flows in one direction and cannot flow back. Generally, the average price of each diaphragm pump exceeds CNY20 million, and the daily delivery of pulp exceeds 30,000 tons. If the stroke coefficient of the high-pressure diaphragm pump is 50 R/min, the feed and discharge check valves in a normal operating day need to act in a reciprocating manner 72,000 times. Therefore, the check valve is the most frequent and fault-prone component in a high-pressure diaphragm pump. Local faults and unplanned shutdowns in its operation state easily cause equipment pressure and flow fluctuations, resulting in equipment vibration and damage to the mineral transmission pipeline. To sum up, monitoring the operation state of the check valve is very important for the safe, stable, and efficient operation of mineral pipeline transportation. By detecting the vibration signal of the check valve and extracting the characteristics that can characterize the operation state for diagnosis and identification, the engineers and technicians can learn the operation state of the equipment in time and significantly improve the ability of operation and maintenance management. However, in the actual detection process, due to the complex field background noise, there is often strong impulse interference and random noise, making it difficult to distinguish the useful signal and noise interference, affecting the effective extraction of fault features.
Traditional signal processing methods are mostly based on Fourier transform, such as short-time Fourier transform, Wigner–Ville, power spectrum analysis, etc. [2,3,4]. Although the above methods have been popularized in many fields of noise reduction, there are still some defects: they cannot decompose the signal adaptively. The vibration signal of the check valve is a typical non-stationary and nonlinear signal. Before processing and analyzing it, it is necessary to obtain the local properties of the signal in the time domain. Through the ongoing efforts of scholars in related fields, some breakthroughs have been made. The empirical mode decomposition (EMD) proposed by Huang et al. [5] can adaptively decompose the signal into a series of intrinsic mode functions (IMF). However, this method has problems such as the endpoint effect, mode aliasing, etc. In recent years, the local mean decomposition (LMD) [6] proposed by Smith is a new time-frequency analysis method, which can adaptively decompose the signal to be processed into several product functions (PF) with high to low frequency and has been gradually applied. Compared with traditional methods, LMD has the advantages of better adaptability and time-frequency aggregation, solves the problems of over the envelope and under the envelope of EMD, has fewer iterations, and effectively improves the accuracy of signal decomposition. Dong Linlu et al. [7] combined the respective advantages of LMD and the singular-value decomposition method to denoise the noisy micro-vibration signal. The results show that the proposed method can better remove the high-frequency noise of the micro-vibration signal, which lays a foundation for further analysis of vibration signals. To solve the influence of complex noise and measuring point position in the monitoring process, Wang Haijun et al. [8] proposed a processing method combining a data fusion algorithm and LMD. The results show that the combined method is better than the single digital filtering method, and the vibration monitoring of a hydropower plant is realized better. Wang Zhijian et al. [9] introduced the mask signal method to process the component signals screened after LMD decomposition, which effectively suppressed the noise and weakened the mode aliasing phenomenon in the process of signal decomposition. Through the signal’s LMD decomposition, the complete time-frequency distribution information can be obtained, and it is convenient to extract the signal characteristics. At the same time, the latest applications of the LMD method in other fields have been reported. Gupta P et al. [10] proposed the method of combining LMD and an artificial neural network to complete the tool chatter feature extraction in the turning process. From the experimental analysis, it can be seen that the obtained safe cutting zone is important and can limit chatter. Liao L et al. [11] completed the extraction of low-frequency noise under the background of aerodynamic noise by using the improved LMD method. Through the wind turbine experiment, the results show that the signal noise extraction effect is good, and the calculation efficiency of the algorithm is good. To solve the problematic identification of welding quality, Huang y et al. [12] proposed a classification algorithm combining LMD and the deep belief network (DBN). Experimental results show that this method has a higher recognition rate than traditional classification methods. Lee CY et al. [13] introduced LMD, wavelet packet decomposition (WPD), and other ways to solve the problems existing in the rotor fault diagnosis of an induction motor. The results show that the model can reduce the dimension of the original data and has high robustness. However, due to noise interference, the extracted PF component will be distorted to a certain extent, which affects the interpretation of the useful components of the signal. Using wavelet packet to process the fault signal can effectively overcome the problem of low-frequency resolution in the high-frequency band of the traditional wavelet transform [14] and accurately describe the signal information, which is conducive to the effective elimination of noise information.
However, due to the bad working environment and changeable working conditions of the high-pressure diaphragm pump, some noise will still remain in the signal component decomposed by the time-frequency analysis method. If fault feature extraction and analysis are carried out directly, it will have a certain impact on fault diagnosis results. Therefore, it is also necessary to reduce the noise of the signal. Wavelet packet transform is based on wavelet transform. Compared with wavelet transform, wavelet packet transform has higher-frequency resolution in high-frequency and low-frequency bands and has good adaptability. In recent years, wavelet transform has been widely used in the noise reduction of non-stationary signals. Kuanfang he et al. [15] proposed a wavelet packet denoising method for welding acoustic emission signals. The experimental results show that the proposed method can effectively process the acoustic emission signals of welding cracks. Wang X et al. [16] proposed a method based on optimized variational mode decomposition (VMD) and wavelet packet threshold denoising and applied it to remove strong white noise signals. The results show that this method retains the practical components of the signal well. Sun W et al. [17] used a wavelet packet to remove the noise in the collected bearing signal and then combined it with the LMD method to extract the fault feature. The results show that this method can effectively extract fault features.
Based on the above analysis, a fault feature extraction method based on local mean decomposition (LMD) and wavelet packet denoising is proposed in this paper. Firstly, the vibration signal of the check valve was decomposed by LMD, and the K-L divergence of each AM-FM component was obtained. The practical component signal was selected for reconstruction through the comparative analysis with the set threshold. Then, wavelet packet transform was used to denoise the reconstructed signal to reduce the noise interference. Finally, Hilbert envelope spectrum analysis asper formed on the denoised signal to extract the fault signal features. The effectiveness of the proposed method was verified by analyzing the actual fault data of the check valve.
The rest of the paper is organized as follows: In Section 2, we introduce the basic principle of the LMD algorithm and K-L divergence and describe the process of PF component selection. In Section 3 and Section 4, we introduce the basic principles of Hilbert envelope demodulation and wavelet packet denoising. In Section 5, we describe the modeling process of check valve fault feature extraction based on LMD and wavelet packet denoising. Section 6 is experimental analysis. The effectiveness of the method proposed in this paper was verified by the collected actual fault data of the check valve. Section 7 concludes the paper.
2. LMD Algorithm Based on K-L Divergence
2.1. LMD Algorithm
LMD is a time-frequency analysis method proposed by Smith. Its principle is to decompose the signal into product function components of different frequencies and a margin, and each component is obtained by multiplying a pure FM signal and envelope signal. If the original signal is x(t), the decomposition step can be described in the following form.
(1) Calculate all local extreme points of the original signal x(t), and then calculate the average value mi of adjacent local extreme points ni and ni+1:
The moving average method is used to smooth the line composed of mi, and the local mean function m11(t) can be obtained.
(2) The envelope estimation value is calculated according to the adjacent extreme points ni and ni+1:
Similarly, the envelope estimation function a11(t) is obtained by the moving average method.
(3) The local mean function m11(t) is separated from the original signal x(t).
(4) Divide h11(t) by a11(t) to obtain FM signal s11(t)
When 12(t) = 1, s11(t) is a standard pure FM signal, and when 12(t) is not equal to 1, s11(t) is taken as the original data, and the above processes repeated. Until is met, the pure FM signal s1n(t) is calculated, as shown in the following formula:
The conditions for iteration termination are as follows:
(5) Calculate the envelope signal:
(6) The product function can be obtained by multiplying the pure FM signal s1n(t) and the envelope signal
(7) Separate from x(t) and find the signal . Then, repeat the above steps k times. When becomes a monotone function, the operation is terminated.
The following formula can be obtained by combining all PF components and recombining.
From the above description, it can be seen that the LMD is an adaptive decomposition method based on the local extreme points of the signal itself. The decomposition process is a multi-cycle iterative process.
2.2. PF Component Selection Based on K-L Divergence
Several PF components obtained by LMD have a different correlation with the original signal. To effectively screen component signals, appropriate screening methods must be adopted. K-L divergence is called directional divergence, describing the difference between the two probability distributions [18]. Let the two probability distributions be and , then the K-L distance is defined as follows:
The K-L divergence values of and are:
The vibration signals collected in the equipment characterize the vibration of the equipment. Therefore, assuming that the probabilities between the two signals are and , the closer the vibration between them, the closer and will be, and the smaller the K-L divergence value will be.
Since several PF components are obtained through LMD, the solution of K-L divergence for the original signal and component decomposed by the LMD algorithm is as follows:
(1) Solve the probability distribution of the above two signals and let the function be the kernel density estimation of signal X:
where is the kernel function, which usually uses the Gaussian kernel function, which is , and h is a given positive number. Similarly, can be obtained in the above way.
(2) The K-L distances and are obtained by substituting the probability distributions of signal and signal into Formula (12).
(3) By substituting the calculated and into Formula (13), the corresponding K-L divergence can be obtained.
(4) Normalize all calculated K-L divergence values.
(5) Filter according to the preset threshold. If the component is less than the threshold, it will be regarded as the component containing an obvious fault signal. According to the data obtained in this study, the set threshold is 0.03.
3. Hilbert Envelope Demodulation
The Hilbert envelope demodulation method mainly converts the actual signal into an analytical signal by Hilbert transform and then takes the modulus to obtain its envelope. Assuming that the signal x(t) has amplitude modulation envelope A(t) and phase modulation function , its expression is as follows:
The Hilbert transform of signal x(t) can be an approximately 90° phase shift of x(t):
Construct the analytical signal Z(t) so that:
By calculating the modulus of the above formula, the following formula can be obtained:
In the above formula, is the envelope of the signal.
4. Principle of Wavelet Packet Denoising
As one of the more detailed signal analysis methods, the advantage of wavelet packet transform is that it can adaptively select the corresponding frequency band and divide the frequency band at multiple levels [19,20]. For a one-dimensional signal containing noise, it can be described as the following formula:
where is the actual signal, is the signal containing noise, and is noise. The process of wavelet packet denoising is as follows:
(1) Determine the corresponding wavelet base and decomposition level, and then start wavelet packet decomposition;
(2) According to the established entropy standard, the optimal tree is obtained, and the optimal wavelet basis is determined;
(3) The appropriate threshold is selected, and the high-frequency coefficients with different decomposition scales are quantified at the same time;
(4) The signal reconstruction operation is carried out according to the decomposition coefficients and quantization coefficients of the N-th layer wavelet packet.
5. Fault Feature Extraction Model of Check Valve Based on Local Mean Decomposition Wavelet Packet Denoising
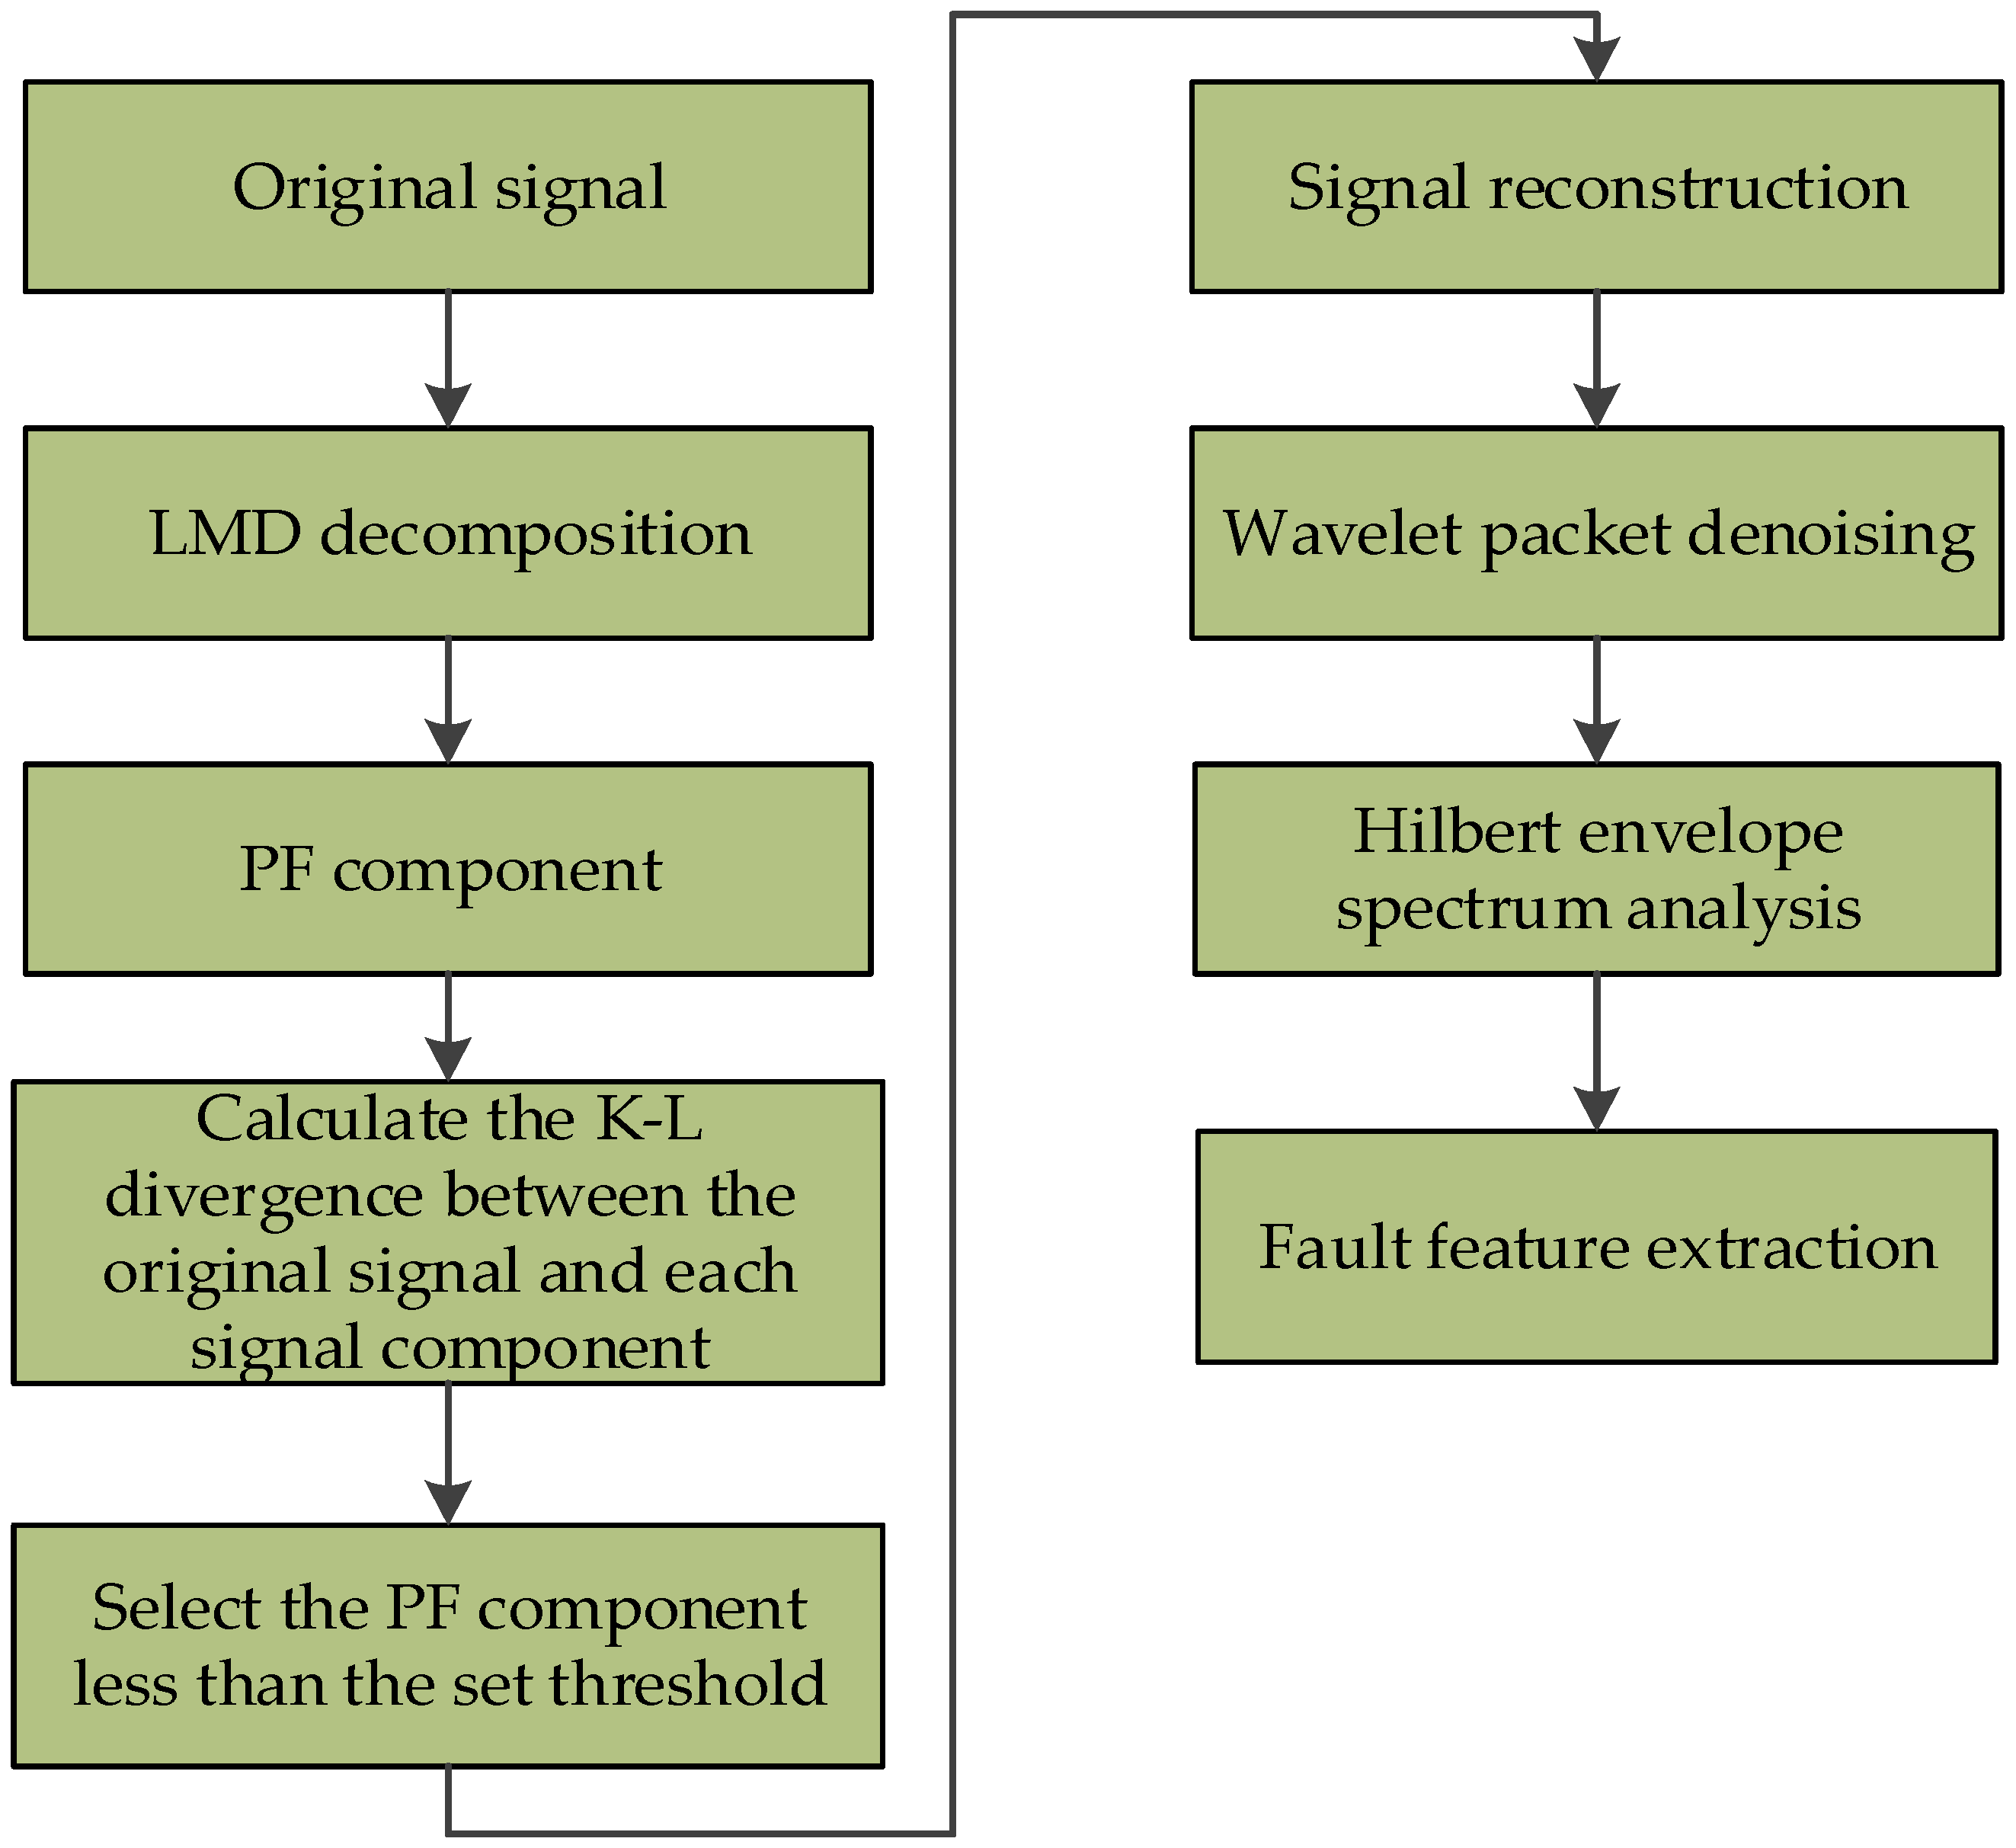
Based on the above theoretical analysis, a check valve fault feature extraction method based on local mean decomposition wavelet packet denoising is proposed in this paper. The research outline of the proposed method is shown in Figure 2, and the method implementation process is shown in Figure 3. The specific steps are as follows:
(1) The experimental failure data of wear breakdown of check valve are selected, and then the above samples are decomposed into several PF components by LMD decomposition.
(2) According to the calculation method of K-L divergence, the K-L divergence between the original signal and each PF component obtained by decomposition is calculated. Then, all K-L divergence values are normalized.
(3) According to the set threshold, the calculated K-L divergence value is compared with it, and then any PF component less than the threshold is filtered.
(4) The filtered PF components are reconstructed, and then wavelet packet denoising is carried out.
(5) Hilbert envelope demodulation is performed on the denoised signal.
6. Experimental Analysis
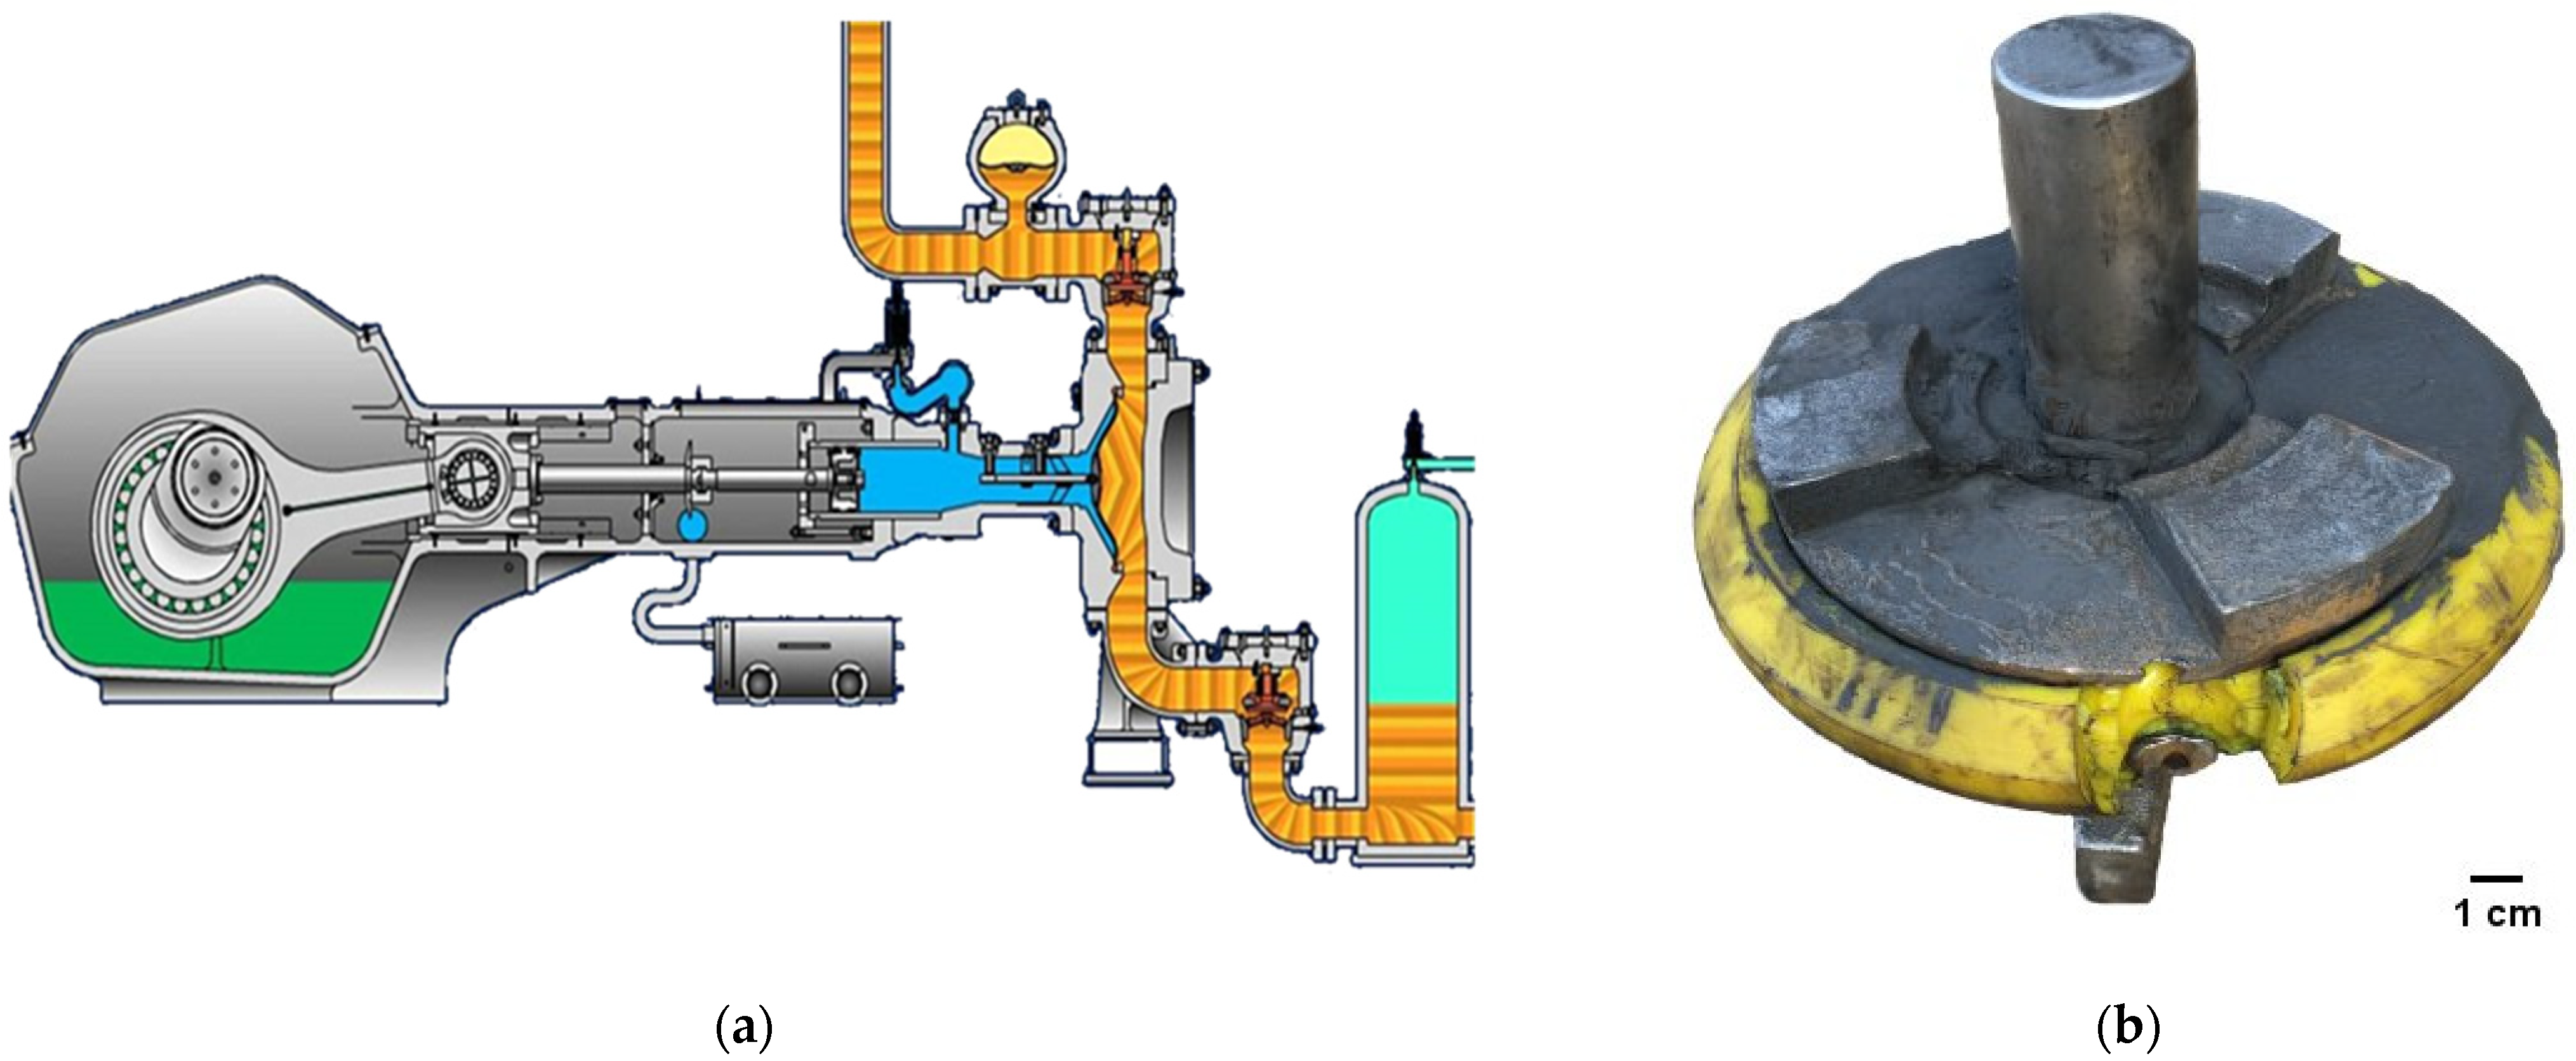
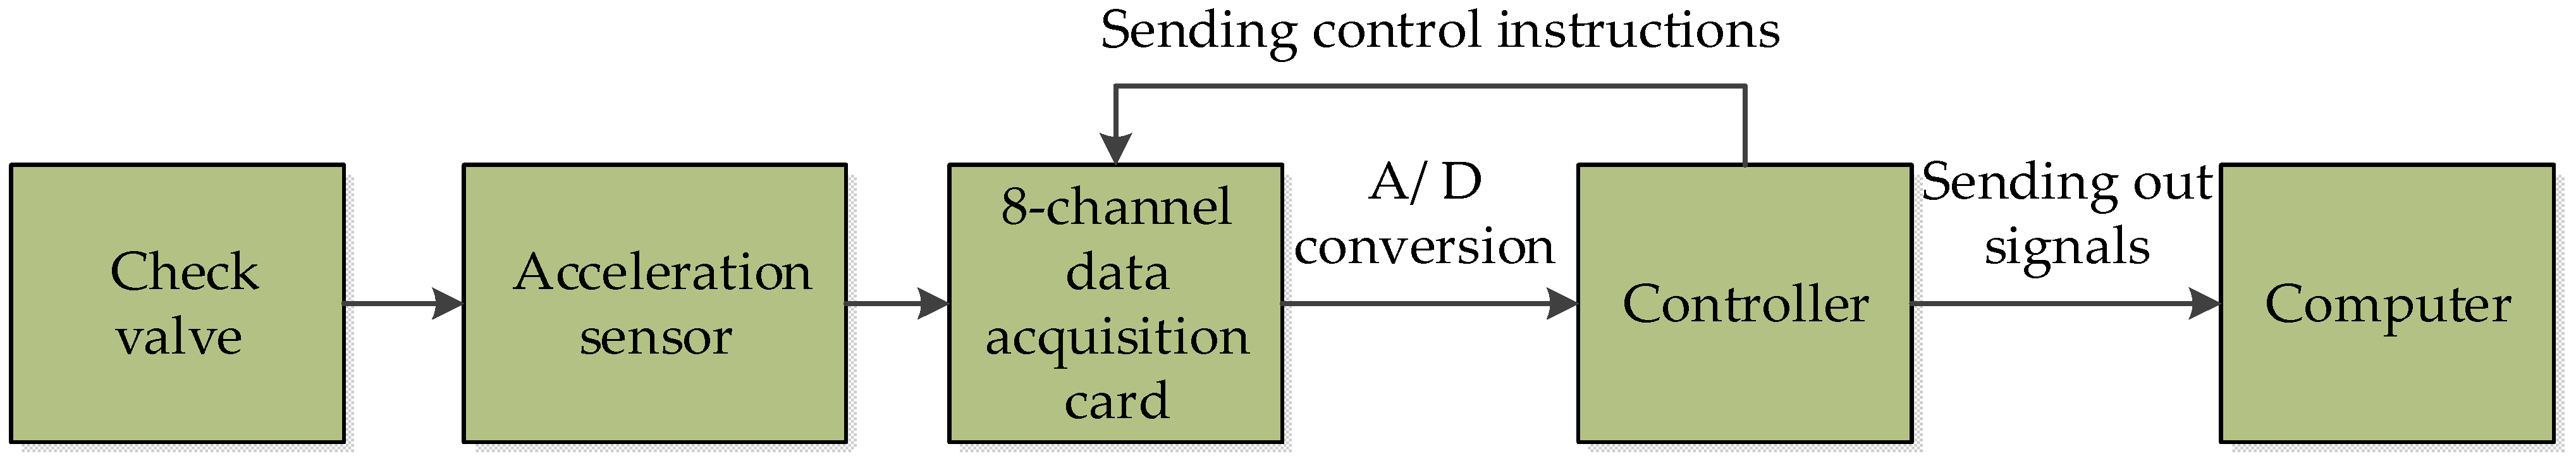
The field data of the high-pressure diaphragm pump check valve obtained by the data acquisition system of a slurry transmission pipeline in Western China were used in the experiment. The diaphragm pump used in the slurry transmission pipeline pump station was of the TZPM series, and the data acquisition card used was the PXIe-3342 eight-channel acquisition card. Through the acceleration sensor arranged outside the diaphragm pump, the vibration signal was collected and transmitted to the computer. Then, the collected data of the check valve in the wear fault state were analyzed to extract its fault characteristics. The Schematic diagram of high-pressure diaphragm pump and fault check valve is shown in Figure 4 [22]. The vibration signal acquisition system diagram of check valve is shown in Figure 5 [22].
In the check valve, wear breakdown caused by coarse particles stuck in the valve is very common. The check valve of the high-pressure diaphragm pump has a cone-valve-type structure, and the main components are the valve body, valve core, and spring. Among them, the “valve core spring” constitutes a low-damping oscillation system, and its frequency is:
where k is the stiffness value of the spring; and ms is the equivalent mass value. Set the spring stiffness as follows according to the activity of the plunger of the pump
where f is the frequency of normal operation of the high-pressure diaphragm pump. Its normal operating frequency is 0.5~0.517 Hz, and the frequency of the spring valve core system fp = 2f, namely, 1~1.034 Hz. The check valve will show the corresponding fault fundamental frequency and double frequency when it fails.
The check valves of the high-pressure diaphragm pump are matched by the feed valve and discharge valve in pairs. Therefore, the normal operation vibration signal and fault vibration signal of a group of feed and discharge check valves were randomly selected as a group of experimental data for analysis. The fault data of the check valve used in the experiment were the data when a wear breakdown fault occurred. The sampling frequency of this experiment was 2560 Hz, and the sampling data length was 10,240. After A/D conversion, the collected vibration acceleration signal was input into the computer through the controller.
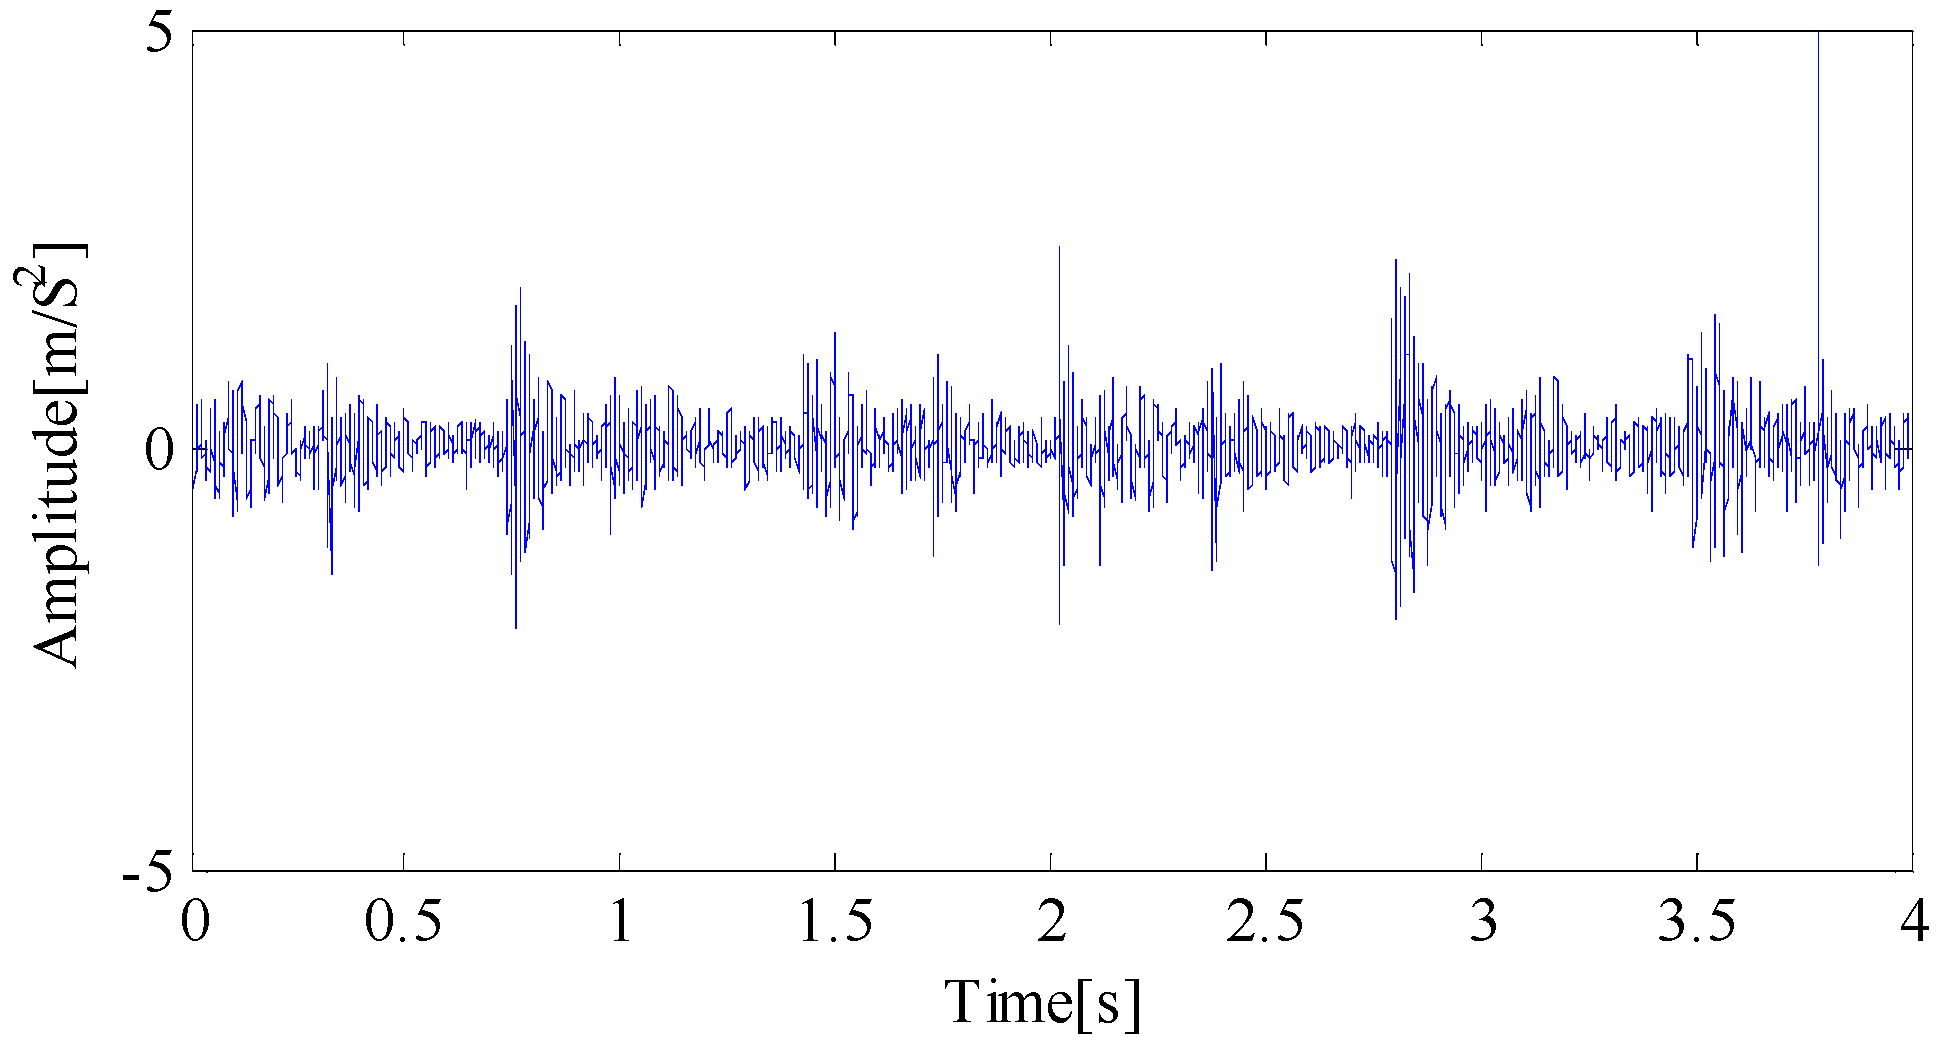
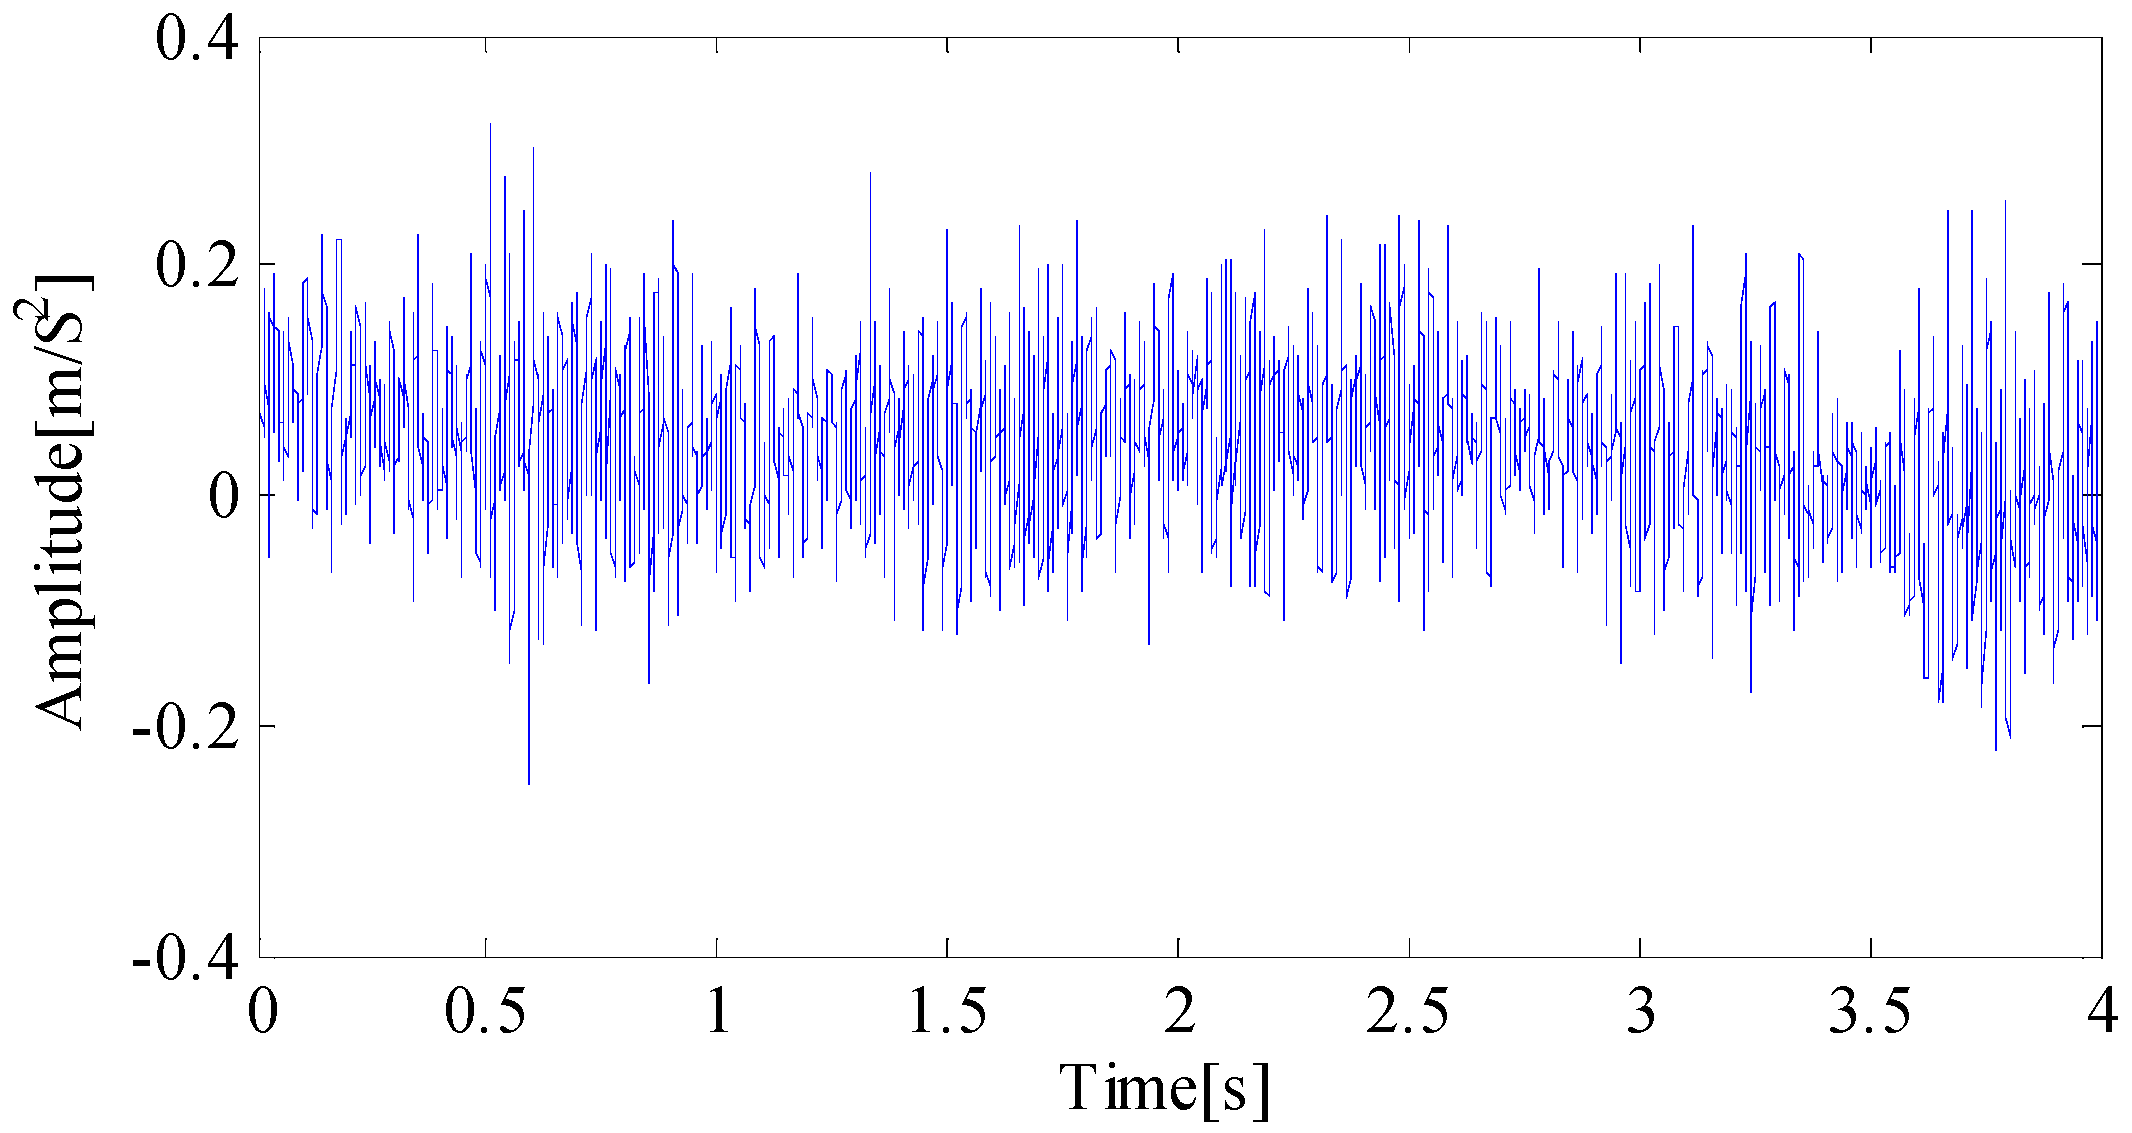
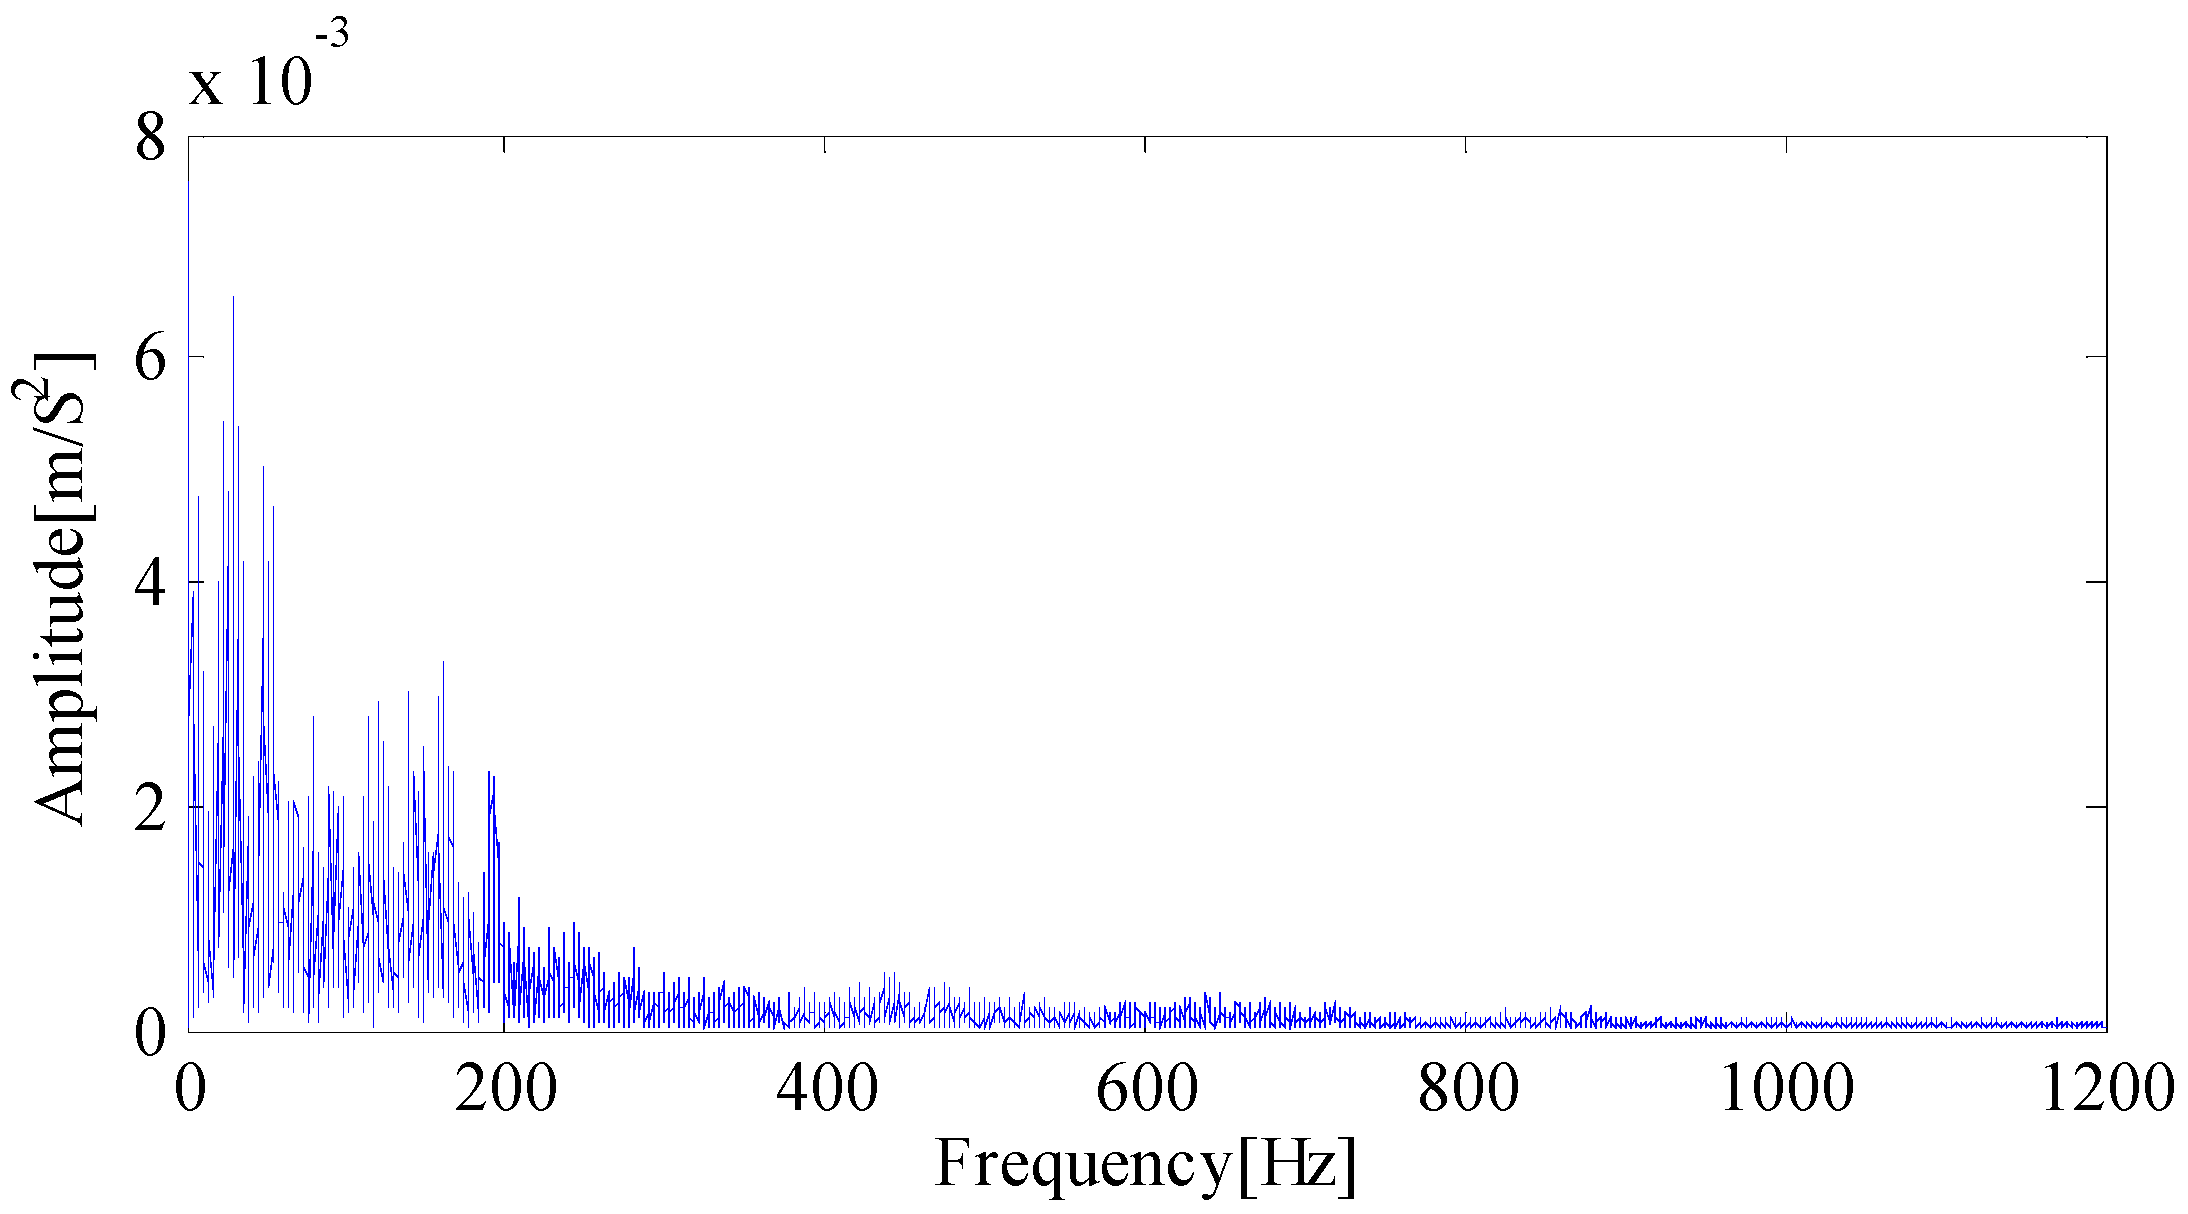
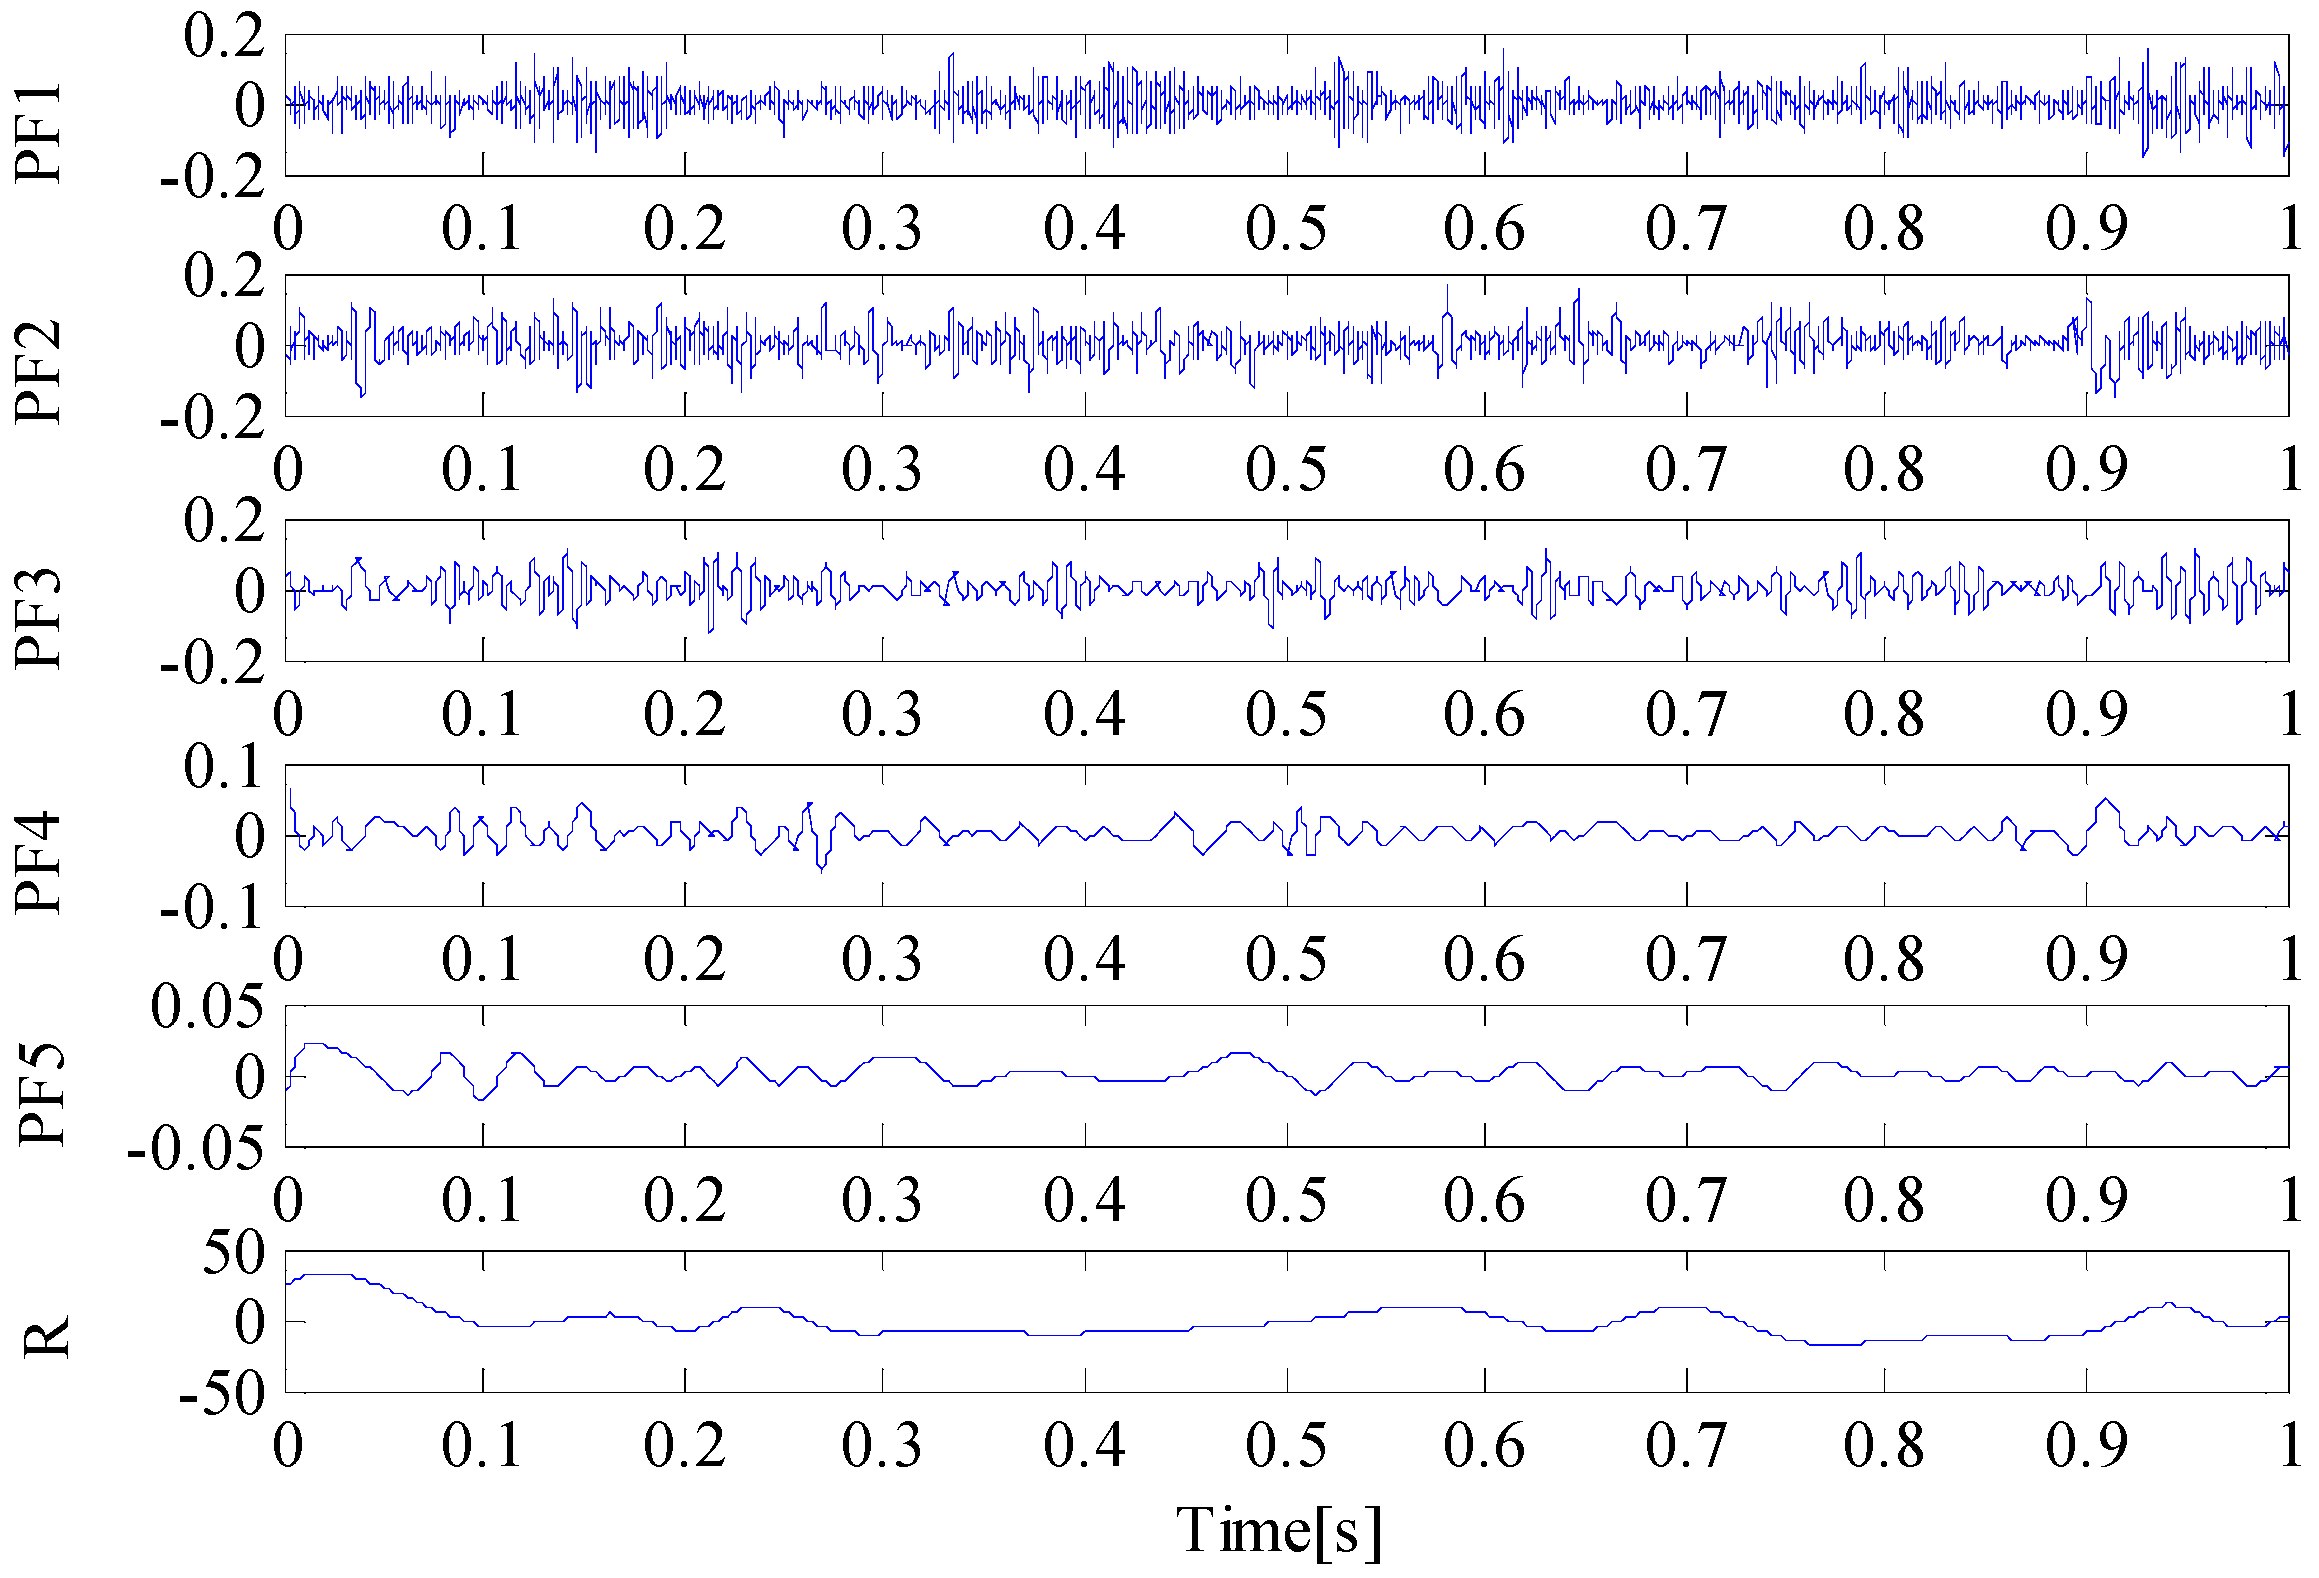
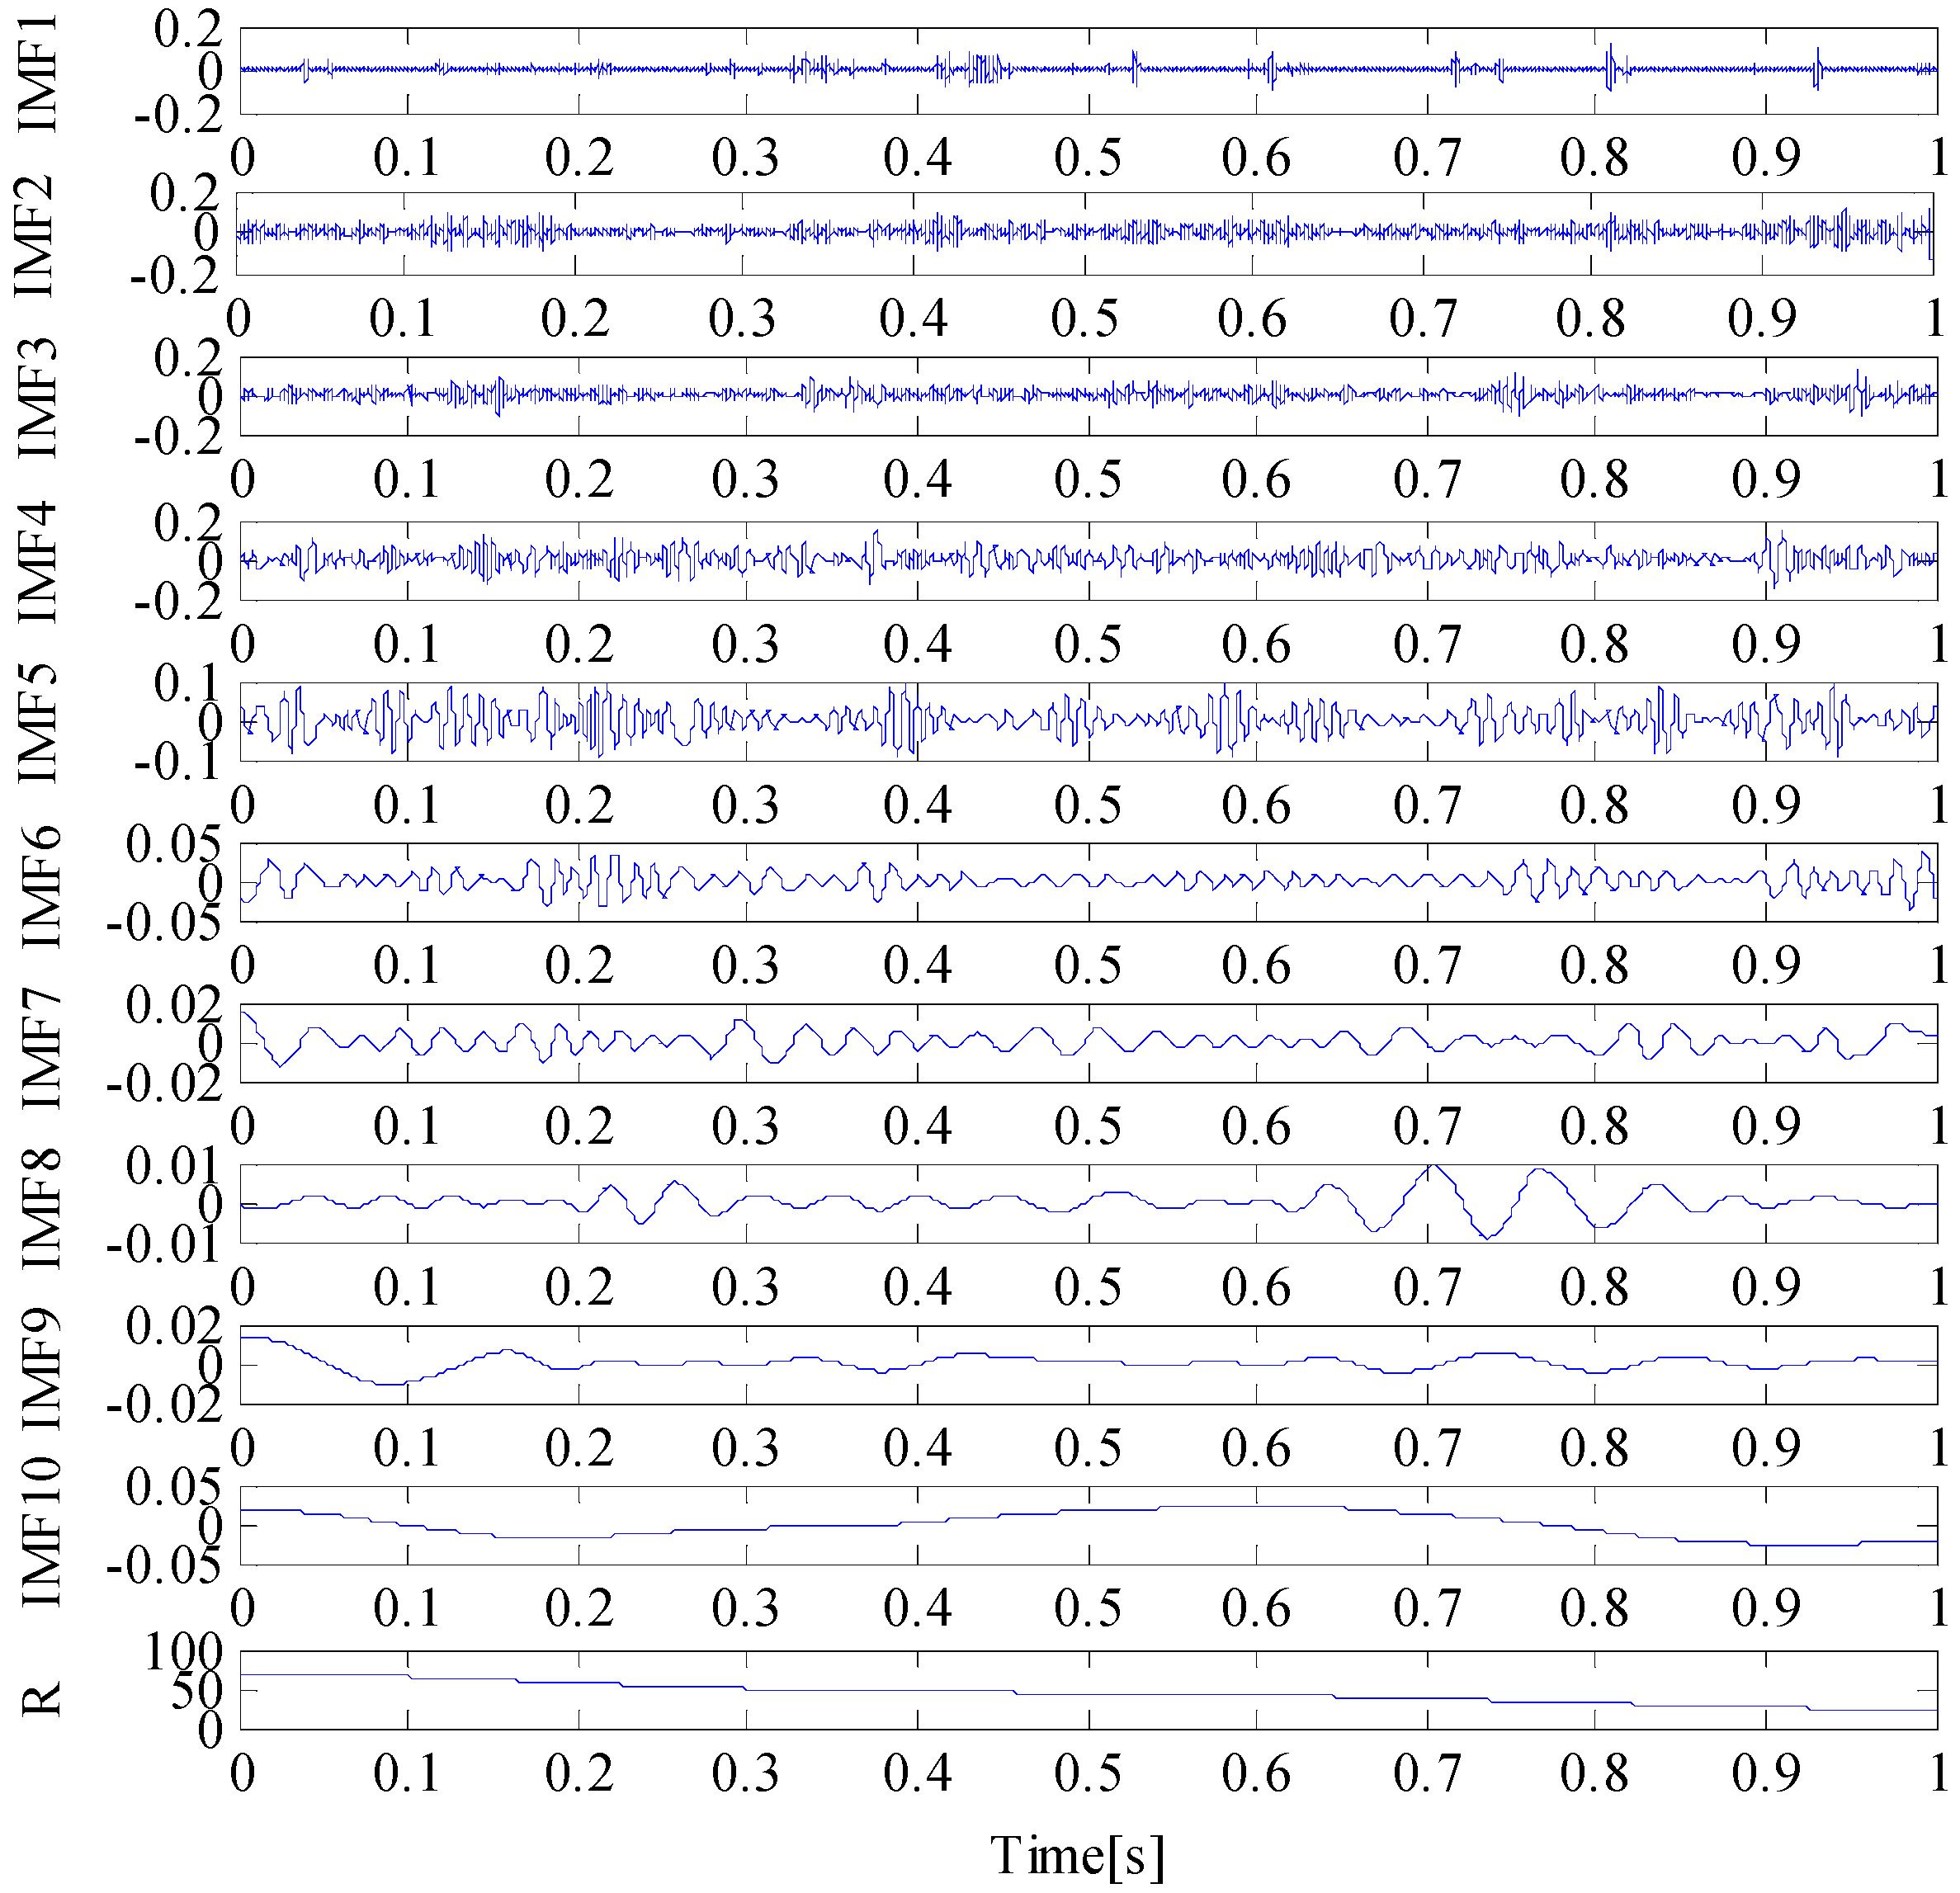
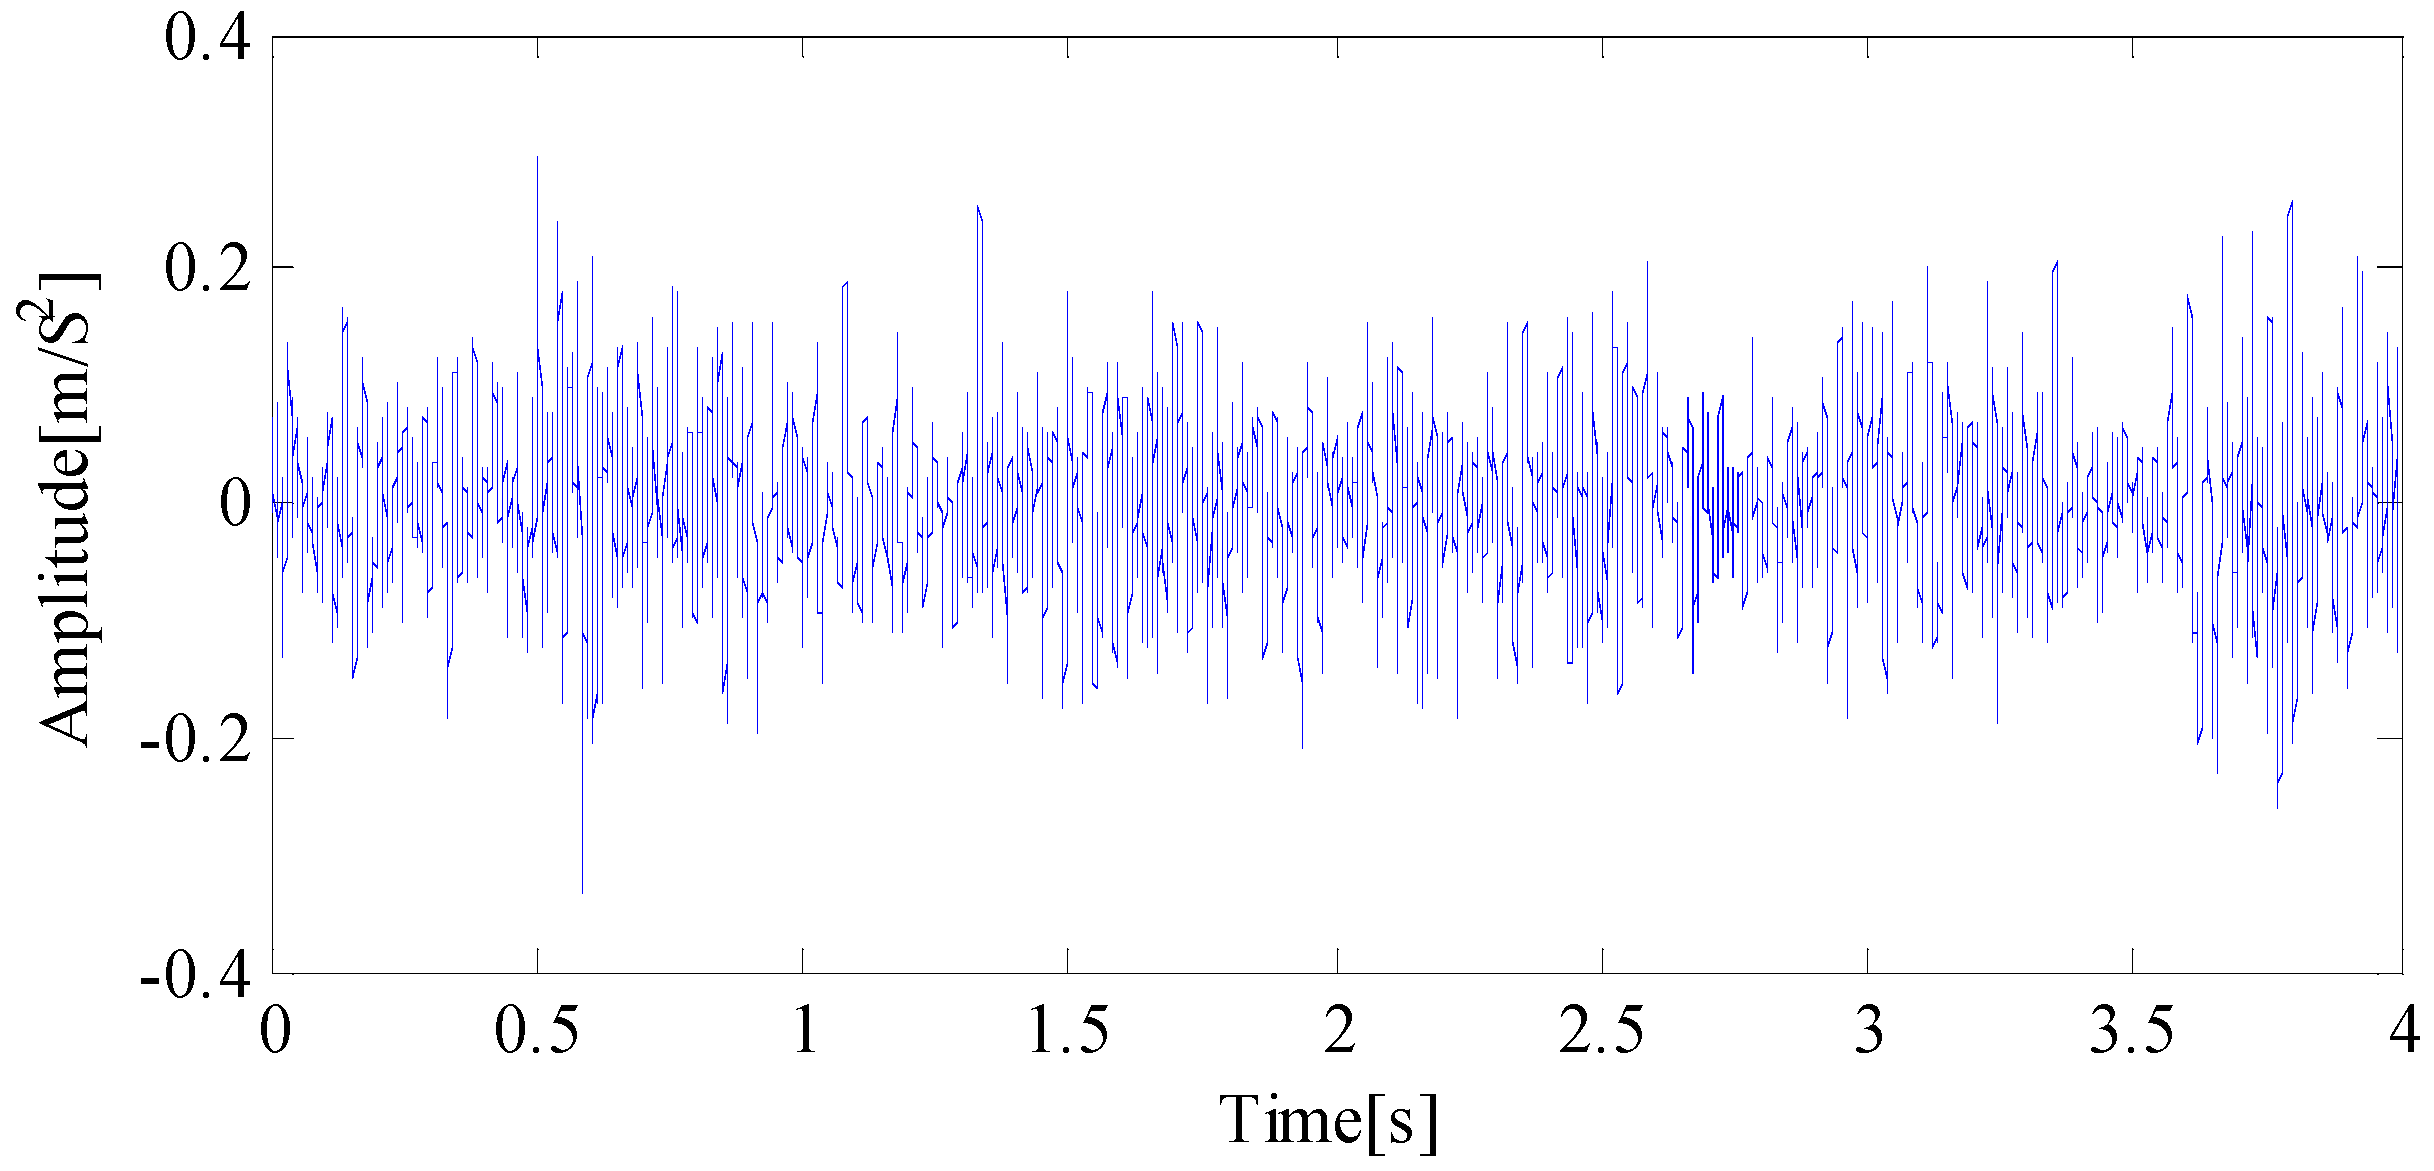
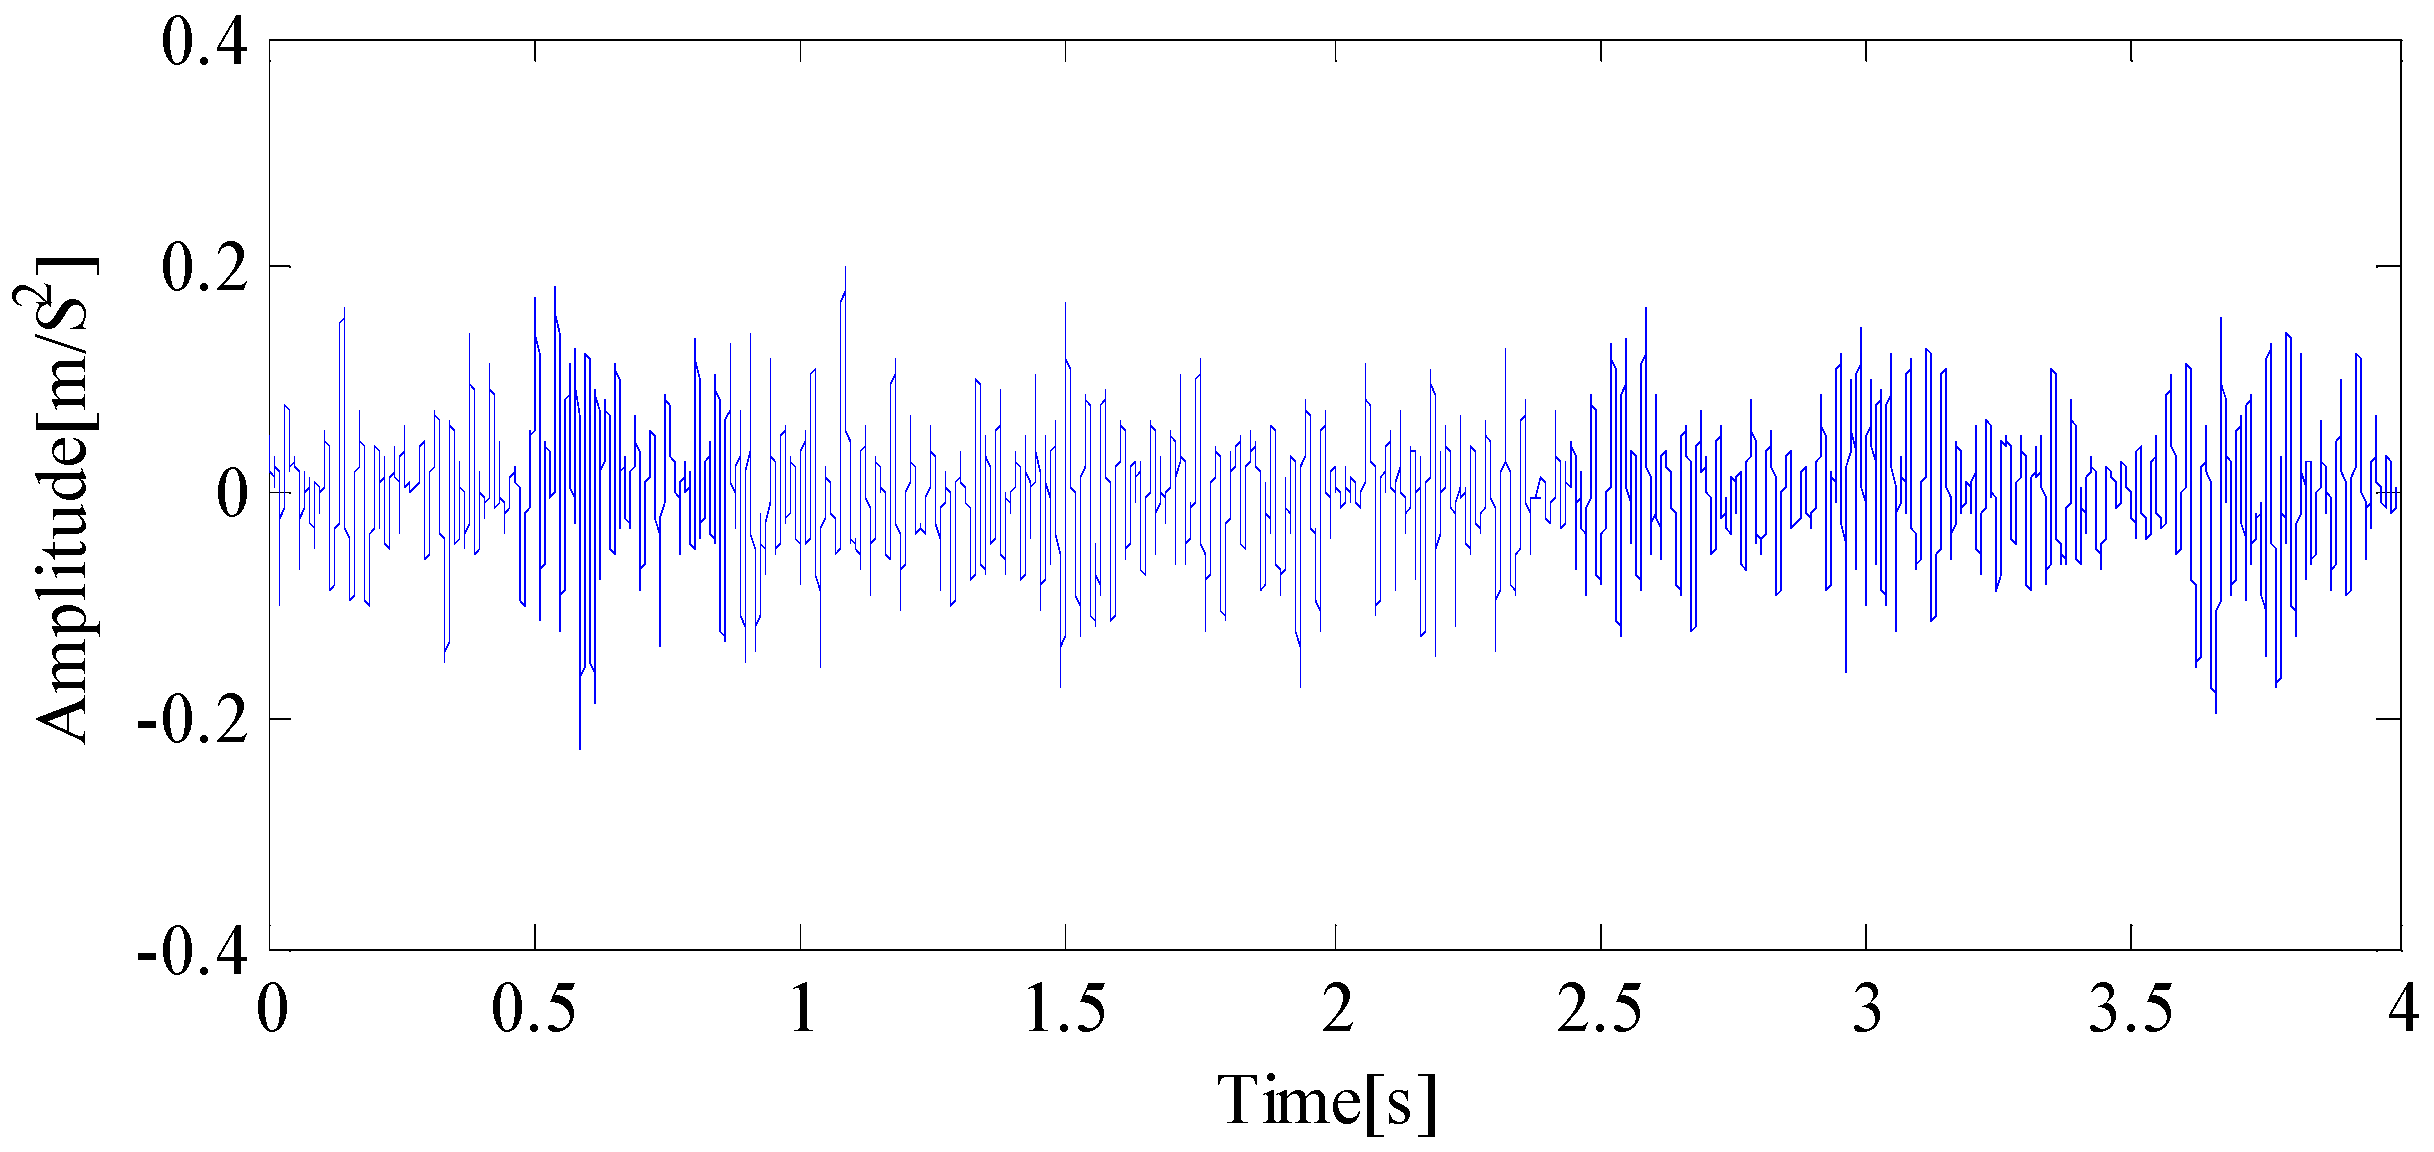
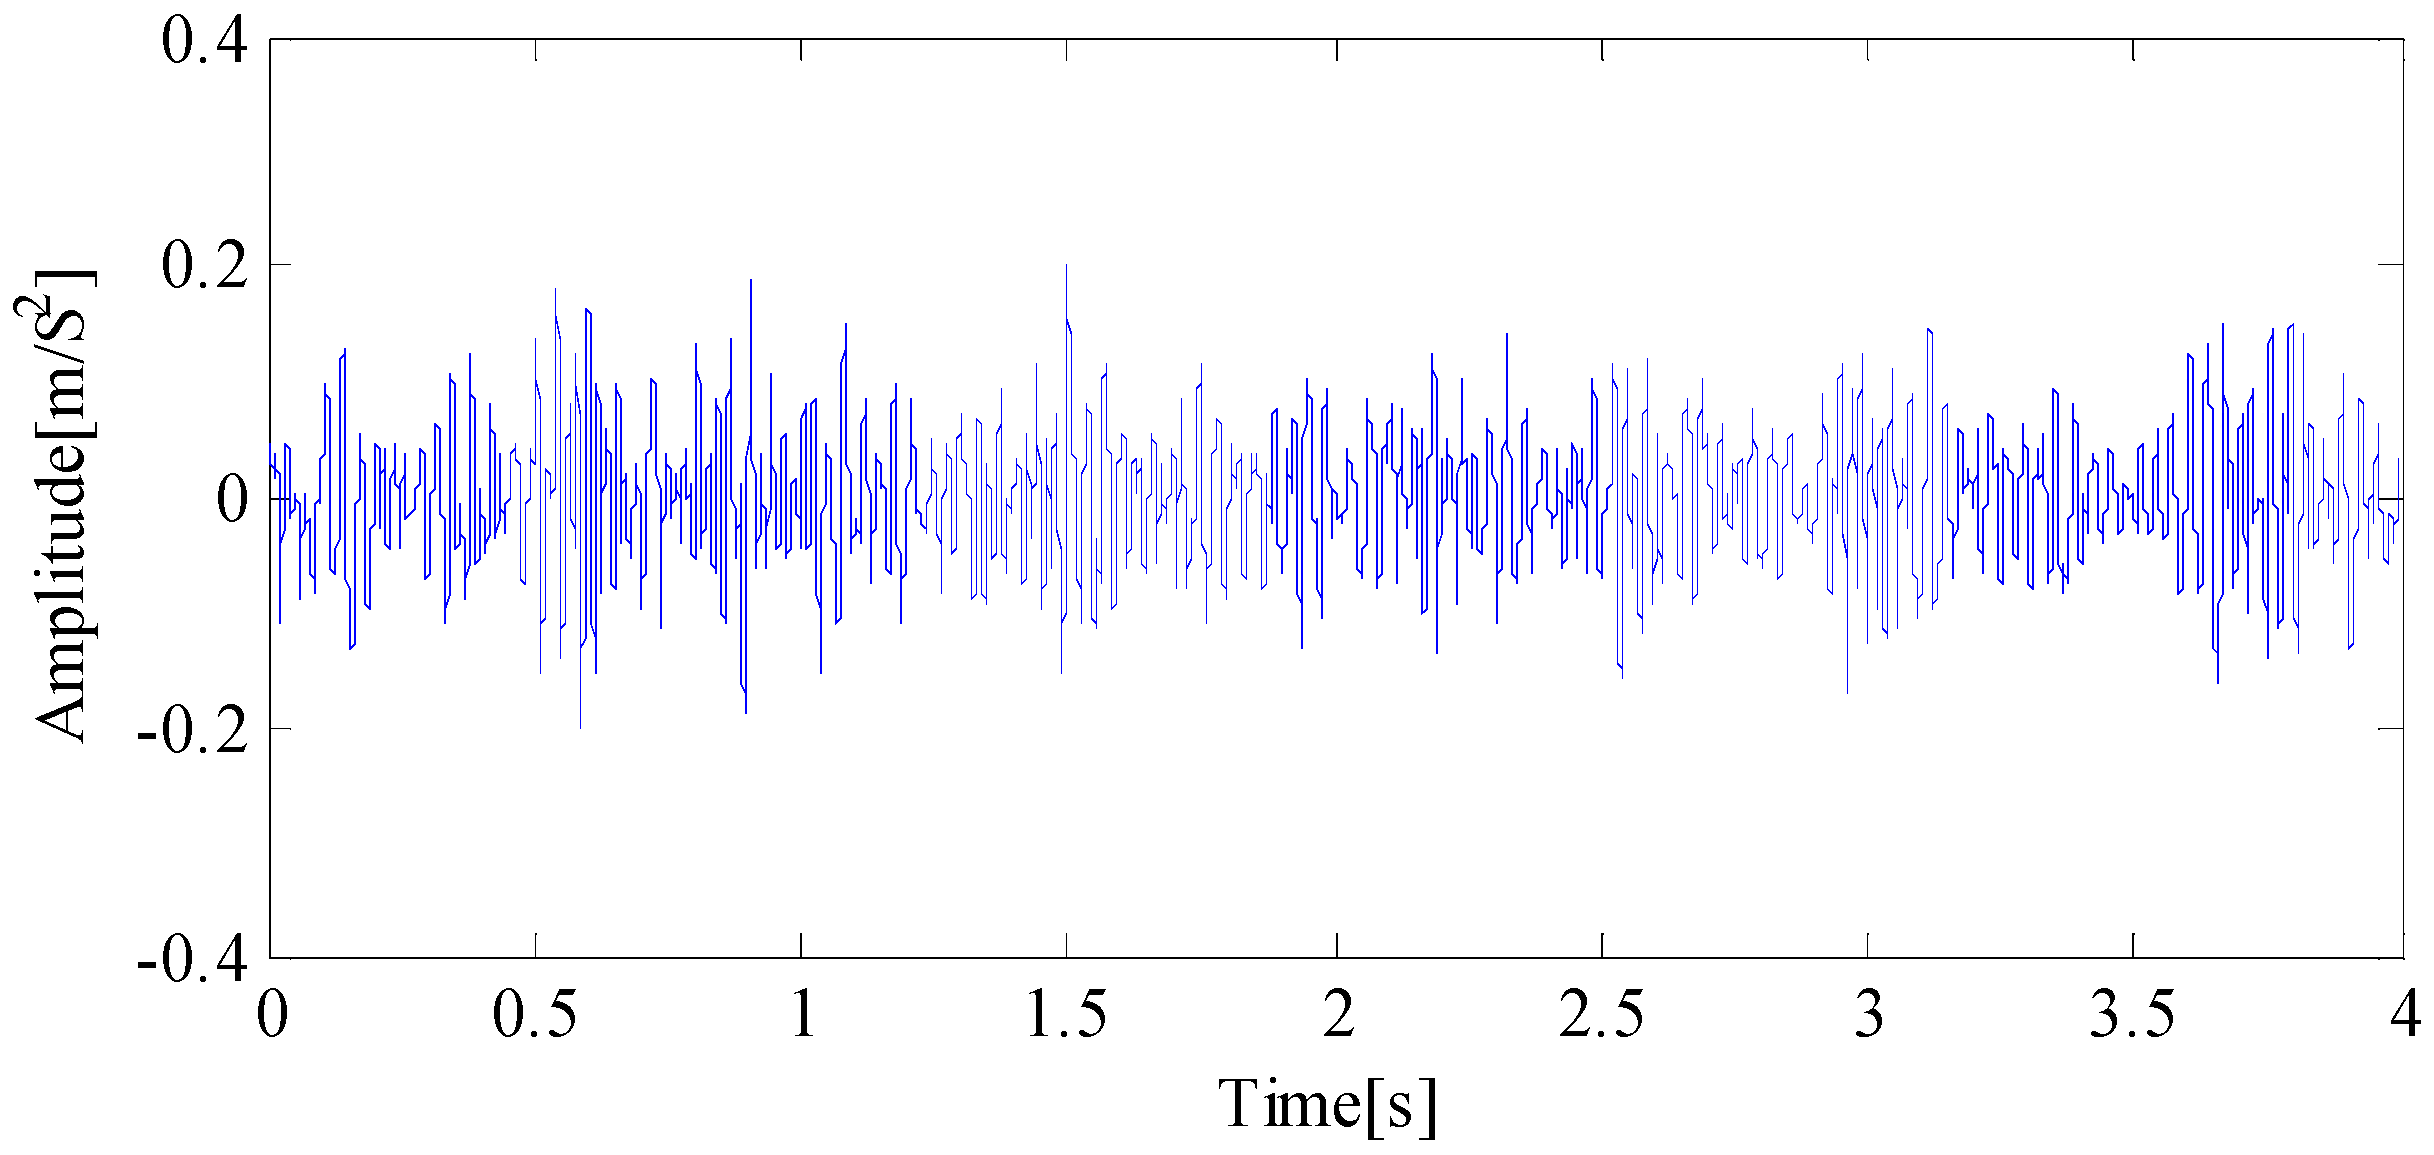
Next, the normal operation and fault operation data of 10,240 check valves were taken for analysis. Figure 6 is the time-domain waveform diagram of the normal operation of the check valve. Figure 7 and Figure 8 are the time-domain diagram and frequency-domain diagram when the check valve fails, respectively. Through comparative analysis of Figure 6 and Figure 7, it can be seen that when the check valve was in normal operation, the vibration signal contains prominent impact components, and the amplitude was relatively more apparent. It can be seen from Figure 8 that the operating frequency was mainly within 200 Hz, but it was impossible to conclude whether it had a fault. To further analyze the signal, LMD decomposition was carried out first. As shown in Figure 9, the original signal was decomposed into several PF components and a residual component. To compare the decomposition effect, empirical mode decomposition (EMD) was used to decompose the signal. The results are shown in Figure 10. After EMD decomposition, more component signals were obtained, and there was a certain degree of modal aliasing. Through comparison, it can be seen that the effect of signal decomposition using the LMD method was better, as it reduced the phenomenon of mode aliasing to a great extent. Therefore, the obtained signal component contained more information. At the same time, LMD had fewer iterations. Next, we calculated the K-L divergence of all component signals decomposed by LMD, EMD, and the original signal. The results are shown in Table 1 and Table 2.
As shown in Table 1, the K-L divergence values of PF1, PF2, and PF3 were relatively small and less than the set threshold. Because the discrimination of K-L divergence was relatively obvious, it can be seen that their correlation with the original signal was relatively high. From the calculation results of kurtosis values, the kurtosis values of PF1 to PF5 were all greater than 3. Although it can be seen that the above component signals contained more impact components, this led to some difficulties in the signal screening. Therefore, the filtered PF1, PF2, and PF3 components were reconstructed according to the K-L divergence value. It can be seen from Table 2 that the K-L divergence values of IMF2, IMF 3, IMF4, and IMF 5 were less than the set threshold, which shows that their correlation with the original signal is relatively high. At the same time, by analyzing the calculation results of the kurtosis values from IMF 1 to IMF 10, it can be seen that the kurtosis values of other IMF components were greater than 3, except IMF 6, IMF 9, and IMF 10, which also made it difficult to screen effective signals. Similarly, the above component signal was selected for reconstruction according to the K-L divergence value calculation result. Although the above filtered signal components were highly correlated with the original signal, they contained a large number of fault signal features, and a large number of noise interference components. Therefore, to reduce the impact of noise on fault feature extraction, it was necessary to denoise the reconstructed signal by using the wavelet packet. In this experiment, the sym5 wavelet was used to decompose and reconstruct the reconstructed signal. The reconstructed signal waveform is shown in Figure 11, and the signal time-domain waveform after noise reduction is shown in Figure 12 and Figure 13.
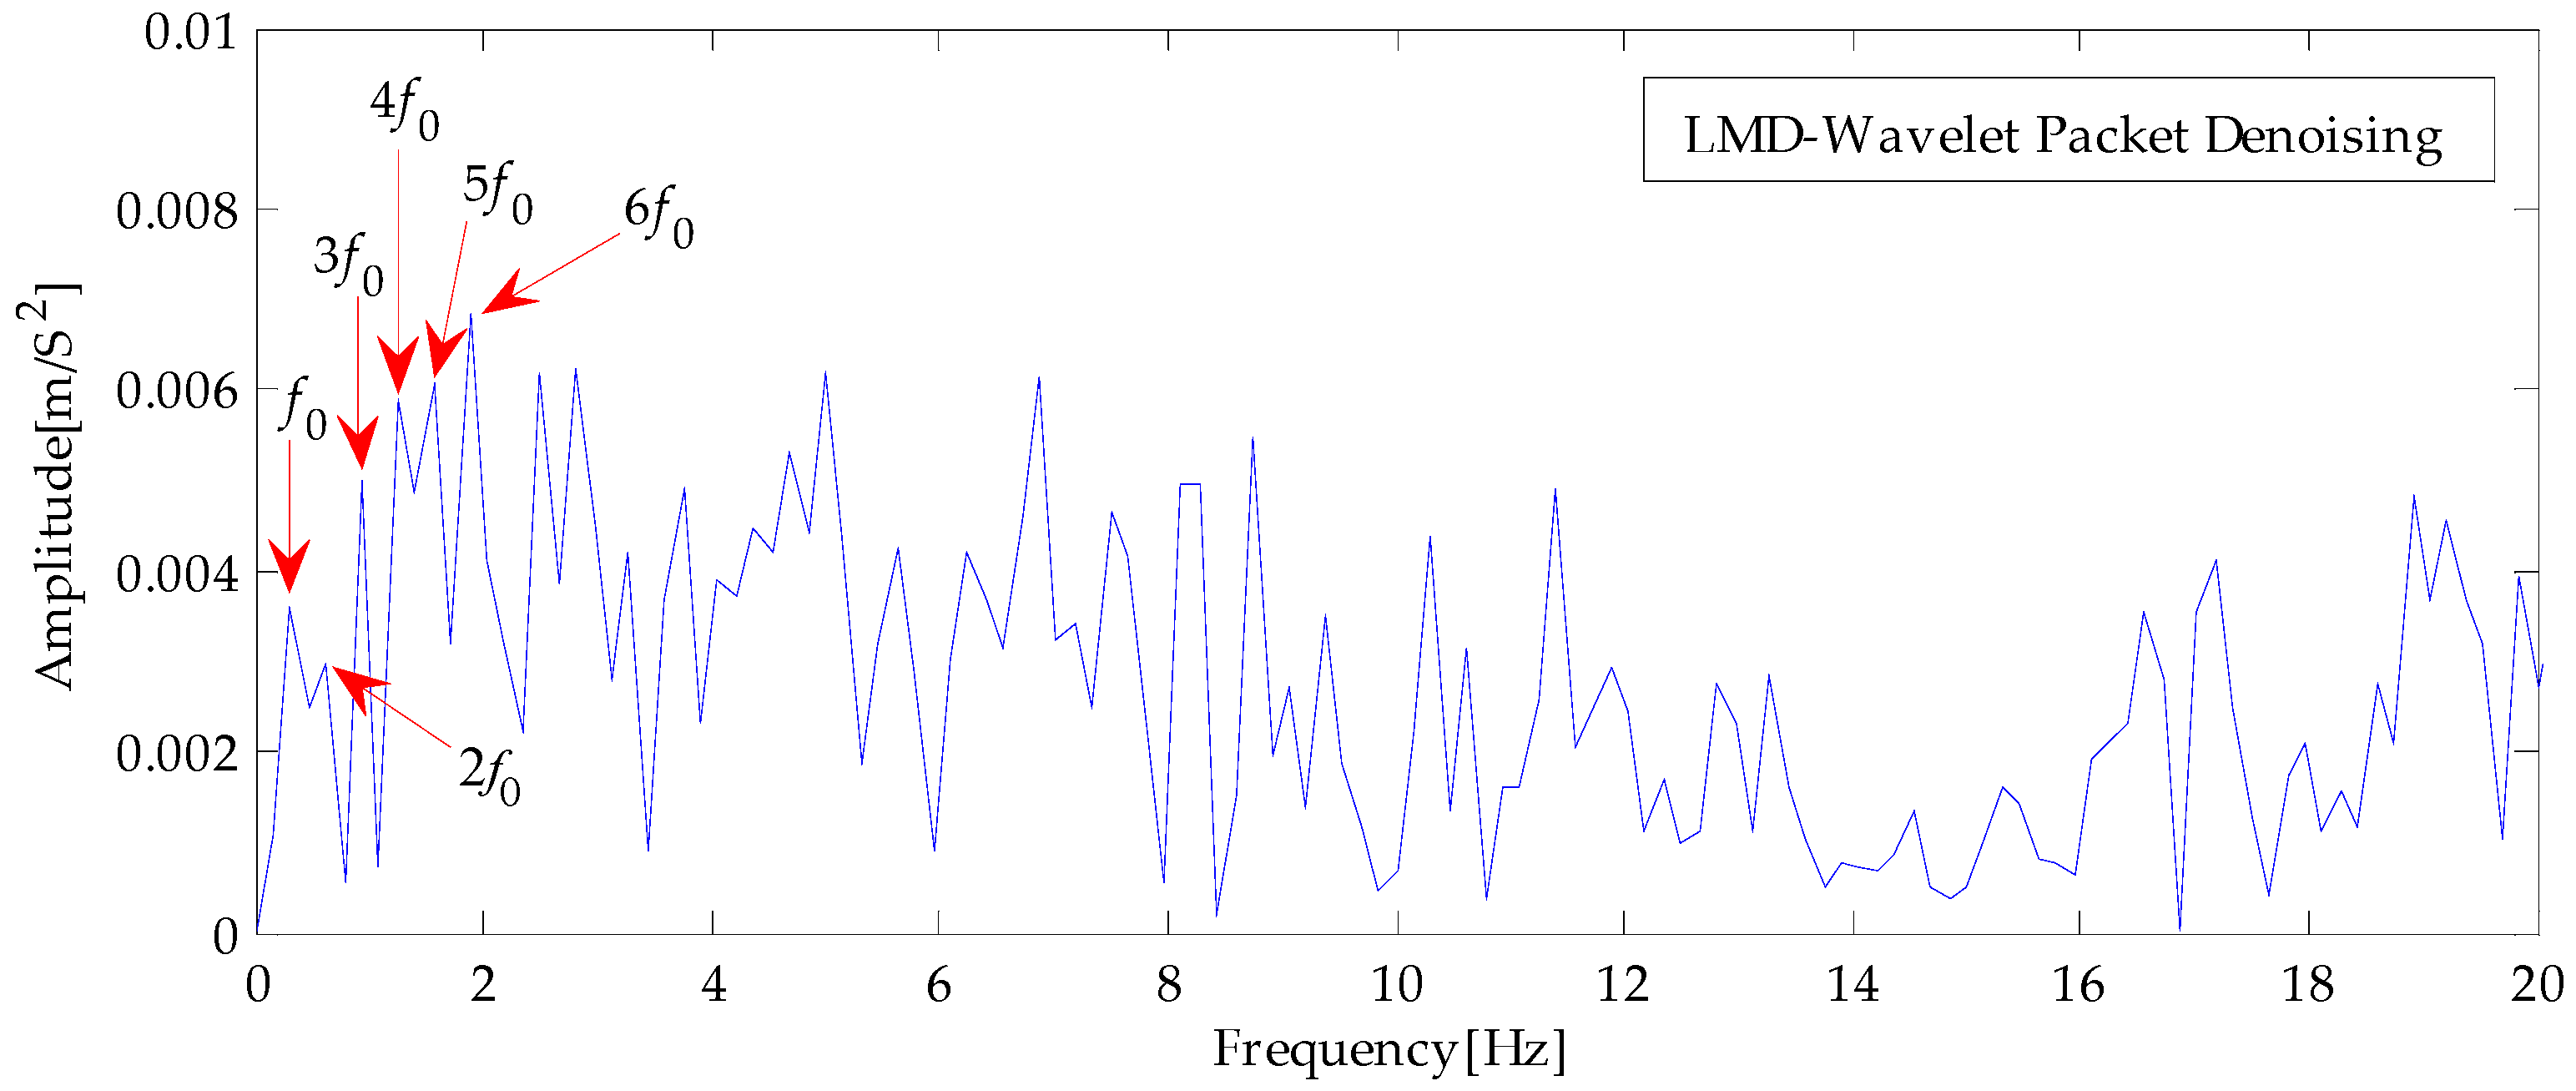
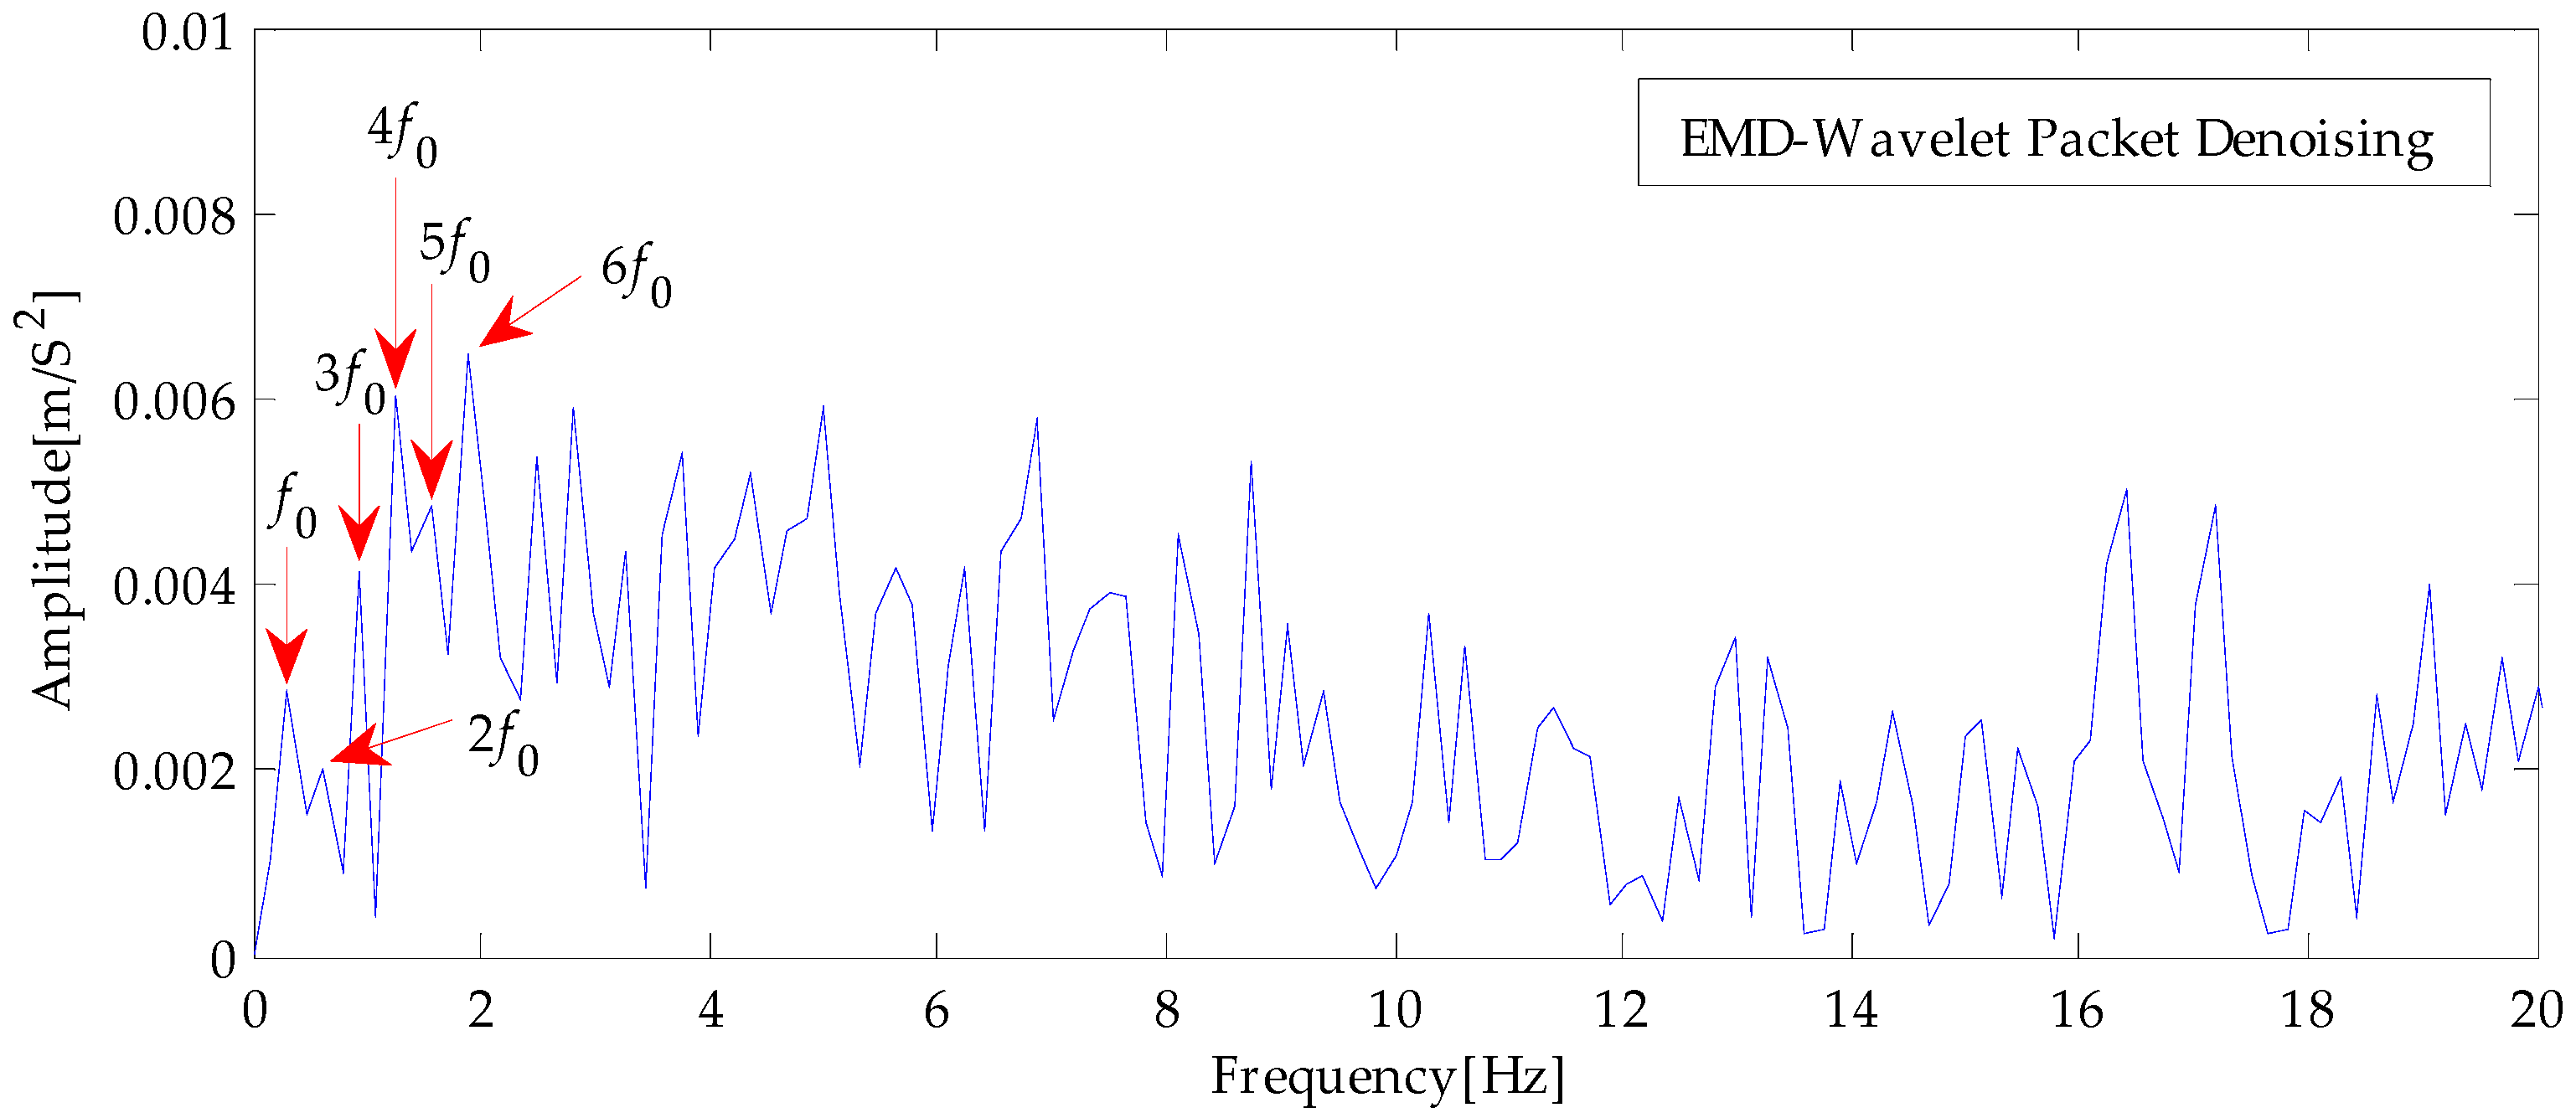
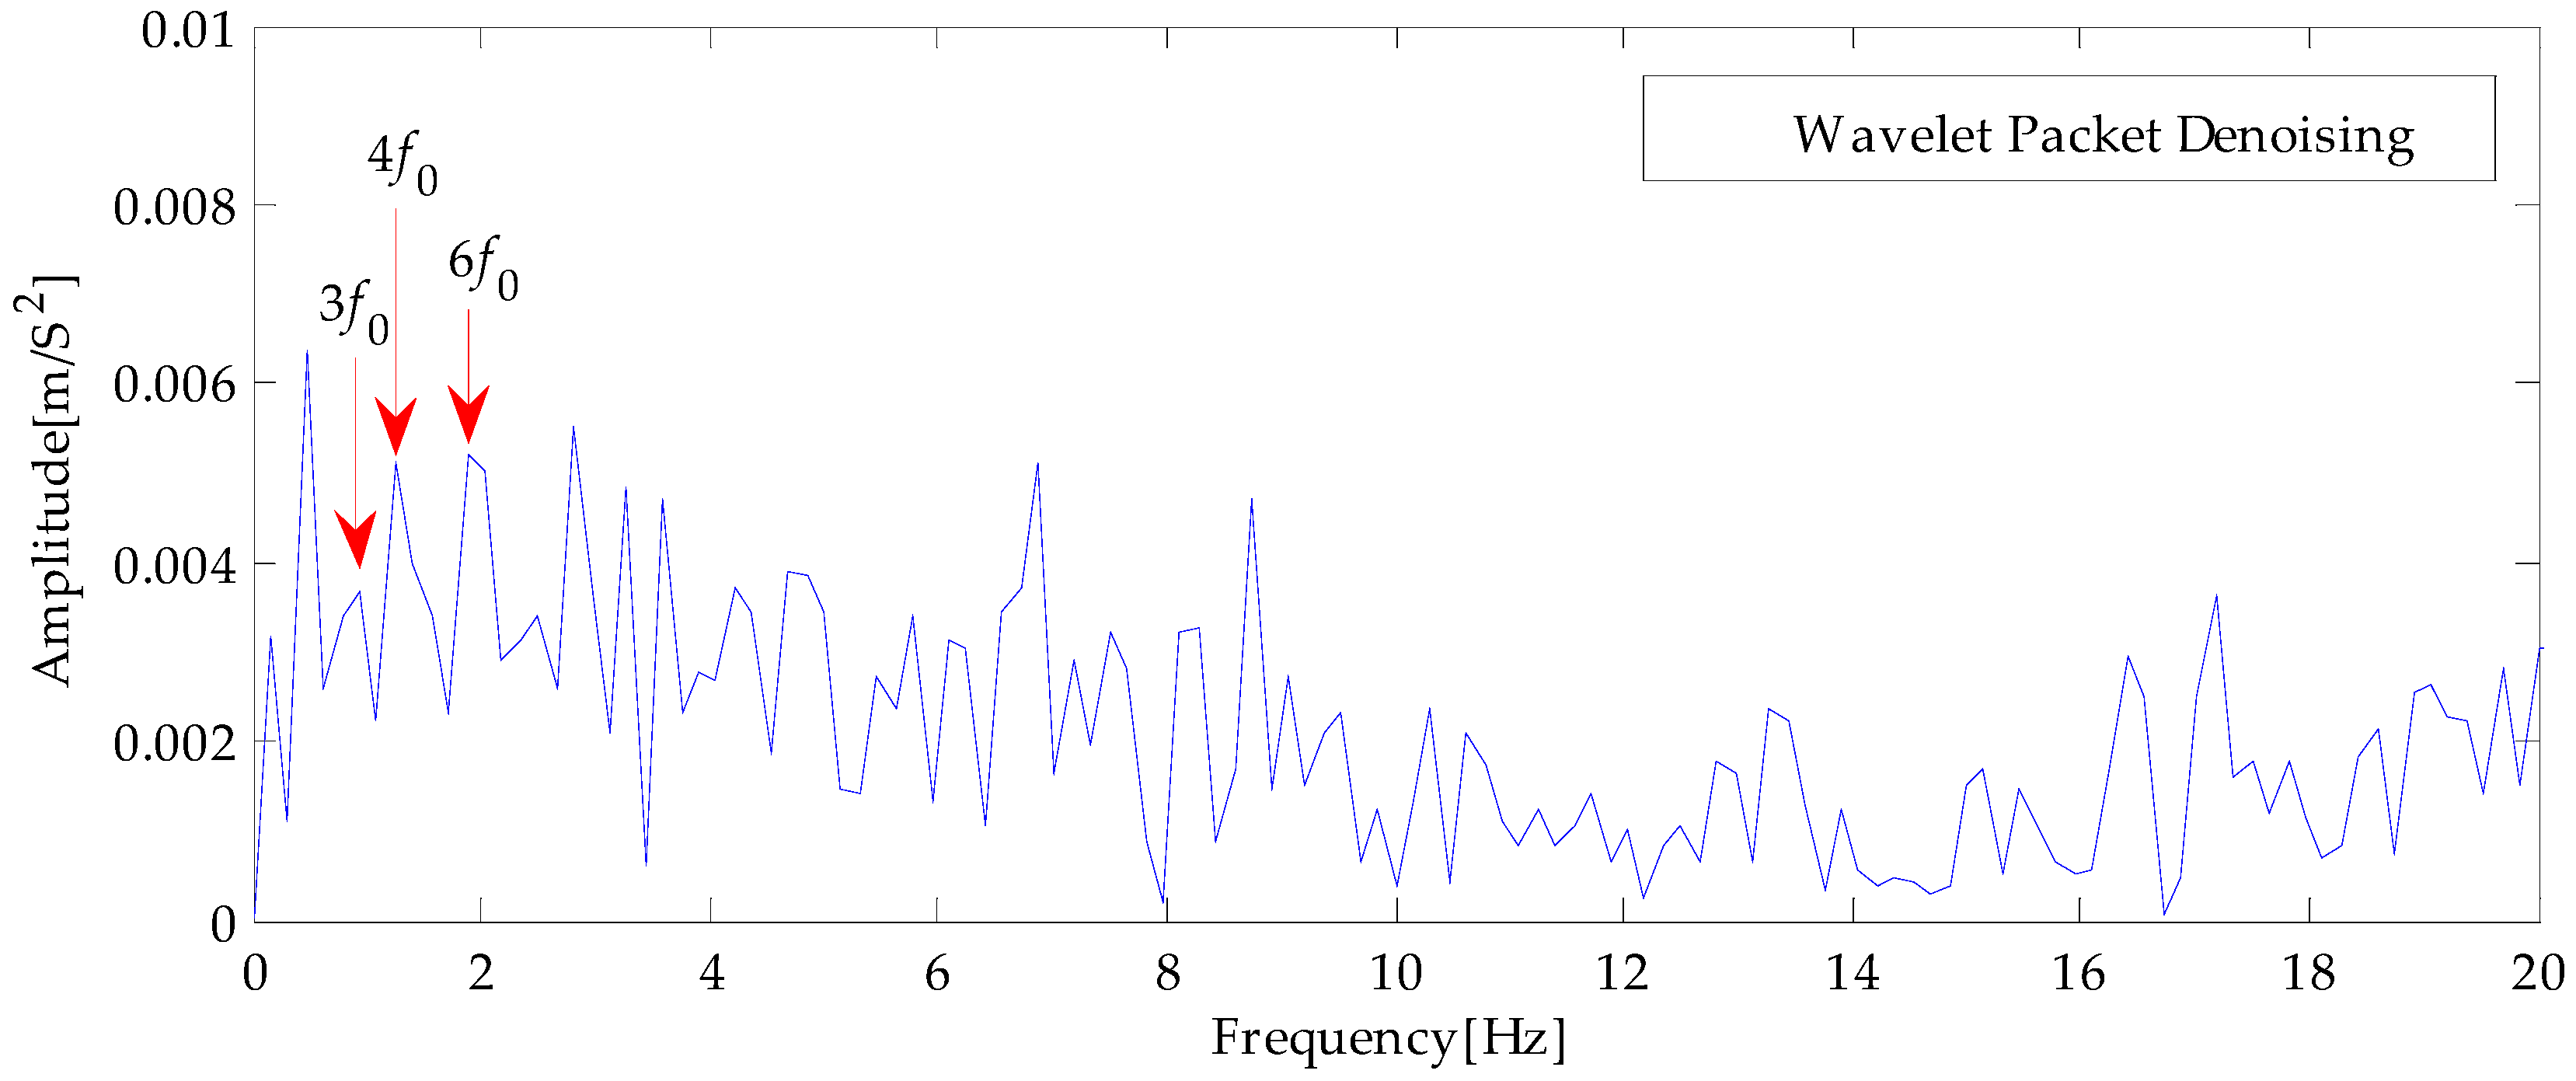
Next, the signals based on LMD wavelet packet denoising, EMD wavelet packet denoising, and wavelet packet direct denoising were demodulated by the Hilbert envelope to compare and analyze the experimental results. The results are shown in Figure 14, Figure 15 and Figure 16. It is evident from Figure 14 that there was a fundamental frequency (0.3125 Hz) and a second to sixth doubling frequency of the fundamental frequency components (0.625, 0.9375, 1.25, 1.563 and 1.875 Hz) in the envelope spectrum of the signal after noise reduction based on the LMD wavelet packet, which has become the dominant frequency of the vibration signal, indicating that a fault occurred at this time. As shown in Figure 15, fundamental frequency (0.3125 Hz) and other doubling frequency components appeared in the envelope spectrum of the signal denoised based on the EMD wavelet packet. Still, the overall amplitude was less than the result seen in Figure 14. As shown in Figure 16, frequency components such as fundamental frequency (0.3125 Hz) and the second doubling frequency (0.625 Hz) cannot be found in the envelope spectrum of the signal after wavelet packet noise reduction. Therefore, using the proposed method for fault feature extraction can achieve better results.
The above qualitative analysis shows that the proposed method has better fault feature extraction advantages than the other two methods. Firstly, the fault signal of the check valve was decomposed by the time-frequency analysis method, and the complete time-frequency distribution information of the signal was obtained. Compared with EMD, LMD suppresses the endpoint effect brought about by EMD, eliminates the problems of over envelope, under envelope, and mode aliasing caused by EMD, and the decomposed signal can retain the information of the original signal. Secondly, this research introduces K-L divergence as the screening criterion in the signal screening link. Through the calculation and comparative analysis of the K-L divergence value of each signal component, it can be seen that the discrimination of K-L divergence was relatively more significant, which is helpful to better select the signal component. Then, the subsequent reconstructed signal was denoised by a wavelet packet to filter out the noise interference. Finally, through the Hilbert envelope spectrum analysis, it can be seen that the characteristic frequency in the Hilbert envelope spectrum obtained by the proposed method was relatively apparent. Meanwhile, six frequency components such as the fundamental frequency of the fault and the second to sixth doubling frequency of the fundamental frequency can be extracted.
7. Conclusions
Aiming at the non-stationary characteristics of the fault vibration signal of the check valve of a high-pressure diaphragm pump, a fault feature extraction method for the check valve based on LMD and wavelet packet analysis is proposed. Finally, the fault features were extracted by Hilbert envelope spectrum analysis. The following conclusions were obtained:
(1) The LMD method was used to decompose the original signal adaptively, which overcomes the problems of modal aliasing and endpoint effect caused by the EMD method, and there were fewer iterations. The component signal decomposed by this method only included five PF components and one residual signal component. In comparison, the EMD obtained more signal components (ten IMF components and one residual component). The results show that LMD can extract the time-frequency information of the signal more effectively and provide a guarantee for the screening of subsequent signal components.
(2) By calculating the K-L divergence value of each signal component and selecting the signal component whose K-L divergence value is less than the set threshold as the effective component signal, the problem of poor discrimination caused by the traditional kurtosis method can be avoided. Because the original signal contains more impact components, it is difficult to screen the signal. The experimental results in the signal screening link show that three signal components, PF1, PF2, and PF3, can be extracted as effective signals by using K-L divergence. If the kurtosis criterion is used for filtering, all signal component values are more significant than the set threshold and cannot be selected. At the same time, in the comparative experiment using EMD, four signal components were successfully selected as effective signals by using K-L divergence. When kurtosis was used as the screening criterion, it also showed the defect of poor discrimination.
(3) By further comparing and analyzing the envelope spectra after wavelet packet denoising based on different methods, it can be seen that the peak of characteristic frequency in the Hilbert envelope spectrum obtained by using the method proposed in this paper is relatively apparent. The experimental results of envelope spectrum analysis show that six frequency components such as the fundamental frequency of check valve fault and the frequency from the second to sixth doubling frequency of the fundamental frequency can be extracted by using the method proposed in this paper. Although the above six frequency components were also extracted by the EMD wavelet packet joint denoising method, the overall amplitude was lower than that obtained by the method proposed in this paper. In addition, three frequency components such as 0.3125, 0.625 and 1.563 Hz cannot be found in the envelope spectrum of the signal denoised by wavelet packet alone. It is proved that the method proposed in this paper can extract the fault characteristics of the check valve more effectively.
As a large reciprocating industrial equipment, a high-pressure diaphragm pump can operate under complex working conditions such as high pressure, high temperature, high corrosion, and high concentration and is more widely used in the mining, metallurgy, petroleum, and chemical industries. This paper starts with the vibration signal analysis of the check valve, the core component of the high-pressure diaphragm pump, completes the fault feature extraction based on LMD and wavelet packet analysis, and provides a new idea for the research in this field. However, it may be affected by many uncertain factors and various fault forms under actual working conditions, so the proposed method may not be well applicable. Therefore, in future work, the research group will deeply summarize the latest theory and results of the time-frequency analysis method and further improve and perfect the proposed method to extract the operation state information of the check valve more effectively.
Author Contributions
Conceptualization, J.Y. and C.Z.; Data curation, J.Y.; Formal analysis, J.Y. and C.Z.; Funding acquisition, J.Y.; Methodology, J.Y.; Software, J.Y. and C.Z.; Validation, J.Y.; Writing—review and editing, C.Z. All authors have read and agreed to the published version of the manuscript.
Funding
This work was funded by the Scientific research fund project of Baoshan University (ZKMS202101), Special Basic Cooperative Research Programs of Yunnan Provincial Undergraduate Universities’ Association (grant NO. 2019FH001-121), collaborative education project of industry university cooperation of the Ministry of Education (202102049026), 10th batches of Baoshan young and middle-aged leaders training project in academic and technical (202109), and the PhD research startup foundation of Yunnan Normal University (No. 01000205020503131).
Institutional Review Board Statement
Not applicable.
Informed Consent Statement
Informed consent was obtained from all subjects involved in the study.
Data Availability Statement
The data used to support the findings of this study are available from the corresponding author upon request.
Conflicts of Interest
The authors declare that they have no conflict of interest.
References
- Zhang, H.; Chen, G.; Liu, L. Application of Slon high-gradient vertical-ring magnetic separator to remove iron from non-metal mineral. Min. Eng. 2004, 2, 43–46. (In Chinese) [Google Scholar]
- Cattermole, K.W. The fourier transform and its applications. Electron. Power 2009, 11, 357–359. [Google Scholar] [CrossRef]
- Griffin, D.; Lim, J.S. Signal estimation from modified short-time fourier transform. IEEE Trans. Acoust. Speech Signal Process. 1984, 32, 236–243. [Google Scholar] [CrossRef]
- Georgakis, A.; Stergioulas, L.K.; Giakas, G. Wigner filtering with smooth roll-off boundary for differentiation of noisy non-stationary signals. Signal Process. 2002, 82, 1411–1415. [Google Scholar] [CrossRef]
- Huang, N.E.; Shen, Z.; Long, S.R.; Wu, M.C.; Shih, H.H.; Zheng, Q.; Yen, N.-C.; Tung, C.C.; Liu, H.H. The empirical mode decomposition and the Hilbert spectrum for nonlinear and non-stationary time series analysis. Proc. R. Soc. Lond. Ser. A Math. Phys. Eng. Sci. 1998, 454, 903–995. [Google Scholar] [CrossRef]
- Smith, J.S. The local mean decomposition and its application to EEG perception data. J. R. Soc. Interface 2005, 2, 443–454. [Google Scholar] [CrossRef]
- Dong, L.; Jiang, R.; Xu, N.; Qian, B. Research on microseismic signal denoising method based on LMD–SVD. Adv. Eng. Sci. 2019, 51, 126–136. (In Chinese) [Google Scholar]
- Wang, H.; Li, K.; Lian, J. Dynamic parametric identification for a hydropower house based on data fusion and LMD. J. Vib. Shock 2018, 37, 175–181. [Google Scholar]
- Wang, Z.; Wu, W.; Ma, W.; Zhang, J.; Wang, J.; Li, W. Fault signal extraction method of rolling bearing weak fault based on LMD-MS. J. Vib. Meas. Diagn. 2018, 38, 1014–1020. [Google Scholar]
- Gupta, P.; Singh, B. Investigation of tool chatter using local mean decomposition and artificial neural network during turning of Al 6061. Soft Comput. 2021, 25, 11151–11174. [Google Scholar] [CrossRef]
- Liao, L.; Huang, B.; Tan, Q.; Huang, K.; Ma, M.; Zhang, K. Development of an improved LMD method for the low-frequency elements extraction from turbine noise background. Energies 2020, 13, 805. [Google Scholar] [CrossRef] [Green Version]
- Huang, Y.; Wang, X.; Yang, D.; Wang, L.; Gu, J.; Zhang, X.; Wang, K. A Weld quality classification approach based on local mean decomposition and deep belief network. J. Mater. Eng. Perform. 2021, 30, 2229–2237. [Google Scholar] [CrossRef]
- Lee, C.Y.; Zhuo, G.L. Effective rotor fault diagnosis model using multilayer signal analysis and hybrid genetic binary chicken swarm optimization. Symmetry 2021, 13, 487. [Google Scholar] [CrossRef]
- Venkata, P.B.; Chinara, S. Automatic classification methods for detecting drowsiness using wavelet packet transform extracted time-domain features from single-channel EEG signal. J. Neurosci. Methods 2020, 2020, 108927. [Google Scholar]
- He, K.; Xia, Z.; Si, Y.; Lu, Q.; Peng, Y. Noise reduction of welding crack AE signal based on EMD and wave-let packet. Sensors 2020, 20, 761. [Google Scholar] [CrossRef] [PubMed] [Green Version]
- Wang, X. Optimized VMD-wavelet packet threshold denoising based on cross-correlation analysis. Int. J. Perform. Eng. 2018, 14, 2239–2247. [Google Scholar] [CrossRef] [Green Version]
- Sun, W.; Xiong, B.S.; Huang, J.P.; Mo, Y. Fault diagnosis of a rolling bearing using Wavelet packet de-noising and LMD. J. Vib. Shock 2012, 31, 153–156. [Google Scholar]
- Zhang, F.; Liu, Y.; Chen, C.; Li, Y.F.; Huang, H.Z. Fault diagnosis of rotating machinery based on kernel density estimation and Kullback-Leiblerdivergence. J. Mech. Sci. Technol. 2014, 28, 4441–4454. [Google Scholar] [CrossRef]
- Hemmati, F.; Orfali, W.; Gadala, M.S. Roller bearing acoustic signature extraction by wavelet packet transform, applications in fault detection and size estimation. Appl. Acoust. 2016, 104, 101–118. [Google Scholar] [CrossRef]
- Gómez, M.J.; Castejón, C.; Corral, E.; García-Prada, J.C. Railway axle condition monitoring technique based on wavelet packet transform features and support vector machines. Sensors 2020, 20, 3575. [Google Scholar] [CrossRef]
- Shi, X.; Qin, P.; Zhu, J.; Xu, S.; Shi, W. Lower Limb Motion Recognition Method Based on Improved Wavelet Packet Transform and Unscented Kalman Neural Network. Math. Probl. Eng. 2020, 2020, 1–16. [Google Scholar] [CrossRef] [PubMed]
- Zhou, C.; Jia, Y.; Bai, H.; Xing, L.; Yang, Y. Sliding dispersion entropy-based fault state detection for diaphragm pump parts. Coatings 2021, 11, 1536. [Google Scholar] [CrossRef]
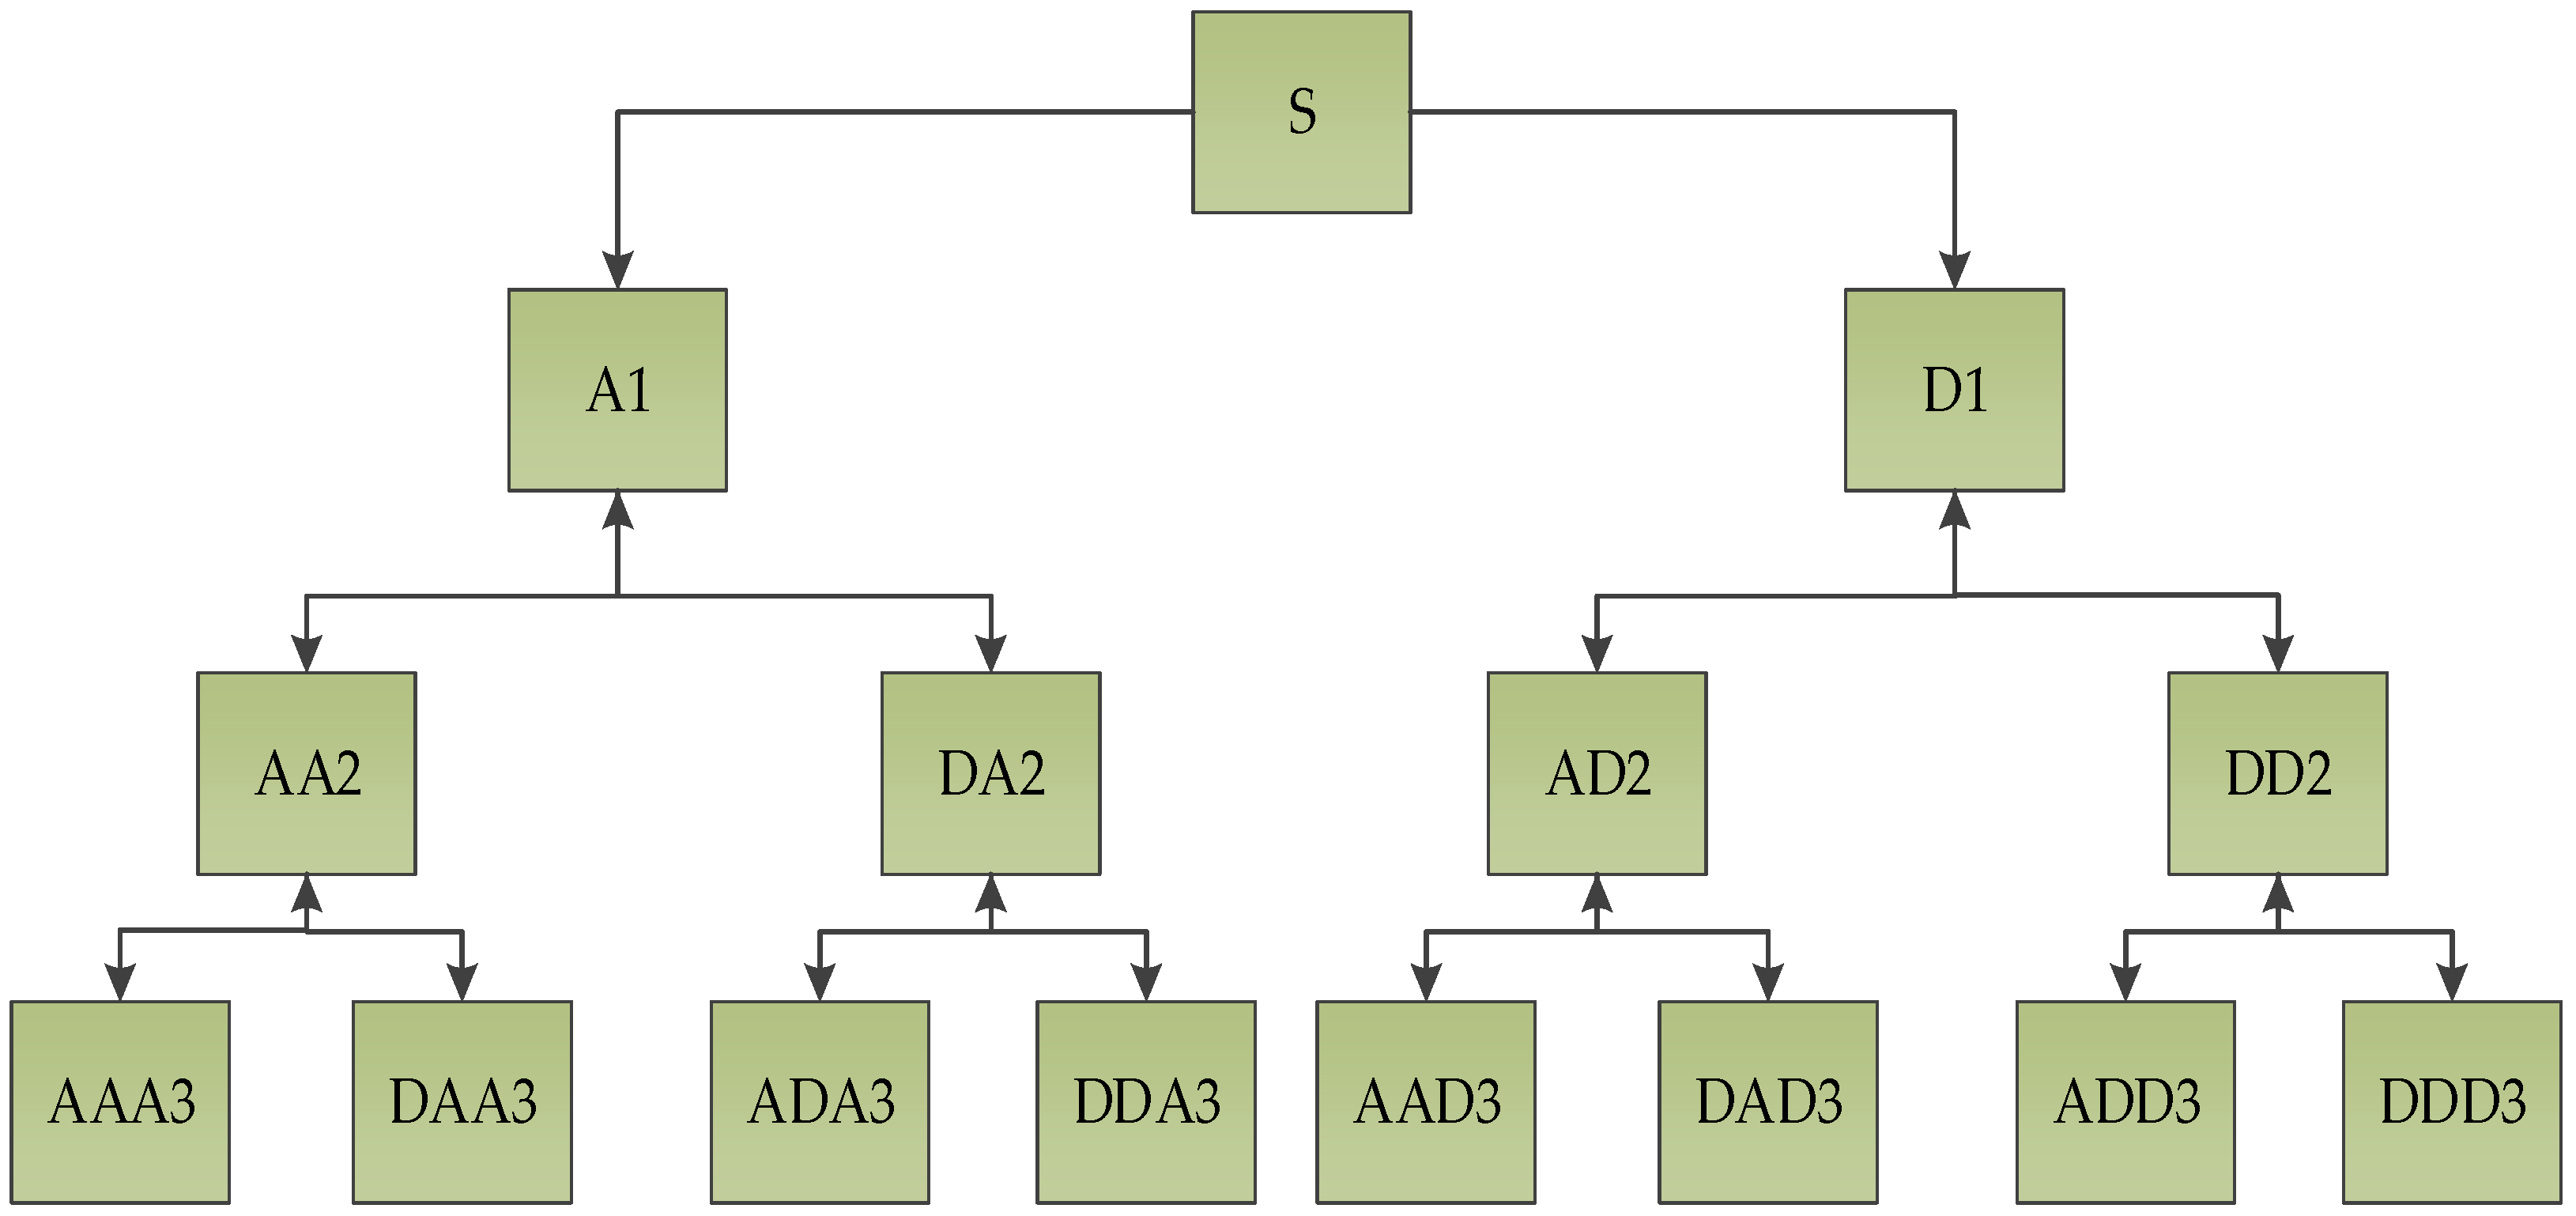
Figure 1.
Decomposition structure of wavelet packet.

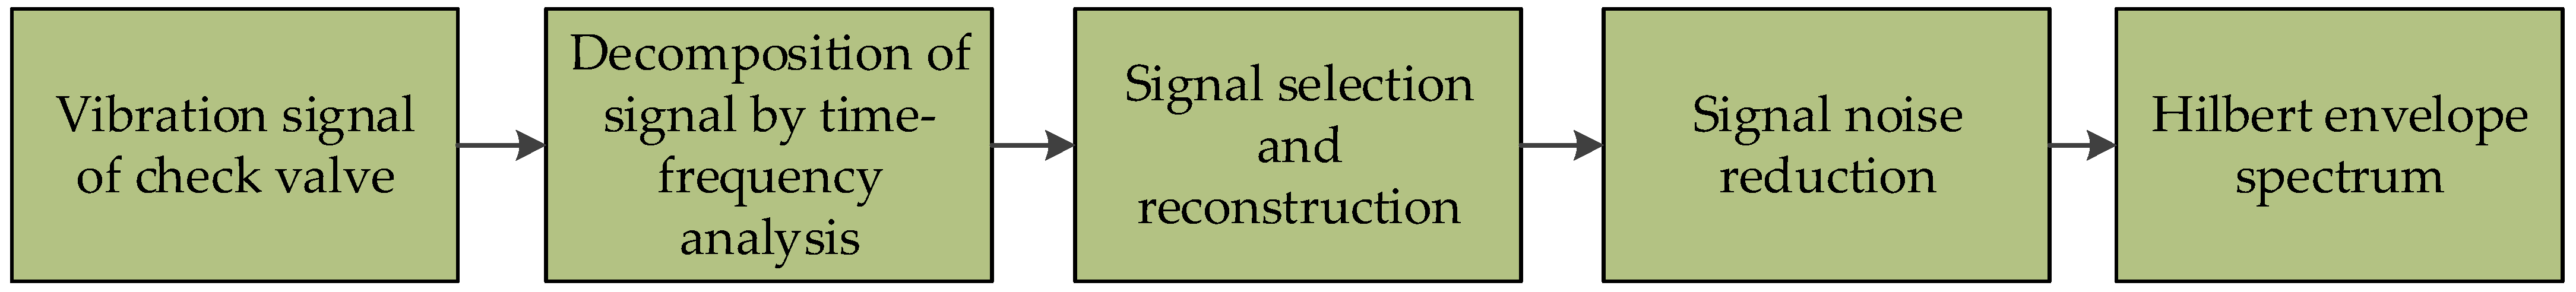
Figure 2.
Research outline of the proposed method.

Figure 3.
Fault feature extraction process of check valve based on LMD and wavelet packet denoising.
Figure 3.
Fault feature extraction process of check valve based on LMD and wavelet packet denoising.

Figure 4.
Schematic diagram of high-pressure diaphragm pump and fault check valve. (a) High pressure diaphragm pump; and (b) fault check valve.
Figure 4.
Schematic diagram of high-pressure diaphragm pump and fault check valve. (a) High pressure diaphragm pump; and (b) fault check valve.

Figure 5.
Vibration signal acquisition system diagram of check valve.

Figure 6.
Time-domain waveform of check valve in normal operation.

Figure 7.
Time-domain waveform of check valve fault operation.

Figure 8.
Frequency-domain waveform of check valve fault operation.

Figure 9.
LMD decomposition results.

Figure 10.
EMD decomposition results.

Figure 11.
Time-domain waveform reconstruction.

Figure 12.
Time-domain waveform of signal based on LMD wavelet packet denoising.

Figure 13.
Time-domain waveform of signal based on EMD wavelet packet denoising.

Figure 14.
Signal envelope spectrum based on LMD wavelet packet denoising.

Figure 15.
Signal envelope spectrum based on EMD wavelet packet denoising.

Figure 16.
Signal envelope spectrum based on wavelet packet denoising.


Table 1.
K-L divergence and kurtosis of PF component.
| Parameter | PF1 | PF2 | PF3 | PF4 | PF5 |
|---|---|---|---|---|---|
| K-L divergence | 0.009 | 0.001 | 0.026 | 0.253 | 1.001 |
| Kurtosis | 4.706 | 4.062 | 3.417 | 4.775 | 3.525 |
Table 2.
K-L divergence and kurtosis of IMF component.
| Parameter | IMF1 | IMF2 | IMF3 | IMF4 | IMF5 |
| K-L divergence | 0.036 | 0.007 | 0.009 | 0.001 | 0.016 |
| Kurtosis | 4.048 | 4.866 | 3.333 | 3.001 | 3.402 |
| Parameter | IMF6 | IMF7 | IMF8 | IMF9 | IMF10 |
| K-L divergence | 0.111 | 0.561 | 1.001 | 0.724 | 0.234 |
| Kurtosis | 2.688 | 5.040 | 5.158 | 1.699 | 2.165 |
Publisher’s Note: MDPI stays neutral with regard to jurisdictional claims in published maps and institutional affiliations. |
© 2022 by the authors. Licensee MDPI, Basel, Switzerland. This article is an open access article distributed under the terms and conditions of the Creative Commons Attribution (CC BY) license (https://creativecommons.org/licenses/by/4.0/).
Share and Cite
MDPI and ACS Style
Yang, J.; Zhou, C. A Fault Feature Extraction Method Based on LMD and Wavelet Packet Denoising. Coatings 2022, 12, 156. https://0-doi-org.brum.beds.ac.uk/10.3390/coatings12020156
AMA Style
Yang J, Zhou C. A Fault Feature Extraction Method Based on LMD and Wavelet Packet Denoising. Coatings. 2022; 12(2):156. https://0-doi-org.brum.beds.ac.uk/10.3390/coatings12020156
Chicago/Turabian StyleYang, Jingzong, and Chengjiang Zhou. 2022. "A Fault Feature Extraction Method Based on LMD and Wavelet Packet Denoising" Coatings 12, no. 2: 156. https://0-doi-org.brum.beds.ac.uk/10.3390/coatings12020156
Note that from the first issue of 2016, this journal uses article numbers instead of page numbers. See further details here.