Article

Effects of WC Particles on the Microstructure of IN718/WC Composite Coatings Fabricated by Laser Cladding: A Two-Dimensional Phase-Field Study

1
School of Mechanical Engineering, Jiangsu University, Zhenjiang 212013, China
2
Institute of Advanced Manufacturing and Modern Equipment Technology, Jiangsu University, Zhenjiang 212013, China
*
Authors to whom correspondence should be addressed.
Submission received: 8 January 2023 / Revised: 10 February 2023 / Accepted: 13 February 2023 / Published: 14 February 2023

Abstract

:
During the process of laser cladding IN718/WC composite coatings, the dissolution and metallurgical reaction of WC particles significantly influence the microstructures of the coatings. However, the limited experimental methods restrict direct observation and prevent a deep understanding of this complicated process. Therefore, a novel numerical model for the solidification process of IN718/WC composite coatings was proposed. The model was established with the coupled multi-phase-field model and lattice Boltzmann method. Different kinds of microstructure around WC particles were simulated by the model and verified by experiments. Subsequently, microhardness and wear tests were carried out to investigate the improved mechanical properties of IN718 coatings reinforced by WC particles. The results show that the cellular alloy reaction layer, IN718 grains, and eutectic structure are formed, in turn, around WC particles. The convection in the laser molten pool can induce double-tail-like or spindle-like WC convection diffusion bands. The hardness of these bands is higher than that of the IN718 matrix. More importantly, WC convection diffusion bands can inhibit the growth of columnar crystals, because the dissolved WC can decrease the freezing temperature of the melt. Finally, mechanical property tests show that WC particles increase the hardness of the coating and significantly improve its wear resistance.

Graphical Abstract

1. Introduction

Laser cladding technology is widely utilized in the aerospace, ship building, and automobile industries. It uses high-energy laser beams to melt powders and make them metallurgical combined with a matrix [1,2]. IN718 alloy has been frequently used in laser cladding due to its good mechanical properties and corrosion resistance [3,4], whereas its hardness and wear resistance are limited. The addition of a reinforcement phase is an effective method to improve the mechanical properties of the metal matrix [5]. For example, WC is an ideal reinforcement material for IN718 due to its high melting point, high hardness, and good wettability with Ni-based alloys [6,7].
In the high-temperature laser molten pool, WC particles dissolve and metallurgically react with the IN718 matrix, which significantly influences the microstructures of the IN718/WC composite coatings [8]. Meanwhile, the convection in the laser molten pool has an important effect on these processes. Experimental research has revealed some of these influences. Due to the dissolution and decomposition of WC particles, various kinds of microstructure are formed around WC particles, such as a cellular alloy reaction layer, eutectic structures, and carbides [9,10,11]. The generated graphite reacts with oxygen in the atmosphere and forms CO and CO2, which are the sources of gas porosities. Meanwhile, WC particles could limit the escape of gas [12,13].
However, the randomness and complexity of the experimental results make it difficult to systematically investigate the effects of WC particles on microstructures under different solidification conditions. Additionally, it is difficult to reveal the formation mechanisms of certain microstructures with the limited experimental methods available. Fortunately, numerical simulations can make up for these deficiencies. At present, some microstructure simulation methods, such as phase-field modeling [14,15], cellular automata [16,17], and the envelope mesoscopic model [18,19] are available. Compared with other methods, phase-field modeling is outstanding due to its thermodynamic consistency [20] and avoidance of explicit interface tracking [21].
Recently, some scholars applied phase-field modeling to the investigation of microstructure evolution in laser additive manufacturing. Xiao [22] developed a multiscale model by integrating the macroscale mass and heat transfer model and the microscale phase-field model and explored the primary dendritic arm spacing of the columnar dendrites in laser additive manufacturing. Acharya [23] predicted the microstructure in the laser powder bed fusion process by phase-field simulations, including element segregation, dendrite size, and dendrite orientation. Liu [24] coupled phase-field modeling and the thermal lattice Boltzmann method to simulate the microstructure evolution during rapid solidification and revealed the importance of latent heat to the formation of secondary arms.
In previous modeling works, the solidification of IN718/WC composite coatings has not been analyzed by phase-field simulations, and most of the developed phase-field models are single-phase models, which cannot be used to solve problems involving multiple thermodynamic phases. Thus, a phase-field model that can be used for this type of research remains to be built.
In this work, a novel numerical model was proposed for the solidification process of IN718/WC composite coatings. The model was established by the coupled multi-phase-field model (MPF) and the lattice Boltzmann method (LBM). The effects of WC particles on the microstructures of IN718/WC composite coatings fabricated by laser cladding were investigated through phase-field simulations and verified by experiments. First, different kinds of microstructure evolutions around WC particles were simulated. Then, the effects of the convection on microstructure evolution, including the formation of WC convection diffusion bands (WCCDB) and the nonuniform growth of cellular structures, were discussed. More importantly, the inhibition effect of WCCDBs on the growth of columnar crystals was analyzed in detail. Finally, microhardness and wear tests were carried out to investigate the improved mechanical properties of IN718 coatings reinforced by WC particles.

2. Model Development

The numerical model includes two components: two thermodynamic phases and fluid flow. The IN718/WC composite coating is treated as an Ni-WC binary eutectic system by neglecting the chemical reaction and simplifying IN718 as pure Ni. Thus, interactions involving other elements in the IN718 alloy, such as the segregation of Cr, cannot be reflected in this model. The numerical model was established using the coupled MPF-LBM method, in which the MPF model simulates the phase evolution and solute transport, while the LBM determines the convection velocity. The physical fields involved include the phase field, solute concentration field, temperature field, and velocity field, so the solid–liquid phase transition, the solute transport, the temperature variation, and melt flow can be considered. In the temperature field, the latent heat is neglected, because the thermal diffusivity is 3–5 orders larger than the solute diffusivity in liquid [25]. Therefore, the linear temperature field is employed; this includes the linear cooling rate and linear temperature gradient.

2.1. Multiphase-Field Method

The MPF method is employed to determine the solid–liquid phase transition and the solute transport problems in simulations. The MPF method has multiple-order parameters and is able to calculate phase evolutions of multiple thermodynamic phases simultaneously. The MPF model employed in this work follows the method described in [26]. The total free energy of the simulation domain consists of the interfacial free energy and the chemical free energy and is represented as follows:
F = Ω { f INTF ( Φ 1 , Φ 2 , , Φ N ) + f CHEM ( Φ 1 , Φ 2 , , Φ N , c ) } d V
where Ω, Φ(x,t), and c(x,t) are the calculation domain, the order parameters, and the concentration field, respectively. The interfacial free energy density is
f INTF = α β α , β = 1 N 4 σ α β η [ η 2 π 2 Φ α Φ β + Φ α Φ β ]
where σαβ is the interfacial energy between phases α and β and is usually anisotropic. In addition, η is the finite interface width, and Φα is the order parameter of phase α, which indicates the local phase fraction of phase α.
The chemical free energy density is
f CHEM = α = 1 N Φ α f α ( c α ) + λ [ c α = 1 N ( Φ α c α ) ]
where cα is the solute concentration of phase α, fα(cα) is the bulk-free energy of phase α, and λ is a generalized chemical potential to ensure the mass conservation of the total solute.
Two different anisotropic interface energy expressions are applied, because phase δ-WC is a hexagonal close-packed phase, while phase γ-Ni is a face-centered cubic phase. The interface energy of δ-WC is expressed as [27]
σ α β = σ α β * [ 1 + δ hex c o s ( 6 θ ) ]
where σ*αβ and δhex represent the interface energy coefficient and the anisotropy coefficient, respectively. Meanwhile, θ is the angle between the surface normal and the first prismatic direction and can be solved by θ = arctan(ny/nx), where nx and ny are components of the unit normal vector at the interface. Meanwhile, the interface energy of γ-Ni is expressed as
σ α β = σ α β * [ 1 + δ fcc c o s ( 4 θ ) ]
The final evolution equation for each order parameter is
Φ α ( x , t ) t = β = 1 β α N   M α β N [ γ = 1 γ β N ( σ β γ σ α γ ) I γ + ( 1 + ξ ) π 2 8 η Δ g α β ]
where
I γ = 2 Φ γ + π 2 η 2 Φ γ
Δ g α β = f β ( c β ) f α ( c α ) λ ( c β c α )
λ = f α c α = f β c β
where Mαβ is the interface mobility between phases α and β. ξ is the noise term, which is a uniformly distributed random number in the range of −0.4 to 0.4 [15]. N is the number of order parameters that can affect phase α at position x. Δgαβ is the thermodynamic driving force between phases α and β, which represents the effect of the solute concentration at the interface.
The evolution equation for the concentration is
c ( x , t ) t + v c ( x , t ) = [ α = 1 N ( Φ α D α c α ) + α = 1 N β = 1 N J α β ]
D α = D α 0 e Q α R T
where ν is the melt flow velocity, which is determined by the LBM. Jαβ is the antitrapping current. Dα is the temperature-dependent solute diffusion coefficient expressed in Equation (11). D α 0 , Qα, R, and T are the diffusion constant, the activation energy, the ideal gas constant, and the temperature, respectively.
Equations (6) and (10) are the governing equations of the MPF, which need to be discretized by an explicit first-order scheme [26]. The discretized time step is Δt, and the discretized space interval is Δx.

2.2. Nucleation Model

Nucleation plays a significant role in microstructure evolutions, as it controls the sizes of grains and the growth of eutectic structures. The nucleation model used in this work follows that described in [28]. First, nuclei points are generated randomly according to the nucleation density. Then, the thermodynamic driving force Δgαβ of each point is calculated. When Δgαβ is higher than the minimum nucleation driving force, and the volume fraction of the melt exceeds 30%, the program will generate the corresponding phase.
The nucleation of δ-WC and γ-Ni in the melt was considered through simulations. Nucleation was conducted three times during a simulation, including at the freezing temperature of δ-WC, at the freezing temperature of γ-Ni, and at the eutectic temperature. The nucleation parameters are shown in Table 1.

2.3. Lattice Boltzmann Method

The LBM method is employed to solve the melt velocity term in Equation (10). Compared with computational fluid dynamics (CFD), LBM is known for its excellent convergence and parallel computing ability. Therefore, it is applicable for solving incompressible flow problems in phase field simulations.
The LBM is a mesoscale method in which fluid is replaced by distribution functions of fractious particles [29]. The evolution equation of distribution functions is
f k ( x + l k Δ t , t + Δ t ) = f k ( x , t ) + f k e q ( x , t ) f k ( x , t ) τ + F k ( x , t ) Δ t
where fk(x,t) is the kth distribution function at position x and time moment t, while fk(x + lkΔt,t + Δt) represents the kth distribution function at position x + lkΔt after time step Δt. Equation(12) is split into Equations (13) and (14) for the convenience of calculation and comprehension,
f k ( x , t ) = f k ( x , t ) + f k e q ( x , t ) f k ( x , t ) τ + F k ( x , t ) Δ t
f k ( x , t ) = f k * ( x l k Δ t , t )
with the relaxation factor τ being solved by Equation (15),
τ = 3 v l 2 Δ t + 0.5
with the kinematic viscosity ν, the lattice velocity l = Δr/Δt, the lattice interval Δr, and the time step Δt. l equals 1 in the model. The equilibrium distribution function f k e q is expressed as
f k e q = ρ ω k [ 1 + 3 l k u l i q u i d l 2 + 9 ( l k u l i q u i d ) 2 2 l 4 3 u l i q u i d 2 2 l 2 ]
Fk(x,t) is the discrete external force and is given by [30]
F k = ( 1 1 2 τ ) ω k ( 3 ( l k u l i q u i d ) l 2 + 9 l k u l i q u i d l 4 l k ) F
F = ρ g
Only gravity is considered in F, and g is the gravitational acceleration, while ρ is the fluid density.
The D3Q27 model is adopted to allow 2D and 3D simulations.
Macroscopic properties of fluid, including the density ρ and the momentum ρuliquid, are calculated by fk,
ρ = k f k
ρ u l i q u i d = k l k f k + Δ t 2 F

2.4. MPF-LBM Algorithm Implementation

The algorithm structure of the MPF-LBM model is shown in Figure 1. It introduces the calculation sequence of each physical field and the information flow between fields. The algorithm was built on the basis of the open-source phase-field simulation toolkit OpenPhase [26]. The visualization and analysis of the calculation results were processed with the open-source visualization tool Pareview.

3. Simulation Results and Discussion

3.1. Simulation Parameters

3.1.1. Solidification Conditions and Parameters of the Phase-Field Simulation

The temperature parameters involved in this simulation referred to the numerical results of a molten pool [31,32,33], because the temperature distribution in molten pools is hard to measure directly. As a result, the cooling rate was set to 5000 K/s. The highest temperature in the simulation domain was set to 3100 K, which is close to the melting point of WC. The heating rate was 24,000 K/s [31], and heating lasted for 25 ms. The temperature reference point was set at the center of the simulation domain. The temperature variation during the whole simulation is shown in Figure 2.
Three cases of solidification were simulated in this work. The solidification conditions used are shown in Table 2.
The size of the simulation domain was 120 μm × 120 μm. The number of grids was 240 × 240. The grid spacing was 0.5 μm. The initial condition of the phase field is shown in Figure 3. An WC particle, 80 μm in diameter, was set at the center of the simulation domain, and the rest was the melt. The WC concentration was 99% in the WC particle and 12% in the melt. Some of the phase-field parameters referred to the Al–Mg binary system [28] and the Ti-6Al-4V pseudo binary system [24], including the interface energy, the interface mobility, and the anisotropic interface energy. The parameters used in the simulations are listed in Table 3.

3.1.2. Eutectic Phase Diagram Used in the Simulations

The phase diagram used in the simulations was the pseudo binary diagram of the WC-(Fe, Co, Ni) system [36]. After linear processing, the Ni-WC binary eutectic phase diagram shown in Figure 4 was obtained; detailed information about the points and lines is provided in Table 4. In Figure 4, the solid solution of WC in Ni is known as γ-Ni, and the solid solution of Ni in WC is known as δ-WC. The maximum Ni concentration in δ-WC was increased artificially to allow the convergence of simulations.

3.2. Solidification under Convection

Figure 5 shows the microstructure evolution around the WC particle under convection. Critical points of the solidification are shown in this figure, including the maximum temperature (3100 K), the freezing temperature of γ-Ni (1757 K), the eutectic temperature (1602 K), and the final temperature (1517 K). In the phase-field images, the melt is blue, the δ-WC phase is red, and the different grains of γ-Ni are distinguished in green to brown. The interfaces between the different phases and grains are marked with black lines. The streamlines and arrows represent the velocity of the melt. The sizes and colors of the arrows are determined by the velocity. For the convenience of explanation, each direction of the WC particle is shown in Figure 5(a1), in which the upstream side is defined as the front of the WC particle.
In Figure 5(a1), at a temperature of 3100 K, the WC particle becomes smaller under the combined effect of dissolution and melting. The velocity distribution around the WC particle is spindle-like, which is similar to the flow around a circular cylinder at a low Reynolds number [37].
In Figure 5(a2), at a temperature of 1757 K, the WC particle has experienced partial melting and resolidified with new nuclei. The cellular structures can only be observed in the front and back of the particle. The flow velocity on the left and right sides of the particle is large, which causes the elements around the interface to be uniformly distributed and inhibits the formation of cellular structures. The flow velocity in front of the WC particle and behind the WC particle is low, which means that the downstream and upstream cellular structures are barely affected by the convection, allowing them to grow normally. Dissolved WC flows backwards, which makes the downstream cellular structure larger than the upstream structure. Figure 5(b2) shows that convection induces the WC convection diffusion band (WCCDB), whose effect is illustrated in the next section.
Figure 5(a3) shows that, at a temperature of 1602 K, γ-Ni grains have almost finished solidifying, and the temperature is close to the eutectic point. γ-Ni grains are equiaxed with a little δ-WC scattering inside them. The expelled WC accumulates at the grain boundaries and forms some intercrystalline δ-WC. The remaining melt is double-tail-like under the effect of convection. The end of the tails exists in front of the particle due to the periodic boundary condition.
In Figure 5(a4), at a temperature of 1517 K, the remaining melt in the WCCDB solidifies to the eutectic structure. However, it is a deficiency that the lamellar eutectic structures are not reproduced in the simulation. Instead, the simulation results can only provide the phase fraction of each phase according to the position.

3.3. Solidification under Combined Effects of Convection and the Temperature Gradient

Figure 6 simulates the microstructure evolution around the WC particle under combined effects of convection and the temperature gradient and reveals the inhibition effect of the WCCDB on the growth of the columnar crystals. Figure 6a,b shows that the convection direction is vertical and parallel to the temperature gradient. To guarantee the growth of the columnar crystals, nucleation densities are decreased, and nuclei are planted artificially at the beginning of solidification at intervals of 15 μm. Seven nuclei are planted, and grain orientations are determined randomly.
By comparing Figure 6(a2,b2), it can be found that when the convection direction is vertical to the temperature gradient, the columnar crystals growing from the bottom cannot pass the WCCDB. As a result, γ-Ni crystals above the WCCDB can only grow with new nuclei. The reason for this phenomenon is that the WC concentration in the WCCDB is close to the eutectic concentration, and according to the Ni-WC phase diagram presented in Figure 4, the freezing temperature around the eutectic concentration is the lowest. Thus, the freezing temperature of the WCCDB is the lowest, and this can block the growth path of columnar crystals.
This phenomenon was further investigated. The WC concentration along path 2 of Figure 6 is shown in Figure 7, and the freezing temperature along the path was calculated with the phase diagram presented in Figure 4. The effects of nonequilibrium solidification and supercooling on the freezing temperature were ignored in the calculation. The practical temperature gradient was found to be 1 K/μm, corresponding to the two blue lines. The blue dotted line represents the temperature at moment t0. As the temperature decreases, this line moves downward and the solidified area extends forward, which is marked by the yellow area. When the practical temperature distribution reaches the blue full line, the solidified area will be divided into three parts by WCCDBs. Each part will grow with new nuclei and limit the sizes of columnar crystals inside.
Further, it can be deduced from Figure 7 that when the practical temperature gradient is large enough, columnar crystals can pass through the WCCDB successfully. This critical point equals the maximum freezing temperature gradient.

4. Experiments

4.1. Experimental Details

To verify the microstructure simulation results and investigate the improved mechanical properties of IN718/WC composite coatings, experiments were conducted. Composite coatings with 30 wt.% of spherical WC particles (particle size: 50–110 μm) were fabricated. Coatings of pure IN718 were fabricated as a comparison to show the reinforcement effect of the WC particles. The experimental equipment included a 2000 W fiber laser (YLS-2000-TR, Newton, NJ, USA), a powder feeder (NCL-PF2, CHAMLION, Wuhan, China), and a six-axis robot (KUKA, Obernburg, Germany). Schematic diagrams of the laser cladding experiments and the convection in the molten pool are shown in Figure 8. The substrate size was 58 mm × 38 mm × 6 mm. The laser power was 1400 W, the scanning speed was 450 mm/min, and the powder feeder rate was 9 g/min. After cladding, samples were cut, polished, and corroded. The corrosive was a mixture of 75% HCl and 25% HNO3. The microstructures of coatings were observed with a scanning electron microscope (S-3400N, Hitachi, Ibaraki, Japan). The default capture mode of SEM is backscattering. Element analyses were conducted by EDS. The microhardness of the coatings was measured with a semiautomatic microhardness tester (HXS-1000, Shante Instrument, Shenzhen, China). The load applied was 200 g, and the hold time was 15 s. The microhardness distributions in the cross-section of the coatings were measured from the top of the coatings to the substrate at intervals of 0.1 mm. The microhardness of each depth was measured three times from different points, excluding the WC particles. The wear tests were conducted with a rotary wear testing machine (HT-1000, Kaihua Technology, Taizhou, China). The grinding ball was made from Si3N4, and it was 5 mm in diameter. The surfaces of the coatings were polished before the wear test. The wear tests were carried out with a load of 1000 g, a wear diameter of 4 mm, and a wear time of 20 min. The profiles of the wear tracks were measured with a laser confocal microscope (VK-X200, Keyence, Osaka, Japan).

4.2. Effects of Convection of the Microstructure

In order to verify the simulation results presented in Figure 5, the microstructure around the WC particles under convection was observed by SEM and is shown in Figure 9. In Figure 9a, the position of the WCCDB can be distinguished by the position of the eutectic region. Then, cellular structures at the edge of the particle can be observed. The cellular structures along the convection direction were found to be significantly larger than those in other positions. In addition, the cellular structure in position A was larger than that in position B. According to the conclusion of the simulation, position A is the downstream side and position B is the upstream side. In Figure 9b, the lamellar eutectic structures in the WCCDB can be clearly observed.
Element maps are depicted in Figure 10. First, the content of element W was high between the IN718 grains, which is consistent with the simulation results. Second, the distribution of element Ni was opposite to the distribution of element W, which is also consistent with the simulation results. Third, the distribution of element C differed from the simulation results, because in practical experiments, WC will decompose under high temperatures. The generated element C will diffuse rapidly and react with other elements.
To further verify the simulation results, the element distribution around the WC particle was compared between the experiment and the simulation. Figure 11a shows the element distributions along path 3 in Figure 10a, and Figure 11b shows the WC concentration and phase distributions along path 1 in Figure 5(a4). The simulated distribution of WC was similar to the experimental distribution of element W, which is embodied by three aspects. First, the content of WC/W increased on the whole when approaching the WC particle. Second, the content of WC/W in alloy reaction layer was slightly lower than that inside the WC particle. Third, at the IN718 grain boundaries, the content of WC/W was slightly greater.
The morphology of WCCDBs was also verified. Images of Figure 12 were taken from the horizontal section (the XY-plane in Figure 8), because WCCDBs can be more clearly observed from this section. Figure 12a verifies the double-tail-like WCCDB, while Figure 12b shows the more common spindle-like WCCDB of the coating. These two different morphologies are caused by the different convection times. When the convection time is short, the convection of dissolved WC is not sufficient, so the WCCDB is double-tail-like. When the convection time is sufficient, two tails can merge into one tail, and the morphology of the WCCDB will be spindle-like, which is similar to the velocity distribution shown in Figure 5(a2). In addition, the microhardness of the WCCDB was measured. The positions of the measured points are shown in Figure 12b. The microhardness of the WCCDB reached 326.9 HV0.2, higher than that of the IN718 matrix around the WC particle (303.7 HV0.2). This can be ascribed to the solid solution strengthening of WC [10].

4.3. Inhibition by WCCDBs on the Growth of Columnar Crystals

In order to verify the simulation results presented in Figure 6, the WCCDB that inhibits the growth of columnar crystals was found and is shown in Figure 13.
It is necessary to analyze Figure 13a in detail due to its complex features. Before analyzing this image, two facts need to be introduced. First, in the secondary electron mode, the dark area indicates that the angle with the horizontal plane is small and the morphology tends to be flat, while the bright area indicates that the angle with the horizontal plane is large and the morphology tends to be rough [38]. Second, aqua regia (the corrosive used in the experiment) has a strong corrosive ability against nickel-based alloys and a weak corrosive ability against WC [39].
Figure 13a shows that the WCCDB is located at the bottom of the molten pool. Benefiting from the distinct contrast between bright and dark areas in the figure, the WCCDB can be easily observed. The element map of W in Figure 13a shows that positions with high concentrations of W tend to be dark in the secondary electronic image. The cause of this phenomenon is that positions with more WC are less corroded, which makes the surface flat and dark in appearance in the secondary electron mode. In particular, some of the positions with high concentrations of WC appear bright. The cause of this is that these positions have formed lamellar eutectic structures, in which the phase type changes sharply, so the morphology tends to be rough after corrosion, and it tends to be bright in secondary electron images.
In Figure 13b, the positions of the columnar crystals on both sides of the middle of the WCCDB do not match, which means that they do not represent the same crystal. This phenomenon proves that the WCCDB inhibited the growth of the columnar crystals from the bottom, and the columnar crystals above were formed by new nuclei. In contrast, columnar crystals on both sides of the end of the WCCDB are connected. This means that with a decrease in the WC concentration, the freezing temperature increases, decreasing the inhibition effect. Thus, columnar crystals can pass the WCCDB successfully. Figure 13c shows the grains in the WCCDB and indicates the different solidification modes inside and outside of the WCCDB. Figure 13d shows the element map of W in Figure 13c. It indicates the position of the WCCDB. Table 5 shows the element contents at positions 1 and 2 in Figure 13c and quantitatively proves that position 1 is the WCCDB.
Two other studies mentioned a similar phenomenon. The dissolved WC particles inhibit the growth of coarse columnar crystals in WC-Fe composite coatings [40]. WC-12Co can inhibit the growth of columnar crystals and the (200) growth direction of γ-Ni in IN718/WC-12Co composite coatings [41]. However, graphic descriptions or analyses were not provided.

4.4. Hardness Distribution

Figure 14 shows the hardness distributions at depths of the IN718 coating and the IN718/WC coating. The hardness of the IN718/WC coating was slightly greater at the bottom due to the deposition of WC particles. The average microhardness of the IN718/WC composite coating reached 377.54 HV0.2, 43.79% higher than that of the IN718 coating (262.57 HV0.2). The increase in hardness can be attributed to the solid solution strengthening of WC (like the hardness increase of WCCDBs), the dispersion strengthening of the WC particles, and the dispersion strengthening of hard carbides [10,42,43].

4.5. Wear Properties

Figure 15 shows the friction coefficient curves of the IN718 coating and the IN718/WC coating. The curves include two stages: the running-in stage and the steady wear stage. At the running-in stage, the friction coefficient of the IN718/WC coating is slightly higher, because the WC particles were not exposed at the beginning and the reinforcement effects were not performed sufficiently. The average friction coefficient of the IN718/WC coating was 0.508, 18.46% lower than that of the IN718 coating (0.623). Therefore, the WC particles decreased the friction coefficient of the IN718/WC coating.
Figure 16 shows the 3D contours and sizes of the wear tracks. Figure 16a,b present the contours of the IN718 coating wear track and the IN718/WC coating wear track, respectively. Figure 16(c) shows the profiles of the wear tracks. The width and depth of the wear track of the IN718/WC coating decreased significantly. Figure 16d compares the sizes of the wear tracks. The results show that the wear track depth of the IN718/WC coating decreased to 8.72 μm, 56.79% lower than that of the IN718 coating. Therefore, the WC particles improved the wear resistance of the IN718/WC coating.
To investigate the wear mechanisms of two coatings, the wear track morphologies were observed by SEM and are shown in Figure 17. Figure 17a,b presents the morphologies of the wear track of the IN718 coating. Grooves and delamination are predominant in the wear track with some scattered wear debris. This indicates that the wear mechanisms of the IN718 coating include abrasive wear and adhesive wear. Figure 17c,d presents the morphologies of the wear track of the IN718/WC coating. Some delamination can be observed from the track, which indicates that the coating has adhesive wear. However, the grooves in the track are shallow, which indicates that the abrasive wear of the IN718/WC coating has been improved. The causes of this improvement are that WC particles can increase the hardness of the coating and decrease the depth of the wear debris into the surface [44]. Meanwhile, undissolved WC particles can function as a skeleton and reduce the wear of the grinding ball on the metal matrix [45].

5. Conclusions

A novel numerical model was established for the solidification process of IN718/WC composite coatings by the coupled LBM-MPF method. The effects of the WC particles on the microstructure of IN718/WC composite coatings fabricated by laser cladding were investigated by simulations and verified experiments. The improved hardness and wear properties of the IN718 coatings reinforced by WC particles were analyzed. The following conclusions were obtained:
  • With a decrease in the temperature, a cellular alloy reaction layer, IN718 grains, and eutectic structure are formed around WC particles.
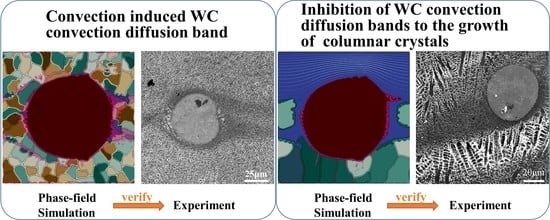
  • Convection of the laser molten pool can induce double-tail-like or spindle-like WCCDBs. The hardness of the WCCDBs is higher than that of the IN718 matrix.
  • WCCDBs can inhibit the growth of columnar crystals. In detail, the freezing temperature of the WCCDBs is lower than that at other positions in the melt, so the WCCDBs can block the growth path of columnar crystals.
  • Under the combined effects of solid solution strengthening of WC and the dispersion strengthening of WC particles, the average hardness of the IN718/WC composite coating reached 377.54 HV0.2, 43.79% higher than that of the IN718 coating.
  • WC particles can improve the abrasive wear of the IN718 coating. In this study, the friction coefficient of the IN718/WC composite coating decreased to 0.508 and the wear track depth decreased to 8.72 μm.
In future work, the multiphase flow model should be employed to determine the flow velocity, because the viscosities of molten WC and molten IN718 are different. The thermodynamic parameters of the Ni-WC system should be investigated further to improve the quantitative performance of the simulation. Finally, taking multiple elements into consideration is a challenge, including other elements in the IN718 alloy and the decomposition products of WC; however, such research is important to further reveal the microstructure evolution around WC particles.

Author Contributions

Conceptualization, J.Z.; methodology, Y.W.; validation, Y.W. and T.Z.; formal analysis, Y.W. and H.Z.; investigation, Y.W.; resources, J.Z., X.M. and P.L.; data curation, Y.W.; writing—original draft preparation, Y.W.; writing—review and editing, J.Z.; visualization, Y.W. and H.Z.; supervision, J.Z.; project administration, J.Z.; and funding acquisition, J.Z., X.M. and P.L. All authors have read and agreed to the published version of the manuscript.

Funding

This work was supported by the National Natural Science Foundation of China [No. 51875265], the Natural Science Foundation of Jiangsu Province [No. BK20210758], and the China Postdoctoral Science Foundation Funded Project [No. 2022M710060].

Institutional Review Board Statement

Not applicable.

Informed Consent Statement

Not applicable.

Data Availability Statement

Not applicable.

Conflicts of Interest

The authors declare no conflict of interest.

Nomenclature

cat.%solution concentration
Dm2/ssolute diffusion coefficient
D0m2/sdiffusion constant
fCHEMJ/m3Chemical free energy density
fINTFJ/m3interfacial free energy density
fk-distribution function
f k e q -equilibrium distribution function
FJtotal free energy
Fk-discrete external force
FN/m3volumetric force vector
gN/m3volumetric gravitational acceleration
J-antitrapping current term
lk-lattice velocity vector
Mm4/(J∙s)interface mobility
nx, nymcomponents of the unit normal vector
N-number of order parameters
QJ/moleactivation energy
RJ/(mole∙K)ideal gas constant
tstime moment
TKtemperature
uliquid-velocity vector of fluid in the LBM
νm/svelocity vector in the MPF
Vm3volume
xmposition vector
δ-anisotropy coefficient
ηmfinite interface width
λ-chemical potential
σJ/m2interfacial energy
σ*J/m2interface energy coefficient
νN∙s/m2kinematic viscosity
θradangle between the surface normal and the first prismatic direction
ρkg/m3fluid density
τ-relaxation factor
ξ-noise term
Δg-thermodynamic driving force
Δr-lattice interval
Δtsdiscretized time step
Δxmdiscretized space interval
Ω-calculation domain
Φ-order parameter
CFD computational fluid dynamics
LBM lattice Boltzmann method
MPF multiphase field
WCCDB WC convection diffusion band

References

  1. Liu, X.; Bi, J.; Meng, Z.; Li, R.; Li, Y.; Zhang, T. Tribological behaviors of high-hardness Co-based amorphous coatings fabricated by laser cladding. Tribol. Int. 2021, 162, 107142. [Google Scholar] [CrossRef]
  2. Siddiqui, A.A.; Dubey, A.K. Recent trends in laser cladding and surface alloying. Opt. Laser Technol. 2021, 134, 106619. [Google Scholar] [CrossRef]
  3. Raghavan, N.; Stump, B.C.; Fernandez-Zelaia, P.; Kirka, M.M.; Simunovic, S. Influence of geometry on columnar to equiaxed transition during electron beam powder bed fusion of IN718. Addit. Manuf. 2021, 47, 102209. [Google Scholar] [CrossRef]
  4. Zhu, L.; Yang, Z.; Xin, B.; Wang, S.; Meng, G.; Ning, J.; Xue, P. Microstructure and mechanical properties of parts formed by ultrasonic vibration-assisted laser cladding of Inconel 718. Surf. Coat. Technol. 2021, 410, 126964. [Google Scholar] [CrossRef]
  5. Karthik, B.; Sharma, S.; Gowrishankar, M.; Hegde, A.; Srinivas, D. Effect of weight of reinforcement and coating thickness on the hardness of stir cast AL7075-nickel coated duralumin powder mmc. J. Appl. Eng. Sci. 2022, 20, 900–907. [Google Scholar] [CrossRef]
  6. Yan, X.; Chang, C.; Deng, Z.; Lu, B.; Chu, Q.; Chen, X.; Ma, W.; Liao, H.; Liu, M. Microstructure, interface characteristics and tribological properties of laser cladded NiCrBSi-WC coatings on PH 13-8 Mo steel. Tribol. Int. 2021, 157, 106873. [Google Scholar] [CrossRef]
  7. Wu, S.; Liu, Z.; Huang, X.; Wu, Y.; Gong, Y. Process parameter optimization and EBSD analysis of Ni60A-25% WC laser cladding. Int. J. Refract. Met. Hard Mater. 2021, 101, 105675. [Google Scholar] [CrossRef]
  8. Huo, K.; Zhou, J.; Dai, F.; Xu, J. Particle distribution and microstructure of IN718/WC composite coating fabricated by electromagnetic compound field-assisted laser cladding. Appl. Surf. Sci. 2021, 545, 149078. [Google Scholar] [CrossRef]
  9. Farahmand, P.; Liu, S.; Zhang, Z.; Kovacevic, R. Laser cladding assisted by induction heating of Ni–WC composite enhanced by nano-WC and La2O3. Ceram. Int. 2014, 40, 15421–15438. [Google Scholar] [CrossRef]
  10. Wang, Q.; Li, Q.; Zhang, L.; Chen, D.X.; Jin, H.; Li, J.D.; Zhang, J.W.; Ban, C.Y. Microstructure and properties of Ni-WC gradient composite coating prepared by laser cladding. Ceram. Int. 2021, 48, 7905–7917. [Google Scholar] [CrossRef]
  11. Zhou, S.; Xu, T.; Hu, C.; Wu, H.; Liu, H.; Ma, X. A comparative study of tungsten carbide and carbon nanotubes reinforced Inconel 625 composite coatings fabricated by laser cladding. Opt. Laser Technol. 2021, 140, 106967. [Google Scholar] [CrossRef]
  12. Yang, R.; Huang, N.; Tian, Y.; Qin, J.; Lu, P.; Chen, H.; Li, H.; Chen, X. Insights into the exceptional cavitation erosion resistance of laser surface melted Ni-WC composites: The effects of WC morphology and distribution. Surf. Coatings Technol. 2022, 444, 128685. [Google Scholar] [CrossRef]
  13. Shen, X.; He, X.; Gao, L.; Su, G.; Xu, C.; Xu, N. Study on crack behavior of laser cladding ceramic-metal composite coating with high content of WC. Ceram. Int. 2022, 48, 17460–17470. [Google Scholar] [CrossRef]
  14. Zhang, A.; Du, J.; Guo, Z.; Wang, Q.; Xiong, S. Dependence of Lamellar Eutectic Growth with Convection on Boundary Conditions and Geometric Confinement: A Phase-Field Lattice-Boltzmann Study. Met. Mater. Trans. B 2019, 50, 517–530. [Google Scholar] [CrossRef]
  15. Cao, L.; Liu, D.; Jiang, P.; Shao, X.; Zhou, Q.; Wang, Y. Multi-physics simulation of dendritic growth in magnetic field assisted solidification. Int. J. Heat Mass Transf. 2019, 144, 118673. [Google Scholar] [CrossRef]
  16. Gu, C.; Ridgeway, C.D.; Cinkilic, E.; Lu, Y.; Luo, A.A. Predicting gas and shrinkage porosity in solidification microstructure: A coupled three-dimensional cellular automaton model. J. Mater. Sci. Technol. 2020, 49, 91–105. [Google Scholar] [CrossRef]
  17. Ushmaev, D.; Liao, Z.; Notron, A.; Axinte, D. On the importance of interface stability in cellular automata models: Planar and dendritic solidification in laser melted YSZ. Mater. Des. 2022, 219, 110823. [Google Scholar] [CrossRef]
  18. Viardin, A.; Souhar, Y.; Fernández, M.C.; Apel, M.; Založnik, M. Mesoscopic modeling of equiaxed and columnar solidification microstructures under forced flow and buoyancy-driven flow in hypergravity: Envelope versus phase-field model. Acta Mater. 2020, 199, 680–694. [Google Scholar] [CrossRef]
  19. Kharicha, A.; Stefan-Kharicha, M.; Ludwig, A.; Wu, M. A scale adaptive dendritic envelope model of solidification at mesoscopic scales. IOP Conf. Series Mater. Sci. Eng. 2015, 84, 012032. [Google Scholar] [CrossRef]
  20. Böttger, B.; Eiken, J.; Apel, M. Multi-ternary extrapolation scheme for efficient coupling of thermodynamic data to a multi-phase-field model. Comput. Mater. Sci. 2015, 108, 283–292. [Google Scholar] [CrossRef]
  21. Zhang, A.; Du, J.; Guo, Z.; Wang, Q.; Xiong, S. Conservative phase-field method with a parallel and adaptive-mesh-refinement technique for interface tracking. Phys. Rev. E 2019, 100, 023305. [Google Scholar] [CrossRef] [PubMed]
  22. Xiao, W.; Li, S.; Wang, C.; Shi, Y.; Mazumder, J.; Xing, H.; Song, L. Multi-scale simulation of dendrite growth for direct energy deposition of nickel-based superalloys. Mater. Des. 2019, 164, 107553. [Google Scholar] [CrossRef]
  23. Acharya, R.; Sharon, J.A.; Staroselsky, A. Prediction of microstructure in laser powder bed fusion process. Acta Mater. 2017, 124, 360–371. [Google Scholar] [CrossRef]
  24. Liu, D.; Wang, Y. Mesoscale multi-physics simulation of rapid solidification of Ti-6Al-4V alloy. Addit. Manuf. 2019, 25, 551–562. [Google Scholar] [CrossRef]
  25. Zhang, A.; Guo, Z.; Xiong, S.-M. Eutectic pattern transition under different temperature gradients: A phase field study coupled with the parallel adaptive-mesh-refinement algorithm. J. Appl. Phys. 2017, 121, 125101. [Google Scholar] [CrossRef]
  26. Tegeler, M.; Shchyglo, O.; Kamachali, R.D.; Monas, A.; Steinbach, I.; Sutmann, G. Parallel multiphase field simulations with OpenPhase. Comput. Phys. Commun. 2017, 215, 173–187. [Google Scholar] [CrossRef]
  27. Böttger, B.; Eiken, J.; Steinbach, I. Phase field simulation of equiaxed solidification in technical alloys. Acta Mater. 2006, 54, 2697–2704. [Google Scholar] [CrossRef]
  28. Monas, A.; Shchyglo, O.; Kim, S.-J.; Yim, C.D.; Höche, D.; Steinbach, I. Divorced Eutectic Solidification of Mg-Al Alloys. Jom 2015, 67, 1805–1811. [Google Scholar] [CrossRef]
  29. Mohamad, A. Lattice Boltzmann Method; Springer: Berlin/Heidelberg, Germany, 2011; Volume 70. [Google Scholar]
  30. Zhang, A.; Guo, Z.; Jiang, B.; Du, J.; Wang, C.; Huang, G.; Zhang, D.; Liu, F.; Xiong, S.; Pan, F. Multiphase and multiphysics modeling of dendrite growth and gas porosity evolution during solidification. Acta Mater. 2021, 214, 117005. [Google Scholar] [CrossRef]
  31. Wang, C.; Zhou, J.; Zhang, T.; Meng, X.; Li, P.; Huang, S. Numerical simulation and solidification characteristics for laser cladding of Inconel 718. Opt. Laser Technol. 2022, 149, 107843. [Google Scholar] [CrossRef]
  32. Chen, L.; Yu, T.; Xu, P.; Zhang, B. In-situ NbC reinforced Fe-based coating by laser cladding: Simulation and experiment. Surf. Coatings Technol. 2021, 412, 127027. [Google Scholar] [CrossRef]
  33. Jiang, Y.; Cheng, Y.; Zhang, X.; Yang, J.; Yang, X.; Cheng, Z. Simulation and experimental investigations on the effect of Marangoni convection on thermal field during laser cladding process. Optik 2020, 203, 164044. [Google Scholar] [CrossRef]
  34. Kunieda, T.; Yamashita, K.; Murata, Y.; Koyama, T.; Morinaga, M. Effect of Rhenium Addition on Tungsten Diffusivity in Iron-Chromium Alloys. Mater. Trans. 2006, 47, 2106–2108. [Google Scholar] [CrossRef]
  35. Wang, Y.; Wang, J.; Wang, H.; Lu, X.-G.; Zhang, L. Thermodynamic description of the Ni-Mo-W system and interdiffusion study of its fcc phase. Calphad 2018, 61, 165–172. [Google Scholar] [CrossRef]
  36. Fernandes, C.; Senos, A. Cemented carbide phase diagrams: A review. Int. J. Refract. Met. Hard Mater. 2011, 29, 405–418. [Google Scholar] [CrossRef]
  37. Durst, F.; Arnold, I. Fluid Flows of Small Reynolds Numbers. In Fluid Mechanics: An Introduction to the Theory of Fluid Flows; Springer: Berlin/Heidelberg, Germany, 2008; pp. 429–461. [Google Scholar]
  38. Goldstein, J.I.; Newbury, D.E.; Michael, J.R.; Ritchie, N.W.; Scott, J.H.J.; Joy, D.C. Scanning Electron Microscopy and X-ray Microanalysis; Springer: Berlin/Heidelberg, Germany, 2017. [Google Scholar]
  39. Li, X.; Zhang, M.; Xia, X.; Cao, T.; Liang, L.; Li, H. Corrosion Behavior of WC–10 wt % Ni3Al Composite in Acidic Media. J. Superhard Mater. 2019, 41, 345–354. [Google Scholar] [CrossRef]
  40. Xiao, Q.; Sun, W.L.; Yang, K.X.; Xing, X.F.; Chen, Z.H.; Zhou, H.N.; Lu, J. Wear mechanisms and micro-evaluation on WC particles investigation of WC-Fe composite coatings fabricated by laser cladding. Surf. Coat. Technol. 2021, 420, 127341. [Google Scholar] [CrossRef]
  41. Xu, P.; Zhu, L.; Xue, P.; Yang, Z.; Wang, S.; Ning, J.; Meng, G.; Lan, Q.; Qin, S. Microstructure and properties of IN718/WC-12Co composite coating by laser cladding. Ceram. Int. 2022, 48, 9218–9228. [Google Scholar] [CrossRef]
  42. Wang, J.; Zhou, J.; Zhang, T.; Meng, X.; Li, P.; Huang, S.; Zhu, H. Ultrasonic-Induced Grain Refinement in Laser Cladding Nickel-Based Superalloy Reinforced by WC Particles. Coatings 2023, 13, 151. [Google Scholar] [CrossRef]
  43. Zhang, T.; Zhou, J.; Wang, J.; Meng, X.; Li, P.; Huang, S.; Zhu, H. Effect of hybrid ultrasonic-electromagnetic field on cracks and microstructure of Inconel 718/60%WC composites coating fabricated by laser cladding. Ceram. Int. 2022, 48, 33901–33913. [Google Scholar] [CrossRef]
  44. Lv, J.; Zhou, J.; Zhang, T.; Meng, X.; Li, P.; Huang, S. Microstructure and Wear Properties of IN718/WC Composite Coating Fabricated by Ultrasonic Vibration-Assisted Laser Cladding. Coatings 2022, 12, 412. [Google Scholar] [CrossRef]
  45. Zhang, J.; Lei, J.; Gu, Z.; Tantai, F.; Tian, H.; Han, J.; Fang, Y. Effect of WC-12Co content on wear and electrochemical corrosion properties of Ni-Cu/WC-12Co composite coatings deposited by laser cladding. Surf. Coatings Technol. 2020, 393, 125807. [Google Scholar] [CrossRef]
Figure 1. The flow chart of the MPF-LBM simulation algorithm.
Coatings 13 00432 g001
Figure 2. Temperature variation in phase-field simulations.
Coatings 13 00432 g002
Figure 3. Initial conditions.
Coatings 13 00432 g003
Figure 4. Ni-WC binary eutectic phase diagram.
Coatings 13 00432 g004
Figure 5. Simulation of the microstructure evolution around the WC particle under convection, (a1a4) phase field; (b1b4) WC concentration field.
Coatings 13 00432 g005
Figure 6. Microstructure around the WC particle under the combined effect of convection and the temperature gradient, (a1a3) convection along the X-axis and temperature gradient along the Z-axis; (b1b3) convection along the X-axis and temperature gradient along the X-axis.
Coatings 13 00432 g006
Figure 7. The WC concentration, freezing temperature, and practical temperature along path 2 in Figure 6.
Coatings 13 00432 g007
Figure 8. Schematic diagrams, (a) laser cladding experiment, (b) convection in molten pool.
Coatings 13 00432 g008
Figure 9. Microstructure around the WC particles under convection. (a) WC particle; (b) enlarged view of WCCDB.
Coatings 13 00432 g009
Figure 10. Element maps: (a) SEM image, (b) W, (c) Ni, and (d) C.
Coatings 13 00432 g010
Figure 11. Comparison of the experiment and simulation results, (a) element distribution along path 3 in Figure 9d, (b) WC concentration and phase distribution along path 1 in Figure 5(a4).
Coatings 13 00432 g011
Figure 12. Morphology of WCCDBs, secondary electron mode, (a) double-tails-like, (b) spindle-like.
Coatings 13 00432 g012
Figure 13. Inhibition by WCCDB on columnar crystals, (ac) microstructure and enlarged views, secondary electron mode, (d) element map of W.
Coatings 13 00432 g013
Figure 14. Microhardness distributions of coatings.
Coatings 13 00432 g014
Figure 15. Friction coefficient curves of the coatings.
Coatings 13 00432 g015
Figure 16. Three-dimensional contours of the wear tracks, (a) IN718 coating, (b) IN718/WC composite coating, (c) profiles of the wear tracks, (d) sizes of the the wear tracks.
Coatings 13 00432 g016
Figure 17. SEM morphologies of the wear tracks, (a,b) IN718 coating, (c,d) IN718/WC composite coating.
Coatings 13 00432 g017
Table 1. Nucleation parameters.
Nucleation DensityValueNucleation Temperature
Particle density of δ-WC in the melt2 × 1016 m−33070 K
Particle density of γ-Ni in the melt 5 × 10¹⁶ m−31735 K
Particle density of δ-WC in the melt5 × 1016 m−31600 K
Table 2. Solidification conditions used in the simulations.
SectionConvection DirectionTemperature Gradient
3.2along the X-axis0
3.3along the X-axis1 K/μm, along the Z-axis
3.3along the X-axis1 K/μm, along the X-axis
Table 3. Parameters used in the simulations.
SymbolDescriptionValueReference
ΔxGrid spacing5 × 10−7 m[28]
ηInterface width4.5Δx m[28]
ΔtTime step(5~25) × 10−7 s[28]
σ α β * Interface energy coefficient0.09 J/m2[28]
δfcc(γ-Ni)—melt interface anisotropy0.1-
δhex(δ-WC)—melt interface anisotropy0.1-
Mγ-Ni,melt(γ-Ni)—melt interface mobility1 × 10−8 m4/(J∙s)[24]
Mδ-WC,melt(δ-WC)—melt interface mobility1 × 10−8 m4/(J∙s)[24]
MαβOther interface mobility1 × 10−12 m4/(J∙s)[24]
D m e l t 0 Diffusion coefficient of WC in the melt4.054 × 10−5 m2/s[34]
QmeltDiffusion activation energy of the melt3.307 × 105 J/mole[34]
Dγ-NiDiffusion coefficient of WC in γ-Ni1 × 10−15 m2/s[35]
Dδ-WCDiffusion coefficient of WC in δ-WC1 × 10−15 m2/s[35]
νKinematic viscosity1.0 × 10−7 N∙s/m2-
Table 4. Parameters used in the simulations.
SymbolDescriptionValueSymbolDescriptionValue
Cγ-Ni,meltPoint A0 at%mmelt,γ-NiLine AB−5.67 K/%
Tγ-Ni,meltPoint A1770 Kmγ-Ni,meltLine AE−17 K/%
Cδ-WC,meltPoint D100 at%mmelt,δ-WCLine BD21.57 K/%
Tδ-WC,meltPoint D3110 Kmδ-WC,meltLine FD75.5 K/%
Cγ-Ni,δ-WCPoint C42.55 at%mγ-Ni, δ-WCLine EC23 K/%
Tγ-Ni,δ-WCPoint C2348 Kmδ-WC,γ-NiLine CF−20 K/%
Table 5. Chemical analysis of Figure 13c.
SymbolDescriptionComposition (at%)
WCFeCrNiNbMo
1WCCDB3.4217.4315.1917.237.82.380.85
2Columnar crystal0.092.4321.6722.348.771.220.53
Disclaimer/Publisher’s Note: The statements, opinions and data contained in all publications are solely those of the individual author(s) and contributor(s) and not of MDPI and/or the editor(s). MDPI and/or the editor(s) disclaim responsibility for any injury to people or property resulting from any ideas, methods, instructions or products referred to in the content.

