Article

Development of a Hydrophobic Polymer Coating in Polyurethane Organic–Mineral Base Containing Waste from Fibreglass Production

by
Karolína Hudec Jakubíková
*,
Jakub Hodul
,
Radek Hermann
and
Rostislav Drochytka
Faculty of Civil Engineering, Brno University of Technology, 602 00 Brno, Czech Republic
*
Author to whom correspondence should be addressed.
Submission received: 18 September 2023 / Revised: 23 October 2023 / Accepted: 3 November 2023 / Published: 12 November 2023
(This article belongs to the Section Functional Polymer Coatings and Films)

Abstract

:
In this study, the suitability of waste from glass fibre production as a secondary filler for a polymeric durable hydrophobic coating, based on an innovative polyurethane organic–mineral base, was experimentally verified. The main aim of this work was to develop a basic formulation for a polymeric hydrophobic coating designed primarily for usage in aggressive environments. For this purpose, a total of four formulations were tested with different weight percentages of waste glass fibre, i.e., from 30 to 60%. The basic properties in the fresh state, such as the coating workability and kinematic and dynamic viscosity, were verified, and an application test was performed. The formulations were also verified after the polymerisation of the coating. Adhesion on a concrete substrate and the tensile properties and hardness of the coating were tested. Chemical resistance to liquid aggressive media and the microstructure of the coating after exposure to SO2 were also tested, as these are critical properties. All the formulations showed better workability than the reference coating without a filler, and the formulation with the highest filling (60%) appeared to be optimal. The maximum adhesion on the concrete substrate (11.9 MPa) and tensile strength (21.6 MPa) were recorded for the formulation with 60% waste fibreglass. It can be concluded that with an increase in the waste glass content, there was a significant improvement in the properties of the coatings. Additionally, the waste fibreglass did not have a significant negative impact on chemical resistance.

Graphical Abstract

1. Introduction

Polyurethane coatings are typically categorised into one-component and two-component coatings, with the latter being more commonly utilised. These coatings can produce a film at ambient temperatures through the creation of a chemically cross-linked film. Polyurethane coatings are well known for their superior adhesion, high resistance to abrasion, consistent elasticity, excellent water resistance, and notable resistance to solvents, oils, and chemicals. Moreover, they possess outstanding electrical insulating properties [1,2,3]. Polyurethane coatings are therefore considered to be among the best existing polymer coatings. They are a fairly new family of materials that have a wide range of uses. The universality of these polymers is mainly attributed to the fact that it is possible to produce the desired polymer from a wide range of monomer materials, such as macrodiols or diisocyanates, as well as through chain extension effects [4]. These components are responsible for the main link required for polyurethane synthesis to occur, which is the result of isocyanate reactions. The individual components of the polyurethane resin then determine the properties of the resulting polymer. The production of these polymers requires four basic components, namely polyisocyanates, polyols, chain extenders, and catalysts [5,6,7,8].
The chemical reactions arising during the curing of polyurethane materials are based on the polyaddition and polycondensation reactions of isocyanates. In addition to the basic polyaddition reaction between multifunctional isocyanate and polyol, possibly with accelerator amines, there are side reactions of isocyanate with water to form CO2 and recombination reactions with polyaddition intermediates. In contrast, when sodium water glass enters the reaction with materials of the organic–mineral type, a porous network is formed that is significantly more stable—isocyanurate. Thus, synthetic resins are formed that have a very porous structure and are similar to ceramics. The pores are closed and smaller than 0.01 mm. The pore size is a function of the intensity of mixing of the two components. The pores are filled with silicic acid gel or sodium carbonate crystals, i.e., Na2CO3·10H2O [9,10,11]. Organic–mineral resins consist of a mineral (inorganic) component and an organic component. The dosage ratio of the two components is usually 1:1, and the reaction is exothermic. Organic–mineral resins are resistant to water, organic acids, alkalis, petrol, oils, and lubricants and show resistance to mechanical stress (abrasion, impact). An important characteristic of these materials is their density (greater than that of water), which allows them to be used in wet environments or even underwater. The advantage of these materials is that only water is released during the polymeric reaction, as well as a limited amount of CO2 as the volatile component, so they can also be applied in confined spaces [12,13,14,15].
The use of waste fillers in polymer coatings is a very topical issue, not only from an economic point of view but also from an ecological point of view [16,17,18,19]. Dwideved et al. [20] found that the addition of secondary fillers improved the mechanical properties of polymer coatings but also increased their viscosity and decreased their adhesion on substrates. Kumar et al. [21] described the effects of different types of fillers on the properties of polymer coatings. The results showed that the formed microstructure had a dense coating with an interpenetrating network. In the case of glass-fibre-reinforced polymers (GFRPs), thermoset polymers are used as a matrix because they present better mechanical properties and greater resistance to temperature, gas penetration, and impact when compared to polymers of a thermoplastic nature [22].
The future perspectives for the recycling of glass fibres are promising, so the development of a product composed of such reused material should be researched [23]. GFRP waste incorporation causes higher thixotropy to ensure easier gel-coating application; however, the mechanical properties of the resulting composites are lower those of the original GFRP material [24]. In one study, an increase in the glass fibre content in epoxy composites led to poor mechanical properties and lower wear resistance [25]. E-Glass-fibre-reinforced polymer composites have major advantages, such as the combination of a light weight and high strength-to-weight ratio; they are also easy to fabricate, which cannot be said of many conventional polymer materials [26].
The main purpose of a coating is to limit the ingress in concrete of water and salt solutions, i.e., substances that cause severe degradation problems [27]. The durability of hydrophobic surface treatments depends on the type of polymer used, the exposure conditions, and, importantly, the depth of penetration [28]. The penetration depth is taken as the thickness of the hydrophobic layer of the coating [29]. The use of an epoxy resin coating system with a hydrophobic organic top layer and a porous deep eutectic solvent (DES)-based inorganic conversion film as the bottom layer was proposed on a magnesium alloy substrate to improve the corrosion resistance of the substrate [30].
Such protective coatings for the surfaces of concrete exposed to harsh environmental conditions should also have a thickness (up to 2.5 mm) that is appropriate considering the effects of such an environment [31].
At present, there is a desire to find a suitable application for waste from the production of glass fibres. At the same time, the requirements of modern operations in terms of the degree of chemical resistance of surface-protective treatments, such as coatings and screeds, are growing. The aim of the present study was to find a suitable polymer-based composite that can create a functional, highly resistant coating up to a thickness of 1 mm that can withstand chemically stressed environments (especially wastewater, where HCl, NaOH, H2SO4, and SO2 are present). For this reason, a hybrid organic–mineral resin was also used in the composite, which stands out for its chemical resistance and ease of application. The aim was to develop and test suitable coatings with good mechanical parameters, excellent chemical resistance, and long-term durability, with the highest possible filler content, taking into account economic and ecological aspects.

2. Materials and Methods

2.1. Materials

2.1.1. Polymer Binder

Supermin is a hybrid polyurethane base and a two-component organic–mineral resin that is designed primarily for chemically and mechanically stressed environments. This material is highly chemically resistant and is used in this research as the polymer binder. Component A is a milky white liquid and is a mixture of organic additives and water glass (sodium silicate), and component B is a brownish-yellow liquid and is a modified polyisocyanate based on 4,4’-diphenylmethane diisocyanate (MDI), isomers, and homologues. The most common applications of this resin include casting, lamination, coating, and spraying. It can also be used underwater. It does not react with water and settles at the bottom due to its higher density. The polymer binder can be modified as required to optimise the workability time (for research purposes, the workability time was set at 30 min here). The basic parameters of the cured hybrid organic–mineral polyurethane resin are stated in Table 1. The mixing ratio of component A to component B was 1:1. This material was obtained from GME Consult, Ltd. (Ostrava, Czech Republic), which has long been involved in research on polyurethane and polyurea systems.

2.1.2. Fillers

In the development of the protective coatings, a secondary filler was incorporated into the formulations in the form of a by-product from fibreglass production. The chemical composition of the secondary raw material used as the microfiller is detailed in Table 2.
The chemical analysis revealed that it was E-glass. The majority (>90%) of fiberglass (wool) is E-glass due to its properties, composition, and versatile use. The approximate composition of E-glass is 52%–56% SiO2, 16%–25% CaO, 12%–16% Al2O3, 5%–10% B2O3, 0%–5% MgO, and <1% Na2O + K2O.
Pre-treatment of the waste from fibreglass production was carried out in a BB 200 jaw crusher (Retsch GmbH, Haan, Germany), followed by a RetschPM 100 CM planetary ball mill (Retsch GmbH, Haan, Germany). The surface area of the pre-treated fibreglass waste was determined by the permeability method using a PC Blaine Star apparatus (Zünderwerke Ernst Brün GmbH, Marl, Germany), resulting in a value of 330 m2·kg−1. The appearance of the fibreglass waste before and after treatment is shown in Figure 1.
A maximum grain size of 0.8 mm in waste fibreglass ensures the better cohesion of the composite and prevents the formation of silica gel in a form that does not damage the structure. The shape of the waste fibreglass particles determines the degree of cohesion with the polymer matrix, which can subsequently affect the hardness and tensile strength of the coatings.
The results of the bulk density, specific gravity, water absorption, and specific surface area of the pre-treated waste fibreglass are shown in Table 3. The raw material is non-absorbent, and, since it is not porous, the bulk density and specific gravity values are the same.

2.1.3. Tested Coatings

Different amounts of filler were used for each formulation, and they contained 30, 40, 50, and 60 wt.% of the binder. The amount of polymer binder used was determined according to the filling. The filling with secondary raw material was chosen based on previous research, where 25 wt.% filling was used [32], to test the waste parameters and viscosity of the polymer resin. The proposed formulations were tested in fresh and polymerised states. The reference formulation SPA Ref. was used, because this coating is currently being produced without a filler. The composition of the coatings is shown in Table 4.

2.2. Methods

The experiment was divided into two parts. In the first part, comparisons were made between the kinematic viscosity and the dynamic viscosity, a function of the amount of filler. In the next stage, the application of the coatings and the thickness of the fresh film were assessed. The second part dealt with the physical and mechanical properties, the adhesion of the coatings to the concrete substrate, and the tensile properties of the coatings. Additionally, the Shore D hardness of the coatings after seven days was verified, and the durability, chemical resistance, and microstructure of the hydrophobic coatings were tested.

2.2.1. Fresh State Tests

  • Density of the Fresh Coatings
The fresh density of the mixtures was measured in accordance with ASTM C138-16 [33] using a cylindrical mould with Ø 100 × 200 mm dimensions. To obtain the average density for each mixture, three measurements were taken.
  • Thickness of the Coatings
The thickness of the freshly applied coatings was measured in accordance with the EN ISO 2808 standard. This was done using a stainless steel hexagonal wet film comb to ensure uniform thickness for each layer of the coating. In the case of a multi-layer coating, the thickness ranges from 300 μm to 1 mm [34].
  • Dynamic Viscosity
The Elcometer 2300 viscosimeter (manufactured by Elcometer Instruments Ltd., Manchester, UK) was employed to measure the dynamic viscosity of the fresh coatings, in accordance with the EN ISO 2884-2 standard [35]. The viscosity measurement was performed at a temperature of 20 °C, and the R4 spindle was used for all tested coatings. The optimal speed of the spindle was determined to be 150 rpm for all formulations.
  • Kinematic Viscosity
The workability of the newly developed coatings depended heavily on the kinematic viscosity of the individual mixtures. To measure the kinematic viscosity, the Ford spout cup method was employed, in accordance with the cup dimensions specified in the EN ISO 2431 standard [36]. For optimal results, a Ford cup with a nozzle diameter of 12 mm was used to measure the viscosity. This process involved filling the cup to the rim and measuring the time that it took for the mass to flow through the 12 mm nozzle. The measurement ended when the cup was visibly empty.
  • Application Test
The non-standard workability and application test involved evaluating the spillage of the formulations. To perform the test, a 100 g sample of the coating was prepared and applied on a non-absorbent substrate. A plastic notched trowel with a tooth height and width of 6 mm was used to spread the sample over the surface. The spillage rate was assessed using a predetermined scale that was referenced to a specific point mass. The highest pour rate that can be achieved is graded 5, while the lowest is graded 0. The pour ratings are explained in Table 5.

2.2.2. Polymerised State Tests

  • Shore D Hardness
The determination of the hardness of the developed coatings followed the guidelines of EN ISO 868 [37], which involved using a hardness tester to indent the surface. The Shore durometer LD0551 with a D-type tip (TQC Sheen, Molenbaan, The Netherlands) was used for this test, whereby the tip of the durometer was pressed into the surface of the mass and the resulting hardness was read. The hardness value is inversely proportional to the depth of the indenting tip and depends on the elastic modulus and the viscoelasticity properties of the material.
  • Adhesion to Concrete Substrate
A pull-off test was performed to determine the adhesion of the coatings to the concrete substrate. This was carried out according to the EN ISO 4624 standard [38], in which the force required to remove the coating from the substrate was measured. The test indicates the pull-off strength necessary to cause the failure of the weakest interface (adhesion damage) or the weakest part (cohesion) of the composite, and both types of failure are possible.
The test was conducted on a class C16/20 concrete surface. The coatings were applied to the surface of the substrate with a plastic notched trowel in one layer with a thickness of approximately 350 µm. The concrete adhesion test was performed with an Elcometer 506-20D adhesion tester manufactured by Elcometer, Ltd. (Manchester, UK), 14 days after the coating had been applied to the substrate and upon removal from the concrete.
  • Tensile Properties
Determination of the tensile strength and the relative elongation at first break was performed according to the EN ISO 527-1 [39] and EN ISO 527-2 [40] standards. Each test involved a set of six samples of type 1BA dog bone, which had been polymerised for 14 days prior to the test. The objective of the test was to stretch each sample in the direction of its main longitudinal axis at a constant rate until its breakage. The test was carried out by applying a continuously increasing tensile force at a constant speed of 4 mm/min. Throughout the test, the deformation of the sample was monitored by a strain gauge, which measured the change in the initial length L0 of the elongation gauge (50 mm). The Testometric MT 350-20CT tensile testing machine (Testometric Ltd., Rochdale, UK) was used for the test.
  • Water Absorption Test
The ASTM D-570 test method serves two main purposes in determining the degree of water absorption of hydrophobic coatings containing fibreglass waste [41]. Firstly, it determines the percentage of water absorbed by the material. Secondly, it determines the effects of water or moisture, where relationships between moisture and the electrical or mechanical properties, dimensions, or appearance have been established. Samples with a thickness of 1.59 mm or less were placed in a weighing bottle and weighed. The dimensions and weights of the specimens were recorded to the nearest 0.001 g before testing. The test involved immersing the conditioned specimens in a container of distilled water at 23 ± 1 °C for 24 h. After 24 h, the samples were removed, and any surface water was wiped off with a dry cloth before weighing to the nearest 0.001 g.
  • Chemical Resistance to Aggressive Liqiud Media
The chemical resistance of the coatings was tested using non-standard tests on 20 mm × 20 mm × 100 mm samples. These samples were subjected to aggressive exposure for three months at a temperature of 20 ± 2 °C.
The samples were exposed to 10% and 30% solutions of sulfuric acid, hydrochloric acid, and sodium hydroxide after complete polymerisation (seven days). The chemical resistance was characterised by comparing the changes in weight and flexural strength before and after exposure to aggressive chemical media. Each formulation was then visually evaluated for distortion, cracks, colour changes, etc., according to the EN ISO 4628-1:2016 standard evaluation system for accelerated chemical resistance testing. Finally, the changes in the microstructure of the samples before and after chemical stress were evaluated [42]. The microstructure was assessed using the Keyence VHX950F optical microscope (Keyence Ltd., Osaka, Japan) with a real magnification of up to 160×.
  • Resistance to a Humid Atmosphere Containing SO2
In the field of material science, evaluation of the protective function of organic coatings is critical to ensure their durability and longevity. In this study, the test method according to the EN ISO 3231 standard [43] was used to assess the resistance of the organic coatings to a humid atmosphere containing SO2, where water gradually condensed due to the almost 100% relative humidity. The samples were inserted into an I HK 800 airtight corrosion gas chamber (Köhler Automobiltechnik GmbH, Lippstadt, Germany). The corrosion test was conducted in 24 h cycles, during which the samples were exposed to SO2 (concentration 3.375‰) and a temperature of 38 °C for 8 h, followed by drying to the laboratory temperature and humidity below 75% for the remaining 16 h, when the chamber door was opened. In total, the samples were subjected to 40 cycles. The coatings were applied to the concrete beam surface with dimensions of 40 mm × 40 mm × 160 mm according to its workability at the maximum possible thickness per 1 m2. Three specimens of each formulation were tested.
The degree of corrosion of the substrate’s surface was evaluated using the ASTM D 610-85 method [44]. The term “pro-corrosion” was used to define the failure of the protective function of the coating and the spread of corrosion on the surface of the coating. Mechanical testing was then performed, in which the depth of corrosion was determined. The protective function of the coating was evaluated by expressing the degree of corrosion of the substrate’s surface as a percentage. The samples were compared to the reference sample without surface treatment to determine the effectiveness of the developed coatings.
This evaluation provided information regarding the resistance of the organic coatings to the chemical processes that lead to defects in a protected substrate resulting from the diffusion of the surrounding environment. The organic coatings were compared to the standards, and the blisters were evaluated for their size and frequency. The size of the blisters was rated on a scale of 2 (largest) to 10 (extremely small). The frequency of the blisters was rated as F (low density), M (medium density), MD (medium coverage), and D (dense coverage). The last verification was the determination of the depth of carbonation in the hardened concrete according to the EN 14630 standard [45]. Overall, the results of these evaluations provided crucial information regarding the durability and effectiveness of the organic coatings to protect concrete from corrosion and other forms of degradation in harsh environments.

3. Results and Discussion

3.1. Results of Tests Performed in the Fresh State

3.1.1. Density of the Fresh Coatings

The density of each freshly mixed coating (see Table 6) increased with the incorporation of the filler. This increase also led to the thickening of the coating due to higher viscosity and an increase in the adhesion and dispersion of the fillers while reducing defects. Similar observations were made by Zhang et al. [46].
The incorporation of fillers into the polymer matrices is a common practice within the industry to enhance the polymer’s properties. Fillers are introduced to elevate the overall bulk density of the polymer, thereby reducing costs and refining the polymer’s properties. A judicious amount of filler can effectively enhance specific mechanical or physical attributes of polymers [47].

3.1.2. Thickness of the Coatings

The thicknesses measurements of the coatings are shown in Figure 2. As the filler ratio increased, the viscosity and the thickness of the fresh coatings also increased.
This occurrence is common in the incorporation of nanocomposites into a polymer matrix and can be attributed to changes in the mobility of the polymer due to the interaction of the polymer chains with the nanoparticle surfaces. This region of the polymer matrix in which interactions with nanoparticle surfaces substantially modify the dynamics and properties of the chain is usually referred to as an interphase [48,49].
The highest thickness value of 900 μm was achieved by the SPA 60 formulation.

3.1.3. Dynamic Viscosity

The viscosity values of the coatings are shown in Table 7. With an increased amount of filler in the polymer binder, from 30 wt.% to 60 wt.%, the viscosity increased almost 10-fold, indicating that it is possible to regulate the viscosity characteristics of the polymer coating for better application in the planned exposure environment. One reason for the increased viscosity is that microfillers increase the fractional volume of solids in the coating. This leads to an increase in the coating’s viscosity due to the higher concentration of particles that impede the flow of the coating. As the concentration of the microfiller increases, the particles can also form agglomerates, which further increases the viscosity of the coating [50]. The size and shape of the microfiller can also affect the viscosity of the coating: wavy microfillers generally have a larger surface area and tend to form more stable suspensions than larger particles, which can increase the viscosity. These assumptions and conclusions were also confirmed in the studies by Chowaniec-Michalak et al. [51] and Parente et al. [52].
Mechanical and microstructural processes in the incorporation of the microfiller into the polymer coating are also connected with the dynamic viscosity. When solid fractions are added to the liquid, they act as barriers and impede its flow. This increases the flow resistance and the viscosity.

3.1.4. Kinematic Viscosity

The results of the kinematic viscosity evaluations of the polymer coatings are shown in Figure 3. The sample with largest amount of filler (60%) showed up to three times higher kinematic viscosity than the reference coating without any filler. With a flow time of 8.53 s, the coating with waste fibreglass content of 30% (SPA 30) was closest to the reference sample in terms of viscosity. Although the viscosity of the coating tended to increase with an increasing amount of filler compared to the reference coating, higher kinematic viscosity was desirable for the planned manual application, preventing the coating from dripping and the formation of defects on the surface.
By comparing the results with those of other studies, it can be stated that admixtures increase the viscosity of polyurethane coatings. In the work of Wołosiak-Hnat et al. [53], inorganic admixtures (10–20 wt.%) increased the viscosity of a polyurethane resin for lamination more than twice. Deng et al. [54] observed that polyurethane composites exhibited higher viscosity and poorer flowability when the mineral powder and calcium carbonate filler content reached 40 wt.% and 20 wt.%, respectively.

3.1.5. Application Test

The application test results are detailed in Table 8. The surface of the reference coating, without any filler, had no visible squeegee strokes or surface defects. In contrast, with increasing viscosity and filler content, the coating stopped flowing and oozing. These properties are ideal for concrete and metal remediation, and a coating with these properties can also be applied horizontally by a brush or squeegee. The application of the reference and most filled coating (SPA 60) using a notched trowel is shown in Figure 4. Similar results were confirmed in the study by Deke et al. [55], where the direct effects of rheological additives on important coating properties such as levelling, flow control, and settling in the can during storage, etc., were confirmed.

3.2. Results of Tests in Polymerised State

3.2.1. Shore D Hardness

The resulting hardness values are shown graphically in Figure 5. All developed formulations showed higher values than the reference coating, which did not contain any filler.
These results confirm those of Malaki et al. [56] and Haupert et al. [57], who found that increasing the content of nanofillers in polymer coatings increased the hardness of the coatings. The hard and stiff nature of the nanofiller improves the stiffness of the mixture, manifested by the increased strength of the matrix against external loading and deformation.

3.2.2. Adhesion to Concrete Substrate

Based on the results in Table 9, the adhesion strength of the coatings to the concrete increased with the amount of filler in the polymer matrix. The failure mode for all the formulations was in the substrate (Figure 6), which indicated that the adhesion of the coating to the concrete was higher than the bond strength indicated by the pull-off from the concrete substrate. However, it is worth noting that the SPA 60 formulation had significantly greater adhesion to the concrete (11.89 MPa) compared to the other formulations, with a value more than three times higher than that of SPA Ref.
Overall, the results indicate that a larger amount of filler does not impair the adhesion of the coating to concrete.
The adhesion of all formulations agrees with the results of previous studies [58,59] that found a strong interaction between the NH (nitrogen–hydrogen) groups in the coating material and the CO (carbon–oxygen) groups on the surface. This interaction is called dipole–dipole interaction and contributes to the effectiveness of the coating’s adhesion to the substrate. There are also hydrogen bonds, which are formed between the coating and the concrete substrate. Hydrogen bonding is a type of attractive force that holds two materials together. This is because a higher NCO/OH ratio leads to the formation of more polar urethane bonds (NH–CO–O). These polar bonds contribute significantly to the increase in adhesion strength.

3.2.3. Tensile Properties

The results in Figure 7 show that the tensile stress at first break of the newly developed polymer coatings increased with the increased amount of filler. The highest tensile stress was achieved by the SPA 60 sample containing 60% filler (21.6 MPa). This suggests that there may be an optimal filling quantity to achieve the maximum tensile stress of the coating. The tensile stress values for SPA 60 and SPA 40 were relatively close, while SPA 50 and SPA 30 showed lower tensile stress values.
Similarly, the tensile strain at first break decreases with decreasing filler quantities (see Figure 8). This indicates that a higher percentage of filler can lead to the more ductile behaviour of the polymer coating. The tensile strain values for SPA 60 and SPA 50 are relatively close, while SPA 40 and SPA 30 have lower tensile strain values. This may be due to the free volume and pores formed in the samples and the low bonding between the polymer chains due to not filling the pores with secondary filler. The ideal values for the tensile properties of a protective polymer coating depend on its specific application and its intended use. Generally, the tensile properties of a protective coating should be sufficient to resist deformation and damage under normal operating conditions and stress.
The results are consistent with Das et al. [60], who claimed that the addition of a filler to the polyurethane matrix significantly improves the stiffness and tensile strength and reduces the cost of the coating.
According to Das et al. [61], all mineral particles are rigid and have a higher modulus of elasticity than pure polyester powder coatings, so the elongation when the coatings break is affected by their incorporation.

3.2.4. Water Absorption Test

The water absorption ratio is calculated based on the weight increase of the specimens in wet conditions. Based on the results in Table 10, the SPA 60 sample showed the lowest rate of water absorption, resulting in a minimal swelling ratio compared to the other formulations. It was also observed that the water absorption decreased with a higher filling rate as the porosity of the sample decreased—the microfiller particles filled the pores where moisture could be present. The SPA 60 coating also outperformed the samples with lower amounts of filler in terms of hydrophobic characteristics. A minimal swelling ratio is ideal to improve the mechanical properties of composite materials. When the coating is used in an environment where even less absorption is desirable, a modification of the chemical composition of the resin itself can be considered [62,63].

3.2.5. Chemical Resistance to Liquid Aggressive Media

The evaluation of the coatings’ chemical resistance in the form of changes in the specific physical and mechanical parameters is described in Table 11. The chemical resistance of coatings is crucial to ensure their long-term durability and stability in a variable, chemically aggressive environment. The used concentrations of the aggressive substances were intentionally several times higher than currently found in sewers, and the tests were intended to simulate long-term exposure to aggressive environments. The hydrophobic coatings were designed to protect the concrete substrate from the aggressive environment.
The results are crucial in assessing the durability and stability of coatings designed to protect concrete substrates from degradation. The concentrations of aggressive substances used in the tests were intentionally higher than those typically found in sewers, simulating long-term exposure to extreme conditions. Overall, the weight changes were relatively small, indicating that the protective coatings effectively resisted significant alterations in weight due to chemical exposure. Generally, the three-point flexural strength values remained within an acceptable range, suggesting that the protective coatings retained the concrete’s structural integrity, even in chemically aggressive environments. The majority of the coatings showed minimal visual changes, and only slight discolouration of the coatings was observed in some samples. Overall, the coatings exhibited favourable resistance to the aggressive liquid solutions chosen for the test. The protective coatings effectively mitigated weight changes, retained the flexural strength of the concrete substrate, and maintained its visual appearance. These factors are important in ensuring the long-term durability and stability of concrete objects exposed to chemically aggressive environments.
Vipulanandan et al. [64] exposed a polyurethane coating with 10% sulfuric acid and proved that polyurethane coatings can extend the life of concrete by 14 times without any failure due to their high chemical resistance. Wang et al. [65] concluded that the higher chemical resistance of polyurethane coatings is mainly due to the large number of hydrogen bonds, which have large intermolecular forces and chemical stability. This observation was also confirmed by Lenzi et al. [66], who found that high mechanical strength and chemical stability with crosslinking ability and biocompatibility were achieved with a combination of an aliphatic poly-isocyanate trimer and higher-order trimer. S. Gaikwad et al. [67] studied eco-friendly polyurethane coatings from cottonseed and Karanja oil-coated panels, where the panels were immersed in aqueous solutions of NaOH (5%) for 48 h, xylene for 120 h, and HCl (5%) for 120 h, as well as water. The polyurethane coatings showed good corrosion resistance to acids and alkalis.
To identify the formulation with the best chemical resistance, an analysis of the obtained data and the specific characteristics of each formulation was needed, particularly in relation to the amount of waste fibreglass filling. Since all the formulations were polyurethane-based, a focus on the impact of the waste fibreglass filling on their chemical resistance was crucial. The SPA 30 formulation had the best chemical resistance among all tested formulations, as it effectively retained its mechanical properties and showed an increase in flexural strength after exposure to aggressive chemicals. Although all the coatings exhibited similar weight changes and visual alterations, SPA 30 demonstrated a significant increase in flexural strength after exposure to aggressive aqueous solutions. This indicates that the 30% waste fibreglass filler enhanced the chemical resistance and reinforced the polyurethane-based coating. It is important to note that the different amounts of the waste fibreglass filler likely contributed to the observed differences in chemical resistance.
These results are consistent with the research by Malaki et al. [68], who investigated the effect of nanosilica on the chemical resistance of polyurethane coatings and found that the samples reinforced with silica nanoparticles showed greater wear resistance than the pure polymer. This verifies that the addition of silica nanoparticles effectively extends the service life of polymer coatings.
  • Microstructure before and after chemical stress
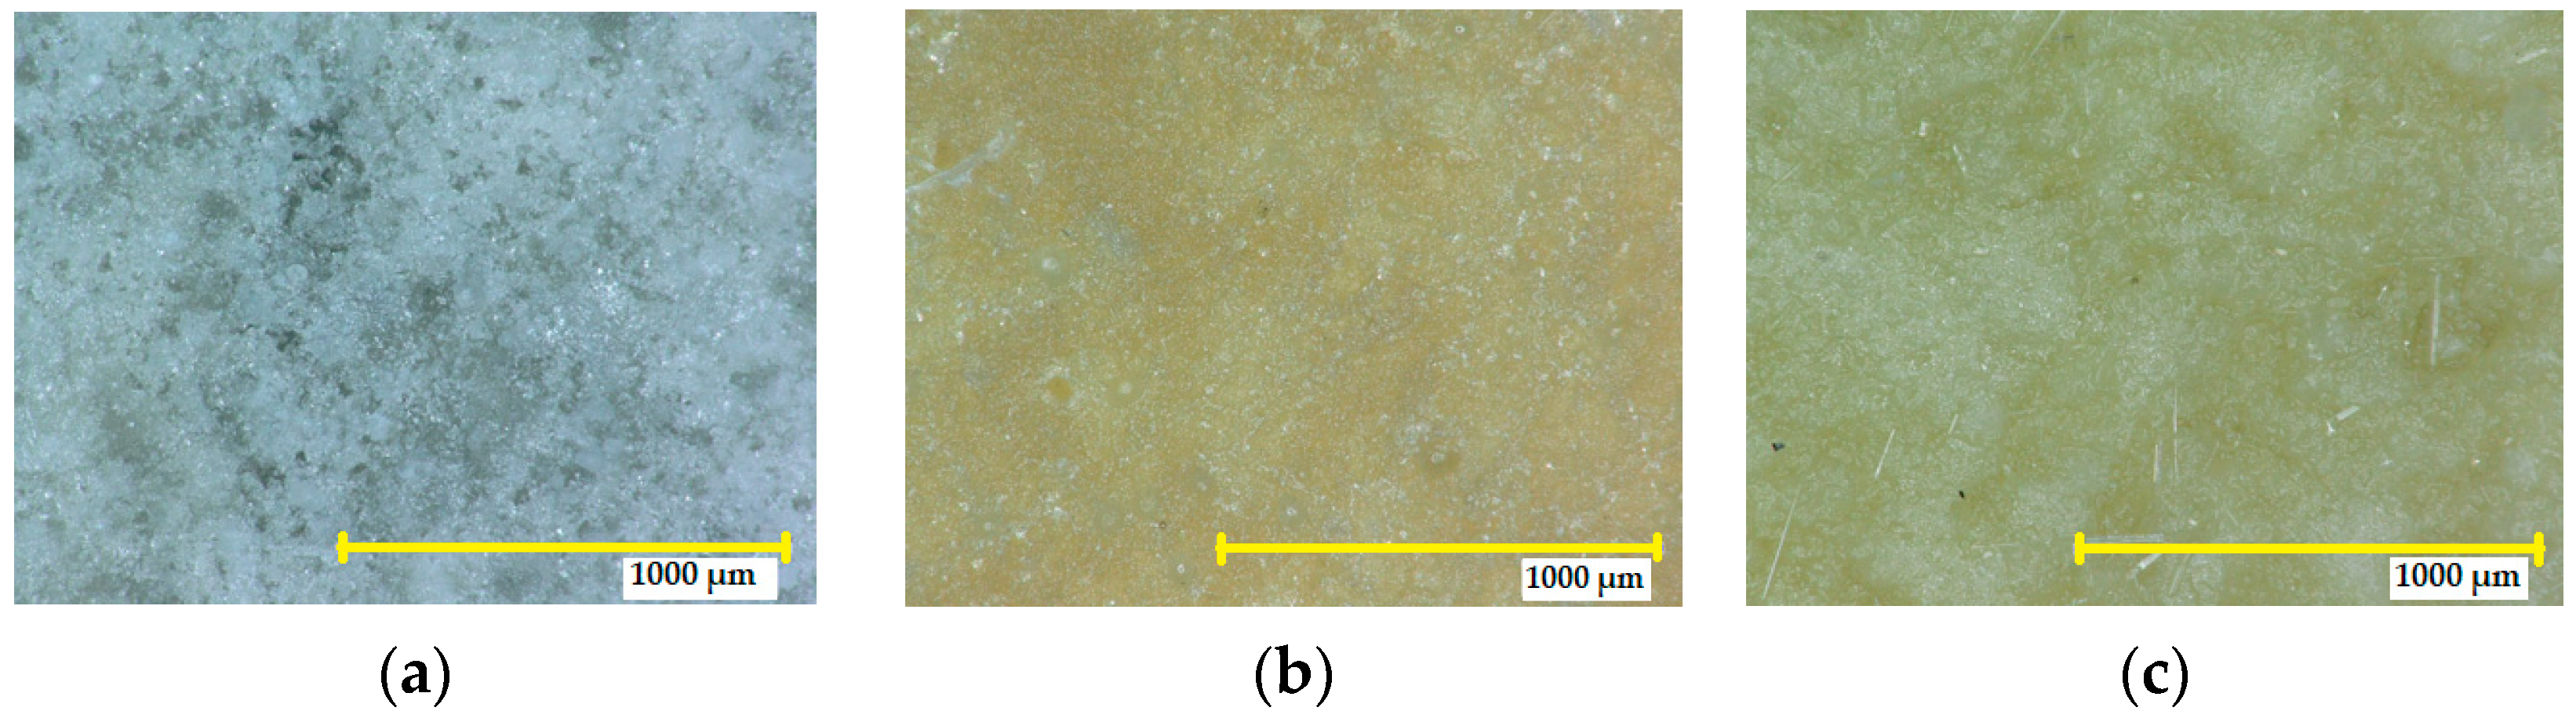
The SPA 30 coating exposed to 10% HCl did not have visible cracks or defects (see Figure 9). However, there was a colour change, and the intensity of the change was classified according to EN ISO 4628-1:2016 as grade 3 (medium), which is a clearly detectable yellow discolouration, without visible blistering. The degree of flaking was 0—the surface area did not show any flaking. Exposure to a higher concentration of nitric acid (30%) resulted in a marked change in colour to yellow (grade 3), compared to the reference sample. Cracks could be seen at 10× magnification, which were classified as grade 0 regarding the size and number of cracks. Furthermore, no blistering or defects were visible under the microscope.
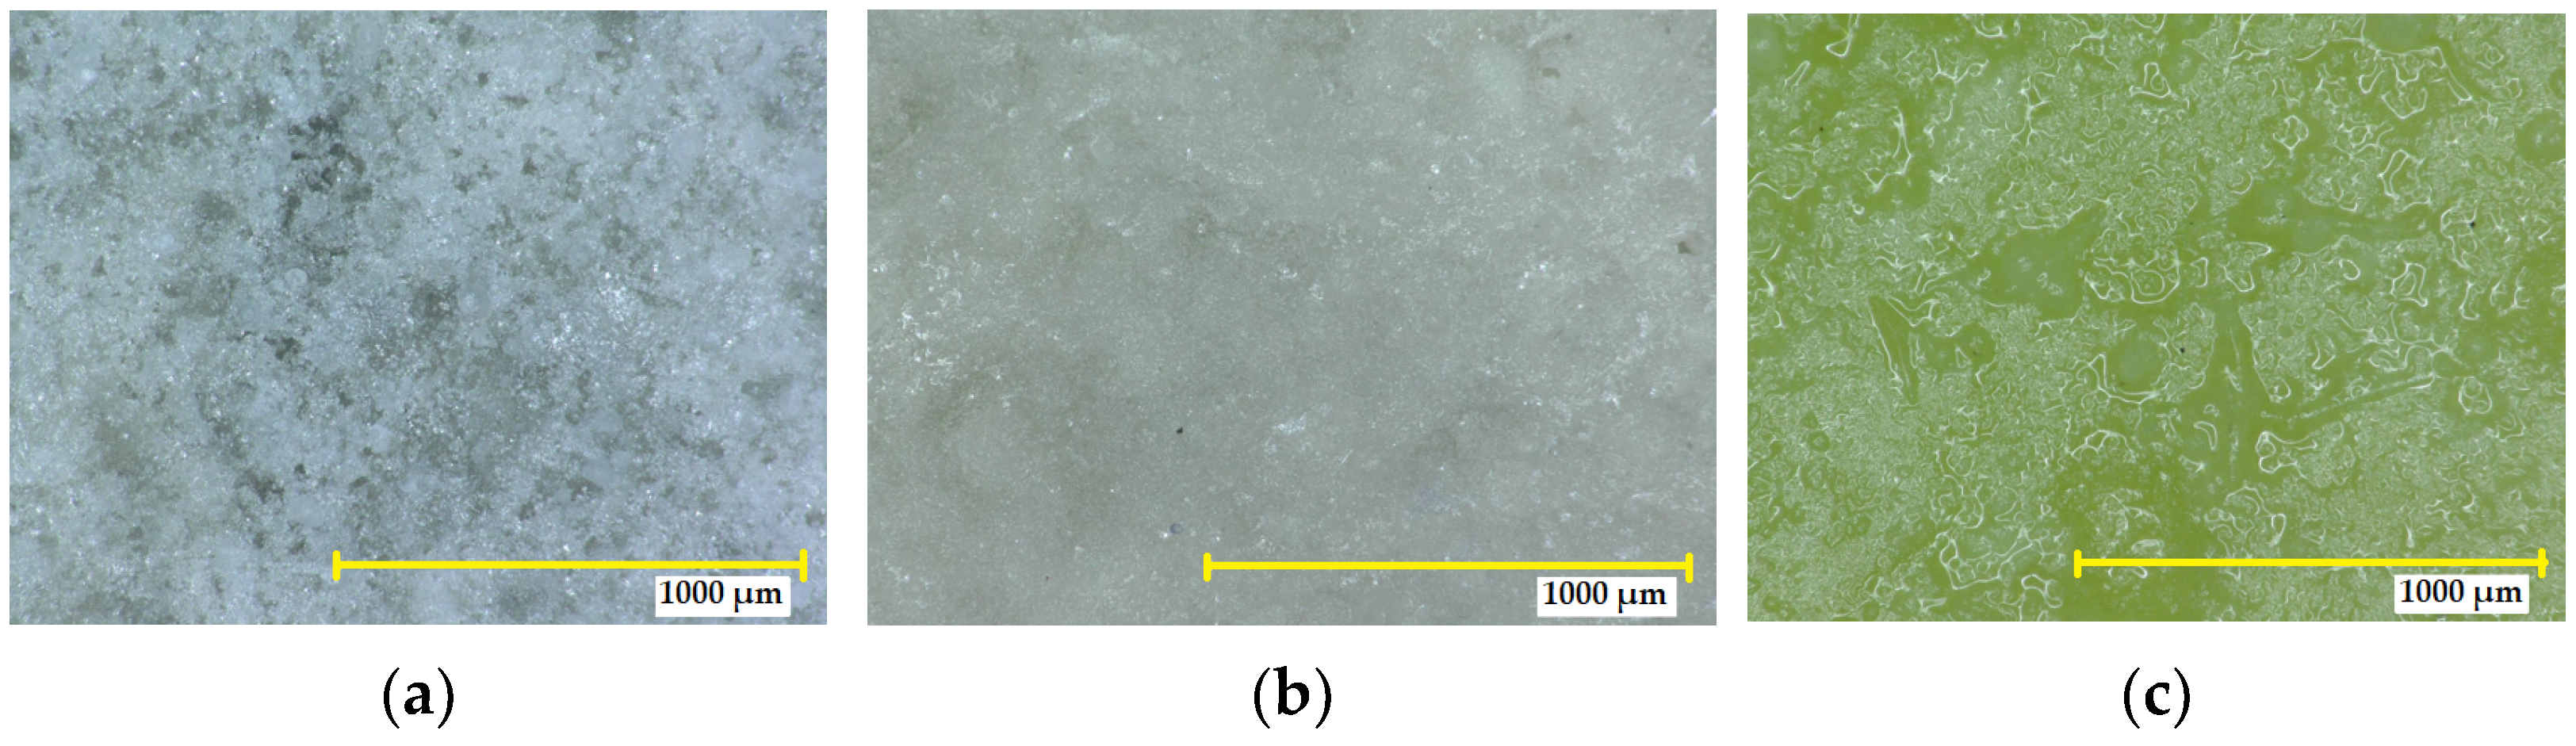
The SPA 30 coating exposed to 10% sulfuric acid showed no detectable cracks (grade 0) or defects (see Figure 10). However, there was a change in colour, and the intensity of the change was classified according to EN ISO 4628-1:2016 as grade 2—very small, just detectable, and lighter in colour. No blistering was detected. The degree of flaking was 0. Exposure to a higher concentration of sulphuric acid (40%) resulted in a significant change in colour (to a yellow/green), compared to the reference (grade 4). Cracks could not be seen at 10× magnification, so the degree of the size and number of cracks was 0. No blistering was observed, and no other defects were visible under the microscope.
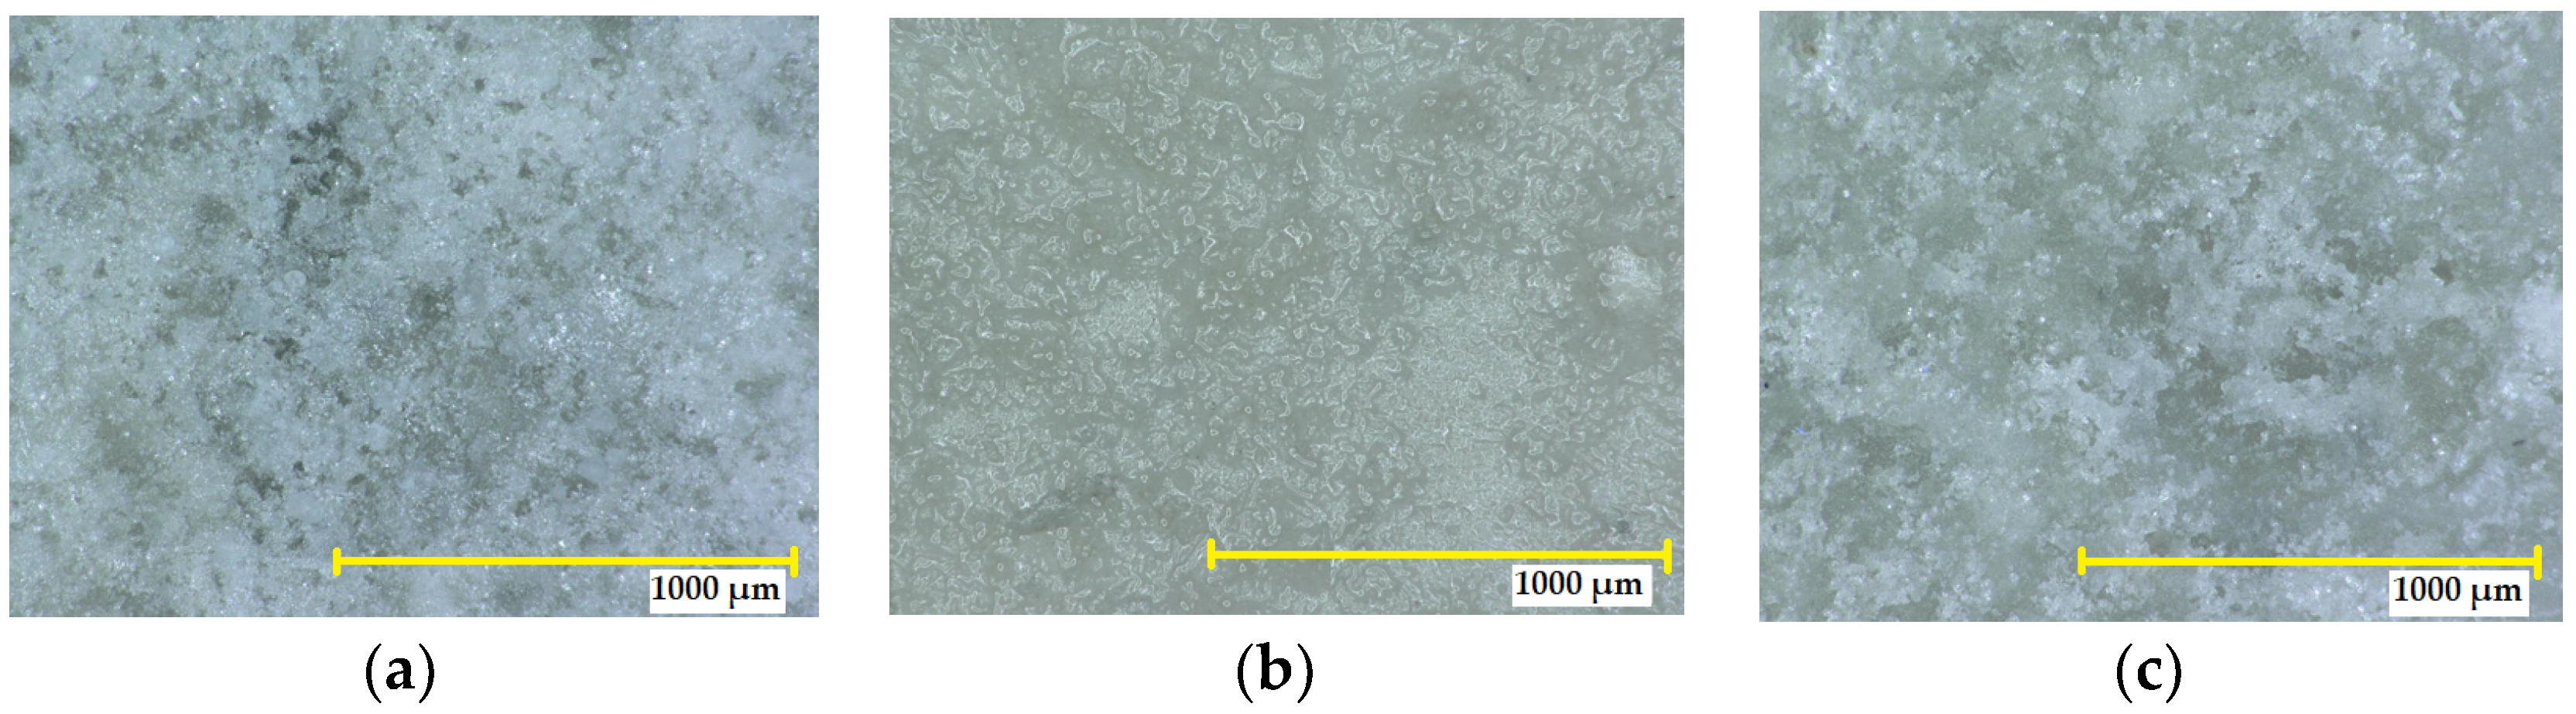
Exposure of the SPA 30 coating to 10% sodium hydroxide resulted in no detectable cracks and no visible coating defects. No colour change was observed, and the intensity of the change was classified according to EN ISO 4628-1:2016 as grade 0—no detectable change. The degree of flaking was 0. The exposure of the coatings to a higher concentration of sodium hydroxide (30%) resulted in no colour change compared to the reference (grade 0). Cracks could not be defined at 10× magnification, so the degree of the size and number of cracks was 0. No blistering occurred. No other defects were visible under the microscope compared to the reference (see Figure 11).
The sample with the SPA 40 coating exposed to 10% HCl showed no cracks or defects. However, there was a noticeable colour change, classified as grade 3 (medium), indicating a clearly detectable yellow discolouration, based on the EN ISO 4628-1:2016 standard. No blisters were observed, and there was no flaking on the coating’s surface. When the sample was subjected to a higher concentration of nitric acid (30%), a significant colour change to yellow (grade 3) was observed compared to the reference sample. Cracks were not observable at magnification 10×, indicating grade 0 in terms of the size and number of cracks. No blisters were present, and no defects were visible under the microscope.
When exposed to 10% sulfuric acid, no cracks (grade 0) or visible defects were detected. However, there was a noticeable colour change, classified as grade 2 according to the EN ISO 4628-1:2016 standard. This change was very small, resulting in a lighter colour compared to the original shade. No blisters were observed, and there was no flaking on the surface of the coating.
Upon exposure to a higher concentration of sulfuric acid (30%), a significant colour change was observed compared to the yellow-green reference (grade 4). At magnification of 10×, cracks could not be identified, indicating grade 0 in terms of the size and number of cracks. No blistering was present, and no other defects were visible under the microscope.
When exposed to 10% sodium hydroxide, no cracks or visible defects were detected. There was no discernible colour change, resulting in a grade 0 classification according to EN ISO 4628-1:2016. The surface exhibited no flaking. Upon exposure to a higher concentration of sodium hydroxide (30%), there was no colour change observed compared to the reference sample (grade 0). At magnification of 10×, cracks could not be identified, indicating a grade of 0 in terms of the size and number of cracks. No blistering was observed. When compared to the reference, no other defects were visible under the microscope.
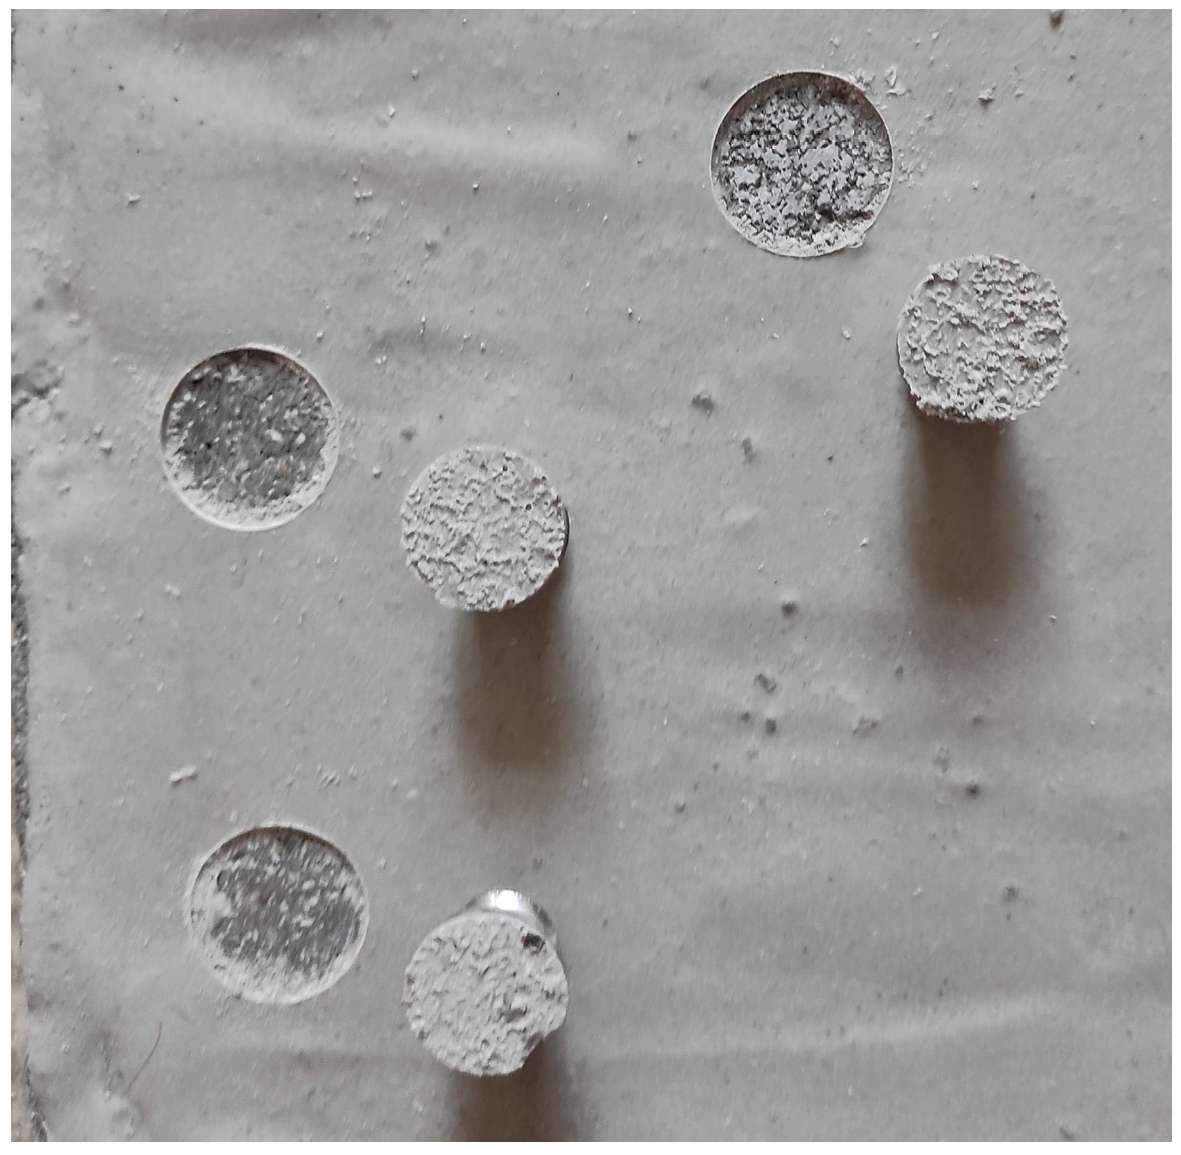
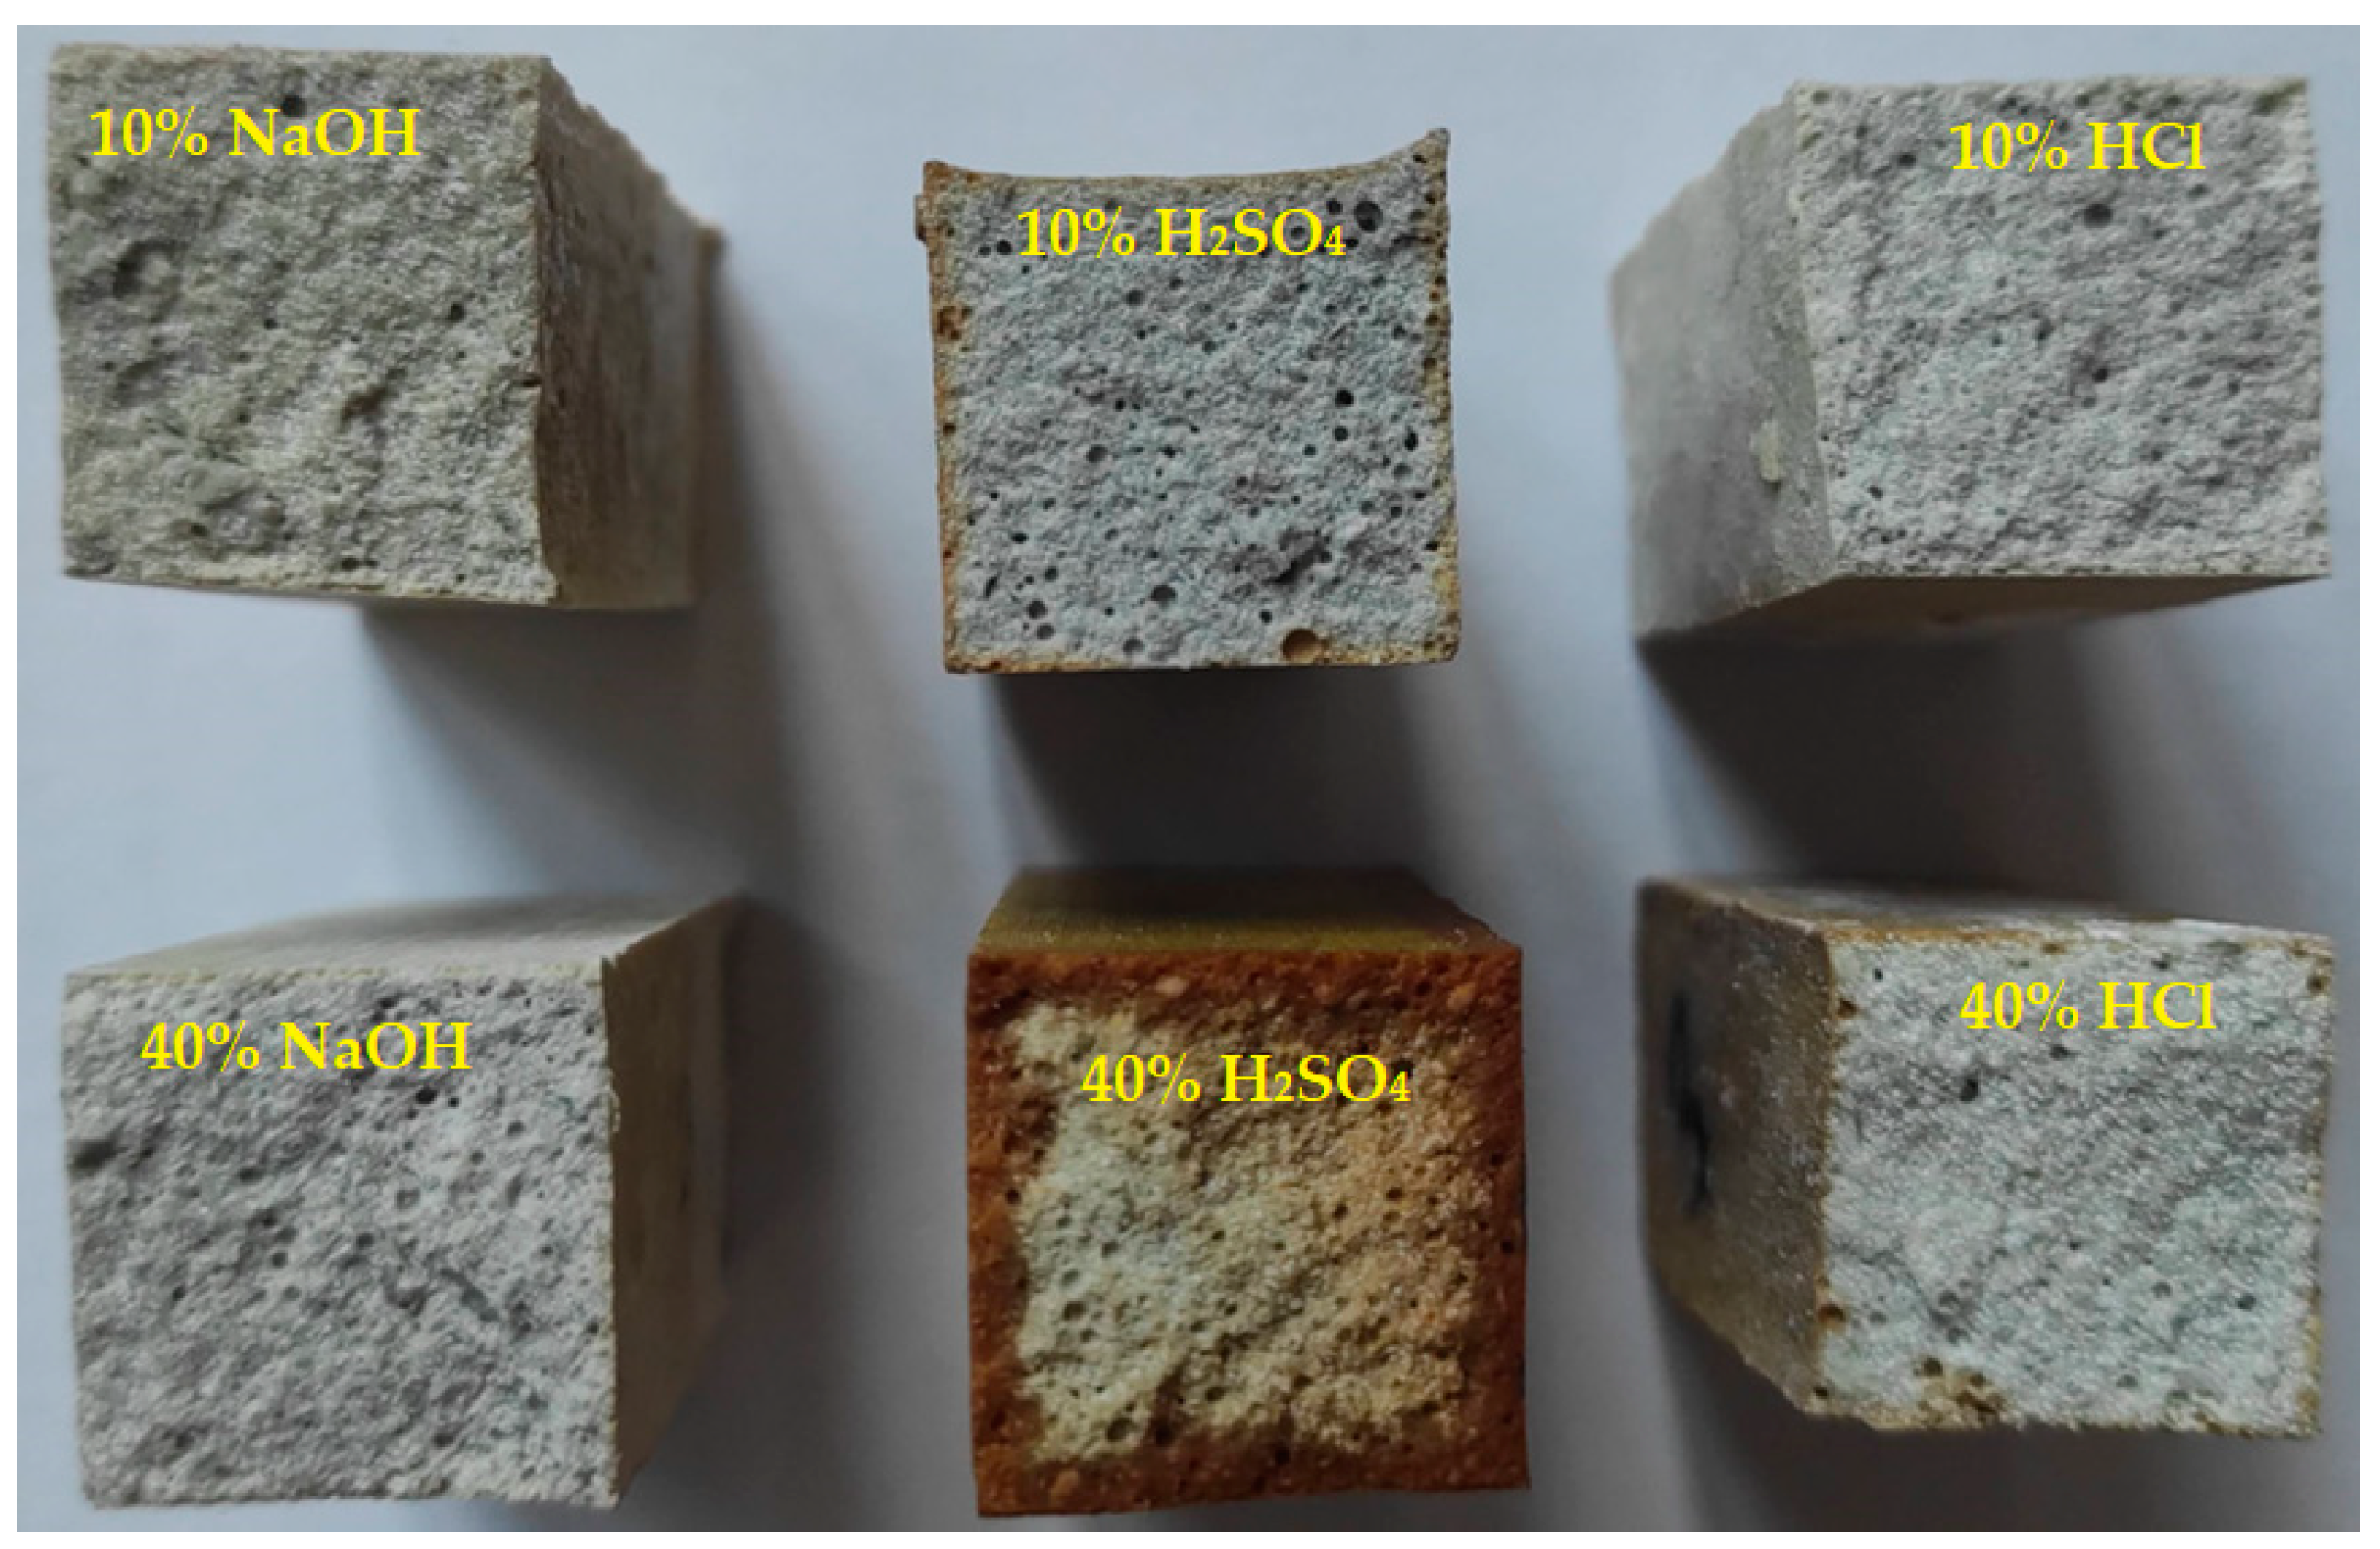
The fractured surfaces of the SPA 40 samples after exposure to the single-step chemically aggressive environments are shown in Figure 12. For the sample that was exposed to the strong solution of sulfuric acid, the image clearly shows how deeply the acid penetrated the sample, characterised by orange discolouration. For the other samples, there was no significant penetration of the solutions into the concrete.
The microstructure of the SPA 50 sample exposed to 10% hydrochloric acid showed no visible cracks or defects. However, there was a noticeable grade 3 (medium) colour change, manifesting as yellow discolouration. No blisters or flaking were observed. The exposure to a higher concentration of nitric acid (30%) resulted in a significant yellow colour change (grade 3) compared to the reference sample. No cracks were visible at 10× magnification (grade 0), and no blisters or other defects were observed under the microscope.
The sample exposed to 10% sulfuric acid exhibited no cracks or defects (grade 0). However, there was a detectable colour change, classified as grade 2, resulting in a lighter shade compared to the original colour. No blisters or flaking were observed on the surface. The exposure to a higher concentration of sulfuric acid (30%) caused a significant colour change compared to the yellow-green reference (grade 4). No cracks were visible at 10× magnification (grade 0), and no blistering occurred. Aside from the change in appearance, no other defects were observed under the microscope.
The sample exposed to 10% sodium hydroxide showed no visible cracks or defects. There was no detectable colour change (grade 0) according to the EN ISO 4628-1:2016 standard. The surface did not exhibit any flaking. When exposed to a higher concentration of sodium hydroxide (30%), there was still no colour change observed compared to the reference sample (grade 0). At 10× magnification, no cracks were identifiable (grade 0) in terms of size and number. No blistering was occurred, and no additional defects were visible under the microscope when compared to the reference sample.
The microstructure of the SPA 60 sample exposed to 10% hydrochloric acid showed no cracks or other visible defects. However, there was a noticeable (medium) colour change (grade 2), indicated by yellow discolouration. No blisters or flaking were observed. Exposure to a higher concentration of nitric acid (30%) resulted in a significant yellow colour change (grade 3) compared to the reference sample. No cracks were visible at 10× magnification (grade 0), and no blisters or other defects were observed under the microscope.
The sample exposed to 10% sulfuric acid exhibited no visible cracks or defects (grade 0). However, there was a detectable colour change, classified as grade 2, presenting as a lighter shade compared to the original colour. No blisters or flaking were observed on the coating’s surface. Exposure to the higher concentration of sulfuric acid (30%) caused a significant colour change compared to the yellow-green reference (grade 4). No cracks were visible at 10× magnification (grade 0), and no blistering occurred.
The sample exposed to 10% sodium hydroxide showed no visible cracks or defects. There was no detectable colour change (grade 0) according to the EN ISO 4628-1:2016 standard. The surface did not exhibit any flaking. When exposed to the higher concentration of sodium hydroxide (30%), there was still no colour change compared to the reference sample (grade 0). At 10× magnification, no cracks were identifiable (grade 0) in terms of size and number. No blistering occurred, and no additional defects were visible under the microscope when compared to the reference sample.
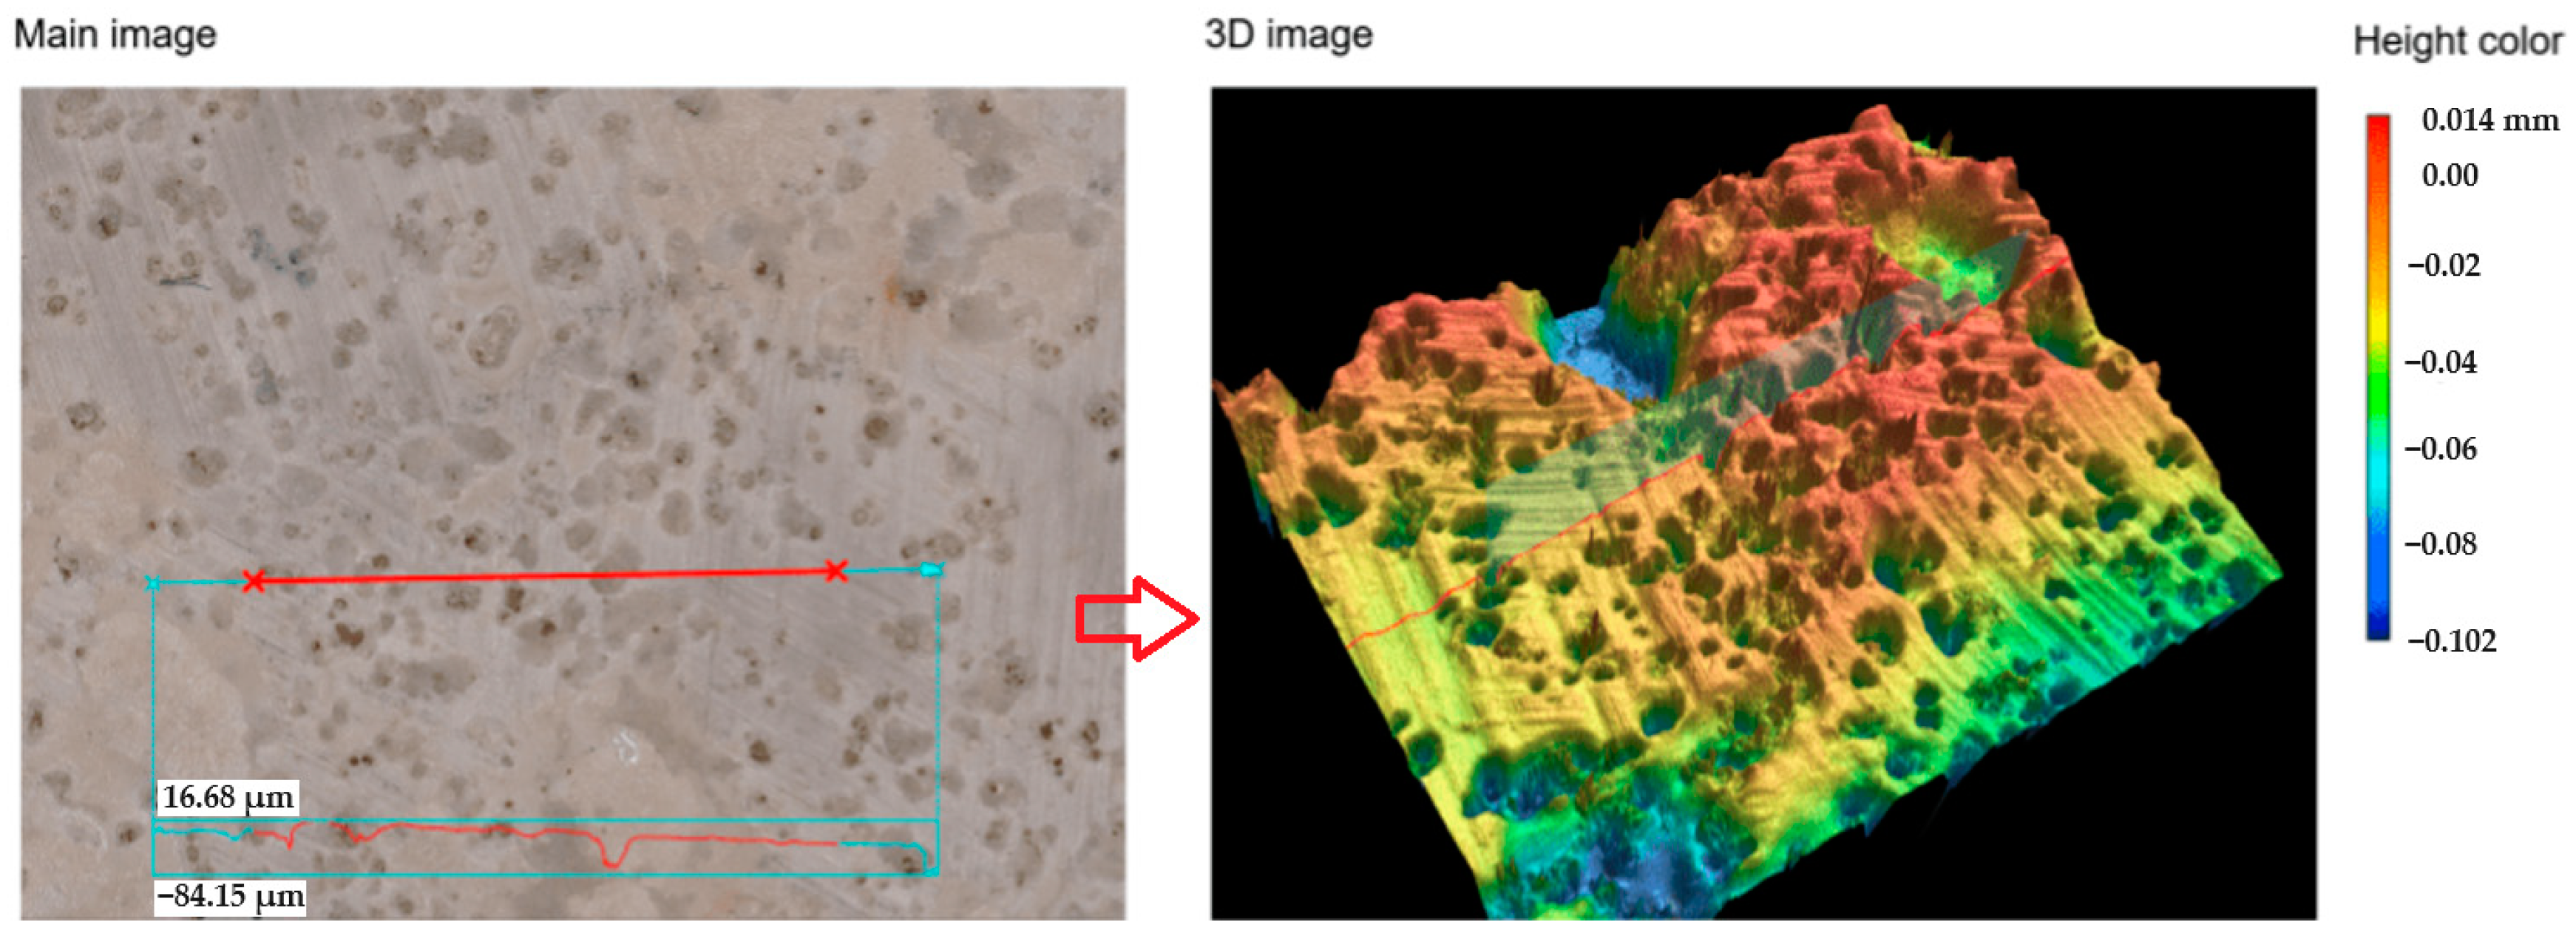
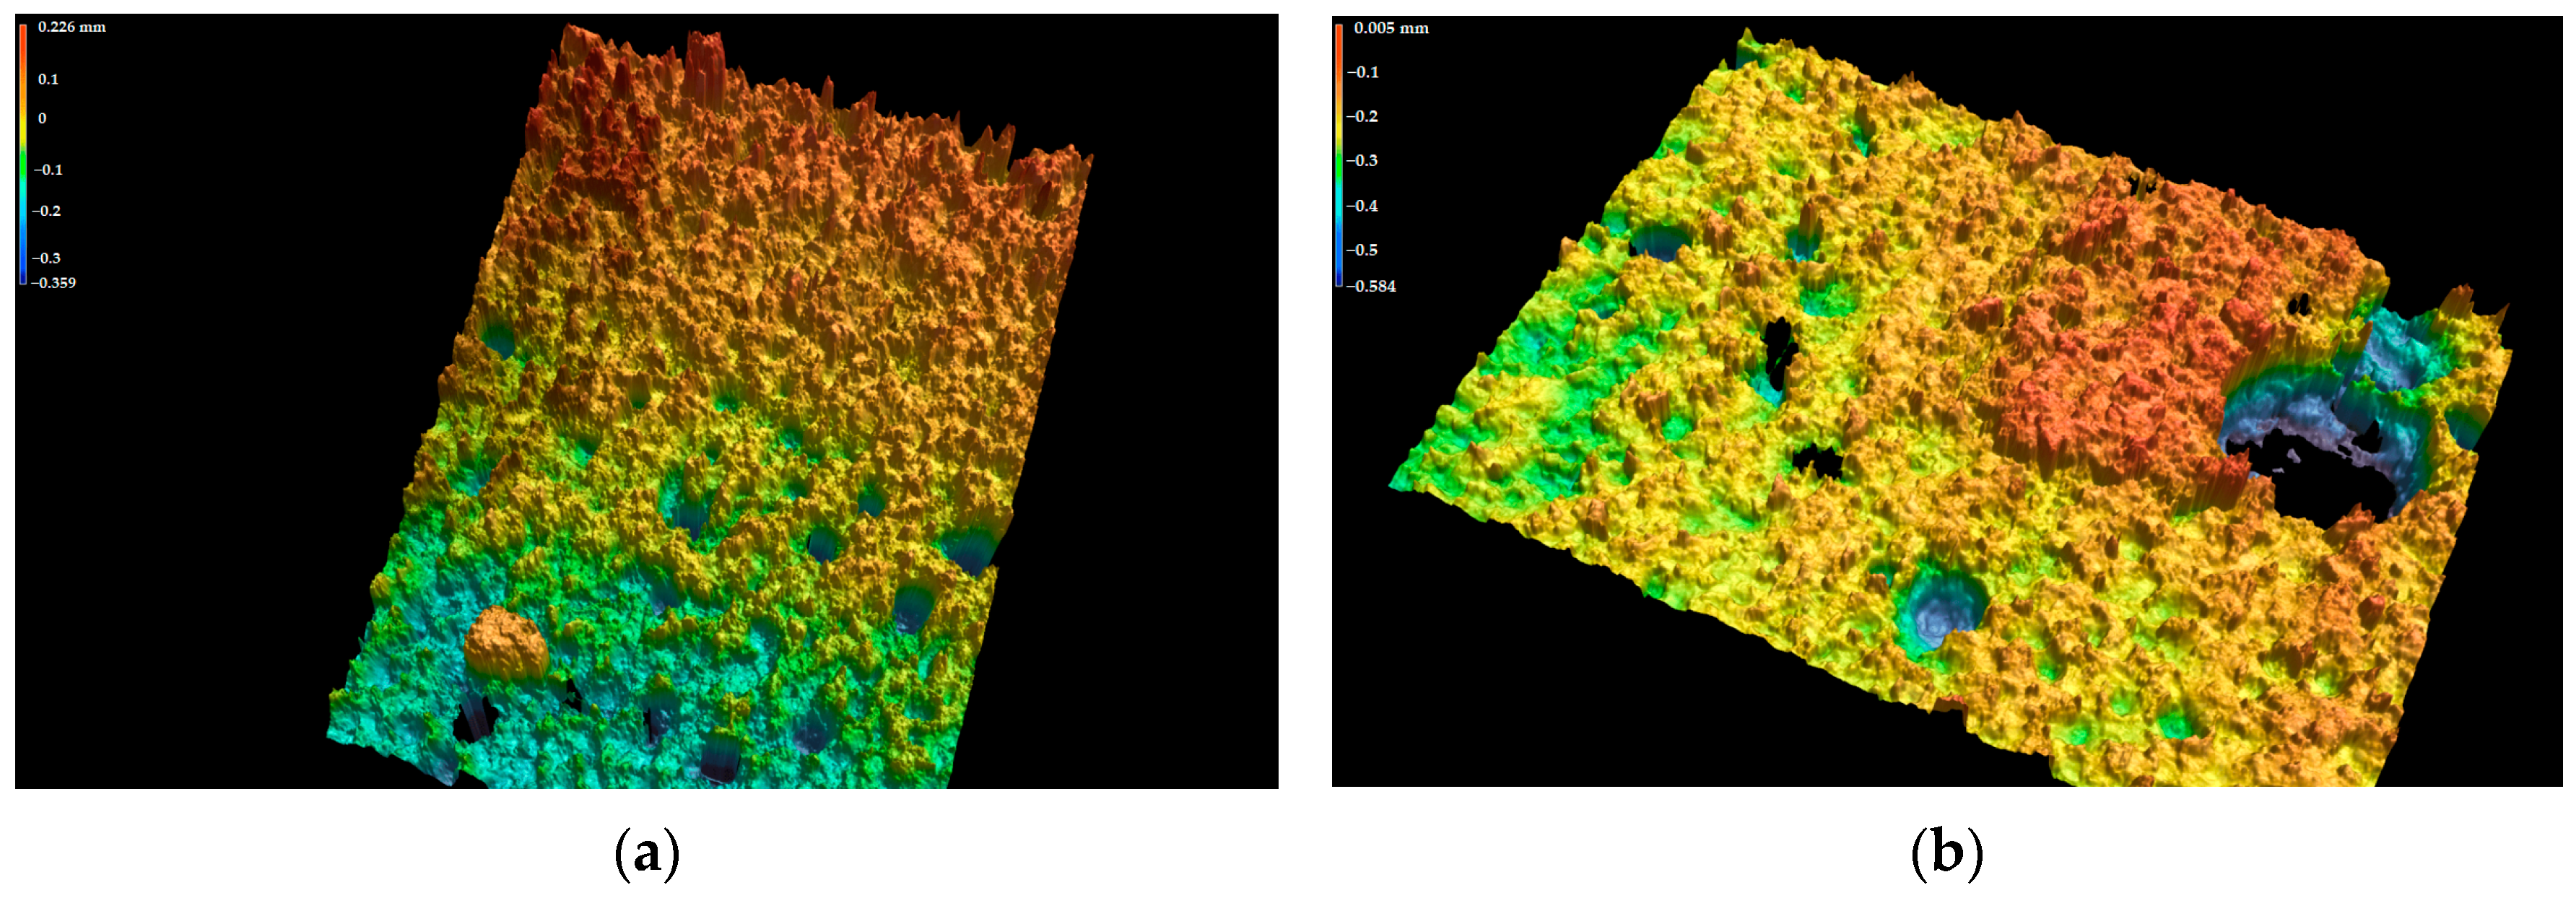
The line roughness measurements of the SPA 60 samples after exposure to a chemically aggressive environment using the KEYENCE VR-6000 Series digital microscope (Keyence Ltd., Osaka, Japan) can be seen in Figure 13 and Figure 14.
In summary, the coatings containing different amounts of waste fibreglass exhibited resistance to the aggressive chemical media. Although there were noticeable colour changes in some cases, no cracks, blistering, or significant defects were observed under the microscope. The microstructures of the coatings remained intact, confirming their good chemical resistance overall.

3.2.6. Resistance to a Humid Atmosphere Containing SO2

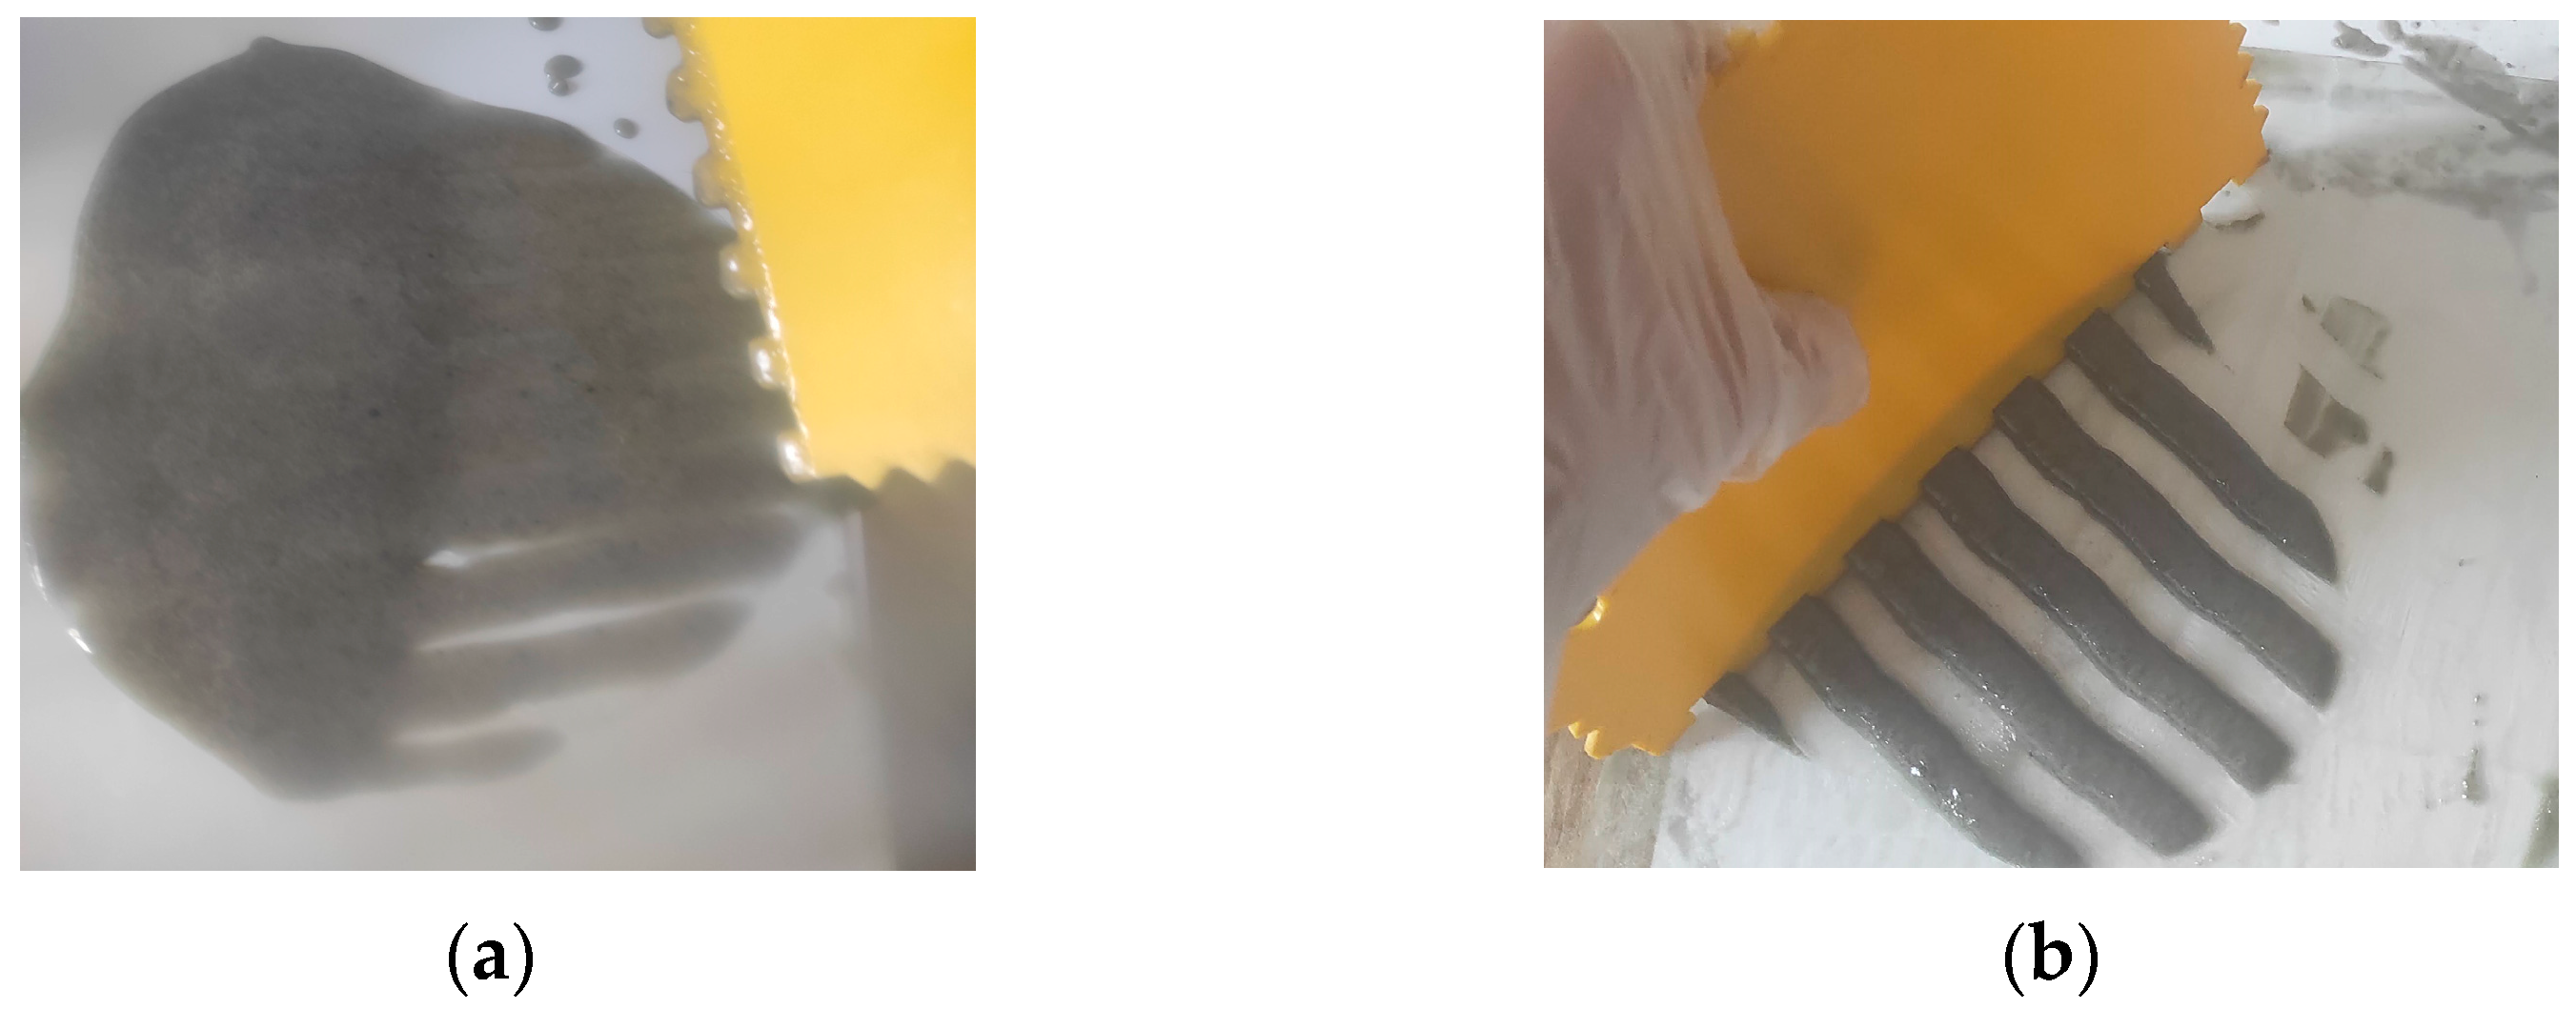
Different behaviour was recorded between the different formulations. As the secondary filler content increased, the consumption increased, and the sample was easier to apply uniformly due to its viscosity.
The main difference was in the corrosion resistance of the coatings in the SO2 atmosphere, where the higher mass filling of SPA 60 resulted in an increase in corrosion resistance to the aggressive environment. After 40 cycles of exposure, the samples showed no visual decrease in adhesion to the substrate and showed little or no blistering. Only a significant colour change in the coating occurred.
Table 12 provides important data regarding the coating consumption, flexural strength, and visual assessment of the samples after loading in an SO2 humid atmosphere. The coating consumption varied from 839 g/m2 (SPA Ref.) to 2099 g/m
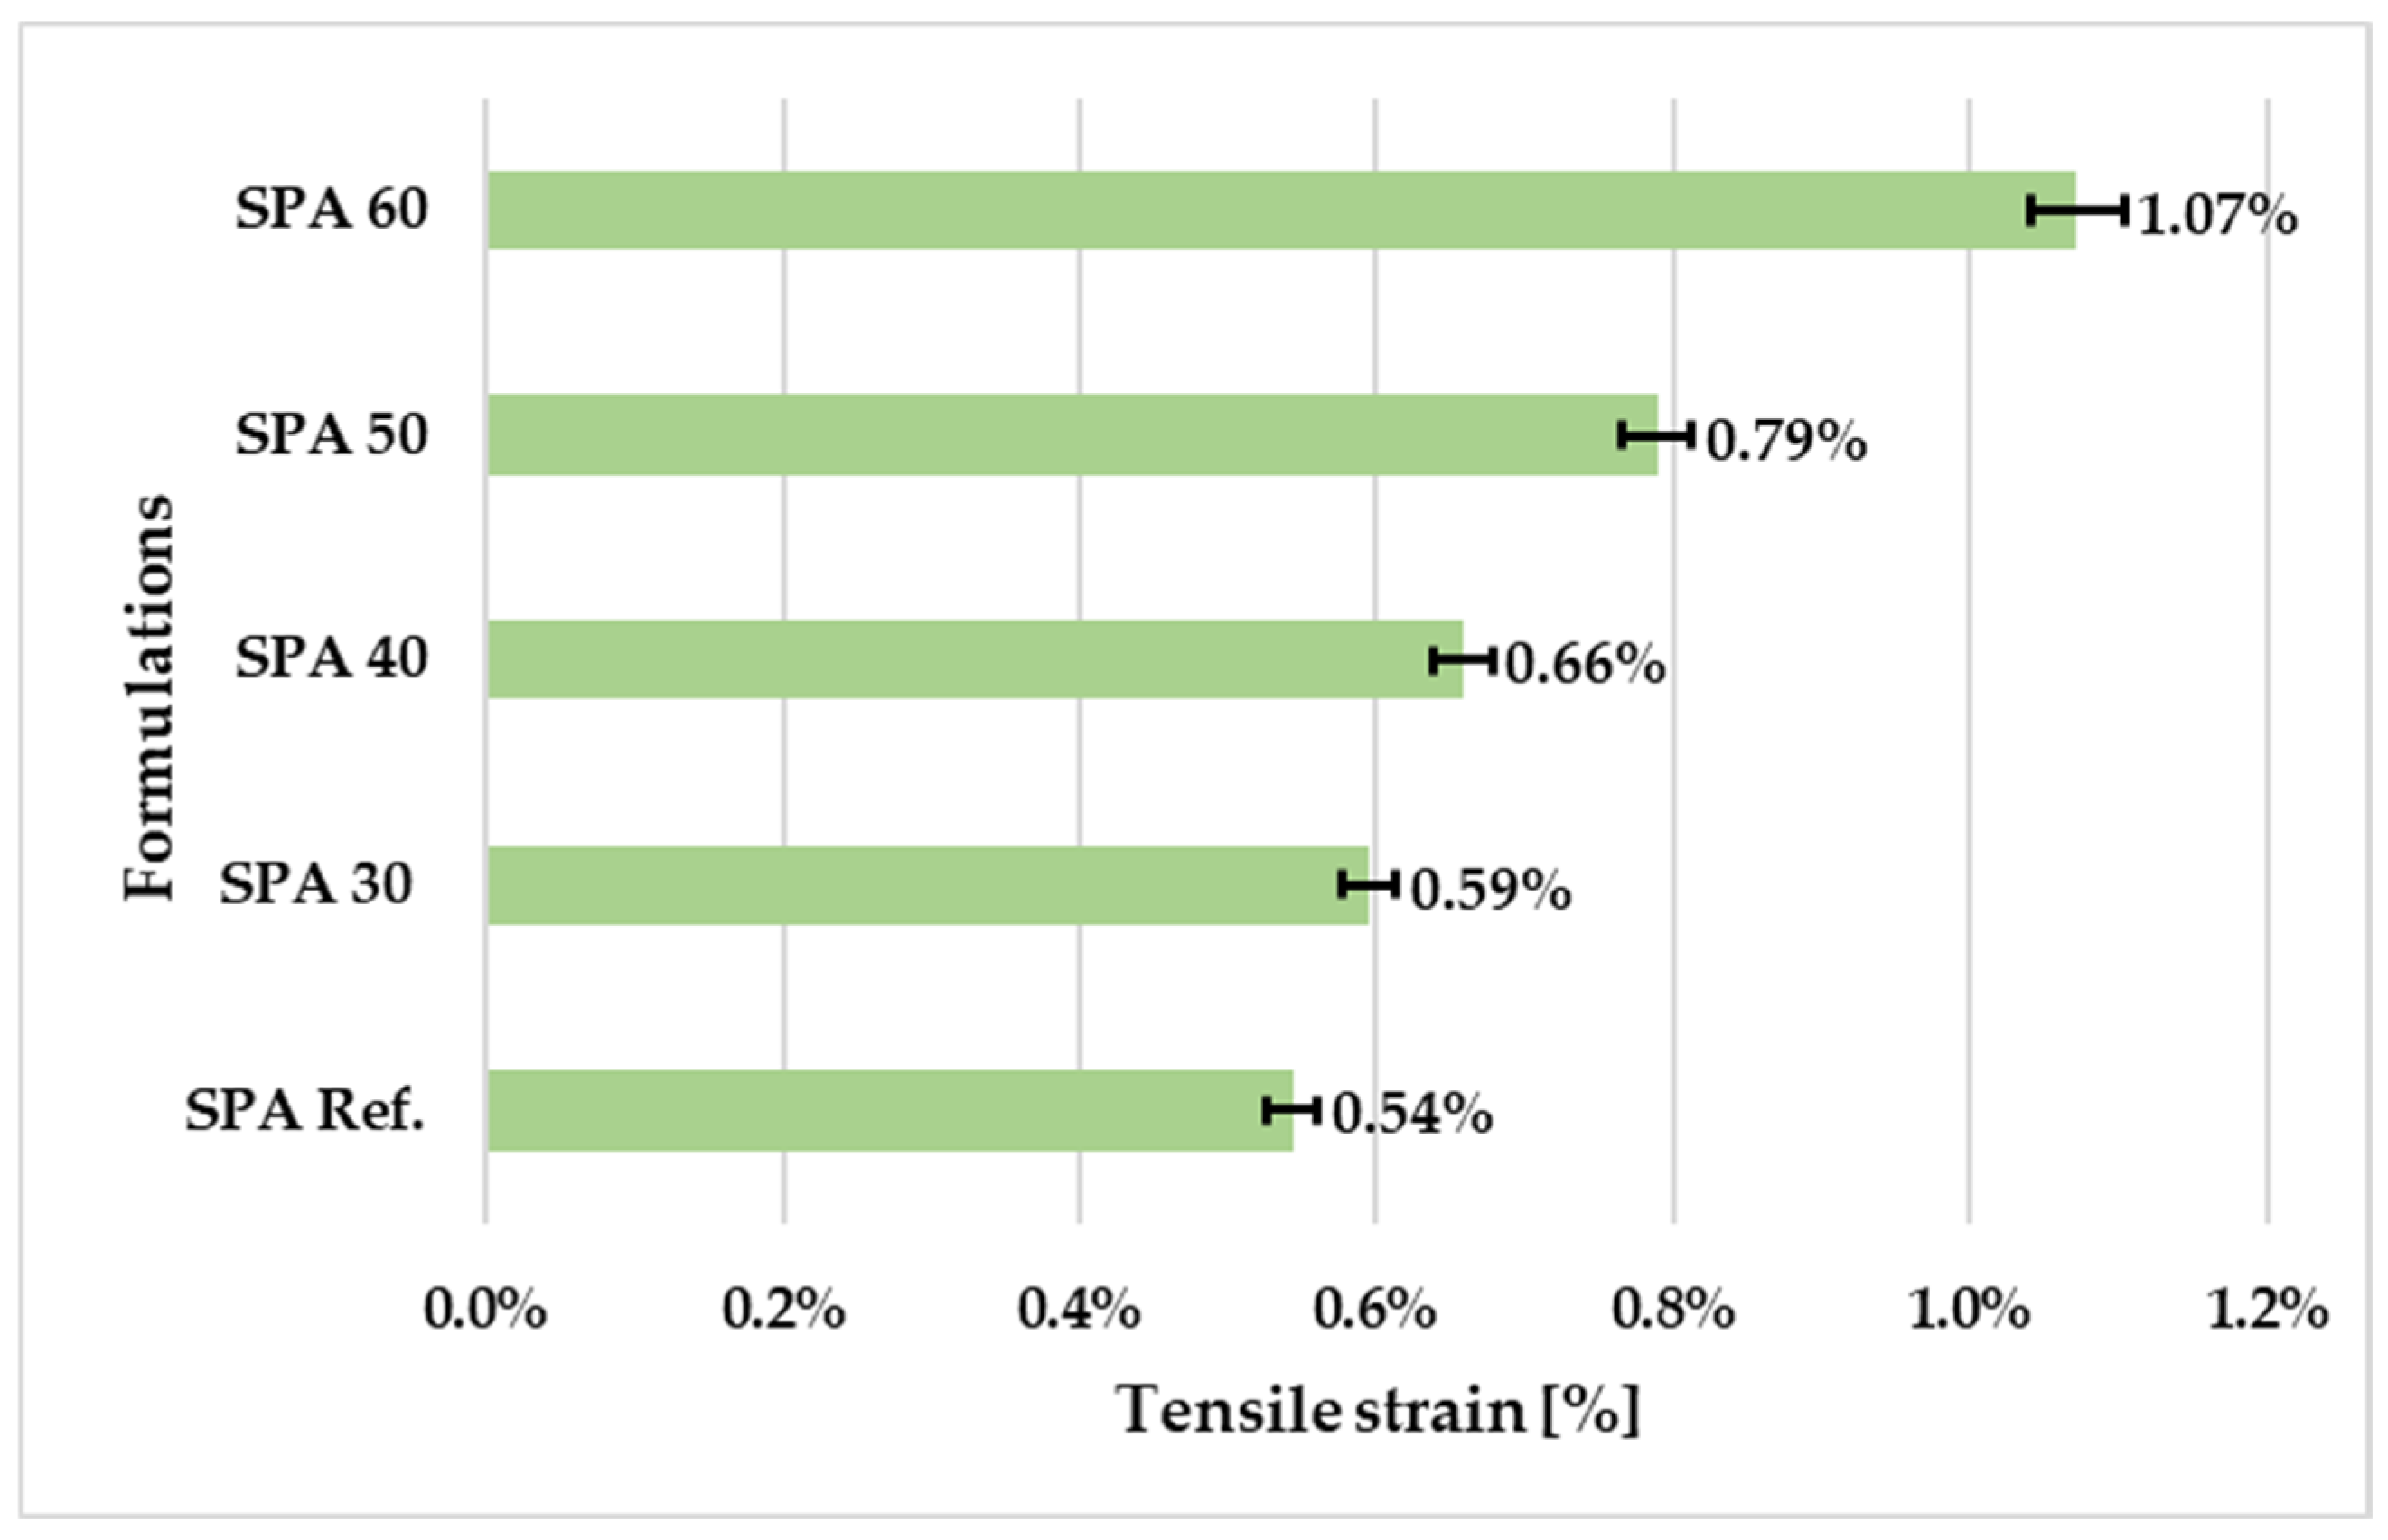
2 (SPA 60). This indicates variations in the amount of coating required for each concrete specimen. The flexural strength showed an increasing trend—from 10.96 MPa for the SPA Ref. specimen to 17.06 MPa for the SPA 60 specimen. The results prove the ability of the coatings to protect the concrete, and their strength does not decrease in a corrosive SO2 environment. The change in flexural strength, expressed as a percentage, demonstrates the increase in flexural strength in comparison with the reference sample. The specimens exhibited a consistent increase in strength, ranging from 144% for the SPA 30 sample to a 181% increase for the concrete sample treated with the SPA 60 coating. This indicates the effectiveness of the coatings in enhancing the flexural strength of concrete elements.
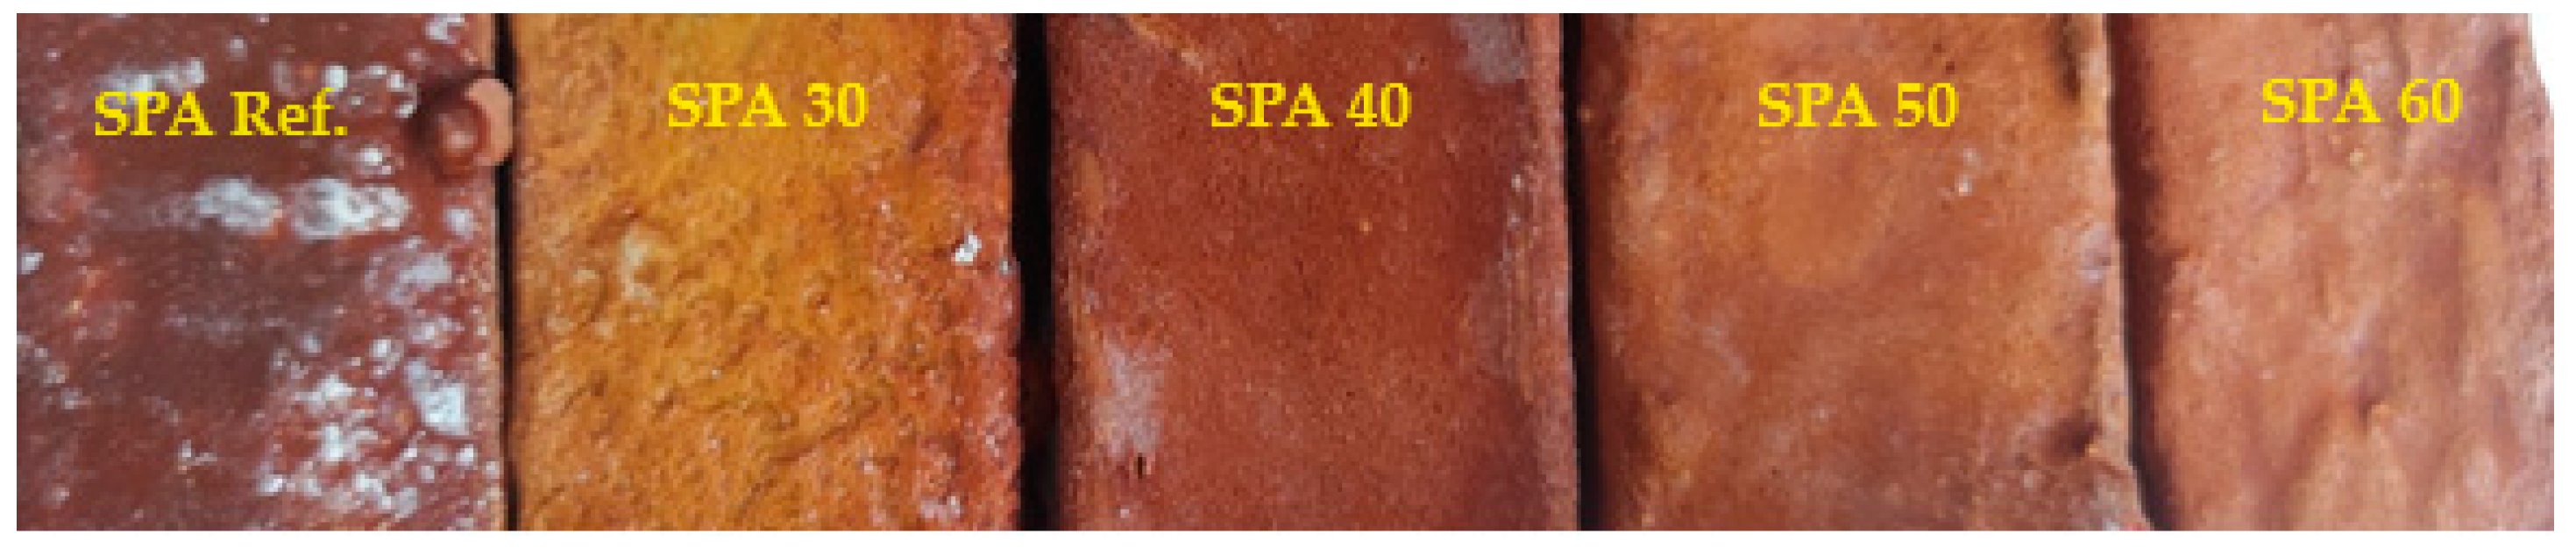
The visual assessment described the overall appearance of each specimen. The results (the degree of corrosion of 9 (>0.01% and ≤0.03%) and 10 (≤0.01%)) showed no significant visual defects and only minor variations in the appearance of the tested specimens. All samples showed significant orange-brown discolouration (see Figure 15).
A polyurethane topcoat is widely used within reinforced concrete structures, e.g., domestic wharfs with aggressive environments in the form of H2S and SO2 [69]. Almusallam et al. [70] stated that polyurethane coatings are, together with epoxy coatings, among the most effective protective materials for concrete to prevent sulfation.
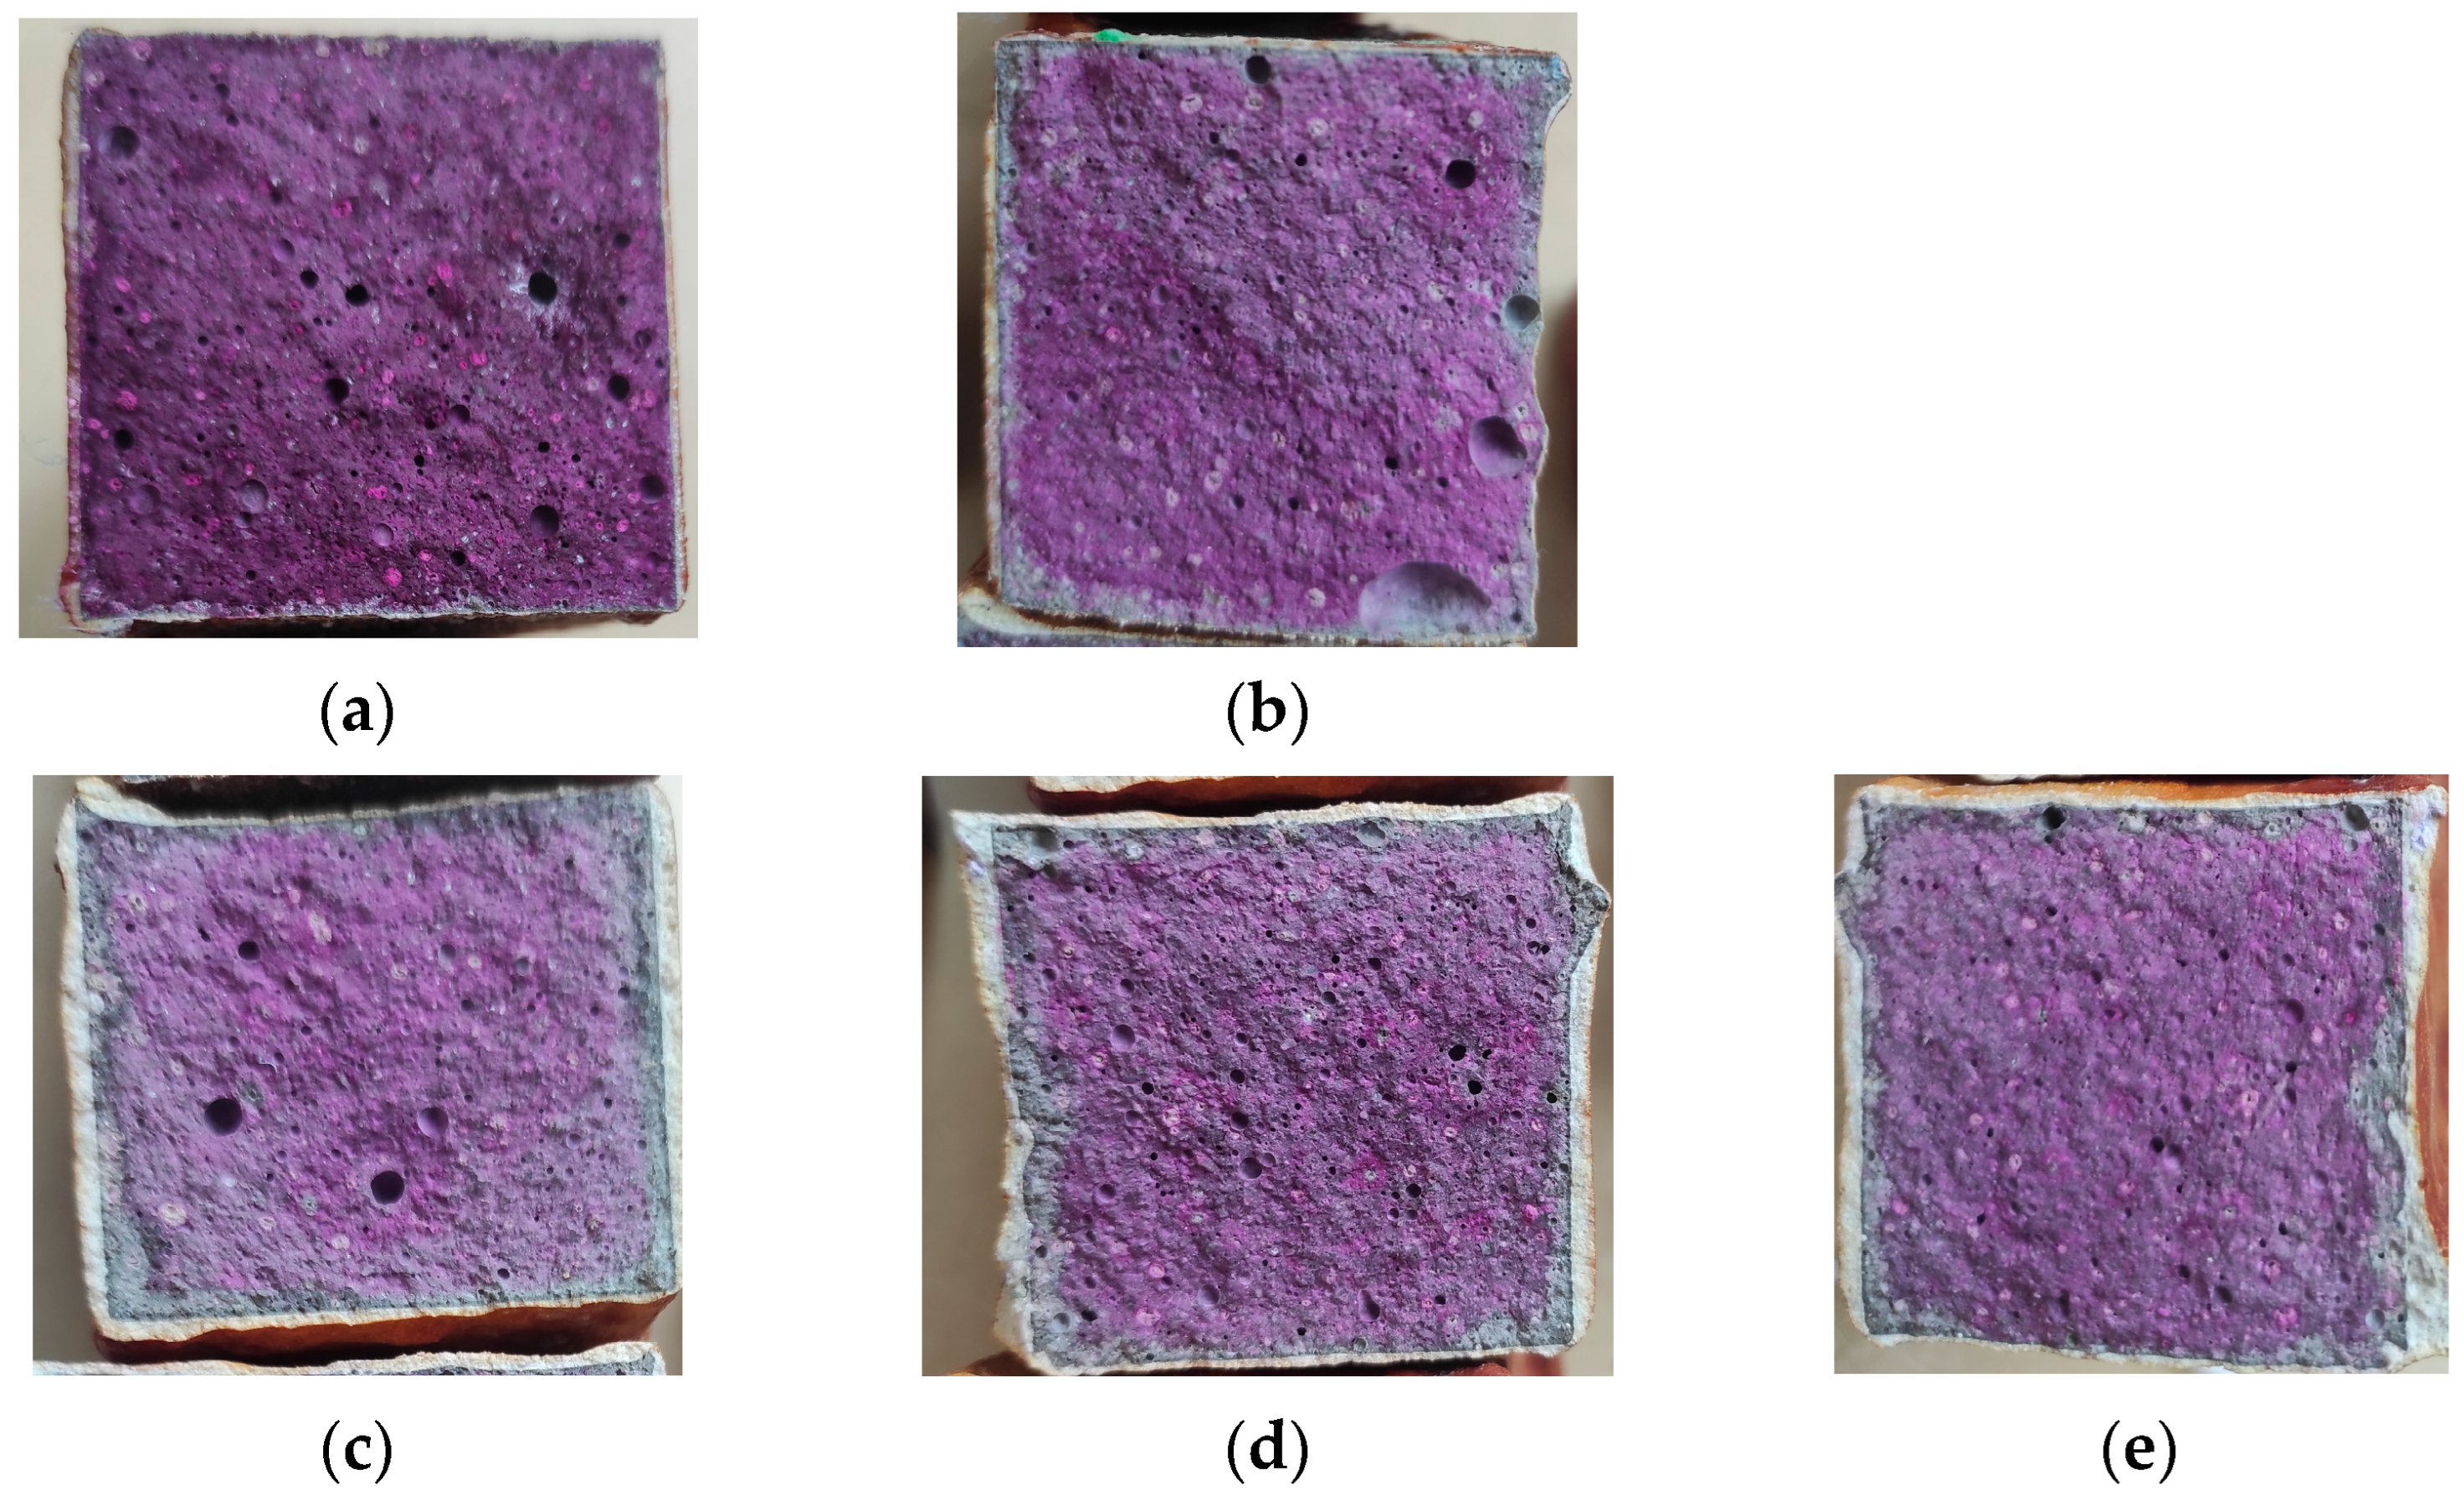
The phenolphthalein test was chosen to test the assumption that concrete may undergo a sulphate attack due to the reaction of SO2 gas with water vapour in sewers. This reaction can lead to the formation of various sulphur compounds, including iron sulphides, on the surface of concrete. The formation of sulphur compounds can significantly affect the pH of the concrete. In the presence of oxygen, these compounds react with water to form sulfuric acid (H2SO4). In the presence of sulfuric acid, the pH of concrete can drop significantly, resulting in an acidic environment [71,72,73]. The phenolphthalein test serves as a valuable tool in monitoring degradation reactions that can decrease the pH of concrete. This degradation can be observed by a significant colour change in the concrete, shown by the phenolphthalein indicator (from a purple hue to a colourless state). Figure 16 contains a series of images of the phenolphthalein-treated surfaces, which show that the corrosive substances did not significantly penetrate the concrete samples protected by the coatings. A pH reduction, determined by the phenolphthalein test, due to the humid SO2 atmosphere was demonstrated for all samples to approximately the same depth in the concrete surfaces. Wu et al. [74] stated that the key property for the protection of concrete against SO2 is mainly to prevent the formation of cracks in the coating. Water can transfer corrosive substances, such as Cl and SO2, into concrete through cracks, leading to the deterioration of the concrete’s durability.

4. Conclusions

In this study, the development of new hydrophobic polymer coatings based on an organic–mineral polyurethane resin was successfully achieved and experimentally verified through four coating formulations containing different amounts of the secondary filler (waste from fibreglass production). It was found that the addition of pre-treated waste fibreglass as the filler mainly affected the processability and mechanical properties of the coatings and concrete using these coatings as the surface treatment. Based on the results, it can be concluded that the fillers with higher secondary content (50% and 60%) had a positive effect, especially on the flexural strength of the concrete and the coating’s adhesion to the concrete, due to the overall strengthening of the polymer matrix. On the other hand, the increased amount of filler increased the viscosity of the coating, which can be more desirable, resulting in the better application of the coating on walls, with no dripping or formation of drips, even in the more aggressive conditions of sewers. The coatings containing waste fibreglass exhibited stronger adhesion to the concrete surface, better coating hardness, and lower water absorption. Compared to other commercial polyurethane coatings, even better mechanical properties have been achieved.
No damage of the polymeric coating structure was observed after exposure to aggressive liquid chemical environments (NaOH, HCl, and H2SO4). The best coating resistance to chemically aggressive environments was evident with the 30% filler, although the formulations with 40%, 50%, and 60% filler also showed excellent chemical resistance. The possibility of the application of the developed coatings in aggressive chemical environments, such as sewers, was also shown by their resistance to the humid, corrosive atmosphere of SO2. Due to their strong mechanical parameters and chemical resistance, the newly developed organic–mineral-based coatings with high content of fibreglass waste can be used in practical applications, e.g., as anti-corrosion coatings for concrete substrates or in the rehabilitation of concrete surfaces stressed by an aggressive environment.

Author Contributions

Conceptualization, K.H.J. and J.H.; methodology, K.H.J. and J.H.; formal analysis, J.H. and R.D.; investigation, K.H.J. and J.H.; resources, K.H.J., J.H. and R.H.; data curation, K.H.J.; writing—original draft preparation, K.H.J. and J.H.; writing—review and editing, J.H. and K.H.J.; project administration, J.H. and R.H. All authors have read and agreed to the published version of the manuscript.

Funding

This research was funded by the Internal Grant Agency of Brno University of Technology, project “ Study of polymer composites with higher content of glass fibre waste”, Grant No. FAST-J-23-8436 and with the financial support of the Czech Science Foundation (GACR), Standard project No. 22-08888S “Increasing the durability of cement composites using water-based hydrophobization”.

Institutional Review Board Statement

Not applicable.

Informed Consent Statement

Not applicable.

Data Availability Statement

Data are contained within the article.

Conflicts of Interest

The authors declare no conflict of interest.

References

  1. Sastri, V.R. 6—Engineering Thermoplastics: Acrylics, Polycarbonates, Polyurethanes, Polyacetals, Polyesters, and Polyamides. In Plastics in Medical Devices, Properties, Requirements, and Applications, 3rd ed.; Ebnesajjad, S., Andrew, W., Eds.; Elsevier: Norwich, NY, USA, 2022; pp. 167–232. [Google Scholar]
  2. West, J.O.F.; Critchlow, G.W.; Lake, D.R.; Banks, R. Development of a superhydrophobic polyurethane-based coating from a two-step plasma-fluoroalkyl silane treatment. Int. J. Adhes. Adhes. 2016, 68, 195–204. [Google Scholar] [CrossRef]
  3. Farshchi, N.; Gedan-Smolka, M. Polyurethane powder coatings: A review of composition and characterization. Ind. Eng. Chem. Res. 2020, 59, 15121–15132. [Google Scholar] [CrossRef]
  4. Afshar, A.; Jahandari, S.; Rasekh, H.; Shariati, M.; Afshar, A.; Shokrgozar, A. Corrosion resistance evaluation of rebars with various primers and coatings in concrete modified with different additives. Constr. Build. Mater. 2020, 262, 120034. [Google Scholar] [CrossRef]
  5. Steele, A.; Bayer, I.; Loth, E. Adhesion strength and superhydrophobicity of polyurethane/organoclay nanocomposite coatings. J. Appl. Polym. Sci. 2012, 125, E445–E452. [Google Scholar] [CrossRef]
  6. Yusoh, K.; Jin, J.; Song, M. Subsurface mechanical properties of polyurethane/organoclay nanocomposite thin films studied by nanoindentation. Prog. Org. Coat. 2009, 220–224. [Google Scholar] [CrossRef]
  7. Akindoyo, J.O.; Beg, M.D.H.; Ghazali, S.; Islam, M.R.; Jeyaratnam, N.; Yuvaraj, A.R. Polyurethane types, synthesis and applications—A review. RSC Adv. 2016, 6, 114453–114482. [Google Scholar]
  8. Echeverria-Altuna, O.; Ollo, O.; Larraza, I.; Elizetxea, C.; Harismendy, I.; Eceiza, A. Development of a Novel Biobased Polyurethane Resin System for Structural Composites. Polymers 2022, 14, 4553. [Google Scholar] [CrossRef]
  9. Yang, Z.; Zhang, X.; Liu, X.; Guan, X.; Zhang, C.; Niu, Y. Flexible and stretchable polyurethane/waterglass grouting material. Constr. Build. Mater. 2017, 138, 240–246. [Google Scholar] [CrossRef]
  10. Tian, H.; Zhang, C.; Wu, L.; Chen, Y. Studies of mechanism of silica polymerization reactions in the combination of silica sol and potassium sodium waterglass via isothermal heat conduction microcalorimetry. J. Therm. Anal. Calorim. 2010, 101, 959–964. [Google Scholar] [CrossRef]
  11. Yang, Z.; Zhang, W.; Guan, X.; Zhang, C. Preparation, characterization, and properties of silicate/polyurethaneurea composites based on dipropylene glycol dibenzoate. Polym. Compos. 2016, 37, 37–43. [Google Scholar]
  12. Bodi, J.; Bodi, Z.; Scucka, J.; Martinec, P. Chapter 14—Polyurethane grouting technologies. In Polyurethane; Zafar, F., Sharmin, E., Eds.; IntechOpen Limited: London, UK, 2012; pp. 307–337. [Google Scholar]
  13. Brzeska, J.; Piotrowska-Kirschling, A. A Brief Introduction to the Polyurethanes According to the Principles of Green Chemistry. Processes 2021, 9, 1929. [Google Scholar] [CrossRef]
  14. Castellà, N.; Grishchuk, S.; Karger-Kocsis, J. Thermoset polyurea resins with in situ produced silicate filler from water glass: Effects of water dispersible alumina nanoparticles. Plast. Rubber Compos. 2007, 36, 122–127. [Google Scholar] [CrossRef]
  15. Chmiel, E.; Lubczak, J. Oligoetherols and polyurethane foams obtained from metasilicic acid. Polym. Bull. 2017, 75, 1579–1596. [Google Scholar] [CrossRef]
  16. Krzywiński, K.; Sadowski, Ł.; Fedoruk, K.; Sieradzki, A. Fundamental understanding of the thermal properties of amorphous epoxy resin coatings filled with quartz-feldspar powder sourced from quarry waste. Appl. Surf. Sci. 2023, 614, 156133. [Google Scholar] [CrossRef]
  17. Dittenber, D.B.; GangaRao, H.V. Critical review of recent publications on use of natural composites in infrastructure. Compos. Part A Appl. Sci. Manuf. 2012, 43, 1419–1429. [Google Scholar] [CrossRef]
  18. Jung, H.; Shin, G.; Kwak, H.; Hao, L.T.; Jegal, J.; Kim, H.J.; Hyeonyeol, J.; Park, J.; Oh, D.P. Review of polymer technologies for improving the recycling and upcycling efficiency of plastic waste. Chemosphere 2023, 320, 138089. [Google Scholar] [CrossRef]
  19. Wang, L.; Kelly, P.V.; Ozveren, N.; Zhang, X.; Korey, M.; Chen, C.; Li, K.; Bhandari, S.; Tekinalp, H.; Zhao, X.; et al. Multifunctional polymer composite coatings and adhesives by incorporating cellulose nanomaterials. Matter 2023, 6, 344–372. [Google Scholar] [CrossRef]
  20. Dwivedi, U.K.; Verma, S.; Choubey, R.K.; Hashmi, S.A.R. Chapter 14—Utilization of waste glass fibre in polymer composites. In Advanceed Materials from Recycled Waste; Verma, S., Khan, R., Mili, M., Hashami, S.A.R., Srivastava, A.K., Eds.; Elsevier—Health Sciences Division: Edinburgh, UK, 2023; pp. 273–294. [Google Scholar]
  21. Yuan, H.; Wang, Y.; Liu, Z.; Li, S. A study on the properties and working mechanism of a waterborne polyurethane-modified silicate-based coating. RSC Adv. 2019, 9, 26817–26824. [Google Scholar] [CrossRef]
  22. García, D.; Vegas, I.; Cacho, I. Mechanical recycling of GFRP waste as short-fibre reinforcements in microconcrete. Constr. Build. Mater. 2014, 64, 293–300. [Google Scholar] [CrossRef]
  23. Gonçalves, R.M.; Martinho, A.; Oliveira, J.P. Recycling of reinforced glass fibres waste: Current status. Materials 2022, 15, 1596. [Google Scholar] [CrossRef]
  24. Yıldız, S.; Karaağaç, B.; Güzeliş, S.G. Utilization of glass fibre reinforced polymer wastes. Polym. Compos. 2021, 42, 412–423. [Google Scholar] [CrossRef]
  25. Acikbas, G.; Yaman, B. Wear response of glass fibre and ceramic tile-reinforced hybrid epoxy matrix composites. Iran. Polym. J. 2019, 28, 21–29. [Google Scholar] [CrossRef]
  26. Rajamahendran, S.; Suresh, G.; Srinivasan, T.; Logesh, D.; Yusuf, M.M.; Krishnan, L.M. An analysis on mechanical and sliding wear behavior of E-Glass fibre reinforced IPN composites. Mater. Today Proc. 2021, 45, 1388–1392. [Google Scholar] [CrossRef]
  27. Corcione, C.E.; Striani, R.; Capone, C.; Molfetta, M.; Vendetta, S.; Frigione, M. Preliminary study of the application of a novel hydrophobic photo-polymerizable nano-structured coating on concrete substrates. Prog. Org. Coat. 2018, 121, 182–189. [Google Scholar] [CrossRef]
  28. Pan, X.; Shi, Z.; Shi, C.; Ling, T.; Li, N. A review on concrete surface treatment Part I: Types and mechanisms. Constr. Build. Mater. 2017, 132, 578–590. [Google Scholar] [CrossRef]
  29. Dai, J.; Akira, Y.; Wittmann, F.H.; Yokota, H.; Zhang, P. Water repellent surface impregnation for extension of service life of reinforced concrete structures in marine environments: The role of cracks. Cem. Concr. Compos. 2010, 32, 101–109. [Google Scholar] [CrossRef]
  30. Guo, L.; Gu, C.; Feng, J.; Guo, Y.; Jin, Y.; Tu, J. Hydrophobic epoxy resin coating with ionic liquid conversion pretreatment on magnesium alloy for promoting corrosion resistance. J. Mater. Sci. Technol. 2020, 37, 9–18. [Google Scholar] [CrossRef]
  31. Maj, M.; Ubysz, A. The reasons for the loss of polyurea coatings adhesion to the concrete substrate in chemically aggressive water tanks. Eng. Fail. Anal. 2022, 142, 106774. [Google Scholar] [CrossRef]
  32. Hodná, J.; Hodul, J.; Drochytka, R.; Seidlová, M. Verification of the influence of particle shape on the chemical resistance of epoxy coating and use of waste glass as the filler. Coatings 2022, 12, 309. [Google Scholar] [CrossRef]
  33. ASTM C138-16; Standard Test Method for Density (Unit Weight), Yield, and Air Content (Gravimetric) of Concrete. American Association State, Highway and Transportation Officials Standard; ASTM Committee C09 on Concrete and Concrete Aggregates and Subcommitte C09.60 on Testing Fresh Concrete: West Conshohocken, PA, USA, 2016.
  34. EN ISO 2808; Paints and Varnishes—Determination of Film Thickness. European Committee for Standardization (CEN): Brussels, Belgium; Technical Committee ISO/TC35/SC9: Geneva, Switzerland, 2019.
  35. EN ISO 2884-2; Paints and Varnishes—Determination of Viscosity Using Rotary Viscometers—Part 2: Disc or Ball Viscometer Operated at a Specified Speed. European Committee for Standardization (CEN): Brussels, Belgium; Technical Committee ISO/TC35/SC9: Geneva, Switzerland, 2003.
  36. EN ISO 2431; Paints and Varnishes–Determination of Flow Time by Use of Flow Cups. European Committee for Standardization (CEN): Brussels, Belgium; Technical Committee ISO/TC35/SC9: Geneva, Switzerland, 2019.
  37. EN ISO 868; Plastics and Ebonite—Determination of Indentation Hardness by Means of a Durometer (Shore Hardness). European Committee for Standardization (CEN): Brussels, Belgium; Technical Committee ISO/TC61/SC2: Geneva, Switzerland, 2003.
  38. EN ISO 4624; Paints and Varnishes—Pull-Off Test for Adhesion. European Committee for Standardization (CEN): Brussels, Belgium; Technical Committee ISO/TC35/SC9: Geneva, Switzerland, 2023.
  39. EN ISO 527-1; Plastics—Determination of Tensile Properties—Part 1: General Principles. European Committee for Standardization (CEN): Brussels, Belgium; Technical Committee ISO/TC61/SC2: Geneva, Switzerland, 2019.
  40. EN ISO 527-2; Plastics—Determination of Tensile Properties—Part 2: Test Conditions for Moulding and Extrusion Plastics. European Committee for Standardization (CEN): Brussels, Belgium; Technical Committee ISO/TC61/SC2: Geneva, Switzerland, 2012.
  41. ASTM D570-9; Standard Test Method for Water Absorption of Plastics. ASTM International, ASTM Committee D-20 on Plastics and Subcommittee D 20.50 on Permanence Properties: West Conshohocken, PA, USA, 2018.
  42. EN ISO 4628-1; Paints and Varnishes—Evaluation of Degradation of Coatings—Designation of Quantity and Size of Defects, and of Intensity of Uniform Changes in Appearance. European Committee for Standardization (CEN): Brussels, Belgium; Technical Committee ISO/TC35/SC9: Geneva, Switzerland, 2021.
  43. EN ISO 3231; Paints and Varnishes—Determination of Resistance to Humid Atmospheres Containing Sulfur Dioxide. European Committee for Standardization (CEN): Brussels, Belgium; Technical Committee ISO/TC156: Geneva, Switzerland, 1993.
  44. ASTM D610-85; Standard Practice for Evaluating Degree of Rusting on Painted Steel Surfaces. ASTM International, Subcommittee D01.25 on Evaluation of Weathering Effects: West Conshohocken, PA, USA, 2012.
  45. EN 14630; Products and Systems for the Protection and Repair of Concrete Structures—Test Methods—Determination of the Depth of Carbonation in Hardened Concrete Using the Phenolphthalein Method. European Committee for Standardization (CEN): Brussels, Belgium; Technical Committee CEN/TC104/SC8/WG7: Geneva, Switzerland, 2006.
  46. Zhang, Y.; Sun, J.; Xiao, X.; Wang, N.; Meng, G.; Gu, L. Graphene-like two-dimensional nanosheets-based anticorrosive coatings: A review. J. Mater. Sci. Technol. 2022, 129, 139–162. [Google Scholar] [CrossRef]
  47. Alshammari, B.A.; Alenad, A.M.; Al-Mubaddel, F.S.; Alharbi, A.G.; Al-shehri, A.S.; Albalwi, H.A.; Alsuabie, F.M.; Fouad, H.; Mourad, A.-H.I. Impact of hybrid fillers on the properties of high density polyethylene based composites. Polymers 2022, 14, 3427. [Google Scholar] [CrossRef]
  48. Putz, K.W.; Palmeri, M.J.; Cohn, R.B.; Andrews, R.; Brinson, L.C. Effect of cross-link density on interphase creation in polymer nanocomposites. Macromolecules 2008, 41, 6752–6756. [Google Scholar] [CrossRef]
  49. Habibpour, S.; Um, J.G.; Jun, Y.-s.; Bhargava, P.; Park, C.B.; Yu, A. Structural impact of graphene nanoribbon on mechanical properties and anti-corrosion performance of polyurethane nanocomposites. Chem. Eng. J. 2021, 405, 126858. [Google Scholar] [CrossRef]
  50. Šupová, M.; Martynková, G.S.; Barabaszová, K. Effect of nanofillers dispersion in polymer matrices: A review. Sci. Adv. Mater. 2011, 3, 1–25. [Google Scholar] [CrossRef]
  51. Chowaniec-Michalak, A.; Czarnecki, S.; Sadowski, Ł.; Królicka, A. Recycling of waste limestone powders for the cleaner production of epoxy coatings: Fundamental understanding of the mechanical and microstructural properties. J. Clean. Prod. 2022, 372, 133828. [Google Scholar] [CrossRef]
  52. Parente, J.M.; Simões, R.; Reis, P.N.B. Effect of graphene nanoparticles on suspension viscosity and mechanical properties of epoxy-based nanocomposites. Procedia Struct. Integr. 2022, 37, 820–825. [Google Scholar] [CrossRef]
  53. Wołosiak-Hnat, A.; Zych, K.; Mężyńska, M.; Karłowicz, M.; Dajworski, M.; Bartkowiak, A.; Lisiecki, S. The influence of type and concentration of inorganic pigments on the polyurethane adhesive properties and adhesion of laminates. Int. J. Adhes. Adhes. 2019, 90, 1–8. [Google Scholar] [CrossRef]
  54. Deng, M.; Cao, X.; He, Z.; Wei, K.; Tang, B. Experimental and molecular dynamics simulation investigation on filler reinforcement for property enhancement of PU composites. Mech. Adv. Mater. Struct. 2023, 30, 2780–2792. [Google Scholar] [CrossRef]
  55. Deka, A.; Dey, N. Rheological studies of two component high build epoxy and polyurethane based high performance coatings. J. Coat. Technol. Res. 2013, 10, 305–315. [Google Scholar] [CrossRef]
  56. Malaki, M.; Hashemzadeh, Y.; Tehrani, A.F. Abrasion resistance of acrylic polyurethane coatings reinforced by nano-silica. Prog. Org. Coat. 2018, 125, 507–515. [Google Scholar] [CrossRef]
  57. Haupert, F.; Wetzel, B. Reinforcement of thermosetting polymers by the incorporation of micro- and nanoparticles. In Polymer Composites: From Nano-to Macro-Scale; Friedrich, K.B., Fakirov, S., Zhang, Z., Eds.; Springer: Boston, MA, USA, 2005; pp. 45–62. [Google Scholar]
  58. Elnaggar, E.M.; Elsokkary, T.M.; Shohide, M.A.; El-Sabbagh, B.A.; Abdel-Gawwad, H.A. Surface protection of concrete by new protective coating. Constr. Build. Mater. 2019, 220, 245–252. [Google Scholar] [CrossRef]
  59. Jiang, H.; Zheng, Z.; Song, W.; Wang, X. Moisture-cured polyurethane/polysiloxane copolymers: Effects of the structure of polyester diol and NCO/OH ratio. J. Appl. Polym. Sci. 2008, 108, 3644–3651. [Google Scholar] [CrossRef]
  60. Das, S.; Pandey, P.; Mohanty, S.; Nayak, S.K. Influence of NCO/OH and transesterified castor oil on the structure and properties of polyurethane: Synthesis and characterization. Mater. Express 2015, 5, 377–389. [Google Scholar] [CrossRef]
  61. Das, A.; Mahanwar, P. A brief discussion on advances in polyurethane applications. Adv. Ind. Eng. Polym. Res. 2020, 3, 93–101. [Google Scholar] [CrossRef]
  62. Sardari, A.; Alvani, A.A.S.; Ghaffarian, S.R. Castor oil-derived water-based polyurethane coatings: Structure manipulation for property enhancement. Prog. Org. Coat. 2019, 133, 198–205. [Google Scholar] [CrossRef]
  63. Man, L.; Feng, Y.; Hu, Y.; Yuan, T.; Yang, Z. A renewable and multifunctional eco-friendly coating from novel tung oil-based cationic waterborne polyurethane dispersions. J. Clean. Prod. 2019, 241, 118341. [Google Scholar] [CrossRef]
  64. Vipulanandan, C.; Liu, J. Performance of polyurethane-coated concrete in sewer environment. Cem. Concr. Res. 2005, 35, 1754–1763. [Google Scholar] [CrossRef]
  65. Wang, X.; Hu, J.; Li, Y.; Zhang, J.; Ding, Y. The surface properties and corrosion resistance of fluorinated polyurethane coatings. J. Fluor. Chem. 2015, 176, 14–19. [Google Scholar] [CrossRef]
  66. Lenzi, V.; Crema, A.; Pyrlin, S.; Marques, L. Current state and perspectives of simulation and modeling of aliphatic isocyanates and polyisocyanates. Polymers 2022, 14, 1642. [Google Scholar] [CrossRef]
  67. Gaikwad, M.S.; Gite, V.V.; Mahulikar, P.P.; Hundiwale, D.G.; Yemul, O.S. Eco-friendly polyurethane coatings from cottonseed and karanja oil. Prog. Org. Coat. 2015, 86, 164–172. [Google Scholar] [CrossRef]
  68. Malaki, M.; Hashemzadeh, Y.; Karevan, M. Effect of nano-silica on the mechanical properties of acrylic polyurethane coatings. Prog. Org. Coat. 2016, 101, 477–485. [Google Scholar] [CrossRef]
  69. Zhao, X.D.; Fan, X.; Tian, M. Application of repair and anti-corrosion technology on reinforced concrete structures of a domestic Wwarf. Adv. Mater. Res. 2011, 189, 165–168. [Google Scholar] [CrossRef]
  70. Almusallam, A.A.; Khan, F.M.; Dulaijan, S.U.; Al-Amoudi, O.S.B. Effectiveness of surface coatings in improving concrete durability. Cem. Concr. Compos. 2003, 25, 473–481. [Google Scholar] [CrossRef]
  71. Lloyd, R.R.; Provis, J.L.; van Deventer, J.J.S. Acid resistance of inorganic polymer binders. 1. Corrosion rate. Mater. Struct. 2012, 45, 1–14. [Google Scholar] [CrossRef]
  72. Parker, C.D. Species of sulphur bacteria associated with the corrosion of concrete. Nature 1947, 159, 439–440. [Google Scholar] [CrossRef] [PubMed]
  73. Gutiérrez-Padilla, M.G.D.; Bielefeldt, A.; Ovtchinnikov, S.; Hernandez, M.; Silverstein, J. Biogenic sulfuric acid attack on different types of commercially produced concrete sewer pipes. Cem. Concr. Res. 2010, 40, 293–301. [Google Scholar] [CrossRef]
  74. Wu, Y.; Dong, L.; Shu, X.; Yang, Y.; She, W.; Ran, Q. A review on recent advances in the fabrication and evaluation of superhydrophobic concrete. Compos. B. Eng. 2022, 237, 109867. [Google Scholar] [CrossRef]
Figure 1. Untreated fibreglass waste (A) versus pre-treated (ground) glass powder around the fibre (B).
Coatings 13 01934 g001
Figure 2. Thickness of the fresh coatings with different filling after application on the substrate.
Coatings 13 01934 g002
Figure 3. Kinematic viscosity of the freshly mixed coatings with different amounts of filling.
Coatings 13 01934 g003
Figure 4. Application of the coatings: (a) SPA Ref.—immediate sintering; (b) SPA 60—squeegee strokes did not slip, and aesthetic defects are visible on the surface.
Coatings 13 01934 g004
Figure 5. Shore D hardness of the coatings with different filling.
Coatings 13 01934 g005
Figure 6. Sample after the pull-off test of the coating from the concrete substrate (failure in the substrate).
Coatings 13 01934 g006
Figure 7. Tensile stress of the coatings with different amounts of filler.
Coatings 13 01934 g007
Figure 8. Tensile strain of the coatings with different amounts of the filler.
Coatings 13 01934 g008
Figure 9. Digital microscope images of the SPA 30 coating at magnification of 32×: (a) reference coating not exposed to an aggressive environment; (b) after exposure to 10% HCl for 90 days; (c) after exposure to 40% HCl for 90 days.
Coatings 13 01934 g009
Figure 10. Digital microscope images of the SPA 30 coating at magnification of 32×: (a) reference sample not exposed to an aggressive environment; (b) after exposure to the 10% H2SO4 for 90 days; (c) after exposure to 40% H2SO4 for 90 days.
Coatings 13 01934 g010
Figure 11. Surface appearance of the SPA 30 coating at a 32× magnification: (a) reference sample not exposed to an aggressive environment; (b) after exposure to 10% NaOH for 90 days; (c) after exposure to 40% NaOH for 90 days.
Coatings 13 01934 g011
Figure 12. Cross-section views of the SPA 40 samples after exposure to 10% NaOH, 10% H2SO4, 10% HCl, 40% NaOH, 40% H2SO4, and 40% HCl.
Coatings 13 01934 g012
Figure 13. The surface of the 3D model of the line roughness of the SPA 60 coating at 80× magnification after exposure to 40% NaOH for 90 days (red line in the main image represents the location of the coating’s surface where 3D image was modelled).
Coatings 13 01934 g013
Figure 14. The surface of the SPA 60 coating in the 3D model of the line roughness at 80× magnification after exposure to 40% NaOH for 90 days (a,b).
Coatings 13 01934 g014
Figure 15. Surfaces of the coatings after 40 cycles of exposure to a humid atmosphere containing SO2.
Coatings 13 01934 g015
Figure 16. Results of the phenolphthalein test after exposure to an SO2 atmosphere: (a) reference coating; (b) SPA 30; (c) SPA 40; (d) SPA 50; (e) SPA 60.
Coatings 13 01934 g016
Table 1. Parameters of the organic–mineral binder (hybrid polyurethane base).
ParameterCompressive Strength (MPa)Flexural Strength (MPa)Adhesion to Concrete (MPa)Modulus of Elasticity (MPa)Bulk Density (kg/m3)
After 1 day20–309.53410001400
Table 2. Chemical composition of the fibreglass waste.
FFe2O3SrOK2OTiO2SO3CaOAl2O3B2O3MgONa2OSiO2
0.560.3650.2450.230.110.03923.1014.167.180.970.7752.25
Table 3. Measurements of the material’s properties.
ParameterValue
Volume weight2.62 g·cm−3
Specific gravity2.62 g·cm−3
Absorbency0%
Specific surface area330 m2·kg−1
Table 4. Formulations of the new coatings with filler from waste fibreglass.
Type of CoatingResin (wt.%)Hardener (wt.%)Filler (wt.% of Binder)
SPA Ref.50500
SPA 30505030
SPA 40505040
SPA 50505050
SPA 60505060
Table 5. Application test rating scale for the coating evaluation.
RatingDescription
0Squeegee strokes did not slip.
1Slightly visible squeegee strokes and slight aesthetic defects on the surface on approximately 75% of the sample.
2Slightly visible squeegee marks on 25% to 50% of the sample and slight aesthetic defects on the surface.
3At an angle of 45°, locally visible squeegee marks and very slight or no aesthetic defects on the surface.
4No squeegee strokes visible and very slight or no aesthetic defects on the surface.
5No squeegee strokes visible, no surface defects.
Table 6. Densities of the freshly mixed coatings.
SampleDensity (kg/m3)
SPA Ref.1350
SPA 30 1485
SPA 401500
SPA 501635
SPA 601750
Table 7. Dynamic viscosity measurements of the freshly mixed coatings.
FormulationFiller (wt.% of Binder)Dynamic Viscosity (mPa·s)
SPA Ref.0462
SPA 30 301068
SPA 40401489
SPA 50502473
SPA 60604847
Table 8. Evaluation of the application of the freshly mixed coatings.
FormulationFiller (wt.% of Binder)Applicability (Spill, Aesthetics)
SPA Ref.05
SPA 30 303
SPA 40402
SPA 50501
SPA 60601
Table 9. Adhesion to concrete substrate for coatings with different amounts of filling.
FormulationAdhesion (MPa)Failure Mode
SPA Ref.3.55Substrate failure
SPA 30 4.05Substrate failure
SPA 404.85Substrate failure
SPA 505.22Substrate failure
SPA 6011.89Substrate failure
Table 10. Results of the water absorption of the coating with different filling.
FormulationSpecimen W1 (g)W2 (g)Swelling RatioSwelling Ratio
SPA Ref.11.381.5311%9%
22.012.157%
31.521.648%
SPA 3011.791.927%8%
21.872.017%
31.862.029%
SPA 4011.281.399%8%
21.371.499%
31.381.498%
SPA 5011.381.477%7%
21.021.108%
31.881.996%
SPA 6011.511.595%5%
21.551.656%
31.431.483%
Table 11. Chemical resistance of the tested coatings.
FormulationAggressive Chemical MediumWeight Change (%)Flexural Strength (MPa)Change of Flexural Strength
(%)
Visual Assessment
SPA Ref.10% HCl−0.057.2100.0No changes
40% HCl0.219.8100.0Light yellow
10% NaOH−0.6813.8100.0Yellowed
40% NaOH−1.486.0100.0Green/dark yellow
10% H2SO40.3212.9100.0No change
40% H2SO4−1.212.75100.0No change
SPA 3010% HCl−0.0113.8191.7No changes
40% HCl0.1813.9142.6Light yellow
10% NaOH−0.6212.489.9Yellowed
40% NaOH−1.4212.8213.3Green/dark yellow
10% H2SO40.2619.8153.5No change
40% H2SO4−1.2214.6114.5No change
SPA 4010% HCl0.0116.5229.2No changes
40% HCl0.1813.8141.5Light yellow
10% NaOH−0.6312.791.8Yellowed
40% NaOH−1.3813.9231.3Green/dark yellow
10% H2SO40.2713.1101.7No change
40% H2SO4−1.2016.1126.5No change
SPA 5010% HCl−0.0113.5187.5No changes
40% HCl0.1913.5138.5Light yellow
10% NaOH−0.6515.0108.7Yellowed
40% NaOH−1.4015.4256.3Green/dark yellow
10% H2SO4−0.0514.3197.9No change
40% H2SO4−1.2613.1134.6No change
SPA 6010% HCl−0.0114.6106.0No changes
40% HCl0.1713.1218.8Light yellow
10% NaOH−0.6813.5104.7Yellowed
40% NaOH−1.3915.4120.6Green/dark yellow
10% H2SO4−0.0414.3197.9No change
40% H2SO4−1.2713.1134.6No change
Table 12. Evaluation of the coatings’ protection in a humid atmosphere containing aggressive gas medium, SO2.
SpecimenCoating
Consumption (g/m2)
Flexural Strength after SO2 Exposure (MPa)Change of
Flexural Strength (%)
Visual
Assessment
ASTM D 610-85
SPA Ref.83910.961009
SPA 30 157813.6214410
SPA 40185714.2715110
SPA 50188414.6015510
SPA 60209917.0618110
Disclaimer/Publisher’s Note: The statements, opinions and data contained in all publications are solely those of the individual author(s) and contributor(s) and not of MDPI and/or the editor(s). MDPI and/or the editor(s) disclaim responsibility for any injury to people or property resulting from any ideas, methods, instructions or products referred to in the content.

