
Novel Method for Assessing the Protection Lifetime of Building Coatings against Fungi


1
Department of Environmental Biotechnology, Faculty of Biotechnology and Food Sciences, Lodz University of Technology, Wolczanska 171/173, 90-530 Lodz, Poland
2
Interdisciplinary Doctoral School, Lodz University of Technology, Zeromskiego 116, 90-924 Lodz, Poland
3
Bolix, S.A. (Inc.), Stolarska 8, 34-300 Zywiec, Poland
*
Author to whom correspondence should be addressed.
Coatings 2023, 13(12), 2026; https://0-doi-org.brum.beds.ac.uk/10.3390/coatings13122026
Submission received: 8 November 2023
/
Revised: 28 November 2023
/
Accepted: 28 November 2023
/
Published: 30 November 2023
(This article belongs to the Special Issue Biological Colonization of Cultural Heritage. Emerging Trends in the Protection of Cultural Properties—Novel Control Strategies and Preventive Approaches)
Abstract
:The aim of this study was to develop a novel method for evaluating the service life of building coatings. In Stage 1, we assessed existing methods for determining the degree of fungal overgrowth on building materials (visual assessment, culture method, luminometric ATP (adenosine-5’-triphosphate) measurement, and spectrophotometric assessment of colour changes). Laboratory tests were carried out for 19 types of facade coating (mineral and silicone with/without primer, silicone paint, biocides) and 7 fungal strains (moulds Alternaria alternata, Aspergillus niger, Aureobasidium melanogenum, Cladosporium cladosporioides, Fusarium sp., Penicillium citrinum, and the yeast Rhodotorula mucilaginosa). The number of fungi on the facade coatings after 28 days of incubation was 1.7 × 10⁵–4.6 × 10⁵ CFUs (colony-forming units)/sample. The ATP content was 12 RLUs–30333 RLUs (relative light units). Colour change was ΔE > 5 depending on the coating type and fungal strain. A high or very high correlation was found between the ATP concentration (RLUs), colour change (ΔE), and the results of the culture method (CFUs/sample). In Stage 2, a new methodology for evaluating the protection lifetime of building coatings against fungi was developed, taking into account environmental conditions (impact of ultraviolet radiation, precipitation, presence of organic matter on the surface, quantitative and qualitative composition of bioaerosol). The developed method consists of one research cycle conducted in the laboratory, corresponding to one year under natural conditions. Preliminary verification showed the model to be compatible with long-term observations (3 years) of fungal growth on the facade coatings under real environmental conditions. The novel method could be used to design biodeterioration control and protection strategies for both new and cultural heritage buildings.
1. Introduction
Biodeterioration affects both historical structures and newly produced building materials, such as wallpapers, facade boards, emulsion paints, wood, insulation, and finishes [1,2]. Biodeterioration of building material causes weakening of its functional properties: tensile strength, cracking, and pitting, as well as loss of colour or discoloration (as an effect of dyes produced by moulds, e.g., carotenoids, melanins) [3,4]. Fungi are the most common cause of biodegradation [4]. This is due to the ubiquity of fungi in the external and internal environment (soil, plant materials, atmospheric air) and morphological and physiological adaptations (oligotrophy, spore production, survival in low water activity, low sensitivity to UV radiation) that enable fungi to colonize building materials [1,4]. The problem of biodeterioration is increasingly important, given the growing popularity of sustainable construction practices aiming to reduce the impact of the construction sector on the environment and mitigate CO2 emissions by using materials of natural origin such as hemp, flax, sunflower, or wood [5].
The physical, chemical, and technical conditions conducive to the development of fungi are well described in the literature [6]. The most common fungi isolated from the building environment are the moulds Acremonium, Alternaria, Aspergillus (A. versicolor, A. niger, A. flavus), Aureobasidium, Cladosporium (C. cladosporioides, C. herbarum), Mucor, Penicillium (P. chrysogenum, P. expansum, P. aurantiogriseum, P. viridicatum), Rhizopus, Stachybotrys, Trichoderma, Ulocladium, and the yeast Rhodotorula [7]. In addition to biodeterioration, fungi growing on indoor building materials may cause inflammation, respiratory problems, asthma exacerbation, allergies, and ringworm, as well as the Sick Building Syndrome (SBS) and Building-Related Illness (BRI) [6,8] among residents/users of buildings. Mould secondary metabolites (e.g., satratoxin, sterigmatocystin, 4-methoxysterigmatocystin) can also have toxic effects (including genotoxic and cytotoxic) [9,10].
Many quantitative methods have been developed for determining the spread of fungi on building materials. These include traditional methods such as the culture method and indirect chemical methods such as detecting the components of fungi cells (chitin and ergosterol), adenosine triphosphate (ATP) as an energy-producing molecule, or cell-wall polysaccharides (β-D—glucane) [7,11]. These methods are particularly useful in instances of historical buildings and mould-infested rooms where the number of fungi is high. The presence of particular chemical compounds will also indicate the health risks to residents. However, these methods are not as effective when it comes to new or historical materials which have been disinfected and protected with biocides such as quaternary ammonium salts, photoactive compounds such as TiO2 and ZnO2, metal salts (Ag, Cu, and Zn), or metal nanoparticles (AgNPs, AuNPs, and ZnONPs) [12,13,14,15,16].
Simulating the long-term resistance of materials to biofouling is a complex process. The durability of the substrate depends on a number of factors, including the type of material, environmental conditions, the microclimate, and the activity of microorganisms [2,16]. The effectiveness of biocides on building coatings decreases over time, depending on the diversity and number of microorganisms and their tolerance and resistance to biocides [17]. The presence of dust particles in the air can enrich the mineral substrate with nutritious organic substances, increasing bioreceptivity [18,19]. Specific climatic conditions will determine not only the kinetics of microbial growth but also the effectiveness of protective coatings. For example, facade illumination is critical for coatings modified with photoactive compounds (e.g., TiO2) [20]. On the other hand, excessive UV radiation accelerates coating weathering. Weathering can also be caused by periodical washing of surface layers and biocides during rainfall [20,21]. There are standards (e.g., European PN-EN 15457:2022-08; American ASTM D3273-21; British BSI—BS 3900-G6) [22,23,24] for testing the resistance of building materials to fungal growth. However, their use by manufacturers is not obligatory. Moreover, these standards completely ignore the effects of environmental conditions on the biocidal and biostatic properties of building coatings under real conditions, i.e., periodic UV irradiation, leaching of biocides, the presence of additional organic matter in the form of dust, and other climatic factors [16]. There have been no long-term studies on the durability of building coatings against fungal growth.
The purpose of this study was to develop a method for evaluating the protection lifetime of building coatings against fungal development, taking into account environmental conditions (impact of UV radiation, precipitation, presence of organic matter on the surface, quantitative and qualitative composition of bioaerosol). The research was carried out in two stages: (1) model tests evaluating methods for determining the degree of fungal overgrowth on building materials (visual assessment, culture method, luminometric ATP measurement, and spectrophotometric assessment of colour changes); (2) development of a methodology for evaluating the protection lifetime of building coatings against the growth of fungi, with verification under environmental conditions.
2. Materials and Methods
2.1. Building Materials
Facade coatings were used as sample building materials. Circles 50 mm in diameter (surface 19.6 cm2) were cut out from the materials. The samples used in Stage 1 of the research did not contain biocide and were artificially aged for 3 cycles, in accordance with EAD 040083-00-0404 [25]. The facade coatings used in Stage 2 of the research contained different biocides. All samples were produced by the R&D laboratory of Bolix S.A. (Żywiec, Poland) for the purposes of this research. The biocides contained active substances which are trade secrets of the company, belonging to 2-octyl-2H-isothiazolin-3-one (OIT), iodopropynyl butyl carbamate (IPBC), zinc pyrithion (ZnP), zinc oxide (ZnO), titanium dioxide (TiO2), 4,5-dichloro-2-octyl-4-isothiazolin-3-one (DCOIT), and terbuthylazine (TBZ). The characteristics of the tested materials are presented in Table 1.
The water absorption of the tested facade coatings after 24 h was from <0.3 to <0.52 kg/m2, according to EAD 040083-00-0404 [25]. Water vapour permeability was from ≤ 0.2 to ≤0.3 m, according to EAD 040083-00-0404 [25]. Impact resistance was category I (no deterioration under the influence of impact energy 3 J and 10 J) or II (rendering not penetrated under the influence of impact energy 10 J and no deterioration under 3 J) according to EAD 040083-00-0404 [25] 3. Fire classification was A1 or B—s1, d0, or A2—s1, d0, according to 13501-1:2019-02 [26].
Prior to testing, the samples were soaked for 24 h in 3 litres of distilled water (simulation of leaching by precipitation in real conditions). Then, the samples were placed individually in open sterile Petri dishes in a laminar chamber, followed by sterilization by irradiation with the built-in UVC lamp (wavelength 200–280 nm: 12 W; dominant wavelength: 254 nm) for 3 h on each side (simultaneous simulation of sunlight in real conditions).
2.2. Tested Fungal Strain
Seven species of fungi belonging to two taxonomic groups (yeasts and moulds) and characterized by different growth physiologies were used in this study. According to the literature, the selected strains are the most common moulds and yeasts inhabiting building materials and causing biodeterioration [7,17,27,28]. Four of the test strains were sourced from a collection of pure cultures, and the other three were isolated from facade surfaces in Poland (Table 2). Identification of environmental strains was performed based on the ITS1/2 sequence of the rDNA region. Genomic DNA from each strain was extracted using a method described elsewhere [29]. The obtained nucleotide sequences were analysed and compared with sequences deposited in the National Centre for Biotechnology Information (NCBI) database, using the BLASTN 2.13.0+ program.
The fungi were cultivated on MEA (Malt Extract Agar, BTL, Lodz, Poland) at 25 ± 2 °C, relative humidity RH = 50%, for 2 days (yeasts) or 7 days (moulds).
2.3. Stage 1—Evaluation of Methods of Determining the Degree of Fungal Overgrowth on Building Materials
2.3.1. Inoculation and Incubation of Samples
To prepare the inoculum, conidia of each of the tested mould strains and biomass of the yeast were collected and suspended in 9 mL of sterile saline solution (0.85% NaCl) in test tubes. The density of yeast cells and mould spores was set using a Thom counting chamber and corrected to 108 in 1 mL. The exact density of the inoculum was confirmed by the culture method. For this purpose, dilutions from 10−2 to 10−7 were made in sterile 0.85% NaCl, plated on Petri dishes, and flooded with semi-liquid MEA. The samples were incubated at 25 ± 2 °C, RH = 50%, for 2–7 days. After incubation, the grown colonies were counted, and the results were recalculated taking into account the dilution used (Table 2).
After soaking in distilled water and sterilization under UV light, one sample from each tested facade coating (sample nos. 1–4) (Table 1) was placed in a sterile Petri dish. Then, 1 mL of semi-liquid MEA was applied to each sample and spread with a sterile pad. Next, 1 mL of the inoculum was evenly distributed using an automatic pipette. The samples of each type of facade were analysed at t = 0 and after 14 and 28 days of incubation at 25 ± 2 °C, RH = 50%.
Fungi growth was evaluated by visual assessment, the culture method, luminometric ATP measurement, and spectrophotometry. Analyses were performed in 5 replicates.
2.3.2. Visual Assessment
2.3.3. Culture Method
Biological material was collected from the surfaces of the facade coating samples using a sterile swab and placed into a test tube containing 9.9 mL of sterile saline. Dilutions from 100 to 10−7 were prepared and then plated on Petri dishes. The plates were flooded with semi-liquid MEA and incubated at 25 ± 2 °C, RH = 50%, for 5–7 days. Serial dilutions were tested in triplicate from three independent samples. After incubation, the colonies were counted, and the results were expressed as CFUs per sample.
2.3.4. Luminometric ATP Measurement
Samples from surfaces of the inoculated facade coatings (25 cm2) were collected using sterile, ATP-free swabs (Merck, Darmstadt, Germany). ATP measurement was carried out using the HY-LiTE 2® system (Merck, Darmstadt, Germany), in accordance with the manufacturer’s instructions. The analysis was performed in three independent replicates. The results were expressed in relative light units (RLUs) per sample.
2.3.5. Colour Change Analysis
Colour changes were determined in the CIE L*a*b trichromatic colour model using a CM-700d portable spectrophotometer (Konica Minolta, Warsaw, Poland) with CM-S100w SpectraMagicTM NXv.2.0 software, as described by Komar et al. [16]. The colour after inoculation was compared to dry samples of the facade coatings.
2.3.6. Mathematical Analysis
The mean number of fungi on the building material and the ATP concentration were compared using a one-way analysis of variance (ANOVA) conducted in Statistica 13.1 (Statsoft, Tulsa, OK, USA) at a significance level of 0.05. Based on the results, the correlation coefficient of determination (R2) was calculated to enable comparison of the tested methods of evaluating the growth of fungi on patch coatings. In assessing the correlation, the scale proposed by Evans [29] was used: very weak correlation (R2 = 0.00–0.19); weak correlation (R2 = 0.20–0.39); moderate correlation (0.40–0.59); strong correlation (0.60–0.79); very strong correlation (0.80–1.00).
2.4. Stage 2—Development of a Methodology for Evaluating the Durability of Building Materials on the Growth of Fungi, with Verification under Environmental Conditions
2.4.1. Microclimate Analysis
Analysis of the microclimate in Poland was conducted based on statistical data provided by the Institute of Meteorology and Water Management—National Research Institute (IMGW-PIB), the State Hydrological and Meteorological Service, and the Chief Inspectorate of Environmental Protection. The data included air temperature (annual average as well as mean values calculated for summer period), total annual rainfall, daily and yearly dust particle concentration of PM10 (particulate matter of diameter less than 10 µm) and PM2.5 (particulate matter of diameter less than 2.5 µm), and air humidity. The analysis is presented in Appendix A. The results were used to model environmental conditions in the newly developed method for assessing the durability of facade coatings.
2.4.2. Strain Interaction Analysis
The tested strains (Table 2) were analysed for mutual antagonistic interactions using the plate method on MEA, according to the methodology described by [31]. Based on the growth of the tested strains on the facades and the antagonistic interactions between them, four strains (A. niger, C. cladosporioides, P. citrinum, and R. mucilaginosa) were selected for testing using the developed method.
2.4.3. Determination of the Correlation between the Number of Fungal Spores/Cells in the Inoculum Suspension and its Optical Density on the McFarland Scale
The optical densities of spore inoculum (moulds) and cell inoculum (yeasts), which were prepared as described in Section 2.4.1, were measured on the McFarland scale using a DEN-1 densitometer (Grant Instrument LTD, Royston, England). A series of twofold dilutions of each inoculum was prepared. The optical density and number of colony-forming units in 1 mL (CFUs/mL) of each inoculum were determined in parallel by the culture method, as described above (Section 2.3.3), with three independent replicates for each inoculum/strain.
2.4.4. Verification of the Developed Method of Evaluating the Durability of Building Materials on the Growth of Fungi
The growth of fungi was measured for 15 facade coatings under laboratory conditions as well as for 7 selected coatings after 1, 2, and 3 years in real environmental conditions. For this purpose, an experimental plot corresponding to the laboratory setup was prepared in the ETICS system and placed vertically in a partially shaded place. The plot was established in 2019 in Żywiec (Lesser Poland Voivodeship). The microclimate of the experimental plot was characterized by relative high humidity, partial shading, relatively high temperatures, and increased air pollution. A detailed analysis of the microclimatic data is provided in Appendix A.
3. Results and Discussion
3.1. Stage 1—Evaluation of Methods for Determining the Degree of Fungal Overgrowth on Building Materials
3.1.1. Visual Assessment
Regardless of the type of tested facade and incubation time (14, 28 days), all samples received the highest score (4) in visual assessments according to the scale presented in [22], meaning that fungi grew over more than 50% of the sample surface (Table 4). The main moulds were identified as belonging to the species Aspergillus niger. Table S1 (Supplementary Materials) shows a photograph of the tested facades after 28 days of incubation.
Based on the results of visual assessment and regular macroscopic observations, no further changes in the appearance of the samples occurred after 21 days. Therefore, it was decided that the sample incubation time could be shortened to 21 days.
The visual method is the easiest and fastest method for assessing fungal growth on building materials, since it does not require any specialized equipment or reagents. Therefore, it is suitable for mass tests and can be performed by low-skilled personnel or in laboratories with only basic equipment. The visual method is currently used to interpret research results in accordance with EN 15457:2022 [22]. However, this method is highly subjective and imprecise. It does not take into account the exact area of fungal growth or the intensity of biofilm formation on the samples. Future work should focus on developing image analysis systems that can eliminate the subjective nature of this method.
3.1.2. Culture Method
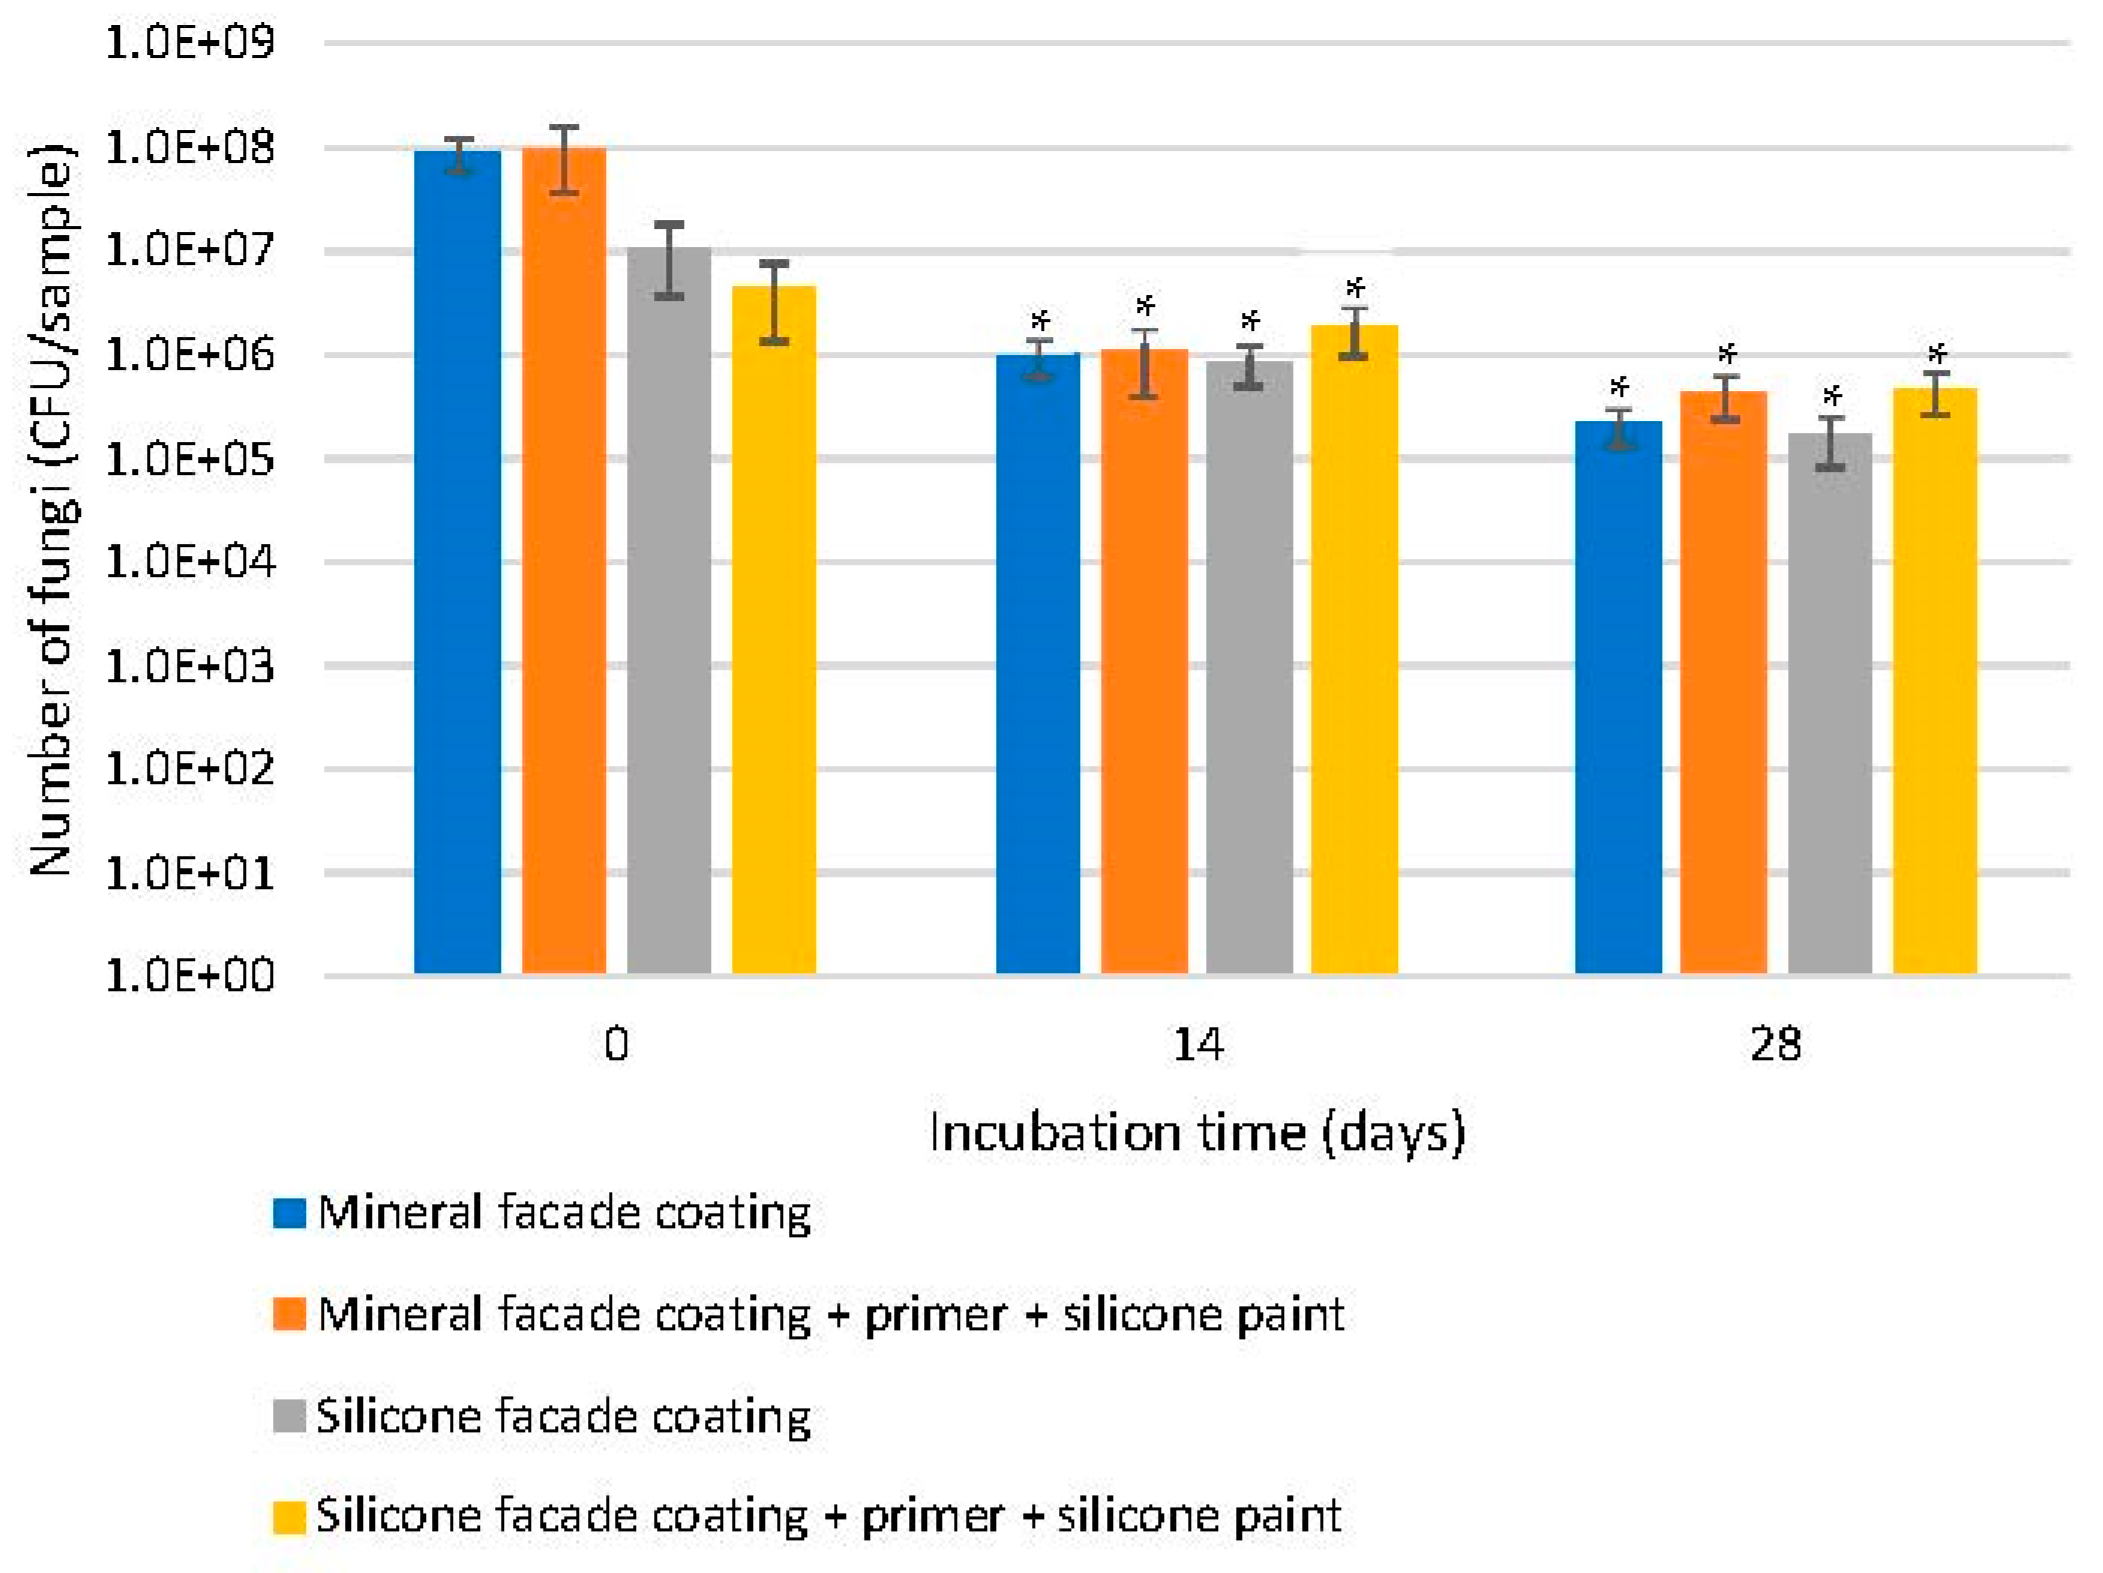
The total numbers of fungi on the different facade samples measured during the 28-day incubation period are shown in Figure 1. The results for individual strain results measured immediately after incubation are summarized in Table 5. The average number of colonies ranged from 4.4 × 10⁶ CFUs/sample for facade coating no. 4 (silicone facade with primer and silicone paint facade) to 9.6 × 10⁷ CFUs/sample for no. 2 (mineral facade with primer and silicone paint). After 14 days of incubation, the fewest colonies were observed for facade coating no. 3 (silicone facade) at 8.5 × 10⁵ CFUs/sample and the highest for no. 4 at 1.9 × 10⁶ CFUs/sample. After 28 days of incubation, the lowest increase was observed in the case of facade no. 3 at 1.7 × 10⁵ CFUs/sample, while the highest increase was observed for facade no. 4 at 4.6 × 10⁵ CFUs/sample.
In all cases, the average number of fungi decreased with the incubation time (p < 0.05). This was probably due to the intensive development of the fungi, which depleted the available nutrients introduced with the MEA. As the available nutrients were exhausted, the fungi began to use the building material as a source of carbon and nitrogen for growth. This changed the dynamics of their multiplication: growth slowed and the fungi began to form spores and die [32].
The number of fungi on the tested facades varied depending on the incubation time and the individual test strain, reaching values from 1.00 × 10³ CFUs/sample to 7.25 × 10⁵ CFUs/sample after 14 days of incubation and from 1.00 × 10³ CFUs/sample to 2.50 × 10⁷ CFUs/sample after 28 days of incubation (Table 5). The moulds A. niger and C. cladosporioides showed the highest survivability on the tested facades, followed by P. citrinum and the yeast R. mucilaginosa. A. melanogenum and Fusarium sp. showed the lowest survival rates.
The breeding method enables accurate determination of the number of fungi active on the surface of building materials. However, it is labour-intensive, material-intensive, and time-consuming.
3.1.3. Luminometric ATP Measurement
The average ATP content on the tested materials was 1000 RLUs–25333 RLUs immediately after inoculation, 22 RLUs–78000 RLUs after 14 days of incubation, and 12 RLUs–30333 RLUs after 28 days, depending on the type of facade (Table 5). In most cases, a statistically significant (p < 0.05) decrease in ATP concentration was observed after just 14 days of incubation. This was probably due to cell death, which was also observed in the culture method. ATP is a characteristic molecule found in living microorganism cells, where it is responsible for coupling intracellular metabolic (energy) reactions. After cell death, ATP is quickly degraded by ATPases [33].
Recently, Komar et al. [16] used the luminometric method to test model building materials for algae fouling. Their study drew attention to the technical difficulty of collecting the entire amount of biological material from facades characterized by high porosity and uneven surfaces. They suggest that this method can be used for microbiological analysis of building materials but should be improved to take into account the specificity of the tested materials [16].
The luminometric method is simple to perform and very quick (sample collection and measurement take about 3 min). The availability of measuring devices, including portable and miniaturized options, alongside ready-made reagent sets, has led to the widespread adoption of the luminometric method to assess the degree of microbiological contamination (primarily bacterial) in the food and pharmaceutical industries. Møretrø et al. [34] and Rakotonirainy et al. [33] used the ATP measurement method to examine the fungal growth on historic papers. The authors emphasized that use of the luminometric method to measure fungal contamination does not always provide reliable results without a previously developed and validated research protocol.
3.1.4. Colour Change Analysis
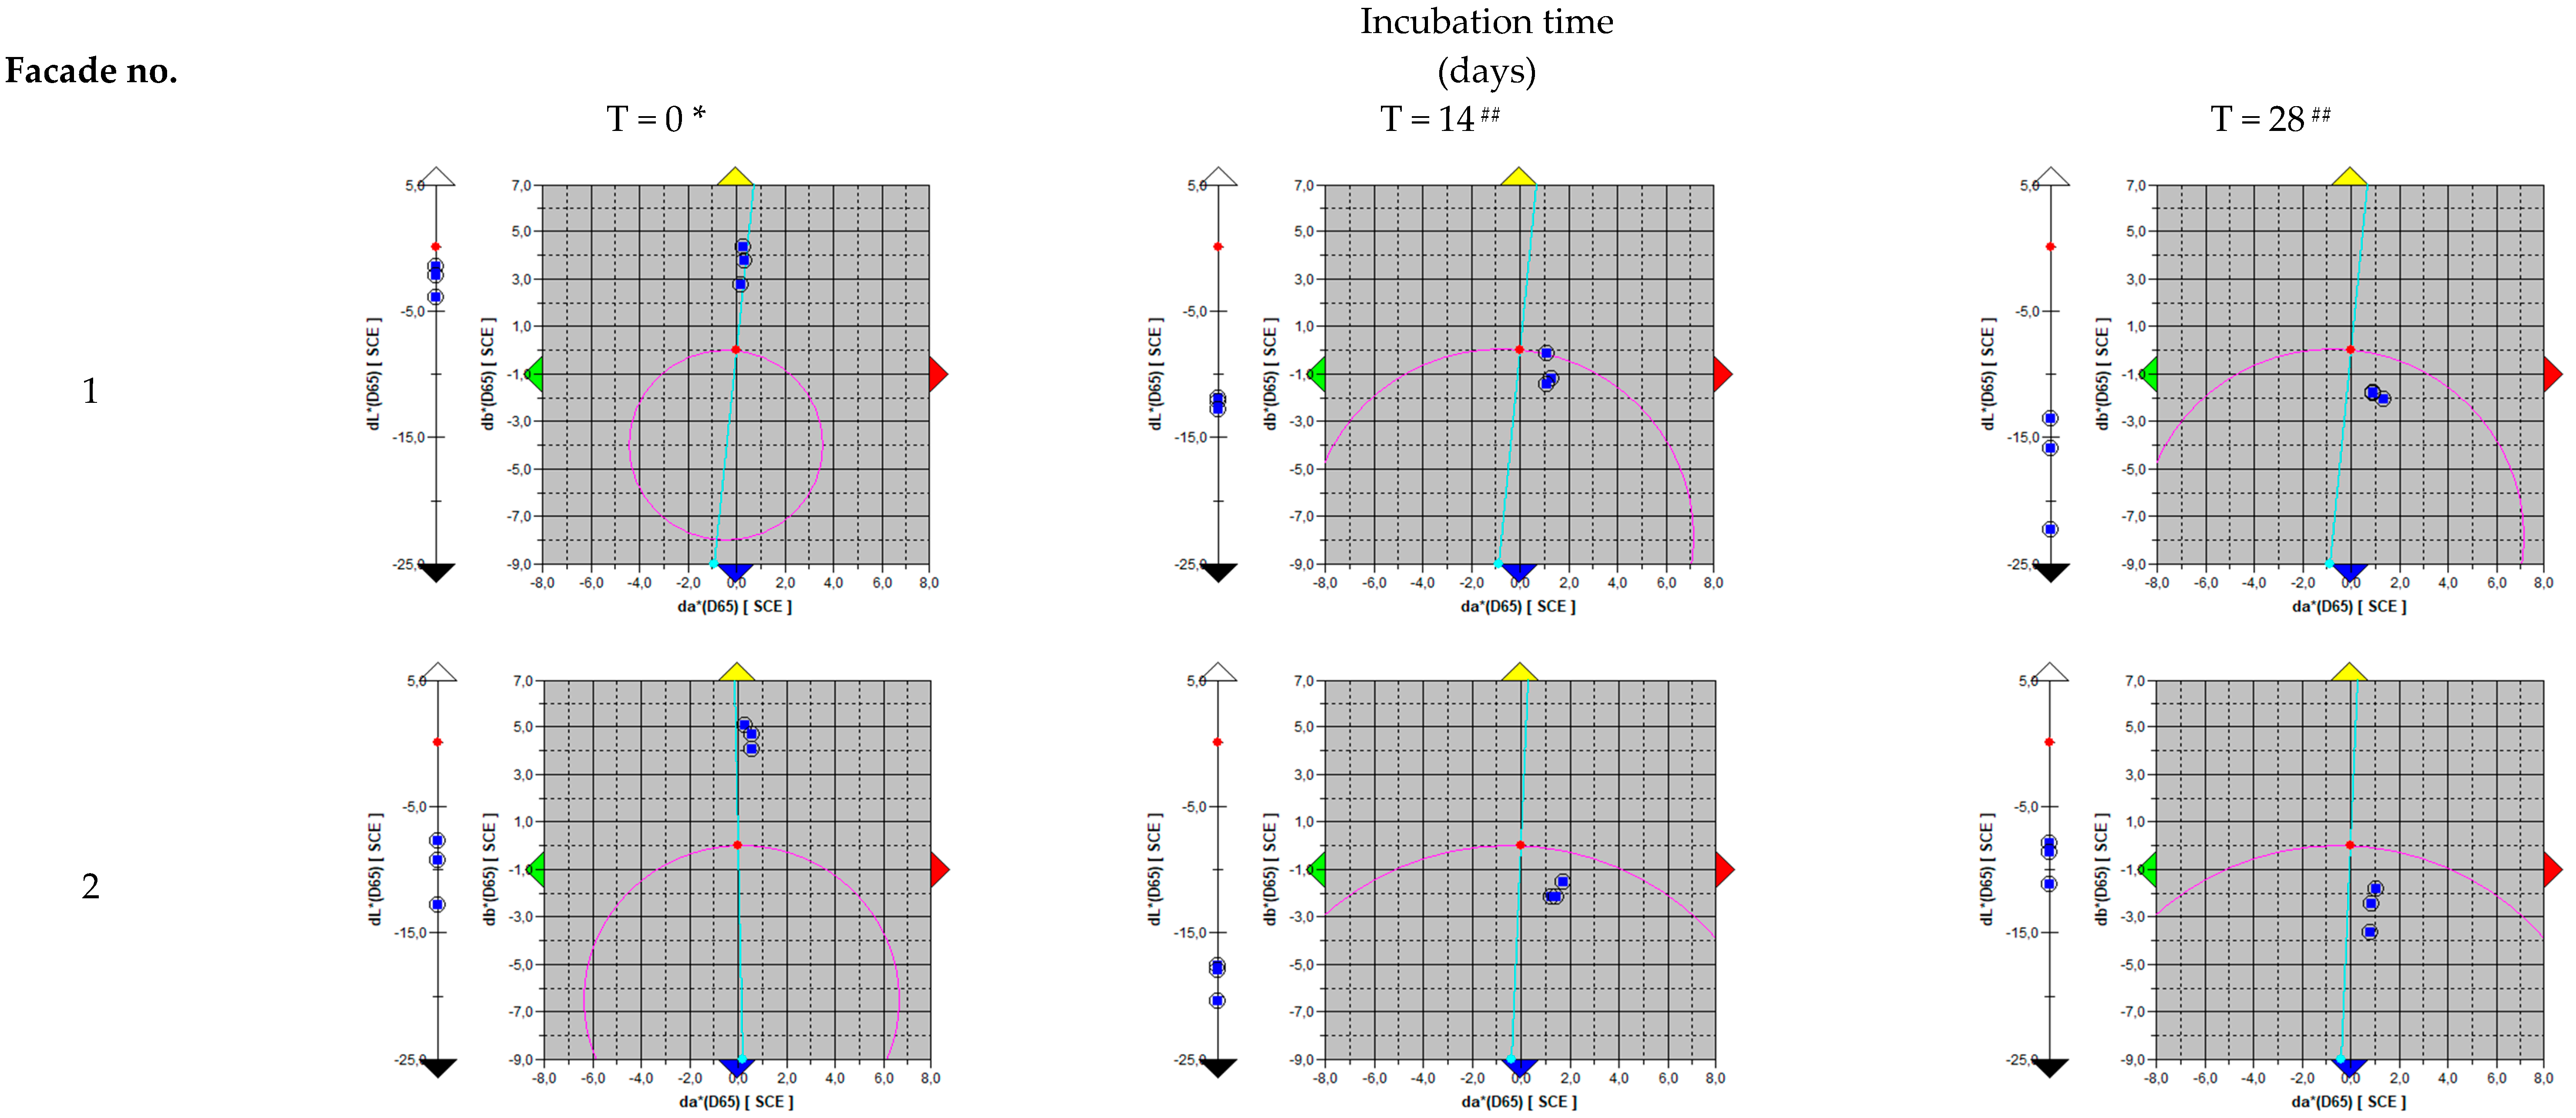
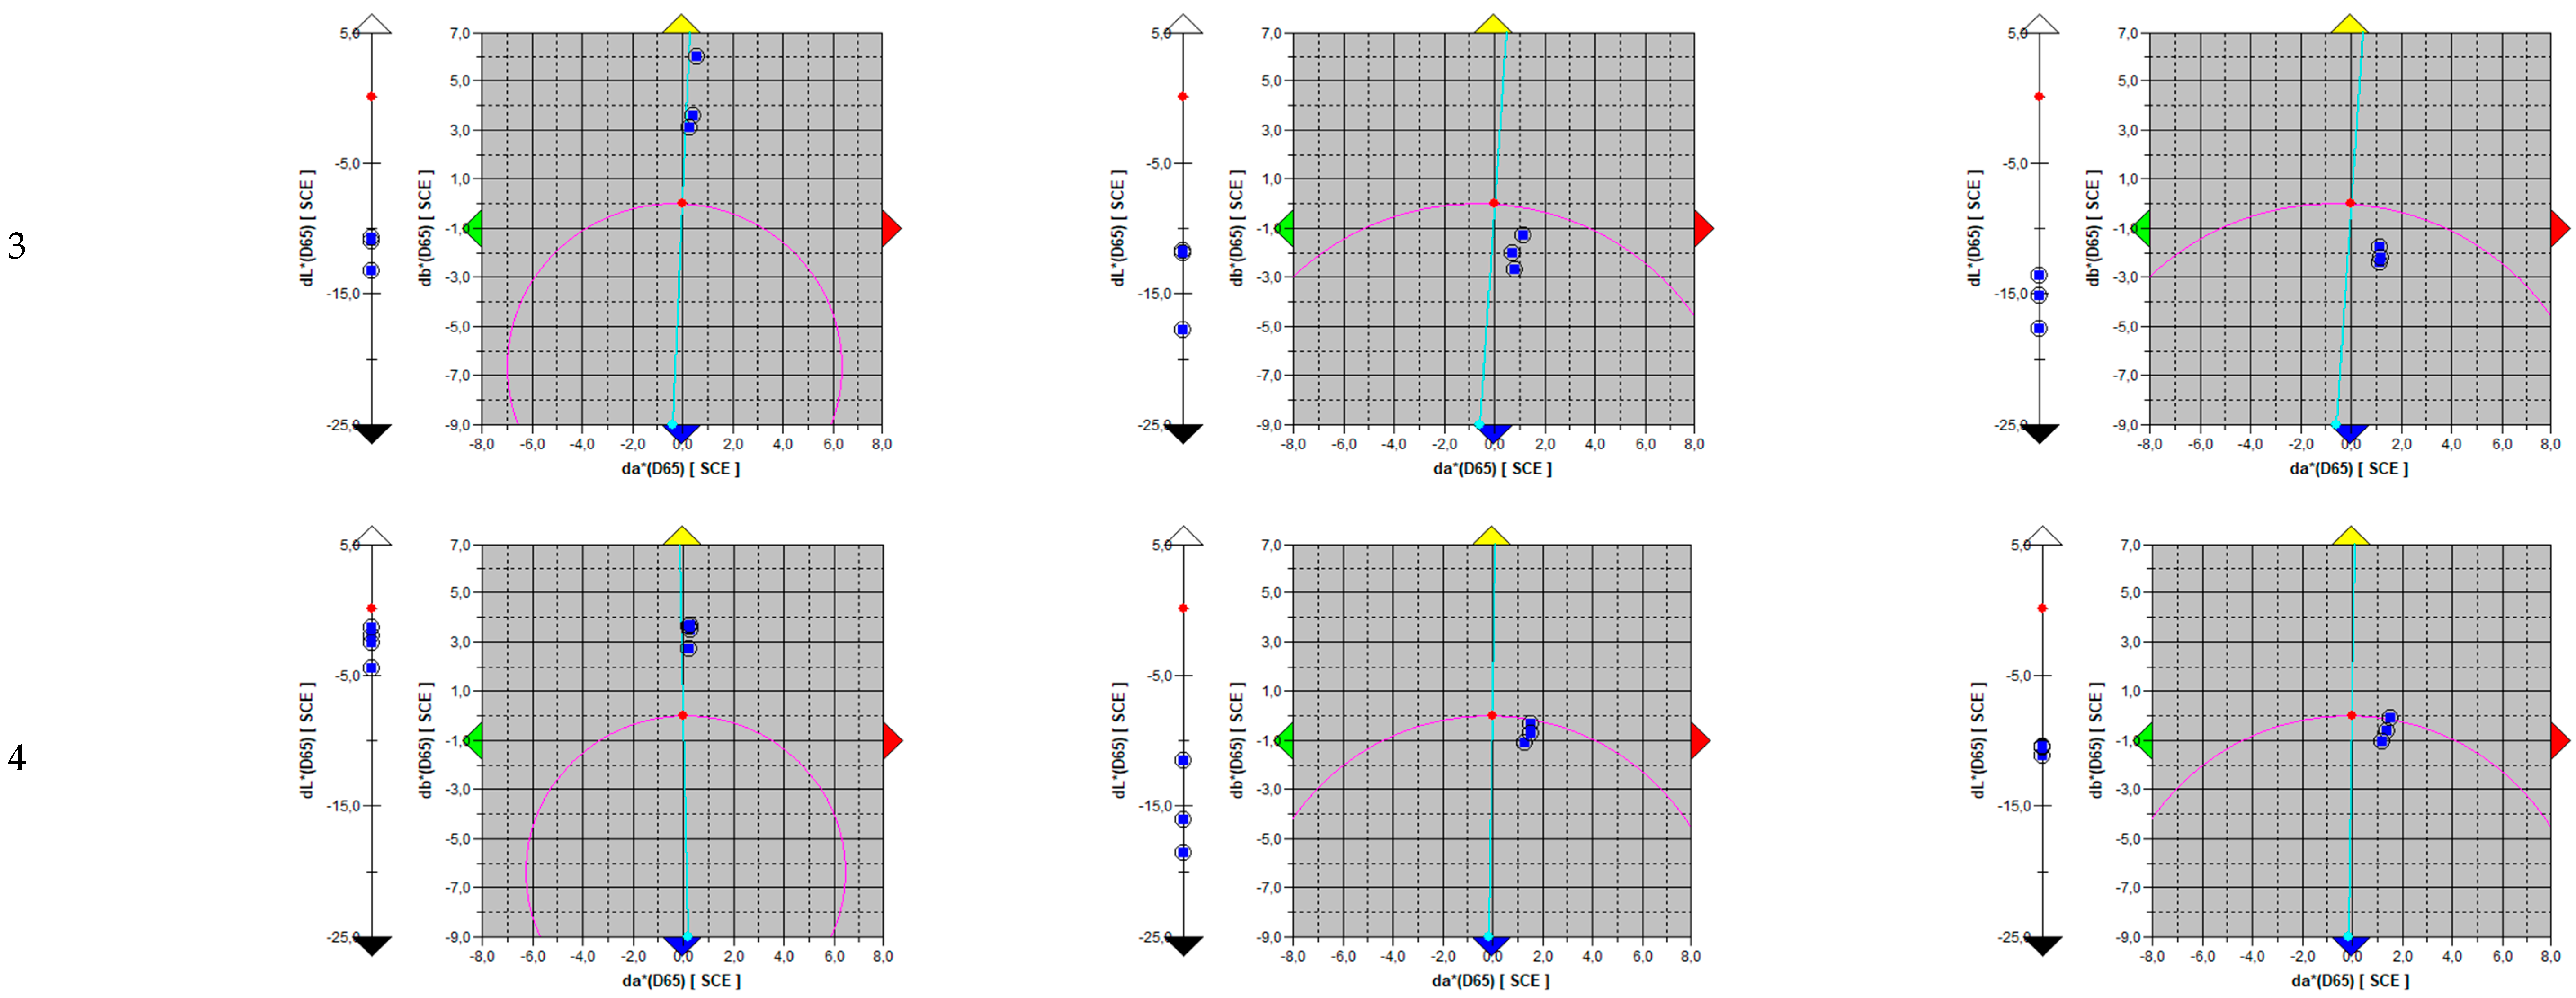
Colour changes determined using the trichromatic colour model (CIE L*a*b) during fungi incubation of the tested facades are presented in Figure 2 and Table 6
Applying the inoculum to the samples resulted in a change to lighter and more yellow colour compared to the samples before inoculation (Table 6). Facade samples after 14 and 28 days of inoculation, compared to samples at t = 0, showed greater darkening, as evidenced by a change in the mirror component ΔL* in the average range from −7.87 to −18.66. A colour change towards red was also observed, associated with an increase in the a* value (Δa* from 0.44 to 1.49) and towards blue, resulting from a decrease in the b* value (Δb* from −0.58 to −3.14) (Figure 2, Table 6). The component relationships between the results were the same for the Specular Component Included (SCI) and Specular Component Excluded (SCE) modes. The total colour change ∆E was from 8.94 to 18.82 after 14 days of incubation and from 8.03 to 15.69 after 28 days of incubation, depending on the mirror component and the type of facade (Figure 2, Table 6). The ΔE parameter for all facades was greater than 5 (8.94–17.36), which means that two different colours were visible [35].
The spectrophotometric determination of colour changes is an easy, quick, and sensitive method for assessing fungal growth on building materials. The results obtained were consistent with those for the visual method. In both methods, a noticeable growth of fungi was found, indicating a lack of resistance of the materials to fungal growth. The results of spectrophotometric determination of colour changes also showed a strong or very strong correlation with the results obtained using the culture method (R2 from 0.62 to 0.99).
Spectrophotometric determination of colour changes with CIE L*a*b has mainly been used to assess the impact of disinfection methods on the optical properties of microbiologically contaminated technical materials, e.g., antique fabrics or photographs [36,37]. The latest research [16] recommends using the spectrophotometric method to study the growth of aerophytic photoautotrophs on building materials. However, it requires a large number of measurement repetitions, due to differences in colour on material surfaces that are not perfectly homogeneous.
3.1.5. Comparison of Methods of Determining the Degree of Fungal Overgrowth of Building Materials
The correlation coefficients between the tested methods for assessing fungal growth on the surface of building materials were calculated in comparison to the culture method, which was used as the reference. A very strong correlation between the visual method and the culture method was demonstrated (R2 = 0.90–0.99) (Table 7). It can be concluded that the visual method is sufficient to assess whether a given material is resistant to fungal growth, which is key to determining the durability of the antifungal protection of facades. Similarly, a very strong correlation (R2 = 1) was demonstrated between the results obtained using the luminometric and culture methods for facades no. 1 (mineral facade) and no. 3 (silicone facade). For the two remaining facades, no. 2 and no. 4, which additionally contained primer and silicone paint, no such correlation was found (Table 6). It is possible that the contents of the primer and silicone paint affect the nature of fungal growth on the surface (different degrees of mycelium development, different intensity of spore formation), explaining why the measured ATP content does not correlate with the number of CFUs. For unmodified mineral and silicone facades, the ATP method can be used as an alternative to the standard culture method to assess fungal contamination of the surface of building materials. However, it should not be used in the case of mineral and silicone facades containing primer and paint. Therefore, comparative tests with both methods should be performed before deciding on the possibility of ultimately using the ATP method.
Given the high or very high correlation (Table 7) between the results of the spectrophotometric method and the visual and culture methods but taking into account the need for a specialized spectrophotometer, we recommend the spectrophotometric method as an alternative method for assessing the growth of fungi on facade coatings.
3.2. Stage 2—Development of a Methodology for Evaluating the Durability of Building Materials on the Growth of Fungi, with Verification in Environmental Conditions
3.2.1. Simulation of Environmental Conditions
Mostly annual climate factors were taken into consideration, based on analysis of the microclimate (Appendix A). Prior to inoculation, each sample was subjected to 6 h of UV light radiation (3 h per sample side) to inactivate any possible microorganisms present on the surface of the tested coatings. Next, the samples were placed in closed, plastic containers and submerged in 1 L of distilled water for 24 h to facilitate leaching. To calculate the amount of water needed to simulate the leaching effect induced by annual precipitation, the mean value of annual precipitation reported for 2022 was used (using the latest data and taking into account climate changes). In this case, 539.5 mm of water (water column) is equivalent to 539.5 L of water per 1 m2 and 53.95 mL per 1 cm2. As the surface area of the tested samples was equal to 20 cm2, the final volume of water used for leaching was rounded to 1 L (1079 mL). After leaching, the samples were once again illuminated with UV light (3 h per side) to further simulate the effect of UV radiation. Since data analysis (Appendix A) showed that air quality has had a significant impact on Poland’s microclimate in recent years, before inoculation the coating samples were treated with 1 mL of non-solidified microbial medium to facilitate the effect of dirt and dust enhancing potential biofouling. The inoculated samples were incubated at 25 ± 2 °C (close to the optimal growth temperature for mould and to average values for the summer period) and in 50% or relative air humidity.
3.2.2. Determination of the Correlation between the Number of Fungal Spores/Cells in the Inoculum Suspension and Its Optical Density on the McFarland Scale
According to the ISO EN 15457 standard, as well as in many scientific studies, standardization of inoculum is based on counting spores/cells in counting chambers (most often a Thoma chamber) [38]. This is time-consuming, especially if the inoculum is multi-strain. Most frequently, the density of the inoculum is finally determined using the culture method. Therefore, we decided to check whether the optical density of spore/cell suspensions of the tested strains could be correlated with the number of their CFUs.
Based on the scale presented in [39], it can be concluded that for all strains a very strong correlation was obtained between the density of the spore suspension on the MF scale and the number of CFUs. Using the equations presented in Table 8, we can determine the MF value for the required concentration of fungal spores/cells in the inoculation suspension. This method of preparing the inoculum is more precise and less time- and labour-consuming. Therefore, in Stage 2 of the research it was decided to perform inoculum standardization using a densitometer.
3.2.3. Strain Interaction Analysis
The antagonistic interactions between seven test strains were analysed in a crossmatch study. No antagonism between the species of tested fungi was observed. The results also proved that the decreases in the number of fungi on the facades during incubation were not associated with mutual inhibition of the growth of test strains. Mixed fungal cultures are also used in tests conducted in accordance with the British standard BS 3900-G6 “Methods of Test for paints—Part G6: Assessment of resistance to fungal growth” [24], describing a method for assessing the resistance of paints to fungi (mould) growth. According to Gaylarde et al. [31], who assessed the antagonistic effects of 14 fungal strains used in the [24] BS 3900-G6 standard, Ulocladium atrum showed antagonistic activity against Aspergillus versicolor and Alternaria alternata, but itself was inhibited by Aspergillus niger, Penicillium purpurogenum, and Penicillium funiculosum. The species showing the greatest antagonistic activity was Penicillium purpurogenum, which inhibited 10 other fungi when grown on MEA medium, but itself was strongly inhibited by Aspergillus niger, Aspergillus versicolor, and Stachybotrys chartarum. The existence of mutual antagonistic interactions between test strains in studies assessing the resistance of technical materials to the growth of microorganisms is an undesirable phenomenon and makes interpretation of results difficult [31]. To assess the resistance of building materials to fungal growth, test strains should be used that do not show mutual antagonistic interactions. Therefore, all the strains tested in the present study could theoretically be used in a mixture to analyse the resistance of building materials to fungal growth. However, taking into account their survival on the facade samples, four strains were selected for Stage 2 of the study: the moulds A. niger, C. cladosporioides, and P. citrinum and the yeast R. mucilaginosa.
3.2.4. Methodology for Evaluating the Durability of Building Materials on the Growth of Fungi
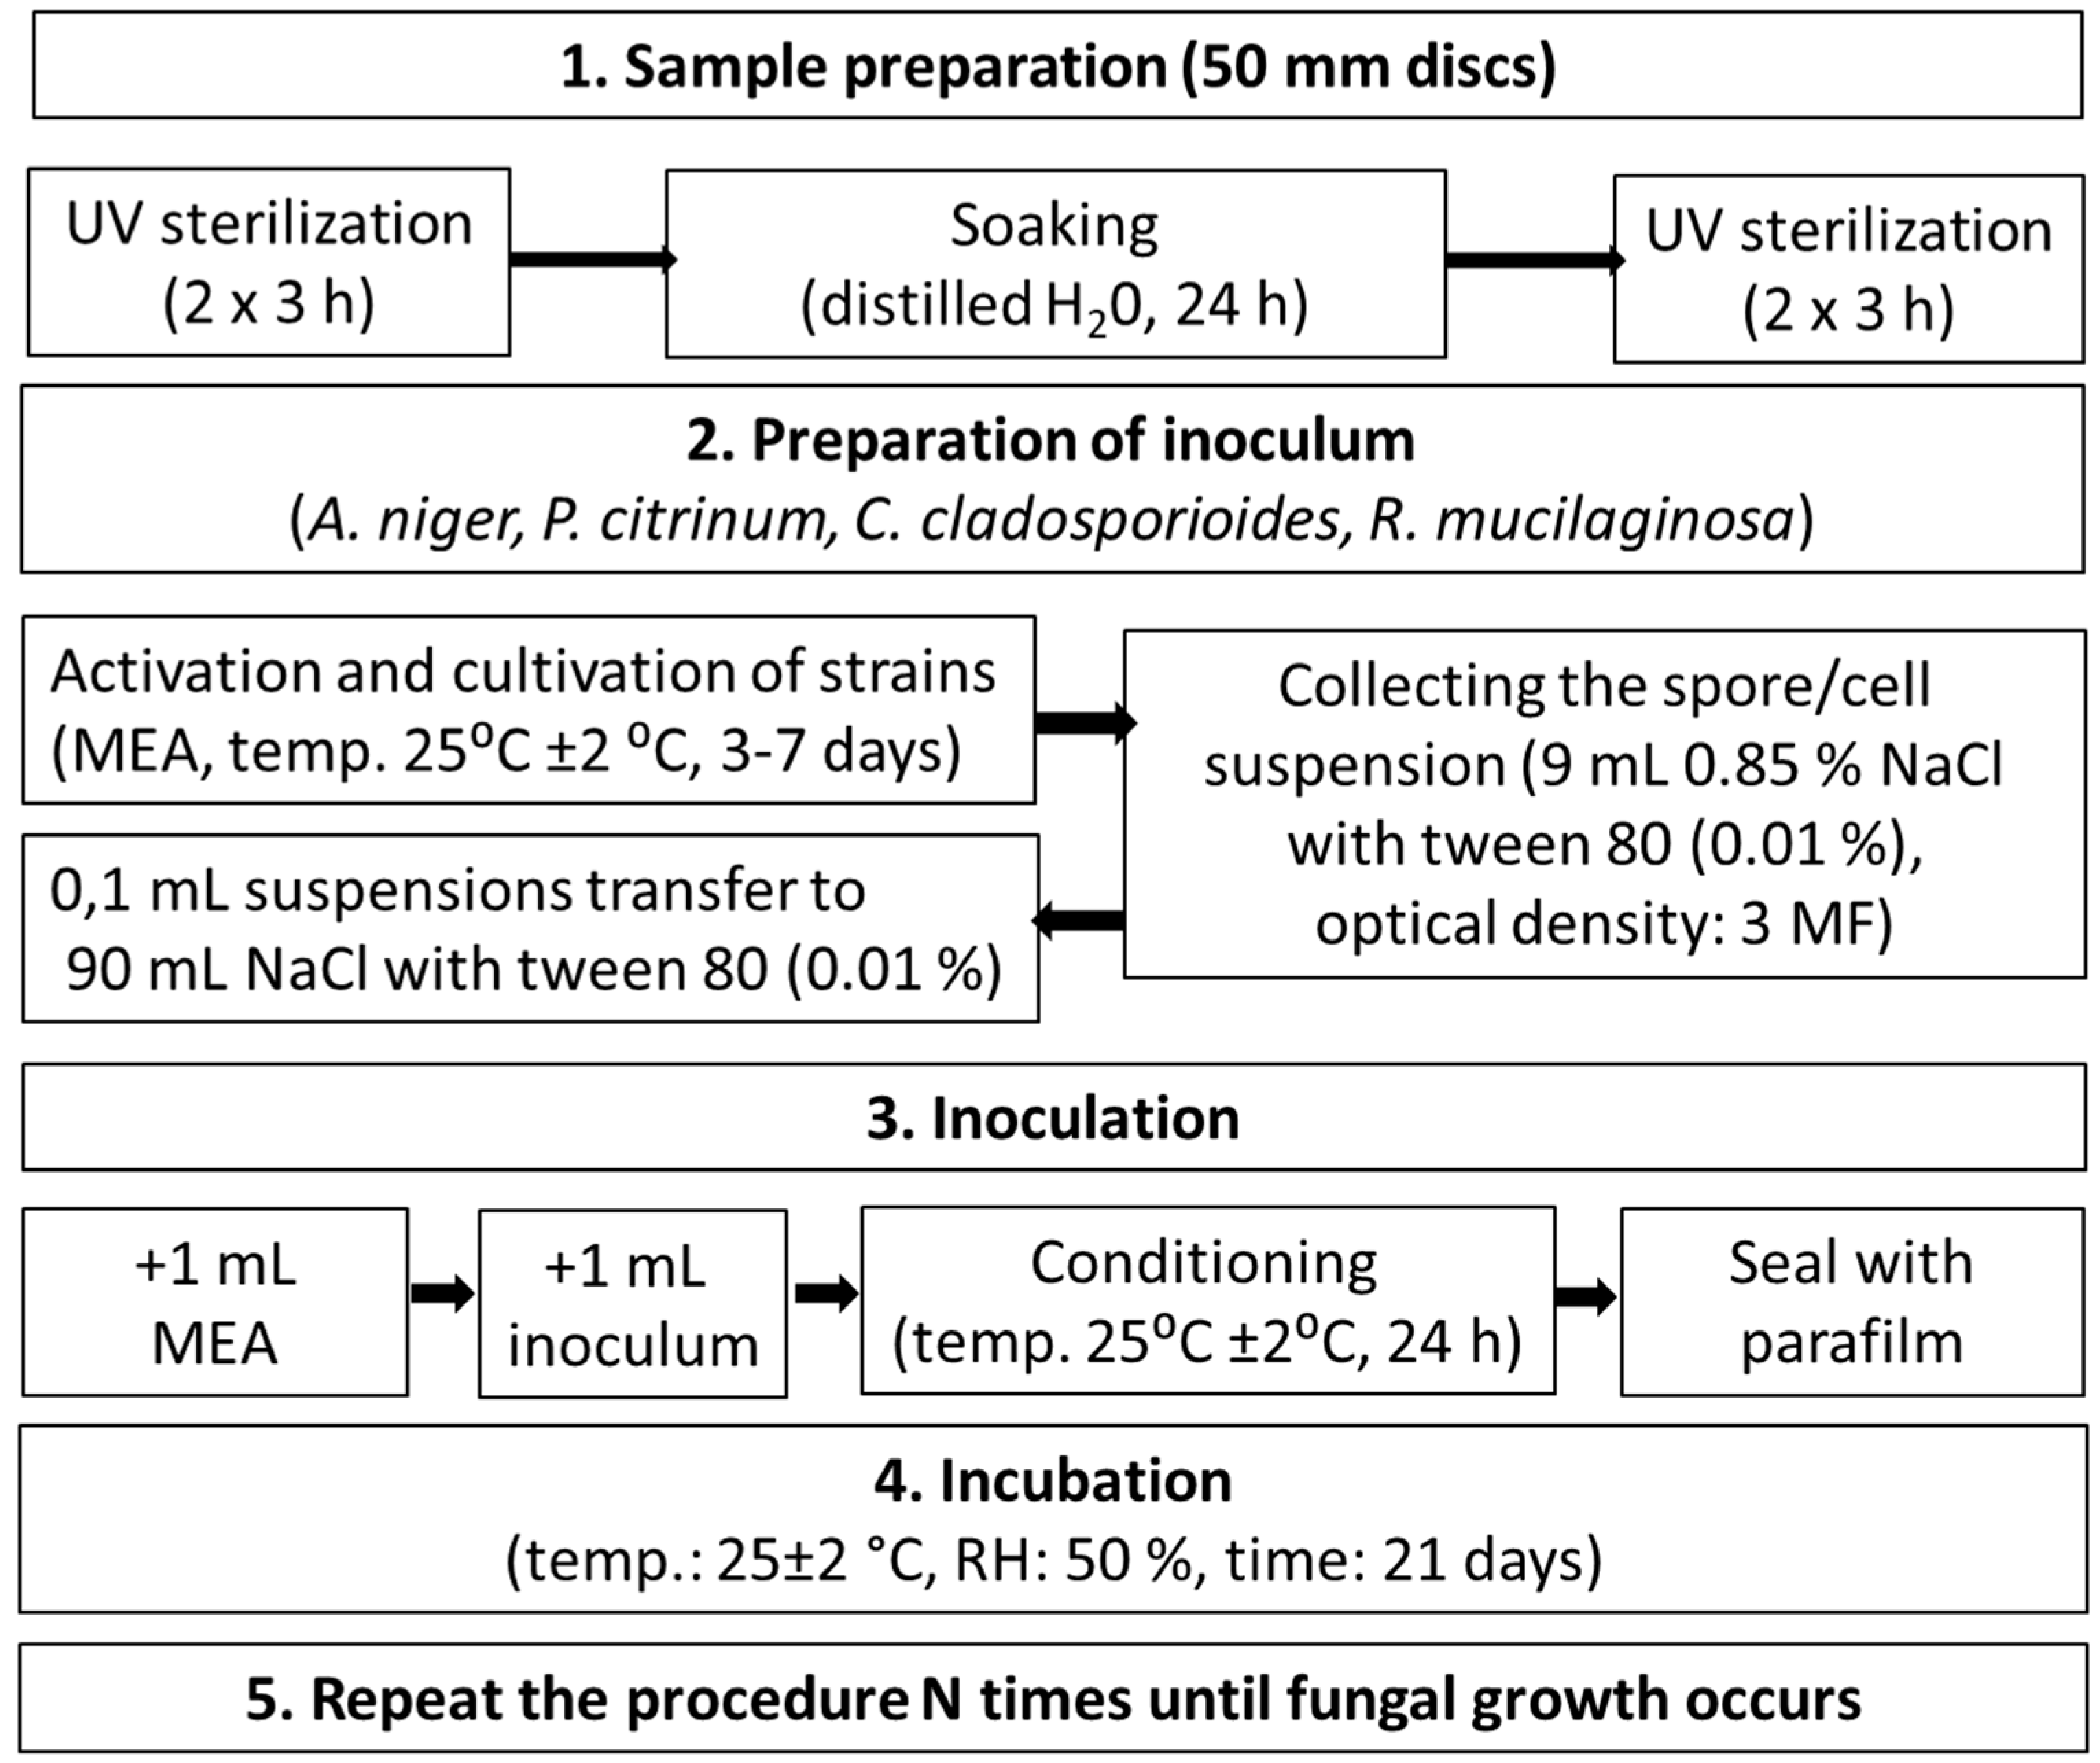
A method for assessing the durability of antifungal protection of building facades was developed (Figure 3). The developed method for evaluating the durability of building materials on the growth of fungi consists of one research cycle conducted in the laboratory, which corresponds to one year under natural conditions.
Samples of the tested materials are prepared in the form of discs with diameters of 50 mm (this makes working in Petri dishes easier). Next, the samples are placed in open plates and sterilized with UV light for 3 h on each side. This stage disinfects the samples between research cycles and enables safe work in the laboratory. Then, each sample is placed in a plastic container and soaked in distilled water for 24 h, so that the entire surface of the sample is in contact with water and the water forms a 4 cm thick layer above the surface of the sample. Wetting the samples is intended to simulate the impact of atmospheric precipitation, which washes out biocides and other substances contained in technical materials. Next, the samples are transferred to Petri dishes and sterilized again in open plates with UV light in a laminar chamber for 3 h on each side. Thermal sterilization should not be used, due to the risk of deactivating biocides if chemically modified samples are tested. UV exposure of samples simulates the exposure of building materials to solar radiation.
To prepare the inoculum, the fungi designated in Stage 1 are used—i.e., the moulds Aspergillus niger, Cladosporium cladosporioides, and Penicillium citrinum and the yeast Rhodotorula mucilaginosa. These species have been identified in the literature as the microorganisms most frequently isolated from bioaerosol in buildings [40]. The activated fungi are cultured on MEA plates at 25 °C ± 2 °C for 3 days (yeasts) or 7 days (moulds). The mould spores and yeast biomass are washed off with a sterile swab and suspended in a test tube with 9 mL of physiological saline (0.85% NaCl) containing 0.01% v/v tween 80. A densitometer is used to determine the optical density of the test strains at 3 MF. Then, 0.1 mL of each of the standardized fungi suspensions is transferred to 90 mL of physiological saline (0.85% NaCl) with tween 80 (0.01%). This method of inoculum preparation ensures a spore/cell concentration of approximately 3 × 10⁴ CFUs/mL, which is lower than that required in the EN 15457 standard (106–107 CFUs/mL) [22]. Reducing the concentration of fungi in the inoculum suspension is intended to reproduce real conditions in which building materials are exposed to fungal aerosol concentrations of <3 × 10⁴ CFUs/m3 [40,41,42,43].
Subsequently, 1 mL of semi-liquid MEA medium is added to each sample using an automatic pipette and spread with a sterile soft brush over the entire sample surface. The use of a brush enables even distribution of the medium on the porous surface of the samples. A separate brush should be used for each type of sample to avoid transferring contaminants/biocides. Next, 1 mL of inoculum is applied to each sample and spread evenly with the pipette tip. The samples are left for 24 h to absorb the inoculum suspension. Finally, the samples are covered with parafilm to protect them from drying out and placed in a laboratory incubator at 25 °C ± 2 °C and air humidity of 50% for 21 days (incubation period determined on the basis of Stage 1 tests). The results are interpreted using the visual method (selected as the best method in Stage 1 tests), using the grading scale included in the EN 15457 standard [22], where an acceptable grade of “0” means the absence of mycelium on the surface of the sample, and an unacceptable grade of “1” means the development of fungi on the sample on at least 10% of the sample surface.
The procedure is repeated N times until fungal growth occurs upon insertion. One test cycle corresponds to 1 year of facade exposure in real conditions. The number of cycles in which no fungal growth is observed is the number of years during which the facade will be resistant to the growth of the microorganisms.
The described method is the subject of a Polish patent application [44].
3.3. Verification of Proposed Methodology in Model and Environmental Conditions
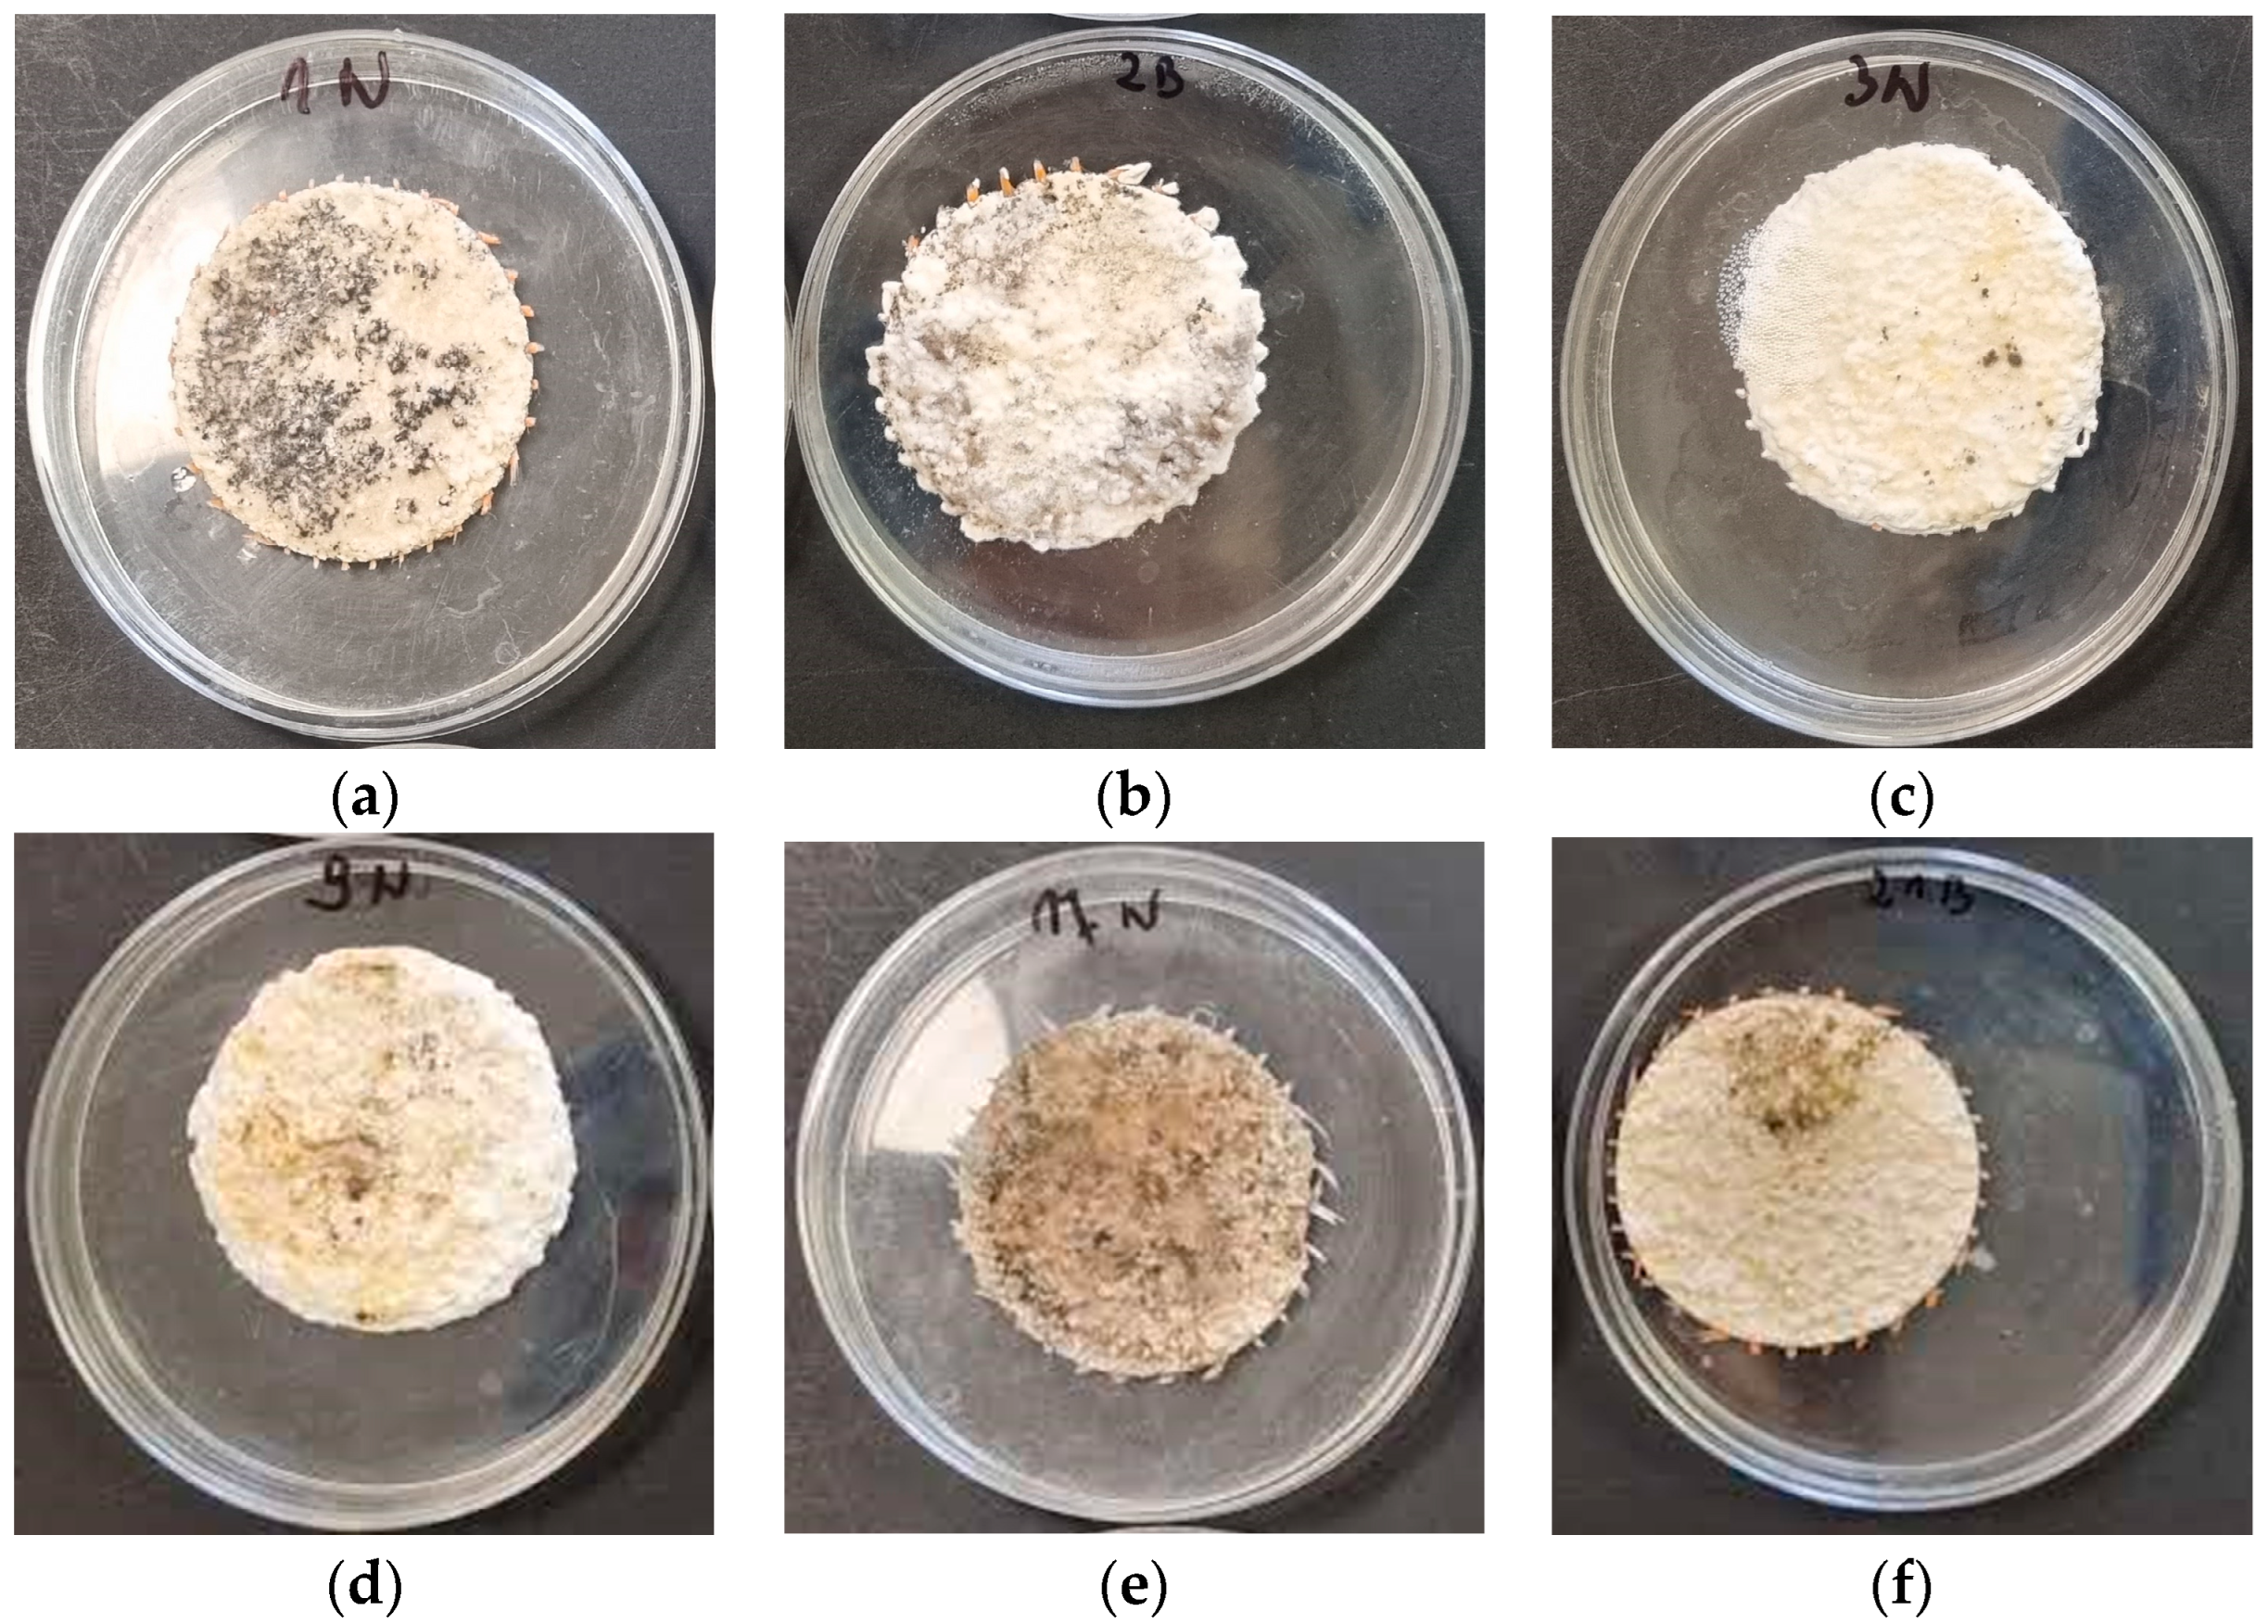
Table 9 shows the percentages of fungal fouling on the tested facade coatings, while Figure 4 shows an example of fungal growth on selected samples after seven test cycles.
The silicone facade (no. 12) was the least resistant to fungal growth. After the first cycle, over 10% of the surface was covered with fungi, which means that it would probably be colonized by fungi in real conditions after 1 year. Facade coatings no. 5, no. 6, and no. 9 were overgrown with fungi after the second test cycle. The silicone facade with biocide (no. 15) did not foul after five test cycles, and 9 of the 15 tested materials (with biocides) showed resistance to fungal growth for longer than seven test cycles, corresponding to 7 years of use (Table 9).
The developed method was verified by comparing seven materials in model tests and after exposure to experimental plots under environmental conditions for 1, 2, and 3 years (Table S2, Supplementary Materials). The tests showed that reliable results can be obtained using the developed method for most materials (mineral facade with and without silicone paint or primer, silicone paint both with and without biocides, silicone facade with biocides). The exception was the facade coating without biocides (no. 12), on which fungi started growing in laboratory conditions after one cycle (1 year) but after 2 years under real conditions. The method should continue to be verified to check its effectiveness in relation to other types of modified facades and facades exposed in different locations.
4. Conclusions
Detailed guidelines have been proposed, taking into account environmental conditions (impact of UV radiation, precipitation, presence of organic matter on the surface, quantitative and qualitative composition of bioaerosol). The guidelines cover the preparation of samples for testing, preparing the inoculum for inoculating samples, incubation conditions, and reading and interpreting the results.
Visual assessment is recommended to assess the resistance of building materials to fungal growth. Surface calculation systems require further refinement using image analysis to reduce human error. The culture method, luminometric ATP measurement, and spectrophotometric CIE L*a*b colour change evaluation lead to the same conclusions but require more time, work, and resources. Surface calculation systems require further refinement using image analysis to reduce human error.
A new methodology for evaluating the protection lifetime of building coatings against fungi was developed and verified under environmental conditions. The developed method consists of one research cycle conducted in the laboratory, which corresponds to one year under natural conditions. The method can be used universally for materials with silicone and biocides. However, further verification is needed to check its effectiveness in relation to other types of coating materials.
The novel method presented here could be used to design biodeterioration control and protection strategies for both new and cultural heritage building coatings. The developed method can be used in a standard microbiological laboratory and is intended for producers of facade systems with or without the addition of biocidal substances that inhibit fungal growth, making it possible to estimate the protection lifetime of facade products against microbiological fouling under real conditions and guarantee durability.
5. Patents
Patent application: P.444942, Laboratory method for assessing the durability of antifungal and antialgal protection of building plasters. Lodz University of Technology 2023.
Supplementary Materials
The following supporting information can be downloaded at: https://0-www-mdpi-com.brum.beds.ac.uk/article/10.3390/coatings13122026/s1, Table S1: Fungal growth on tested facade coatings after 28 days of incubation; Table S2: Verification of fungal growth in laboratory and under environmental conditions for selected facade coatings.
Author Contributions
Conceptualization, J.S., M.K., I.K., K.S. and B.G.; methodology. J.S. and I.K.; software, J.S. and M.K.; investigation, J.S. and M.K.; resources, I.K. and K.S.; writing—original draft preparation, J.S.; writing—review and editing, J.S., M.K., I.K., K.S. and B.G.; visualization, J.S. and M.K.; supervision, J.S. and B.G. All authors have read and agreed to the published version of the manuscript.
Funding
This research received no external funding.
Institutional Review Board Statement
Not applicable.
Informed Consent Statement
Not applicable.
Data Availability Statement
The data presented in this study are available on request from the corresponding author.
Conflicts of Interest
Authors Iwona Kata and Krzysztof Szafran were employed by the company Bolix, S.A. (Inc.). The remaining authors declare that the research was conducted in the absence of any commercial or financial relationships that could be construed as a potential conflict of interest.
Appendix A
Appendix A.1. Microclimate Analysis of Poland Region
The most important features of Poland’s climate are determined by the dynamics of changes, such as annual variability and long-term trends in changes in thermal and precipitation conditions. Since the beginning of the 21st century, a trend of increasing temperature has been observed, as well as great variability in the distribution and intensity of precipitation. An increase in the occurrence of extreme atmospheric phenomena has also been observed [45] Poland is classified as a zone with a temperate and transitional climate. In accordance with [46] norm further climatic areas are distinguished (zones I and II in summer period and I–V in winter). These can differ in calculation parameters such as temperature and relative air humidity (e.g., 28 °C, 50% RH for zone I and 30 °C, 45% RH for zone 2 in summer period). In [46] the calculation parameters of outdoor air for the Polish summer climate zones in the period 1971–2000 were presented, in which the average air humidity (depending on the zone) is equal to 48.07 ± 5.01%.
More detailed climate data can be found, inter alia in the climate standards for the period 1991–2020 provided by IMGM-PIB and calculated on the basis of WMO Guidelines of Climate Normals [47]. In accordance with abovementioned climatic norms [48] the average annual air temperature is estimated as 8.42 ± 2.47 °C while average rainfall sum is equal to 657.34 ± 229.05 mmH2O (Table A1). Mostly cloudy days prevail i.e., 127.14 ± 38.80 days per year in comparison to 51.00 ± 35.08 sunny days. On the other hand, climate data recorded by IMGW-PIB for the following years 2020–2023 show significant deviations from previous norms and indicate ongoing climate changes. The following reports can show slight deviations between data compared with previous years as a result of different synoptic stations being considered in calculations.

Table A1.
Chosen climatic factors calculated based on statistical reports measured in the 1991–2022 period.
Table A1.
Chosen climatic factors calculated based on statistical reports measured in the 1991–2022 period.
| 1991–2020 | 2020 | 2021 | 2022 | |
|---|---|---|---|---|
| Temperature [°C] a | 8.42 | 9.9 | 8.7 | 9.5 |
| Precipitation sum [mmH2O] a | 657.34 | 645.4 | 632.2 | 539.5 |
| Percentage of zones that exceeded PM10 levels (24 h) [%] b | ND | 36 | 54 | ND |
| Percentage of zones that exceeded PM10 levels (annual) [%] b | ND | 2 | 4 | ND |
| Percentage of zones that exceeded PM2.5 levels (annual) [%] b | ND | 31 | 38 | ND |
In accordance with [49] in 2020, annual mean air temperature was equal to 9.9 °C while being 1.5 °C higher than climatic norm for the 1991–2020 period. In the same year, the average annual area rainfall was at the level of 645.4 mmH2O being about 12 mm higher than for the long-term norm 1991–2020 [50]. For most synoptic stations the year was classified as anomalously warm or very warm. Although in the summer the average air temperature was slightly lower than for long-term norms (17–20 °C), it remained warmer for the remaining quarters [48]. Based on 24-h PM10 factor concentration, 29 measurement zones (64%) were classified as class A, meeting the air purity requirements while in 16 zones (36%) the permissible concentration was exceeded (class C). In the annual classification, 44 zones (98%) received class A and 1 received class C [51]. In the same report, for PM2.5 parameter 14 from 45 zones (31%) exceeded permissible annual concentration levels.
In 2021, the average annual area air temperature was equal to 8.7 °C which was 1.2 °C lower than mean value from previous year and near the temperature for long-term period of 1991–2020 [48,52,53]. The average annual sum of precipitation calculated on the basis of measurements from 52 synoptic stations was 632.2 mmH2O, constituting 100.6% of the long-term value for 1991–2020 norm [53]. In comparison with long-term period most stations characterized year 2021 as normal. For summer, mean temperature values of 17–20 °C were observed. A cool spring and relatively warm autumn were noted [45]. Based on daily PM10 concentration levels, 21 zones (46%) were classified as class A and 25 as class C (54%) indicating deterioration of air quality compared to previous year. Exceeding the standards was registered in zones located in 11 out of 16 voivodeships. The annual PM10 concentrations showed that dust concentrations were exceeded in 2 zones. For PM2.5 factor, 17 out of 45 zones did not meet the norm. Violations were registered in 12 voivodeships [52].
For the previous year (2022), annual mean temperature was equal to 9.5 °C being 0.9 °C higher than in the year before and for mean 1991–2020 period values. Averaged precipitation sum was equal to 539.5 mmH2O (86% of 1991–2020 norm). High variability was also observed, including extremely dry and extremely wet months. In comparison with 1991–2020 norm most synoptic stations described the year as warm or very warm. High thermal variability was noted with much warmer first quarter, warmer winter, cool beginning of spring and then hot summer. Mean temperature for summer period was registered at 19–21 °C. The end of the year was classified as cool or normal [54]. Although annual national GIOŚ report for 2020 air quality was not yet published, previous data clearly indicates the progressive negative impact of dust on air quality in most parts of the country.
Appendix A.2. Characteristics of the Microclimate of Experimental Plots
The experimental plot was located in Żywiec, a town located in the center of the Żywiec Valley near Bielsko-Biała, in the Lesser Poland Voivodeship.
In accordance with [55] the highest annual average temperature from 1971 to 2021 was observed in 2019. Throughout the 50 years, a trend of increasing average values was observed, estimated at approximately 2 °C. For Bielsko-Biała (the synoptic station closest to the experimental plot), the average air temperature in 2019 was approximately 9.5 °C. The same report also noted a significant increase in the number of scorching hot days (Tmax > 25 °C) from a dozen to more than 50 and hot days (Tmax > 30 °C) from few to a dozen per year. Hot and scorching hot days also created longer sequences than before. Compared to the rest of the country, the Lesser Poland Voivodeship is characterized by the largest number of days with fog (67.5 days/year and 52.3 days/year for whole region and Bielsko-Biała synoptic station respectively) [56]. Specificity of terrain, high density of urban and industrial agglomerations, high fogging frequency result in increased susceptibility to air dusting. For 2019, the PM10 particulate matter parameter for the 24-h averaging time was exceeded in the entire Lesser Poland Voivodeship (all zones). For the annual averaging time, only 1 zone (Toruń city) did not exceed the permissible level. A similar phenomenon was observed for the PM2.5 parameter, for which the permitted concentration in the annual classification was exceeded in the entire voivodeship [56]. The abovementioned factors contribute to a microclimate characterized by relative high humidity, partial shading, relatively high temperatures and increased air pollution affecting experimental plot.
Abbreviations
| AgNPs | Silver nanoparticles |
| ATP | Adenosine-5’-triphosphate |
| AuNPs | Gold nanoparticles |
| BRI | Building-Related Illness |
| CFUs | Colony-forming units |
| CIE | International Commission on Illumination |
| DCOIT | 4,5-dichloro-2-octyl-4-isothiazolin-3-one |
| DSM | Deutsche Sammlung von Mikroorganismen und Zellkulturen |
| ETICS | External Thermal Insulation Composite Systems |
| IMGW-PIB | Institute of Meteorology and Water Management—National Research Institute |
| IPBC | Iodopropynyl butyl carbamate |
| ITS | Internal Transcribed Spacer |
| MEA | Malt Extract Agar |
| NaCl | Sodium chloride |
| NCBI | National Centre for Biotechnology Information |
| OIT | 2-octyl-2H-isothiazolin-3-one |
| PM10 | Particulate matter of diameter less than 10 µm |
| PM2.5 | Particulate matter of diameter less than 2.5 µm |
| rDNA | Ribosomal Deoxyribonucleic Acid |
| RH | Relative humidity |
| RLUs | Relative Light Units |
| SBS | Sick Building Syndrome |
| SCE | Specular Component Excluded mode |
| SCI | Specular Component Included mode |
| TBZ | Terbuthylazine |
| TiO2 | Titanium dioxide |
| UV/UVC | Ultraviolet radiation/ultraviolet C radiation |
| ZnO | Zinc oxide |
| ZnO2 | Zinc peroxide |
| ZnONPs | Zinc oxide nanoparticles |
| ZnP | Zinc pyrithion |
References
- Guerra, F.L.; Lopes, W.; Cazarolli, J.C.; Lobato, M.; Masuero, A.B.; Dal Molin, D.C.C.; Bento, F.M.; Schrank, A.; Vainstein, M.H. Biodeterioration of Mortar Coating in Historical Buildings: Microclimatic Characterization, Material, and Fungal Community. Build. Environ. 2019, 155, 195–209. [Google Scholar] [CrossRef]
- Hallmann, C.; Hoppert, M.; Mudimu, O.; Friedl, T. Biodiversity of Green Algae Covering Artificial Hard Substrate Surfaces in a Suburban Environment: A Case Study Using Molecular Approaches. J. Phycol. 2016, 52, 732–744. [Google Scholar] [CrossRef] [PubMed]
- Gaylarde, C.C.; Morton, L.H.G.; Loh, K.; Shirakawa, M.A. Biodeterioration of External Architectural Paint Films—A Review. Int. Biodeterior. Biodegrad. 2011, 65, 1189–1198. [Google Scholar] [CrossRef]
- Sterflinger, K. Fungi: Their Role in Deterioration of Cultural Heritage. Fungal Biol. Rev. 2010, 24, 47–55. [Google Scholar] [CrossRef]
- Brzyski, P.; Barnat-Hunek, D.; Suchorab, Z.; Lagód, G. Composite Materials Based on Hemp and Flax for Low-Energy Buildings. Materials 2017, 10, 510. [Google Scholar] [CrossRef]
- Garbacz, M.; Malec, A.; Duda-Saternus, S.; Suchorab, Z.; Guz, L.; Lagód, G. Methods for Early Detection of Microbiological Infestation of Buildings Based on Gas Sensor Technologies. Chemosensors 2020, 8, 7. [Google Scholar] [CrossRef]
- Verdier, T.; Coutand, M.; Bertron, A.; Roques, C. A Review of Indoor Microbial Growth across Building Materials and Sampling and Analysis Methods. Build. Environ. 2014, 80, 136–149. [Google Scholar] [CrossRef]
- Maddalena, R.; Mendell, M.J.; Eliseeva, K.; Chan, W.R.; Sullivan, D.P.; Russell, M.; Satish, U.; Fisk, W.J. Effects of Ventilation Rate per Person and per Floor Area on Perceived Air Quality, Sick Building Syndrome Symptoms, and Decision-Making. Indoor Air 2015, 25, 362–370. [Google Scholar] [CrossRef]
- Nielsen, K.F. Mycotoxin Production by Indoor Molds. Fungal Genet. Biol. 2003, 39, 103–117. [Google Scholar] [CrossRef]
- Wolkoff, P. Indoor Air Humidity, Air Quality, and Health—An Overview. Int. J. Hyg. Environ. Health 2018, 221, 376–390. [Google Scholar] [CrossRef]
- Gutarowska, B. Moulds in Biodeterioration of Technical Materials. Folia Biol. Oecologica 2014, 10, 27–39. [Google Scholar] [CrossRef]
- Dyshlyuk, L.; Babich, O.; Ivanova, S.; Vasilchenco, N.; Atuchin, V.; Korolkov, I.; Russakov, D.; Prosekov, A. Antimicrobial Potential of ZnO, TiO2 and SiO2 Nanoparticles in Protecting Building Materials from Biodegradation. Int. Biodeterior. Biodegrad. 2020, 146, 104821. [Google Scholar] [CrossRef]
- Moreau, C.; Vergès-Belmin, V.; Leroux, L.; Orial, G.; Fronteau, G.; Barbin, V. Water-Repellent and Biocide Treatments: Assessment of the Potential Combinations. J. Cult. Herit. 2008, 9, 394–400. [Google Scholar] [CrossRef]
- Munafò, P.; Goffredo, G.B.; Quagliarini, E. TiO2-Based Nanocoatings for Preserving Architectural Stone Surfaces: An Overview. Constr. Build. Mater. 2015, 84, 201–218. [Google Scholar] [CrossRef]
- Carrillo-González, R.; Martínez-Gómez, M.A.; González-Chávez, M.D.C.A.; Mendoza Hernández, J.C. Inhibition of Microorganisms Involved in Deterioration of an Archaeological Site by Silver Nanoparticles Produced by a Green Synthesis Method. Sci. Total Environ. 2016, 565, 872–881. [Google Scholar] [CrossRef] [PubMed]
- Komar, M.; Szulc, J.; Kata, I.; Szafran, K.; Gutarowska, B. Development of a Method for Assessing the Resistance of Building Coatings to Phoatoautotrophic Biofouling. Appl. Sci. 2023, 13, 8009. [Google Scholar] [CrossRef]
- Viegas, C.A.; Borsoi, G.; Moreira, L.M.; Parracha, J.L.; Nunes, L.; Malanho, S.; Veiga, R.; Flores-Colen, I. Diversity and Distribution of Microbial Communities on the Surface of External Thermal Insulation Composite Systems (ETICS) Facades in Residential Buildings. Int. Biodeterior. Biodegrad. 2023, 184, 105658. [Google Scholar] [CrossRef]
- Cutler, N.; Viles, H. Eukaryotic Microorganisms and Stone Biodeterioration. Geomicrobiol. J. 2010, 27, 630–646. [Google Scholar] [CrossRef]
- Gaylarde, C. Influence of Environment on Microbial Colonization of Historic Stone Buildings with Emphasis on Cyanobacteria. Heritage 2020, 3, 1469–1482. [Google Scholar] [CrossRef]
- Luvidi, L.; Mecchi, A.M.; Ferretti, M.; Sidoti, G. Treatments with Self-Cleaning Products for the Maintenance and Conservation of Stone Surfaces. Int. J. Conserv. Sci. 2016, 7, 311–322. [Google Scholar]
- Li, T.; Hu, Y.; Zhang, B. Evaluation of Efficiency of Six Biocides against Microorganisms Commonly Found on Feilaifeng Limestone, China. J. Cult. Herit. 2020, 43, 45–50. [Google Scholar] [CrossRef]
- EN 15457:2022; Paints and Varnishes—Laboratory Method for Testing the Efficacy of Film Preservatives in a Coating against Fungi. Polish Committee for Standardization: Warsaw, Poland, 2022. Available online: https://sklep.pkn.pl/pn-en-15458-2022-08e.html (accessed on 20 November 2023).
- ASTM D3273-21; Standard Test Method for Resistance to Growth of Mold on the Surface of Interior Coatings in an En-Vironmental Chamber. ASTM International: West Conhohocken, PA, USA, 2021. Available online: https://www.astm.org/d3273-21.html (accessed on 20 November 2023).
- BS 3900-G6; Methods of Test for Paints—Part G6: Assessment of Resistance to Fungal Growth. BSI: London, UK, 1989. Available online: https://standards.globalspec.com/std/946108/bs%203900-g6 (accessed on 20 November 2023).
- European Organization for Technical Assessment (EOTA). External Thermal Insulation Composite Systems (ETICS) with Renderings; EAD (European Assessment Document) 040083-00-0404; EOTA: Brussels, Belgium, 2020. [Google Scholar]
- EN 13501-1:2019; Fire Classification of Construction Products and Building Elements—Part 1: Classification Using Data from Reaction to Fire Tests. iTeh Standards: Erbicoke, ON, Canada, 2019. Available online: https://infostore.saiglobal.com/en-us/standards/pn-en-13501-1-2019-920840_saig_pkn_pkn_2704940/ (accessed on 20 November 2023).
- Gutarowska, B.; Piotrowska, M. Methods of Mycological Analysis in Buildings. Build. Environ. 2007, 42, 1843–1850. [Google Scholar] [CrossRef]
- Andersen, B.; Frisvad, J.C.; Søndergaard, I.; Rasmussen, I.S.; Larsen, L.S. Associations between Fungal Species and Water-Damaged Building Materials. Appl. Environ. Microbiol. 2011, 77, 4180–4188. [Google Scholar] [CrossRef] [PubMed]
- Stępień, Ł.; Koczyk, G.; Waśkiewicz, A. Genetic and Phenotypic Variation of Fusarium Proliferatum Isolates from Different Host Species. J. Appl. Genet. 2011, 52, 487–496. [Google Scholar] [CrossRef] [PubMed]
- PN-EN 15458; Paints and Varnishes—Laboratory Method for Testing the Efficacy of Film Preservatives in a Coating against Algae. European Standards: Brussels, Belgium, 2014.
- Gaylarde, C.; Otlewska, A.; Cellikol-Aydi, S.; Skóra, J.; Sulyok, M.; Pielech-Przybylska, K.; Gillatt, J.; Beech, I.; Gutarowska, B. Interactions between Fungi of Standard Paint Test Method BS3900. Int. Biodeterior. Biodegrad. 2015, 104, 411–418. [Google Scholar] [CrossRef]
- Jennings, D.H. The Physiology of Fungal Nutrition; Cambridge University Press: Cambridge, UK, 1995; ISBN 9780521355247. [Google Scholar]
- Rakotonirainy, M.S.; Héraud, C.; Lavédrine, B. Detection of Viable Fungal Spores Contaminant on Documents and Rapid Control of the Effectiveness of an Ethylene Oxide Disinfection Using ATP Assay. Luminescence 2003, 18, 113–121. [Google Scholar] [CrossRef] [PubMed]
- Møretrø, T.; Normann, M.A.; Sæbø, H.R.; Langsrud, S. Evaluation of ATP Bioluminescence-Based Methods for Hygienic Assessment in Fish Industry. J. Appl. Microbiol. 2019, 127, 186–195. [Google Scholar] [CrossRef]
- Mokrzycki Cardinal Stefan, W.; Tatol, M. Colour Difference ∆E-A Survey. Mach. Graph. Vis. 2011, 20, 383–411. [Google Scholar]
- Zając, I.; Szulc, J.; Gutarowska, B. The Effect of Ethylene Oxide and Silver Nanoparticles on Photographic Models in the Context of Disinfection of Photo Albums. J. Cult. Herit. 2021, 51, 59–70. [Google Scholar] [CrossRef]
- Szulc, J.; Urbaniak-Domagała, W.; Machnowski, W.; Wrzosek, H.; Łącka, K.; Gutarowska, B. Low Temperature Plasma for Textiles Disinfection. Int. Biodeterior. Biodegrad. 2018, 131, 97–106. [Google Scholar] [CrossRef]
- Johansson, P.; Ekstrand-Tobin, A.; Svensson, T.; Bok, G. Laboratory Study to Determine the Critical Moisture Level for Mould Growth on Building Materials. Int. Biodeterior. Biodegrad. 2012, 73, 23–32. [Google Scholar] [CrossRef]
- Evans, J.D. Straightforward Statistics for the Behavioral Sciences; Thomson Brooks/Cole Publishing Co: Pacific Grove, CA, USA, 1996. [Google Scholar]
- Shelton, B.G.; Kirkland, K.H.; Flanders, W.D.; Morris, G.K. Profiles of Airborne Fungi in Buildings and Outdoor Environments in the United States. Appl. Environ. Microbiol. 2002, 68, 1743–1753. [Google Scholar] [CrossRef] [PubMed]
- Fang, Z.; Ouyang, Z.; Zheng, H.; Wang, X. Concentration and Size Distribution of Culturable Airborne Microorganisms in Outdoor Environments in Beijing, China. Aerosol Sci. Technol. 2008, 42, 325–334. [Google Scholar] [CrossRef]
- Kalyoncu, F. Viable Airborne Fungi of Outdoor Environments of Yunusemre District, Manisa, Turkey. Celal Bayar Üniversitesi Fen Bilim. Derg. 2019, 15, 261–264. [Google Scholar] [CrossRef]
- Nageen, Y.; Asemoloye, M.D.; Põlme, S.; Wang, X.; Xu, S.; Ramteke, P.W.; Pecoraro, L. Analysis of Culturable Airborne Fungi in Outdoor Environments in Tianjin, China. BMC Microbiol. 2021, 21, 134. [Google Scholar] [CrossRef]
- Lodz University of Technology. Laboratory Method for Assessing the Durability of Antifungal and Antialgal Protection of Building. Plasters. Patent Application No. 444942, 22 May 2023.
- Institute of Meteorology and Water Management—National Research Institute. Meteorological Yearbook 2021; National Research Institute: Warsaw, Poland, 2022. [Google Scholar]
- Narowski, P. Parametry obliczeniowe powietrza zewnętrznego i strefy klimatyczne Polski do obliczania mocy w systemach chłodzenia, wentylacji i klimatyzacji budynków. Instal 2020, 12, 21–30. [Google Scholar] [CrossRef]
- WMO. WMO Guidelines on the Calculation of Climate Normals; WMO-No. 1203; WMO: Geneva, Switzerland, 2017; p. 29. [Google Scholar]
- Institute of Meteorology and Water Management—National Research Institute. 1991–2020 Climatic Norms. Available online: https://klimat.imgw.pl/pl/climate-normals/ (accessed on 9 November 2023).
- Institute of Meteorology and Water Management—National Research Institute. 2020 State Hydrological and Meteorological Service Bulletin; National Research Institute: Warsaw, Poland, 2021. [Google Scholar]
- Institute of Meteorology and Water Management—National Research Institute. Meteorological Yearbook 2020; National Research Institute: Warsaw, Poland, 2021. [Google Scholar]
- Chief Inspectorate of Environmental Protection. Zones Air Quality Assessment in Poland for 2020; Chief Inspectorate of Environmental Protection: Warsaw, Poland, 2021. [Google Scholar]
- Chief Inspectorate of Environmental Protection. Zones Air Quality Assessment in Poland for 2021; Chief Inspectorate of Environmental Protection: Warsaw, Poland, 2022. [Google Scholar]
- Institute of Meteorology and Water Management—National Research Institute. 2021 State Hydrological and Meteorological Service Bulletin; National Research Institute: Warsaw, Poland, 2022. [Google Scholar]
- Institute of Meteorology and Water Management—National Research Institute. Meteorological Yearbook 2022; National Research Institute: Warsaw, Poland, 2023. [Google Scholar]
- Piotrowicz, K.; Bokwa, A.; Krzaklewski, P. “Analysis of Climate Change—Diagnosis of the Current State” for the Purpose of Updating the Regional Action Plan for Climate and Energy for the Lesser Poland Voivodeship; Chief Inspectorate of Environmental Protection: Kraków, Poland, 2022. [Google Scholar]
- Chief Inspectorate of Environmental Protection. Annual Assessment of Air Quality in the Lesser Poland Voivodeship; Provincial report for 2019; Chief Inspectorate of Environmental Protection: Kraków, Poland, 2020. [Google Scholar]
Figure 1.
Number of fungi on building materials during 28 days of incubation. *—significantly different from t = 0 (one-way ANOVA, p < 0.05).
Figure 1.
Number of fungi on building materials during 28 days of incubation. *—significantly different from t = 0 (one-way ANOVA, p < 0.05).

Figure 2.
Colour change measured for the tested facade coatings. Red dot represents the control sample; blue dots represent the tested samples; arrows represent shifts in colour components; dL* scale represents the achromatic component (lightness of the object); da* axis (green–red); db* axis (blue–yellow); #—compared to noninoculated samples; ##—compared to samples immediately after inoculation; aquamarine lines represent constant hue locus; purple lines represent constant chroma locus.


Figure 3.
Methodology for evaluating the durability of antifungal protection of building materials against the growth of fungi.
Figure 3.
Methodology for evaluating the durability of antifungal protection of building materials against the growth of fungi.

Figure 4.
Example of fungal growth on selected samples after 7 test cycles: (a). sample 5 #– mineral facade coating; (b). sample 6 #—mineral facade coating + silicone paint; (c). sample 7 *—mineral facade coating + silicone paint B no. 1; (d). sample 9 *—mineral facade coating + silicone paint B no. 3; (e). sample 12 #—silicone facade coating; (f). sample 15 *—silicone facade coating B no. 3.

Table 1.
Tested facade coating samples.
| Stage | No. | Description |
|---|---|---|
| 1 (aged facade coatings) | 1 * | Mineral facade coating |
| 2 * | Mineral facade coating + primer + silicone paint | |
| 3 * | Silicone facade coating | |
| 4 * | Silicone facade coating + primer + silicone paint | |
| 2 (not aged facade coatings) | 5 # | Mineral facade coating |
| 6 # | Mineral facade coating + silicone paint | |
| 7 * | Mineral facade coating + silicone paint B no. 1 | |
| 8 * | Mineral facade coating + silicone paint B no. 2 | |
| 9 * | Mineral facade coating + silicone paint B no. 3 | |
| 10 # | Mineral facade coating + primer + silicone paint B | |
| 11 # | Mineral facade coating + primer B + silicone paint B | |
| 12 # | Silicone facade coating | |
| 13 # | Silicone facade coating B no. 1 | |
| 14 # | Silicone facade coating B no. 2 | |
| 15 * | Silicone facade coating B no. 3 | |
| 16 * | Special mineral facade coating no. 2+ silicone paint B no. 1 | |
| 17 * | Special mineral facade coating no. 2+ silicone paint B no. 2 | |
| 18 * | Special mineral facade coating no. 2+ primer + silicone paint B | |
| 19 * | Special mineral facade coating no. 2+ primer B + silicone paint B |
*—facade coatings used for verification of developed method under laboratory conditions; #—facade coatings used for verification of developed method under laboratory and environmental conditions; B—with the addition of biocide.
Table 2.
Fungal species used in the tests.
| Strain | Origin | Spore Concentration in Inoculum (CFUs/mL) |
|---|---|---|
| Alternaria alternata | DSM 62010 | 9.25 × 10⁷ ± 9.57 × 10⁶ |
| Aspergillus niger | DSM 12634 | 2.25 × 10⁸ ± 9.57 × 10⁷ |
| Aureobasidium melanogenum | DSM 2404 | 1.75 × 10⁸ ± 9.57 × 10⁷ |
| Cladosporium cladosporioides | Environmental strain | 9.25 × 10⁷ ± 9.57 × 10⁶ |
| Fusarium sp. | Environmental strain | 8.25 × 10⁷ ± 2.22 × 10⁷ |
| Penicillium citrinum | Environmental strain | 1.73 × 10⁸ ± 9.84 × 10⁷ |
| Rhodotorula mucilaginosa | DSM 70825 | 2.25 × 10⁸ ± 1.89 × 10⁸ |
DSM—Deutsche Sammlung von Mikroorganismen und Zellkulturen.
Table 3.
Scale for evaluating the growth of fungi on the facade coatings [22].
Table 3.
Scale for evaluating the growth of fungi on the facade coatings [22].
| Rate | Percentage of the Surface Covered with Fungi (%) | Colour Legend |
|---|---|---|
| 0 | No visible growth | |
| 1 | <10 | |
| 2 | 10%–30% | |
| 3 | 30%–50% | |
| 4 | >50% |
Table 4.
Visual assessment of fungal growth on the tested materials.
| Facade No. | Description | 0 Days | 14 Days | 28 Days | |||
|---|---|---|---|---|---|---|---|
| % * | Score | % * | Score | % * | Score | ||
| 1 | Mineral facade coating | 0 ± 0 | 0 ± 0 | 98 ± 3 | 4 ± 0 | 91 ± 2 | 4 ± 0 |
| 2 | Mineral facade coating + primer + silicone paint | 0 ± 0 | 0 ± 0 | 95 ± 3 | 4 ± 0 | 88 ± 3 | 4 ± 0 |
| 3 | Silicone facade coating | 0 ± 0 | 0 ± 0 | 95 ± 5 | 4 ± 0 | 90 ± 5 | 4 ± 0 |
| 4 | Silicone facade coating + primer + silicone paint | 0 ± 0 | 0 ± 0 | 94 ± 4 | 4 ± 0 | 100 ± 0 | 4 ± 0 |
*—percentage of surface overgrown by fungi.
Table 5.
Number of particular fungal strains on the surfaces of the facade coatings during 28 days of incubation.
Table 5.
Number of particular fungal strains on the surfaces of the facade coatings during 28 days of incubation.
| Incubation Time, t (Days) | Facade Coatings No. | Number of Fungi (CFUs/Sample) | ATP (RLUs) | ||||||
|---|---|---|---|---|---|---|---|---|---|
| A. alternata | A. niger | A. melanogenum | C.cladosporioides | Fusarium sp. | P. citrinum | R. mucilaginosa | |||
| 0 | 1 | 7.50 × 10⁴ ± 9.57 × 10³ | 3.38 × 10⁶ ± 5.71 × 10⁵ | 6.50 × 10⁵ ± 5.70 × 10⁴ | 2.75 × 10⁵ ± 7.50 × 10⁴ | 8.26 × 10⁷ ± 9.57 × 10⁶ | 1.08 × 10⁶ ± 8.52 × 10⁵ | 4.00 × 10⁵ ± 9.00 × 10⁴ | 1000 ± 0 |
| 2 | 2.50 × 10⁴ ± 5.00 × 10⁶ | 7.45 × 10⁶ ± 2.25 × 10⁴ | 1.48 × 10⁶ ± 9.00 × 10⁴ | 5.00 × 10⁵ ± 2.60 × 10⁴ | 8.27 × 10⁷ ± 9.57 × 10⁷ | 2.03 × 10⁶ ± 4.77 × 10⁵ | 1.38 × 10⁶ ± 3.80 × 10⁵ | 223 # ± 10 | |
| 3 | 5.00 × 10⁴ ± 5.77 × 10³ | 6.08 × 10⁶ ± 9.05 × 10⁵ | 4.00 × 10⁵ ± 3.50 × 10⁴ | 1.03 × 10⁶ ± 7.50 × 10⁵ | 2.50 × 10⁷ ± 9.57 × 10⁶ | 1.55 × 10⁵ ± 3.67 × 10⁴ | 1.03 × 10⁶ ± 6.20 × 10⁵ | 14 # ± 2 | |
| 4 | 2.50 × 10⁵ ± 1.73 × 10⁴ | 2.05 × 10⁶ ± 8.50 × 10⁴ | 3.00 × 10⁵ ± 2.00 × 10⁴ | 2.50 × 10⁵ ± 6.40 × 10⁴ | 2.50 × 10⁷ ± 9.57 × 10⁶ | 1.55 × 10⁶ ± 6.20 × 10⁵ | 1.73 × 10⁶ ± 5.40 × 10⁵ | 25,333 ± 577 | |
| 14 | 1 | 1.00 × 10³ ± 9.50 × 101 # | 5.00 × 10⁴ ± 2.82 × 10³ # | 1.00 × 10³ ± 2.20 × 10² # | 1.00 × 10³ ± 2.70 × 10² # | 1.00 × 10³ ± 2.70 × 10² # | 3.00 × 10⁵ ± 2.25 × 10⁴ | 6.50 × 10⁵ ± 2.70 × 10⁵ | 78,000 ± 1000 |
| 2 | 1.00 × 10³ ± 1.10 × 101 # | 1.00 × 10⁵ ± 2.00 × 10⁴ | 1.00 × 10³ ± 9.70 × 10² # | 7.5 × 10⁴ ± 9.00 × 10³ | 1.00 × 10³ ± 7.65 × 101 # | 1.75 × 10⁵ ± 9.84 × 10⁴ | 7.25 × 10⁵ ± 1.40 × 10⁵ | 12 # ± 1 | |
| 3 | 1.00 × 10³ ± 1.00 × 101 # | 1.25 × 10⁵ ± 1.55 × 10³ | 1.00 × 10³ ± 1.40 × 101 # | 2.00 × 10⁵ ± 1.85 × 10² | 1.00 × 10³ ± 1.05 × 10² # | 7.50 × 10⁴ ± 1.90 × 10⁴ | 4.55 × 10⁵ ± 6.75 × 10⁴ | 11,000 ± 0 | |
| 4 | 1.03 × 10³ ± 8.90 × 10² # | 5.00 × 10⁴ ± 9.30 × 10³ # | 1.00 × 10³ ± 1.00 × 101 # | 2.50 × 10⁴ ± 1.90 × 10³ | 1.00 × 10³ ± 5.25 × 10² # | 3.75 × 10⁵ ± 2.79 × 10⁴ | 1.45 × 10⁶ ± 7.90 × 10⁵ | 813 # ± 32 | |
| 28 | 1 | 3.35 × 10⁴ ± 4.63 × 10³ | 6.50 × 10³ ± 7.50 × 10² # | 2.50 × 10² ± 3.50 × 101 # | 2.75 × 10³ ± 8.75 × 10² # | 7.50 × 10² ± 9.00 × 101 # | 1.26 × 10⁵ ± 4.22 × 10⁴ | 4.45 × 10⁴ ± 4.50 × 10³ | 49 # ± 10 |
| 2 | 6.00 × 10³ ± 9.38 × 10³ | 5.00 × 10⁴ ± 2.27 × 10³ # | 1.00 × 101 ± 0.00 # | 1.00 × 10⁴ ± 1.89 × 10³ | 7.50 × 10³ ± 1.19 × 10³ # | 2.50 × 10⁵ ± 9.40 × 10⁴ | 6.00 × 10⁴ ± 9.00 × 10³ # | 15,333 ± 577 | |
| 3 | 2.50 × 10³ ± 5.00 × 10² | 3.48 × 10⁴ ± 5.50 × 10³ # | 1.00 × 101 ± 0.00 # | 1.00 × 10⁴ ± 3.80 × 10³ # | 1.75 × 10³ ± 8.20 × 10² # | 7.05 × 10⁴ ± 1.08 × 10⁴ | 4.70 × 10⁴ ± 8.09 × 10³ # | 76,667 # ± 1155 | |
| 4 | 1.75 × 10⁴ ± 1.26 × 10⁴ | 1.08 × 10⁵ ± 1.05 × 10⁴ | 1.00 × 101 ± 0.00 # | 5.50 × 10⁴ ± 5.70 × 10³ | 5.00 × 10³ ± 8.90 × 10² # | 1.68 × 10⁵ ± 7.69 × 10⁴ | 1.10 × 10⁵ ± 8.50 × 10⁴ | 30,333 ± 1528 | |
Mean ± standard deviation; #—significantly different from t = 0 (one-way ANOVA, p < 0.05).
Table 6.
Parameters of colour change measured for tested facade coatings.
| Facade Coatings | Incubation Time (Day) | Specular Component | ΔL* | Δa* | Δb* | ΔE |
|---|---|---|---|---|---|---|
| 1 | 0 | SCI | nt | nt | nt | nt |
| SCE | nt | nt | nt | nt | ||
| 14 | SCI | −8.80 | 0.70 | −1.34 | 8.94 | |
| SCE | −12.33 | 1.18 | −0.91 | 12.43 | ||
| 28 | SCI | −11.79 | 0.50 | −2.22 | 12.01 | |
| SCE | −17.22 | 1.05 | −1.89 | 17.36 | ||
| 2 | 0 | SCI | nt | nt | nt | nt |
| SCE | nt | nt | nt | nt | ||
| 14 | SCI | −13.63 | 0.93 | −3.14 | 14.01 | |
| SCE | −18.66 | 1.49 | −1.96 | 18.82 | ||
| 28 | SCI | −8.42 | 0.83 | −2.48 | 8.82 | |
| SCE | −9.25 | 0.92 | −2.63 | 9.67 | ||
| 3 | 0 | SCI | nt | nt | nt | nt |
| SCE | nt | nt | nt | nt | ||
| 14 | SCI | −9.72 | 0.44 | −2.76 | 10.12 | |
| SCE | −13.79 | 0.90 | −1.99 | 13.99 | ||
| 28 | SCI | −10.61 | 0.61 | −2.81 | 11.00 | |
| SCE | −15.50 | 1.18 | −2.12 | 15.69 | ||
| 4 | 0 | SCI | nt | nt | nt | nt |
| SCE | nt | nt | nt | nt | ||
| 14 | SCI | −10.93 | 0.94 | −1.90 | 11.14 | |
| SCE | −15.38 | 1.46 | −0.71 | 15.48 | ||
| 28 | SCI | −7.87 | 0.99 | −1.21 | 8.03 | |
| SCE | −10.73 | 1.39 | −0.58 | 10.84 |
SCI—Specular Component Included mode; SCE—Specular Component Excluded mode; nt—not tested.
Table 7.
Correlation between the results of the tested methods and the culture method (R2).
| Facade No. | Description | Visual Assessment | ΔE | ATP | |
|---|---|---|---|---|---|
| SCI | SCE | ||||
| 1 | Mineral facade coating | 0.99 | 0.94 | 0.93 | 1 |
| 2 | Mineral facade coating + primer + silicone paint | 0.99 | 0.86 | 0.76 | 0.04 |
| 3 | Silicone facade coating | 0.98 | 0.99 | 0.99 | 1 |
| 4 | Silicone facade coating + primer + silicone paint | 0.90 | 0.64 | 0.62 | 0.15 |
SCI—Specular Component Included mode; SCE—Specular Component Excluded mode.
Table 8.
Correlation between the number of fungal spores/cells in the inoculum suspension and its optical density.
Table 8.
Correlation between the number of fungal spores/cells in the inoculum suspension and its optical density.
| Strain | Equation | R2 |
|---|---|---|
| Alternaria alternata | y = 2.20 × 10⁻⁵x | 0.992 |
| Aspergillus niger | y = 6.74 × 10⁻⁷x | 0.977 |
| Aureobasidium melanogenum | y = 1.51 × 10⁻⁷x | 0.995 |
| Cladosporium cladosporioides | y = 9.00 × 10⁻⁸x | 0.987 |
| Fusarium sp. | y = 7.87 × 10⁻⁵x | 0.996 |
| Penicillium citrinum | y = 7.00 × 10⁻⁷x | 0.996 |
| Rhodotorula mucilaginosa | y = 5.74 × 10⁻⁷x | 0.999 |
y—number of fungal spores/cells in the inoculum suspension (CFUs/mL); x—optical density (MF).
Table 9.
Percentages of fungal fouling on the tested facade coatings (%).
| No. | Facade Coatings | Tested Cycle (Years) | ||||||
|---|---|---|---|---|---|---|---|---|
| 1 | 2 | 3 | 4 | 5 | 6 | 7 | ||
| 5 # | Mineral facade coating | 0 | 62.5 | 63.75 | 75 | 75 | 75 | 75 |
| 6 # | Mineral facade coating + silicone paint | 0 | 51.25 | 52.5 | 57.5 | 57.5 | 57.5 | 57.5 |
| 7 * | Mineral facade coating + silicone paint B no. 1 | 0 | 0 | 0 | 0 | 0 | 1.5 | 1.5 |
| 8 * | Mineral facade coating + silicone paint B no. 2 | 0 | 0 | 0 | 0 | 0 | 0 | 0 |
| 9 * | Mineral facade coating + silicone paint B no. 3 | 0 | 10.25 | 21.5 | 10.25 | 21.25 | 40.5 | 40.5 |
| 10 # | Mineral facade coating + primer + silicone paint B | 0 | 0 | 0 | 0 | 0 | 0 | 0 |
| 11 # | Mineral facade coating + primer B + silicone paint B | 0 | 0 | 0 | 0 | 0 | 0 | 0 |
| 12 # | Silicone facade coating | 77.5 | 95 | 100 | 100 | 100 | 100 | 100 |
| 13 # | Silicone facade coating B no. 1 | 0 | 0 | 0 | 0 | 0 | 0 | 0 |
| 14 # | Silicone facade coating B no. 2 | 0 | 0 | 0 | 0 | 0 | 0 | 0 |
| 15 * | Silicone facade coating B no. 3 | 0 | 0 | 0 | 0 | 0 | 31.25 | 32.5 |
| 16 * | Special mineral facade coating no. 2+ silicone paint B no. 1 | 0 | 0 | 0 | 0 | 0 | 0 | 0 |
| 17 * | Special mineral facade coating no. 2+ silicone paint B no. 2 | 0 | 0 | 0 | 0 | 0 | 0 | 0 |
| 18 * | Special mineral facade coating no. 2+ primer + silicone paint B | 0 | 0 | 0 | 0 | 0 | 0 | 0 |
| 19 * | Special mineral facade coating no. 2+ primer B + silicone paint B | 0 | 0 | 0 | 0 | 0 | 0 | 0 |
*—facade coatings used for verification of developed method in laboratory conditions; #—facadecoatings used for verification of developed method in laboratory and environmental conditions; B—with the addition of biocide; colors according scale described in Table 3.
Disclaimer/Publisher’s Note: The statements, opinions and data contained in all publications are solely those of the individual author(s) and contributor(s) and not of MDPI and/or the editor(s). MDPI and/or the editor(s) disclaim responsibility for any injury to people or property resulting from any ideas, methods, instructions or products referred to in the content. |
© 2023 by the authors. Licensee MDPI, Basel, Switzerland. This article is an open access article distributed under the terms and conditions of the Creative Commons Attribution (CC BY) license (https://creativecommons.org/licenses/by/4.0/).
Share and Cite
MDPI and ACS Style
Szulc, J.; Komar, M.; Kata, I.; Szafran, K.; Gutarowska, B. Novel Method for Assessing the Protection Lifetime of Building Coatings against Fungi. Coatings 2023, 13, 2026. https://0-doi-org.brum.beds.ac.uk/10.3390/coatings13122026
AMA Style
Szulc J, Komar M, Kata I, Szafran K, Gutarowska B. Novel Method for Assessing the Protection Lifetime of Building Coatings against Fungi. Coatings. 2023; 13(12):2026. https://0-doi-org.brum.beds.ac.uk/10.3390/coatings13122026
Chicago/Turabian StyleSzulc, Justyna, Michał Komar, Iwona Kata, Krzysztof Szafran, and Beata Gutarowska. 2023. "Novel Method for Assessing the Protection Lifetime of Building Coatings against Fungi" Coatings 13, no. 12: 2026. https://0-doi-org.brum.beds.ac.uk/10.3390/coatings13122026
Note that from the first issue of 2016, this journal uses article numbers instead of page numbers. See further details here.