
The Effect of Plasma Spray Parameters on the Quality of Al-Ni Coatings
by
Shenglian Wang
1,
Shuang Chen
2,*,
Ming Liu
3,
Qinghua Huang
2,
Zimo Liu
2,
Xin Li
2 and
Shaofeng Xu
4 1
School of Intelligent Manufacturing and Automotive Engineering, Gannan University of Science and Technology, Ganzhou 341000, China
2
College of Mechanical and Electrical Engineering, Jiangxi University of Science and Technology, Ganzhou 341000, China
3
National Key Laboratory for Remanufacturing, Army Academy of Armored Forces, Beijing 100072, China
4
Key Laboratory of Soft Machines and Smart Devices of Zhejiang Province, School of Aeronautics and Astronautics, Institute of Applied Mechanics, Zhejiang University, Hangzhou 310027, China
*
Author to whom correspondence should be addressed.
Coatings 2023, 13(12), 2063; https://0-doi-org.brum.beds.ac.uk/10.3390/coatings13122063
Submission received: 5 November 2023
/
Revised: 5 December 2023
/
Accepted: 7 December 2023
/
Published: 9 December 2023
(This article belongs to the Special Issue Application of Advanced Plasma Technology in Coatings, Films and Etching)
Abstract
:The plasma spray method is widely utilized for enhancing wear, surface fatigue, and corrosion properties through coating. The mechanical and surface characteristics of the resulting coating are contingent upon various spraying parameters, including arc current, working current, spraying distance, and plasma gun traversing speed. This study investigates the impact of these manufacturing parameters on the porosity, hardness, and bond strength of a coating produced from an Al-Ni alloy applied to a Q235 steel substrate. An extensive experimental program was conducted to analyze the influence of these parameters on the coating properties. Consequently, a preferred combination of parameters, identified through a comprehensive evaluation method, yielded greater performance benefits compared to the orthogonal experimental groups.
1. Introduction
Various industries require structural component materials with an optimal strength-to-weight ratio, as well as specific properties such as high temperature, fatigue, corrosion, and wear resistance, depending on their intended function. For example, landing gear dampers are designed to absorb and dissipate landing impact energy and reduce stresses on the fuselage. Traditionally, many landing gear components have been plated with hard chrome [1,2,3]. However, due to environmental regulations and concerns about the health effects of hexavalent chromium, there is a need to find alternative coatings [4]. Plasma spray coatings have emerged as a viable alternative, offering improved mechanical and surface performance in comparison to conventional hard chrome coatings, particularly in terms of wear and corrosion behavior [3,5,6]. In the aeronautical field, turbine blades are critical components susceptible to fatigue and thermal creep failures [7,8,9]. Furthermore, as a result of the increased oxidation at high temperatures [10], coatings are commonly engineered to function as thermal barrier coatings (TBC) for components exposed to high-temperature gases [11,12,13]. A frequently utilized TBC in the field of aeronautics is the Al-Ni coating, which is typically acquired through plasma spraying technology. It is employed for the purpose of safeguarding components exposed to high temperatures and is primarily distinguished by its excellent adhesion to the substrate [14,15,16]. Al-Ni coatings have been the subject of extensive research due to their good mechanical properties as well as exceptional abilities to withstand corrosion and high-temperature oxidation, as documented in numerous studies [17,18,19,20]. Bang et al. investigated the mechanical and surface characteristics of Al-Ni coatings with different aluminum contents on high-strength low-alloy steel [17]. The research indicates that higher levels of aluminum content led to the expansion of the FCC structure lattice in the coatings, thereby facilitating a reduction in grain size and ultimately enhancing the hardness of the materials. Zhang et al. investigated the correlation between porosity and micro-mechanical characteristics of Al-Ni alloy coatings [18]. Their experimental findings revealed that the measured porosity, Young’s modulus, and micro-hardness data of the coatings displayed significant variability and conformed to the Weibull distribution. The statistical analysis indicated a decrease in the micro-hardness and Young’s modulus of the coatings as the porosity of the coatings increased. Ghanbari and Mahboubi utilized the sediment co-deposition method to deposit Al-Ni coatings and observed an enhancement in the corrosion resistance in comparison to pure Ni coatings [19]. This improvement was credited to the easy creation of aluminum oxide on the active aluminum particles, allowing these inert particles to act as “physical barriers” in corrosive environments. Al-Ni coatings also demonstrated enhanced resistance to oxidation at high temperatures [20]. The study revealed that the coatings displayed exceptional cyclic-oxidation resistance at 850 °C, even when containing low aluminum content. Additionally, a thin and densely packed oxide film was observed to form on the surfaces of the coatings. Despite the aforementioned studies, additional research is necessary to investigate the mechanical and surface properties, including the porosity, hardness, and bond strength of Al-Ni coatings.
Plasma spraying technology is widely employed in diverse industries, such as the aerospace, steel, oil, marine, and military industries, for the purpose of surface strengthening and protection [21,22,23]. This technique entails the deposition of a coating material onto a substrate by melting it in a heat source and subsequently spraying it onto the surface using a high-velocity air jet [24,25]. The substantial kinetic energy of the particles results in the formation of a compact and durable coating layer [12,26,27]. The swift spraying speed enables the entire process to be completed within microseconds. The process of plasma spray involves various parameters, such as argon flow, working current, arc current, spraying distance, plasma gun traversing speed, powder feed rate, gas flow, gas pressure for powder delivery, etc. [28,29,30]. In industrial applications, the plasma gas used is typically composed of argon, which serves to stabilize the arc within the nozzle. In plasma guns, such as F4, the typical flow rates of argon range between 40 and 50 standard liters per minute (slpm) and may reach up to 80 slpm in certain facilities [31,32]. The spraying distance from the plasma gun to the substrate varies between 16 and 28 mm, with the atmosphere usually being air [33,34]. The plasma gun’s transverse velocity remains constant at a rate of 135–150 cm per minute [35]. The plasma spray process allows for extensive control over the quality of coatings by carefully selecting appropriate spraying parameters. Therefore, it is necessary to use a scientific approach to conduct experiments to identify the key factors that affect plasma spray and determine the optimal process parameters.
In this study, we investigated the impact of altering plasma spray parameters on the production of an Al-Ni metallic coating on a Q235 steel substrate. The correlation between process parameters and coating properties was assessed through an orthogonal experiment. Coating porosity, hardness, and bonding strength were employed as assessment criteria, and a four-factor, four-level orthogonal experimental table was employed to identify the most advantageous parameter combinations using a comprehensive evaluation approach.
2. Materials and Methods
2.1. Experimental Materials
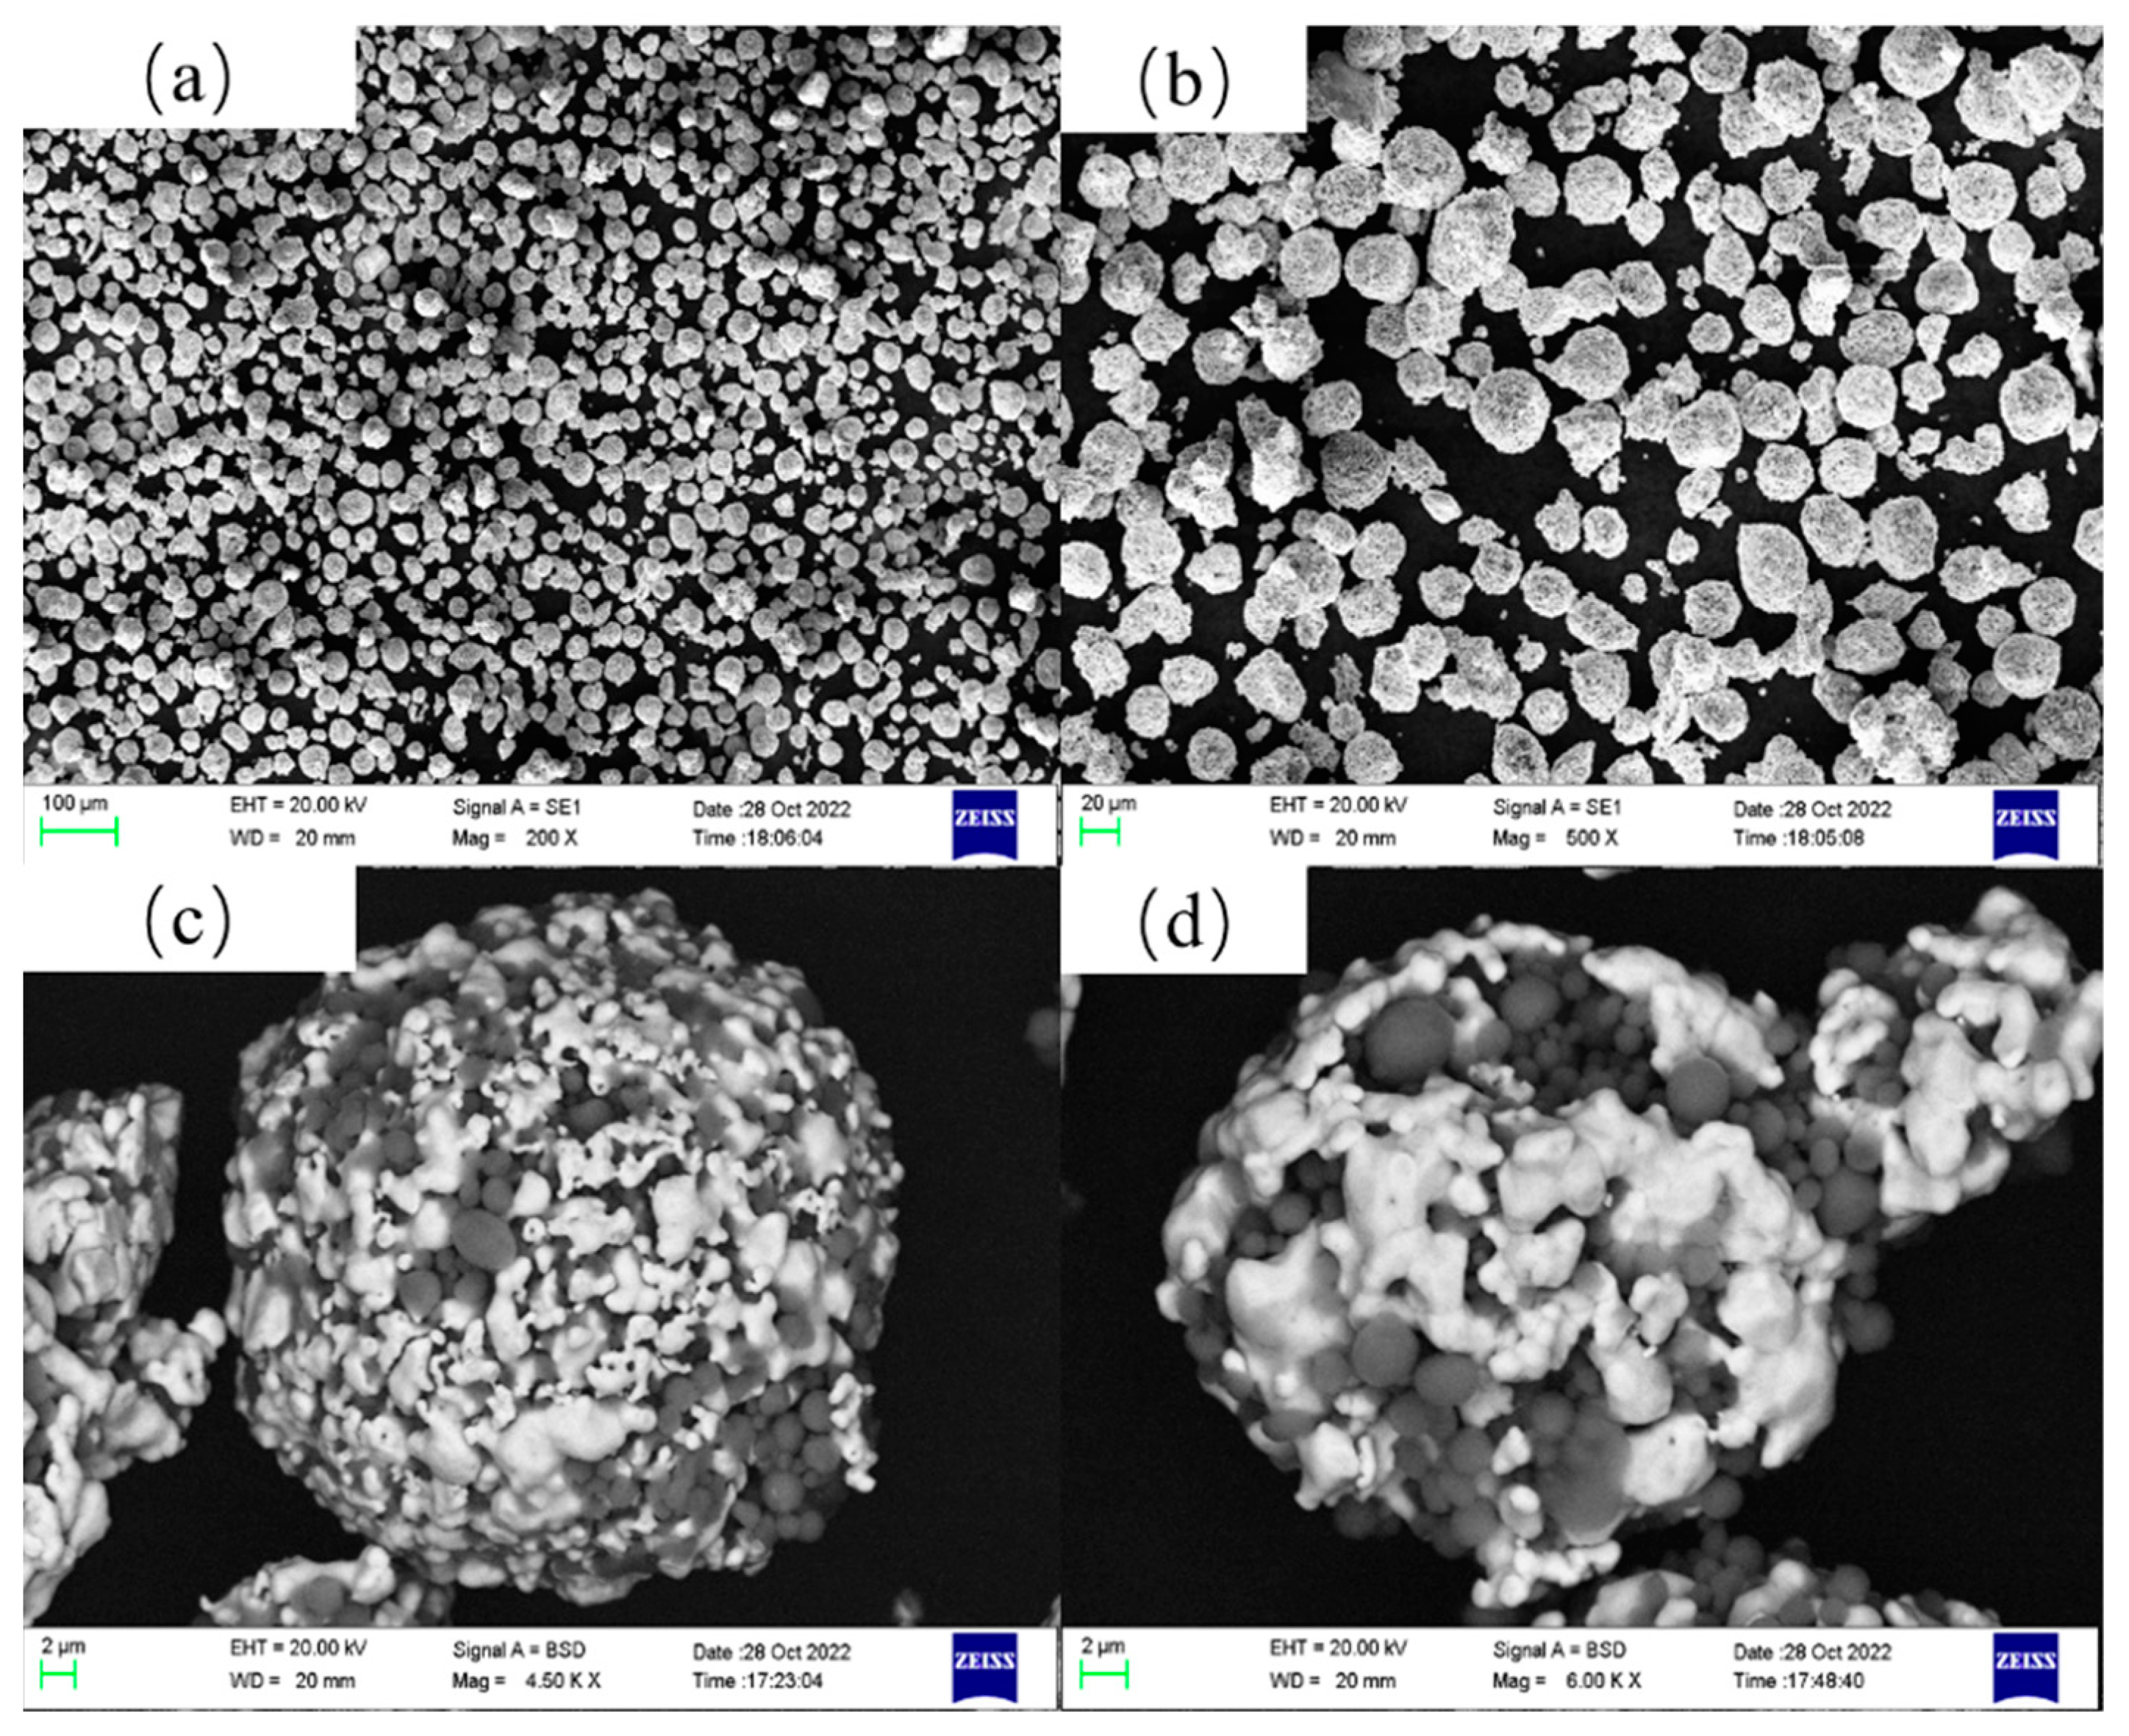
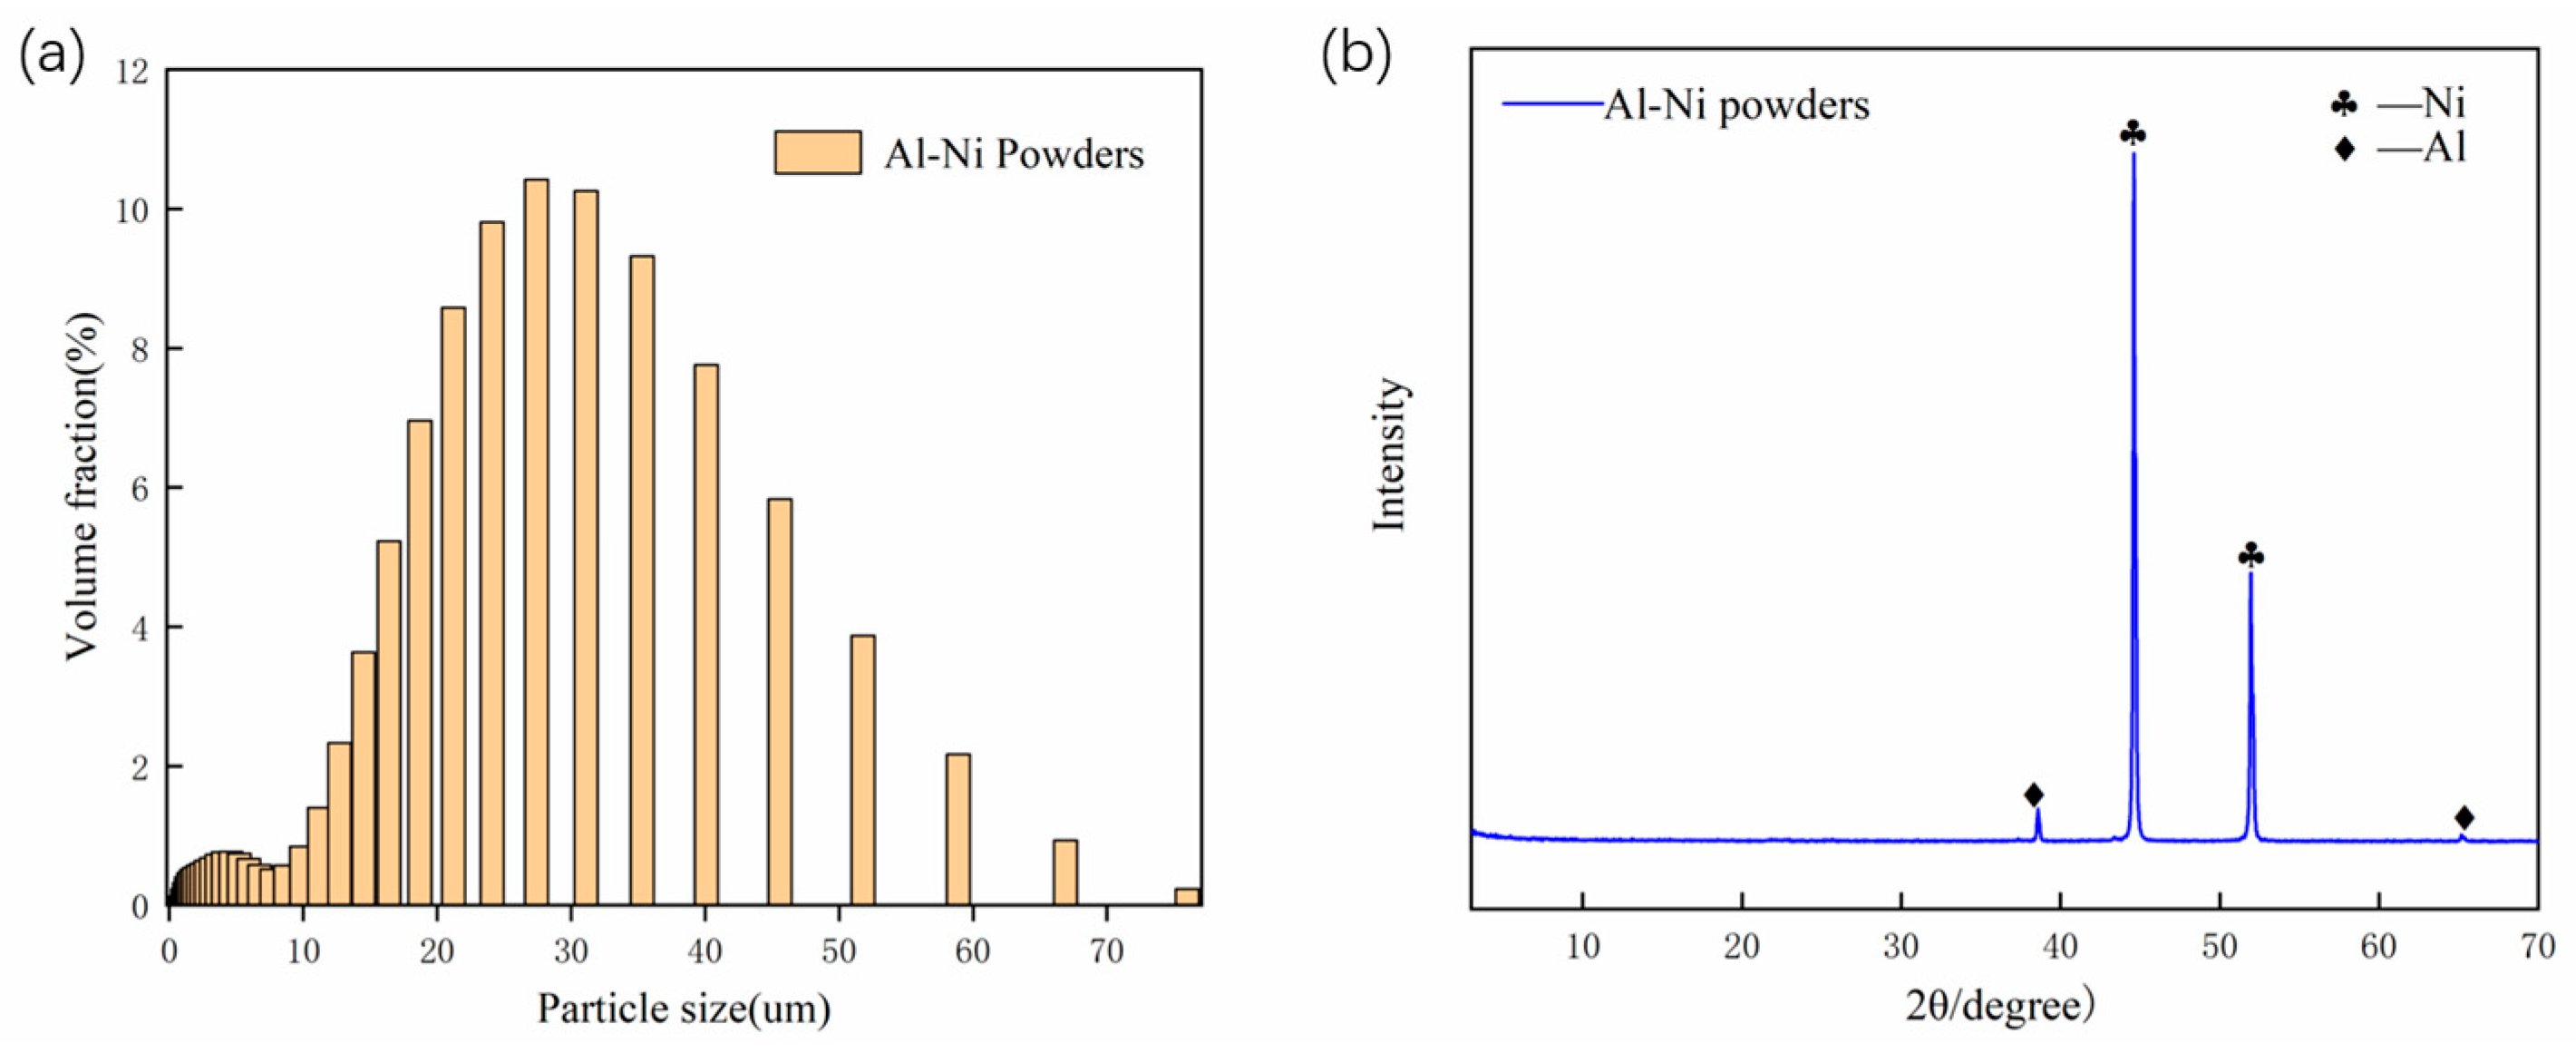
The substrate material used for the plasma spray was Q235 steel, while the powder consisted of Al-Ni composite powder. The surface morphology of the coatings was analyzed via scanning electron microscopy using a ZEISS Sigma FE-SEM, Jena, Germany. The microscopic morphology of the powder with different magnifications is depicted in Figure 1, revealing a uniform spherical shape. The gray particles represent Al, while the white particles represent Ni. The phase composition was determined via X-ray diffraction (XRD) using Bruker D8 equipment (Bruker, Hamburg, Germany) with CuKα (λ = 0.154059 nm) radiation (2θ in the range from 0 to 70°). The XRD spectrum of the powder, as shown in Figure 2b, indicates the presence of primarily Al and Ni phases. The particle size distribution of the powder is illustrated in Figure 2a, displaying two aggregation peaks. Specifically, there is an aggregation peak between 0–10 μm, which corresponds to the outer layer of larger particles with smaller-sized particles attached.
2.2. Experimental Methods
Before the procedure, it was necessary to carry out pre-treatment on both the substrate material and the powder. This involved chamfering the four edges of the original Q235 steel substrate by 0.5 mm to prevent the coating from detaching as a result of stress concentration after spraying. The substrate then needed to be immersed in an ultrasonic cleaner containing alcohol to ensure thorough cleaning and the elimination of any surface dust, grease, and other impurities. After the cleaning process, the substrate was dried using a drying machine. Subsequently, the substrate was placed in a sandblasting box for sandblasting. The sandblasting pressure was adjusted to 0.8 MPa, and quartz sand with a particle size ranging from 0.5 to 0.8 mm was utilized. The sandblasting procedure was utilized to increase the texture of the substrate surface, thereby enhancing the adhesion of particles during impact and activating the surface of the material being sandblasted. These benefits ultimately strengthened the coating’s bonding strength by reversing the direction of cooling stress brought on by particle impact.
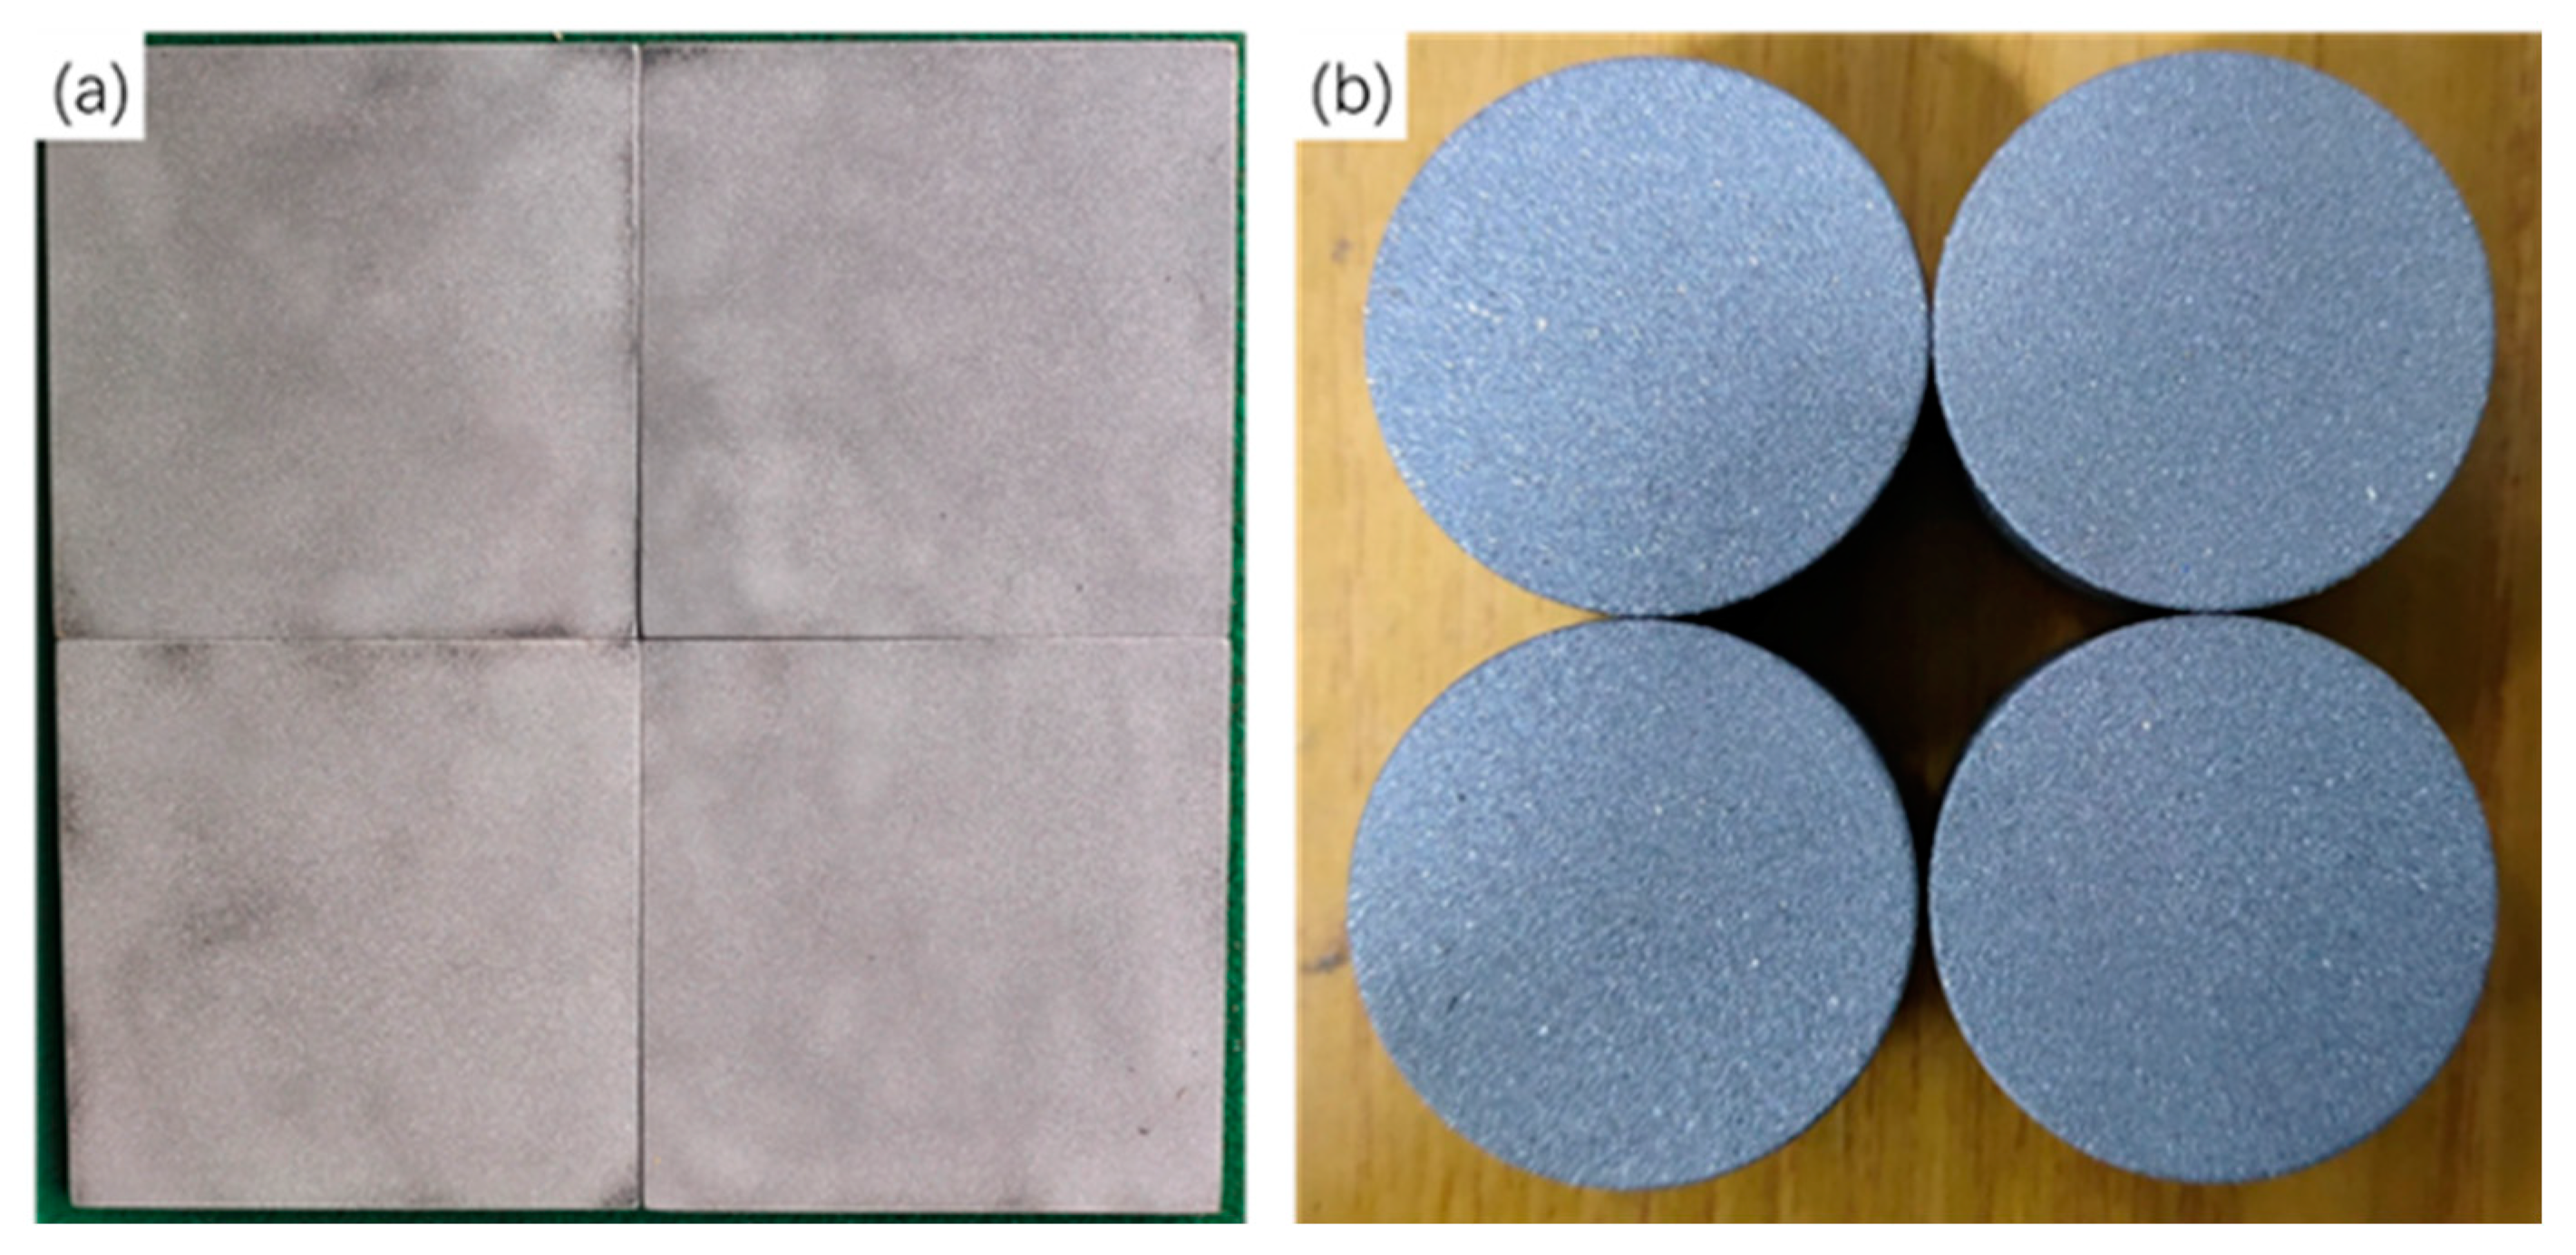
The specimens were of two different shapes and sizes, as shown in Figure 3: 1. square samples measuring 100 mm × 100 mm × 5 mm; 2. cylindrical samples with a diameter of 25.4 mm and a height of 10 mm. The specimens were embedded using a cold inlay technique, where epoxy resin and a curing agent were mixed in a 2:1 ratio and stirred for 3 min. The mixture was then poured into molds with a diameter of 30 mm, which already contained the experimental samples. After curing for over 6 h, the inlaid samples were removed from the molds and subjected to grinding and polishing. The grinding and polishing process aimed to achieve a smooth and flat surface without any noticeable scratches, resulting in a mirror-like effect. To prevent the oxidation of the Q235 steel surface after polishing, the samples were promptly immersed in alcohol for ultrasonic cleaning and subsequently dried.
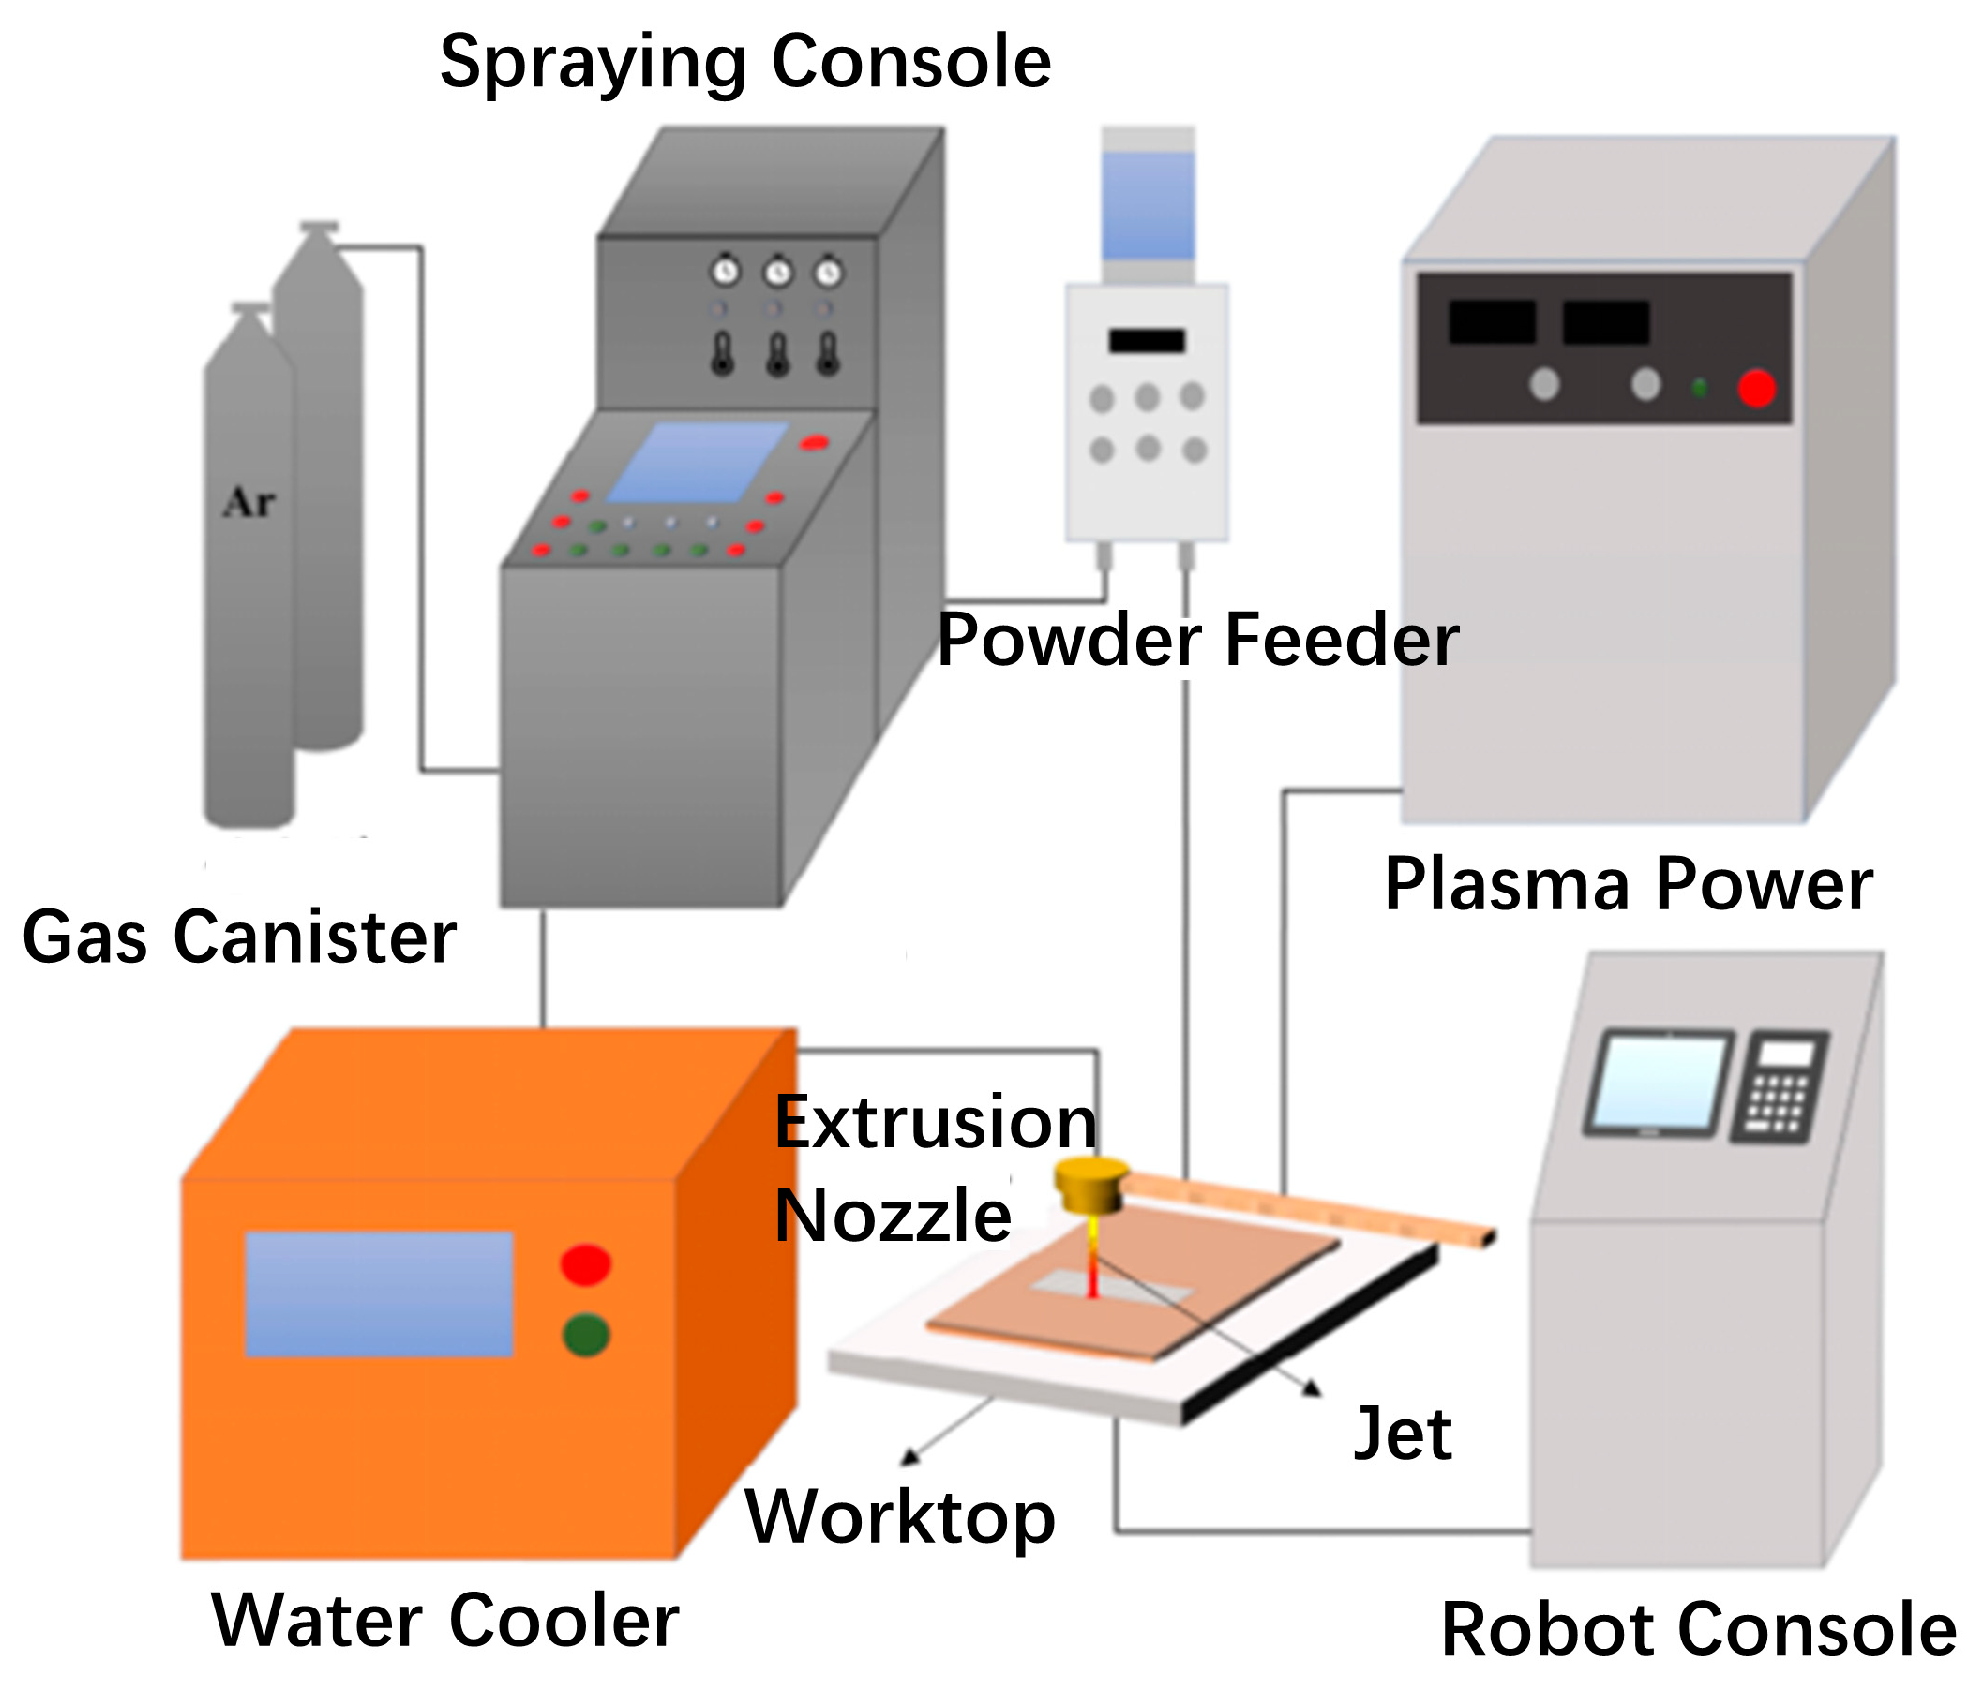
The relevant equipment of plasma spraying is shown in Figure 4. Through a series of experimental investigations conducted in the preceding period, it was determined that the plasma of Al-Ni coatings was primarily influenced by four process parameters: arc current (A), working current (A), spraying distance (mm), and plasma gun traversing speed (cm/min). The arc current is responsible for the formation of a non-transfer arc, which primarily governs the heating of the particles. The working current, on the other hand, is the current that occurs after the transfer arc is generated and primarily determines the heating of the substrate. The spraying distance refers to the linear distance from the front surface of the nozzle to the substrate surface, which affects both the heating time of the particles during their flight and the heating of the substrate. Lastly, the plasma gun traversing speed denotes the velocity at which the robotic arm carrying the plasma gun moves, and it primarily impacts the heating of the substrate. Consequently, this study primarily focuses on examining the influence of these four factors on the evaluation of coating properties, specifically porosity, hardness, and bonding strength. The factors and levels of the orthogonal experimental table are shown in Table 1.
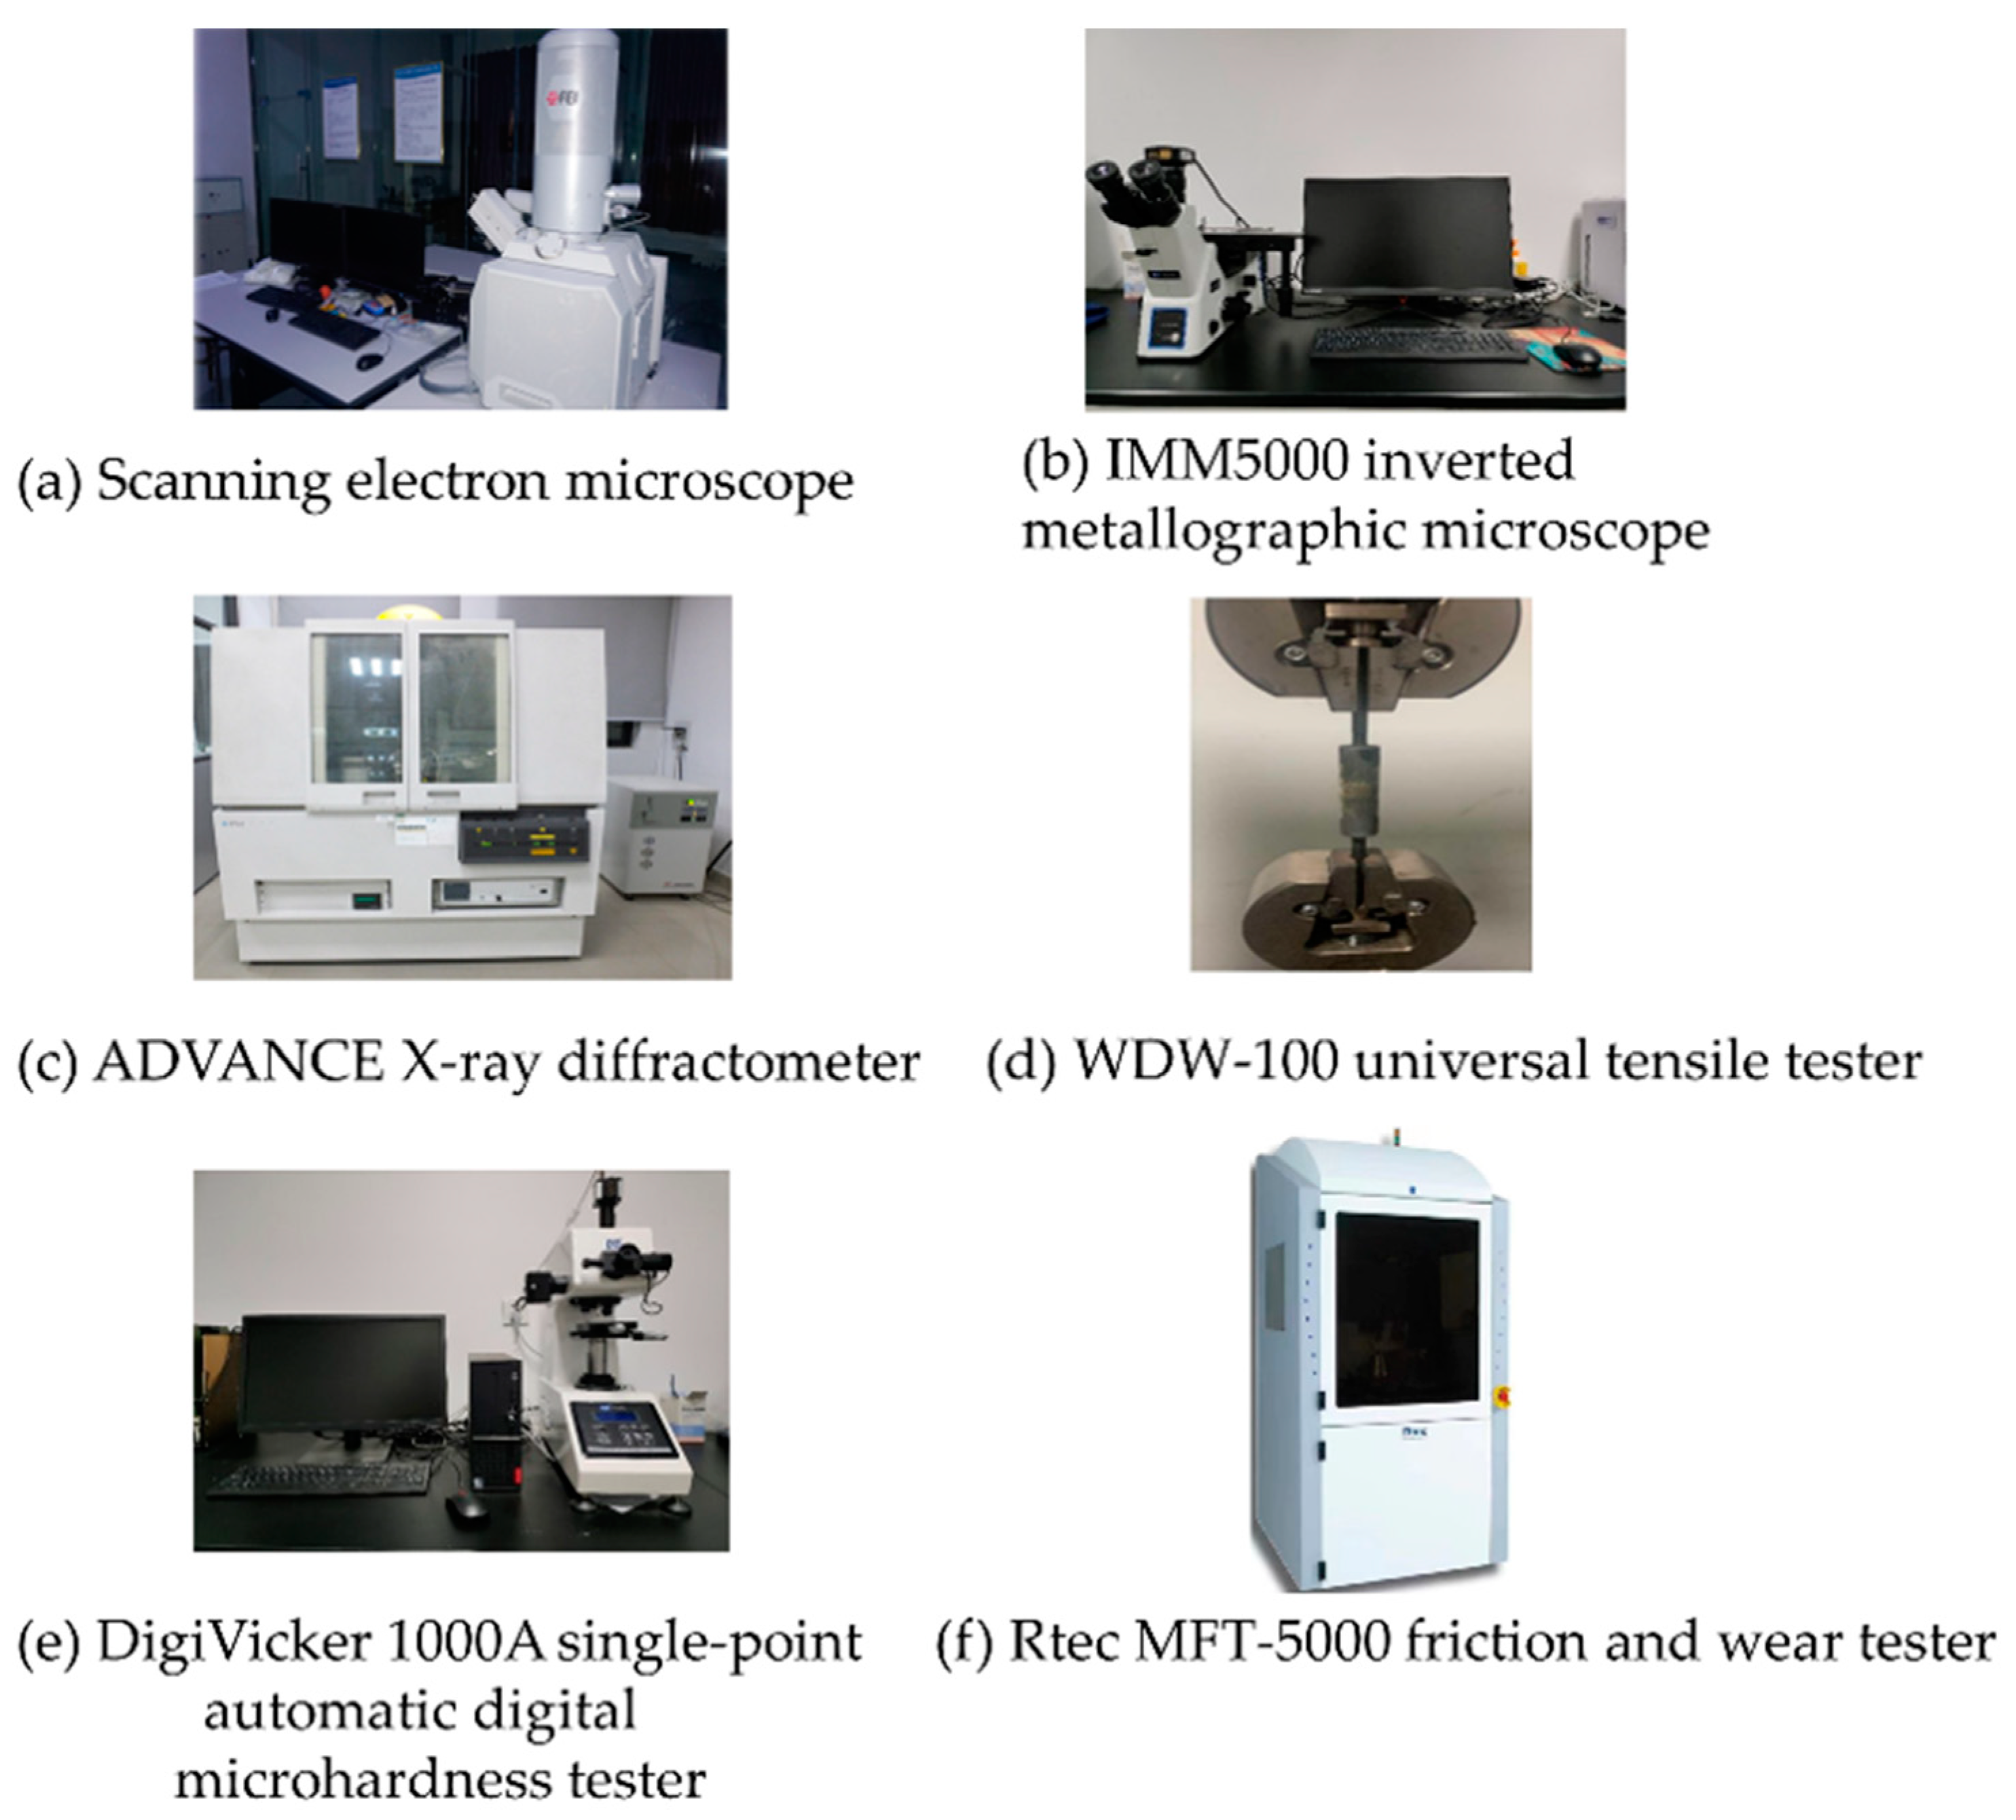
The square specimens were subjected to a wire-cutting process using an Electrical Discharge Machining (EDM), TIDE MACHINERY Co., Huzhou, China machine to obtain tensile specimens with a diameter of 25.4 mm. The resulting longitudinal microstructures of the specimens were examined using a FEI NoVa nano SEM 450, FEI, Hillsboro, OR, USA (as shown in Figure 5a). The plasma jet coating was analyzed through metallographic observation using an IMM5000, TIDE MACHINERY Co., Huzhou, China inverted metallographic microscope (as shown in Figure 5b). The coatings were further evaluated using an ADVANCE X-ray diffractometer, Bruker, Hamburg, Germany (as shown in Figure 5c) with a Cu target and Kα rays. The scanning parameters included a speed of 4°/min, a range of 10–90°, and a step size of 0.02°. This analysis aimed to determine the physical phase associated with each peak observed. The tensile bond strength of the thermal spray coating was assessed using a WDW-100 universal tensile tester, TIDE MACHINERY Co., Huzhou, China (as shown in Figure 5d). The primary reference standard for conducting the determination of tensile bond strength in thermal spray coatings was GB/T 8642-2002. This standard is applicable for measuring the cohesive strength of coatings or the interfacial tensile strength between the coating and the substrate. Additionally, the variation in the coating across the cross-section depth was examined using a DigiVicker 1000A, TIDE MACHINERY Co., Huzhou, China single-point automatic digital microhardness tester (as shown in Figure 5e). Finally, the friction and wear properties of the specimens were investigated using an Rtec MFT-5000, TIDE MACHINERY Co., Huzhou, China friction and wear tester (as shown in Figure 5f).
3. Results and Discussion
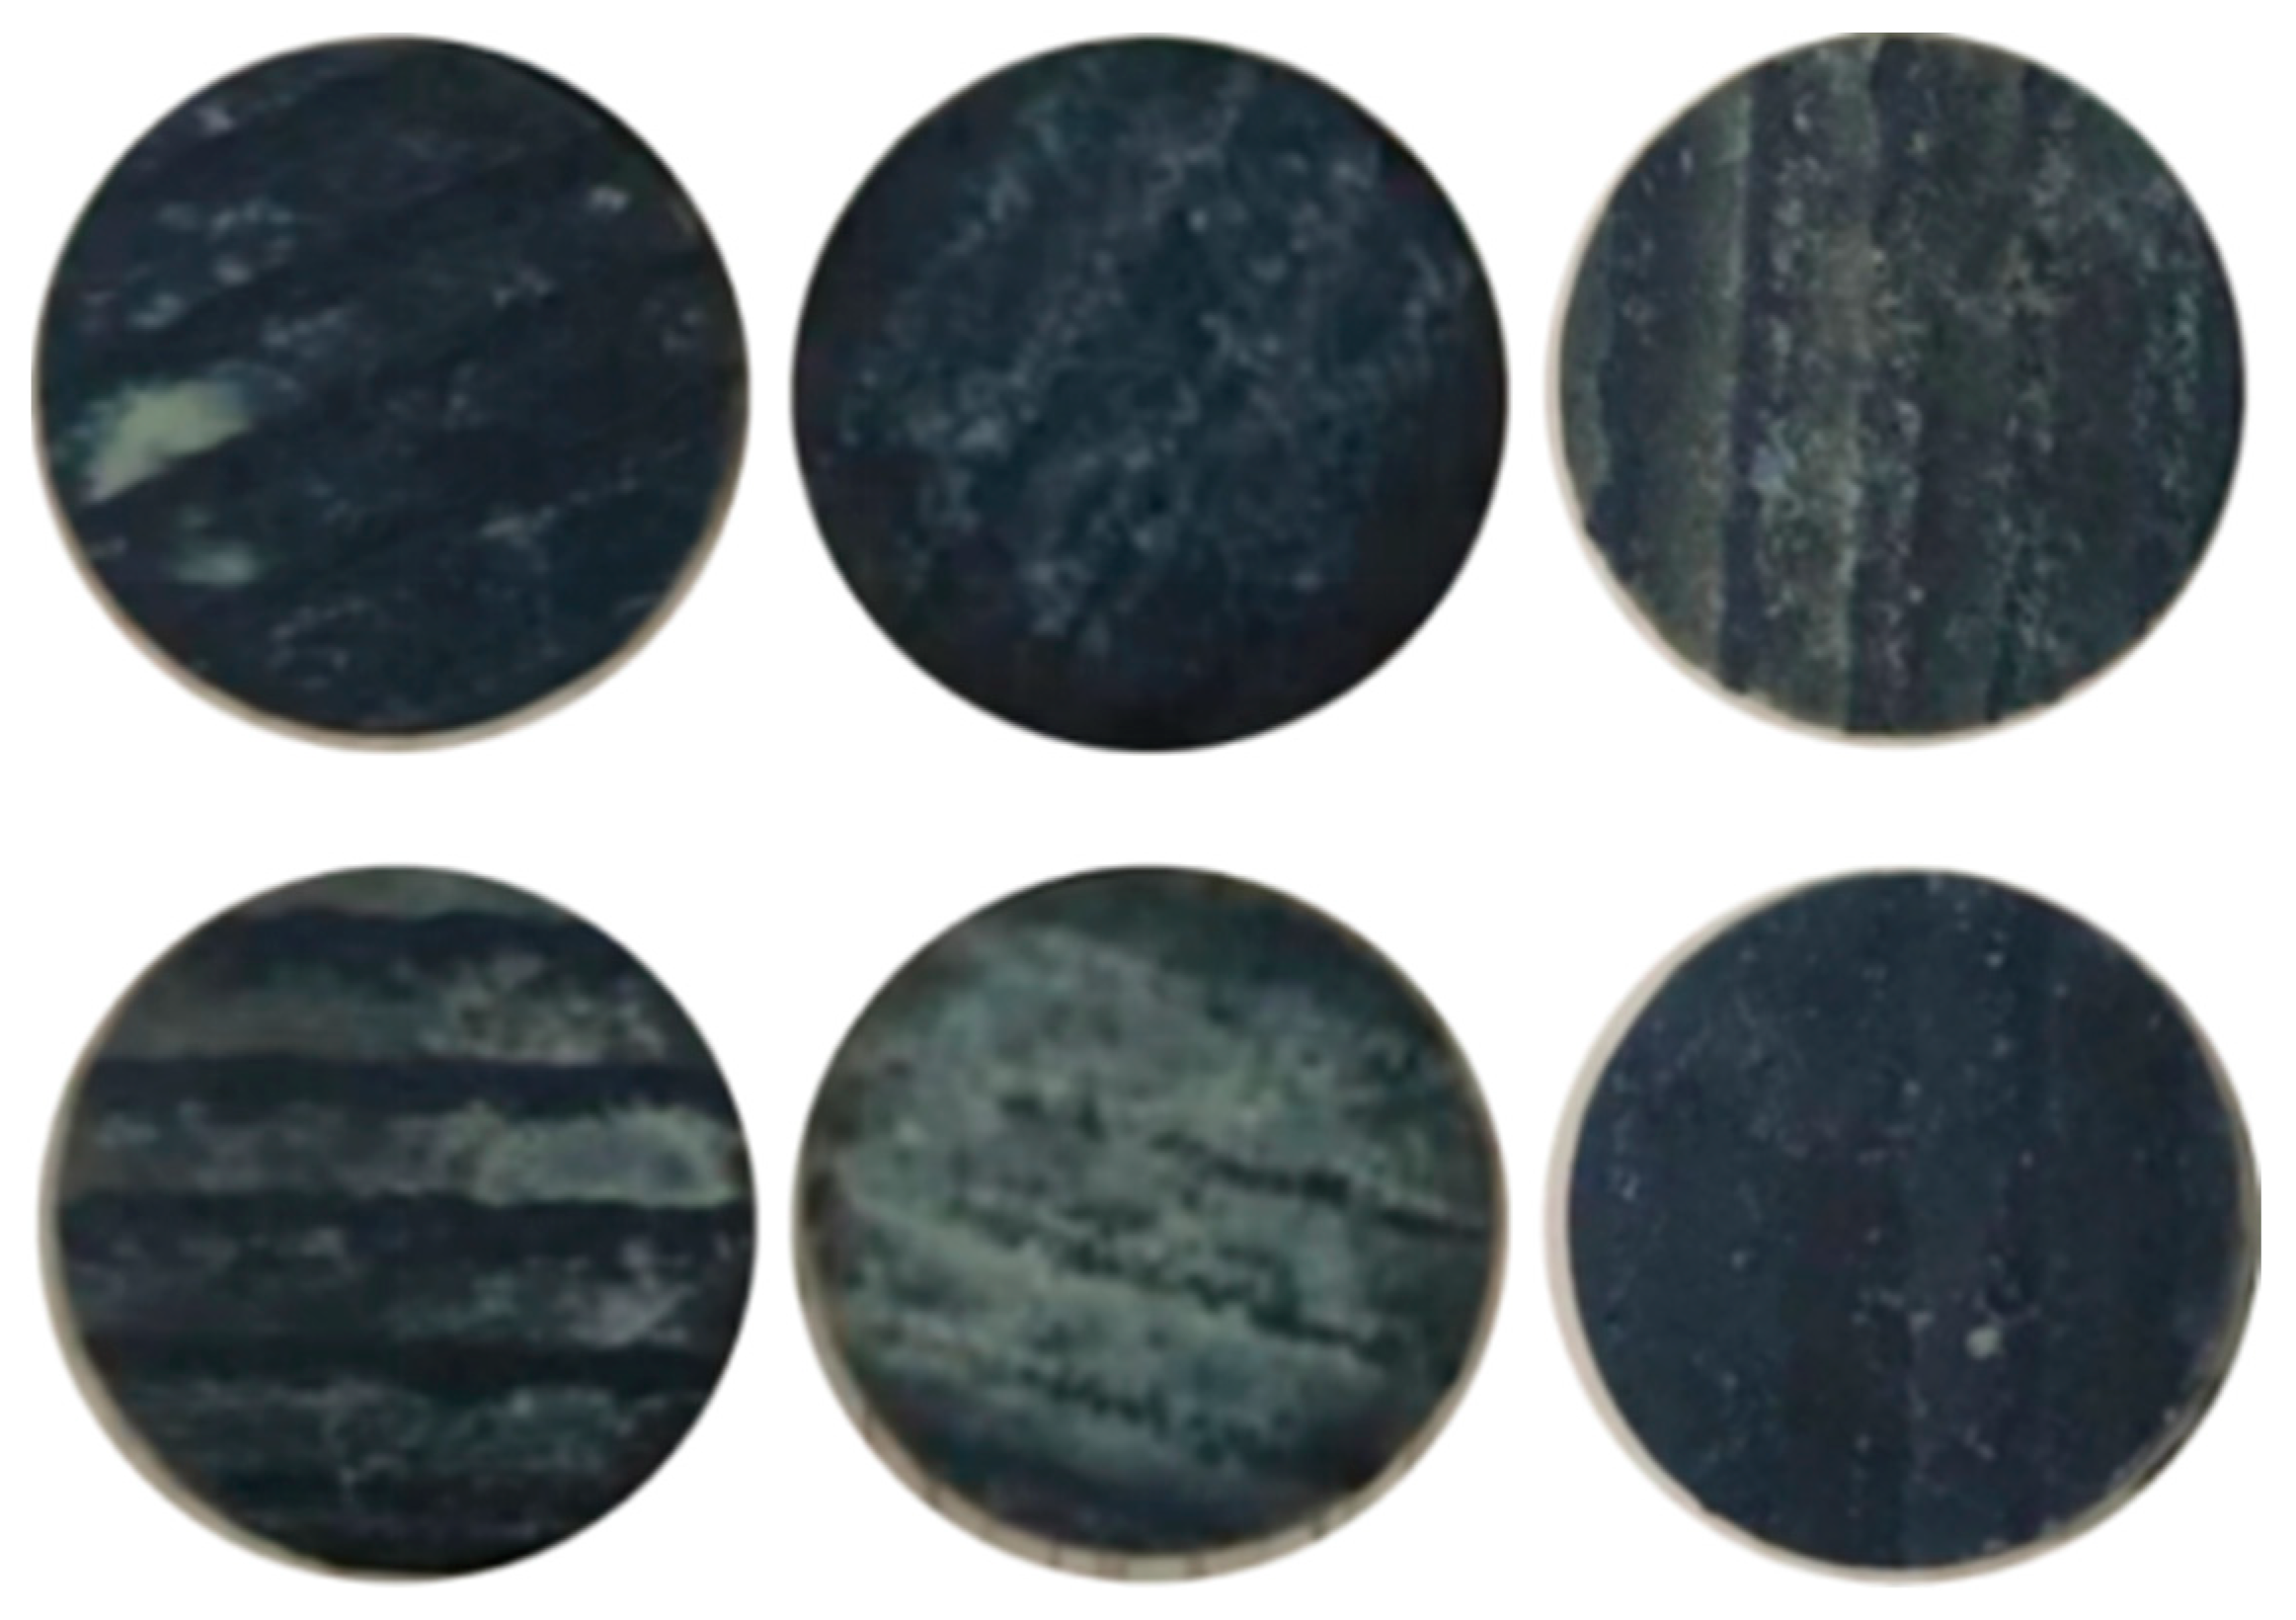
The experimental results were analyzed using range analysis to determine the porosity, hardness, and bonding strength of the plasma spray Al-Ni coatings. The impact of four factors on these three indicators was systematically examined to identify the optimal process parameters for the coatings. A macroscopic morphology image of the surface of the Al-Ni coating and a microscopic morphology image of a cross-section of the Al-Ni coating are shown in Figure 6 and Figure 7, respectively.
3.1. Effect of Process Parameters on Coating Porosity
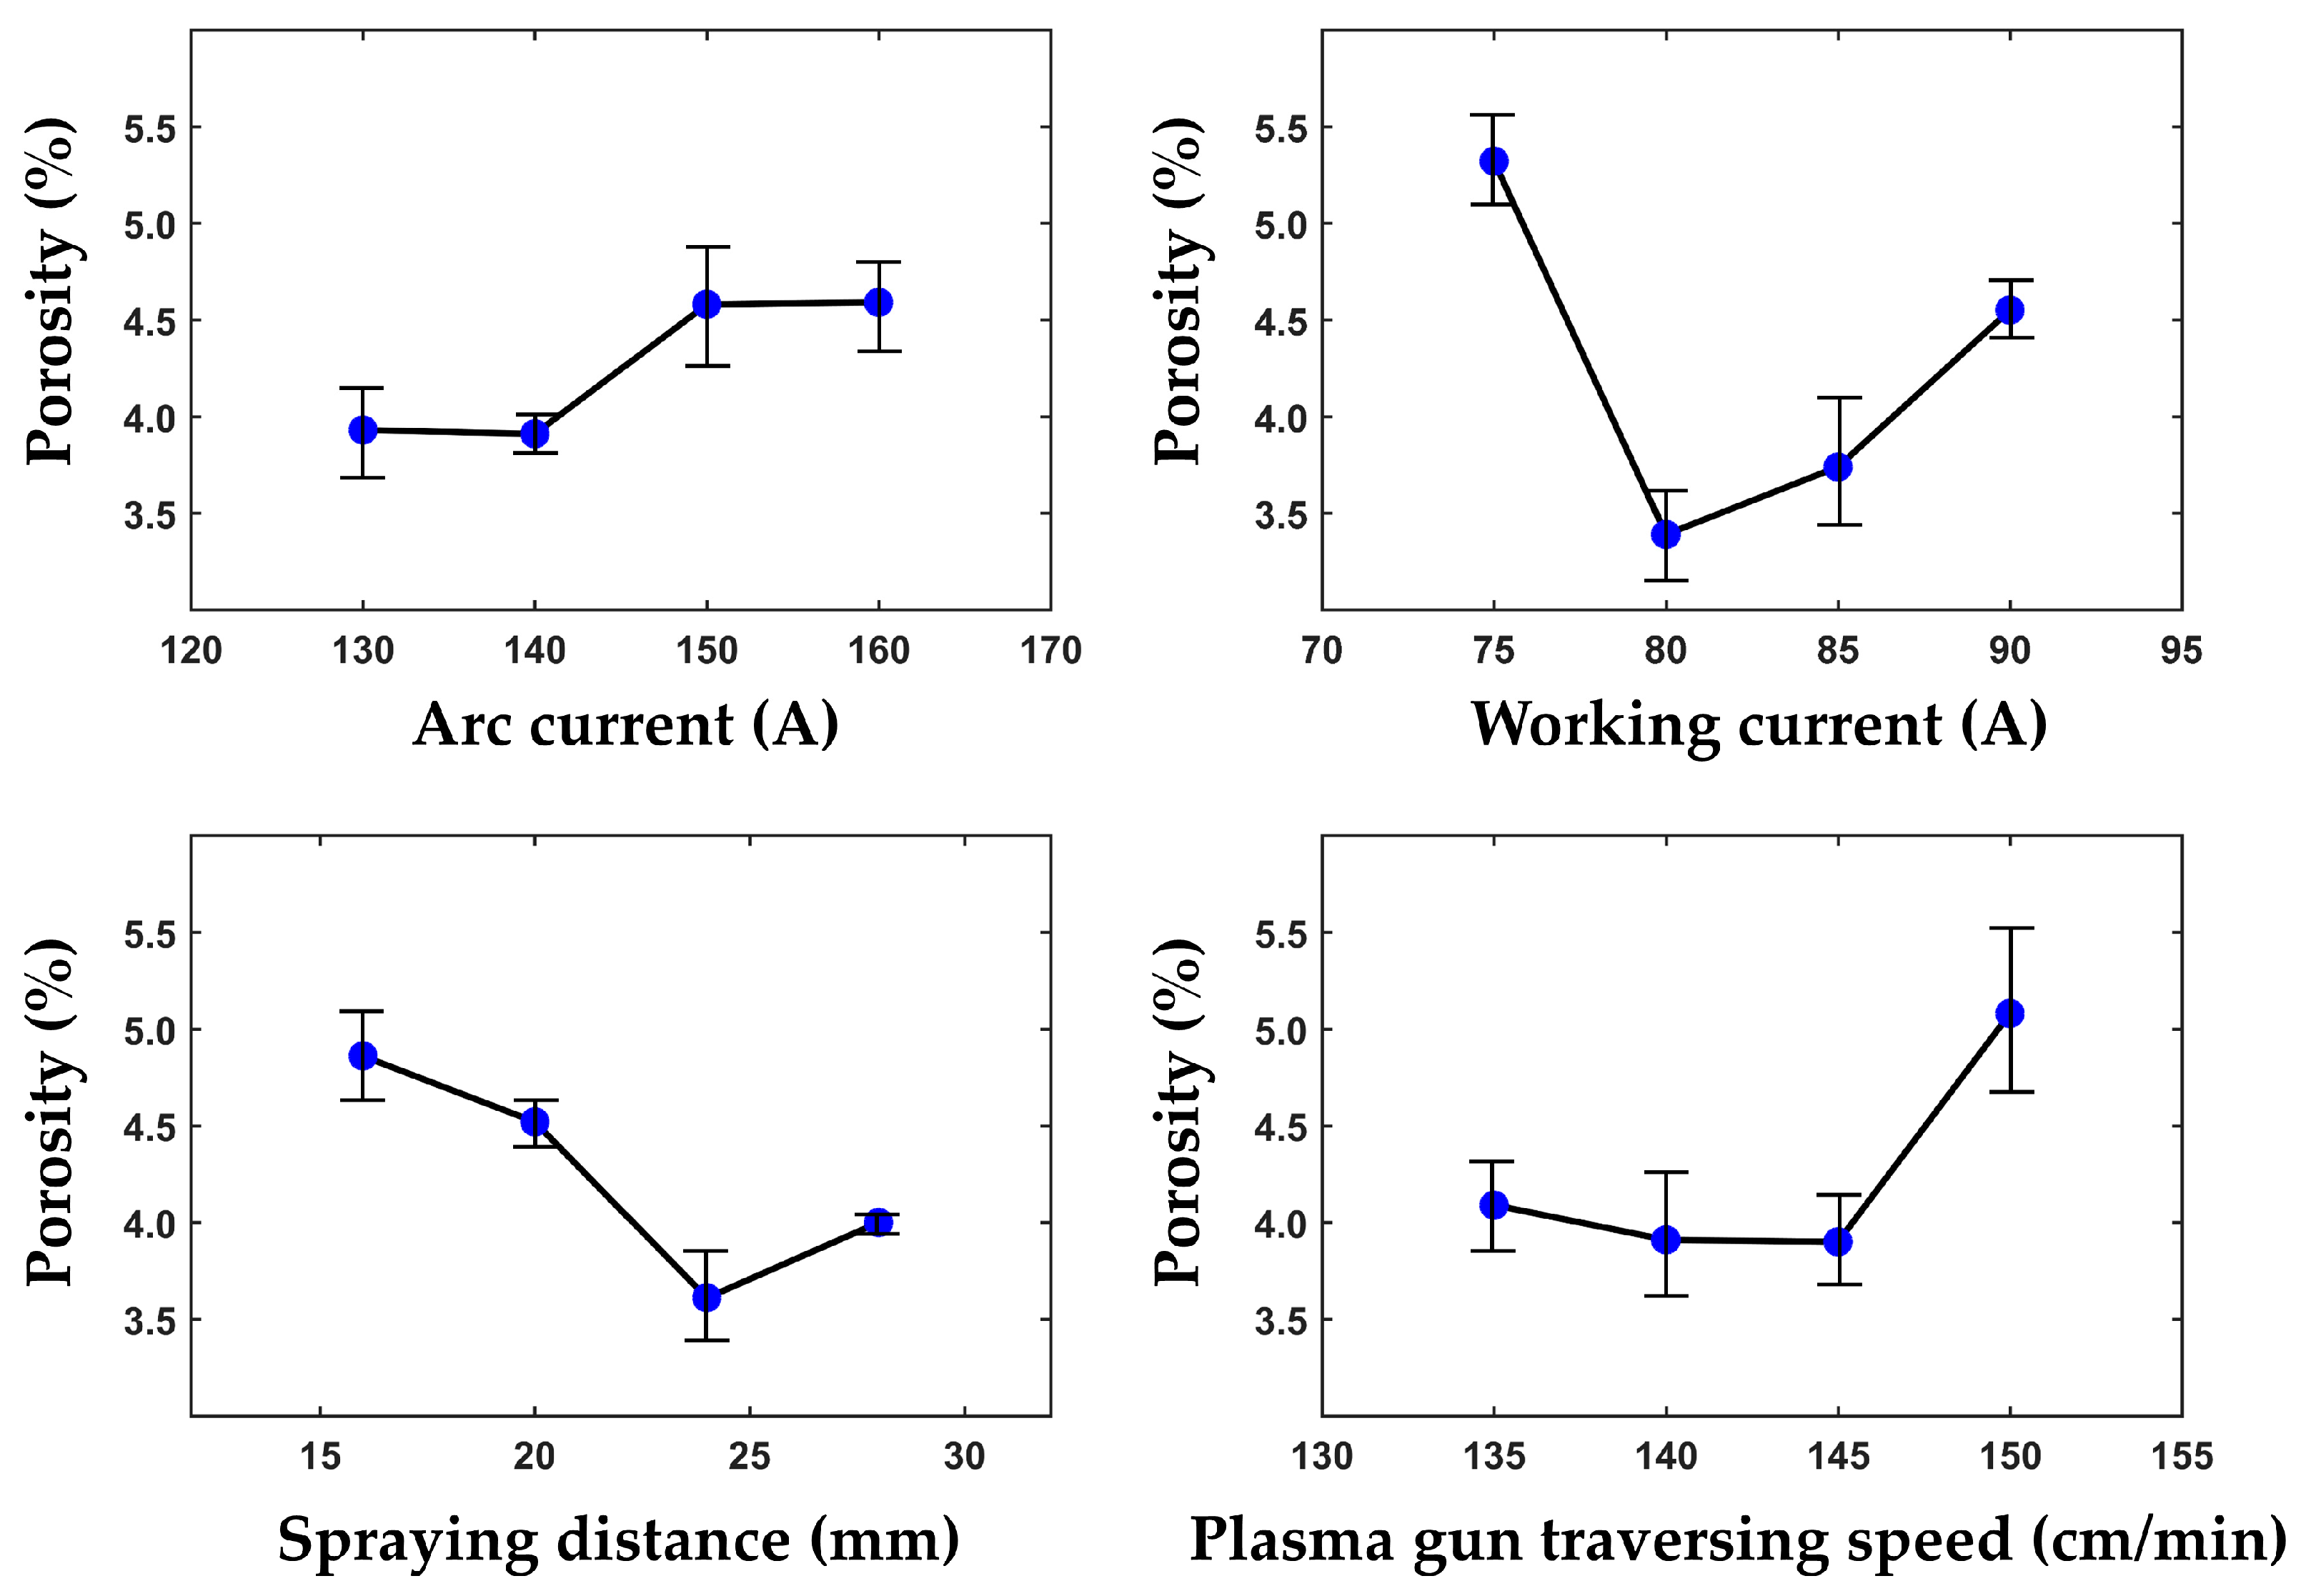
The coating porosity of 16 specimens and the results of the range analysis of the coating porosity are presented in Table 2 and Table 3, respectively. Additionally, the relationship between each factor and porosity is visually depicted in Figure 8. The method for testing coating porosity involved analyzing metallographic images captured by a metallographic microscope and utilizing the gray-scale image method to quantify the porosity of the coating. To minimize potential errors, five metallographic photos of each group of coatings were taken at the same magnification for the purpose of calculating the average porosity.
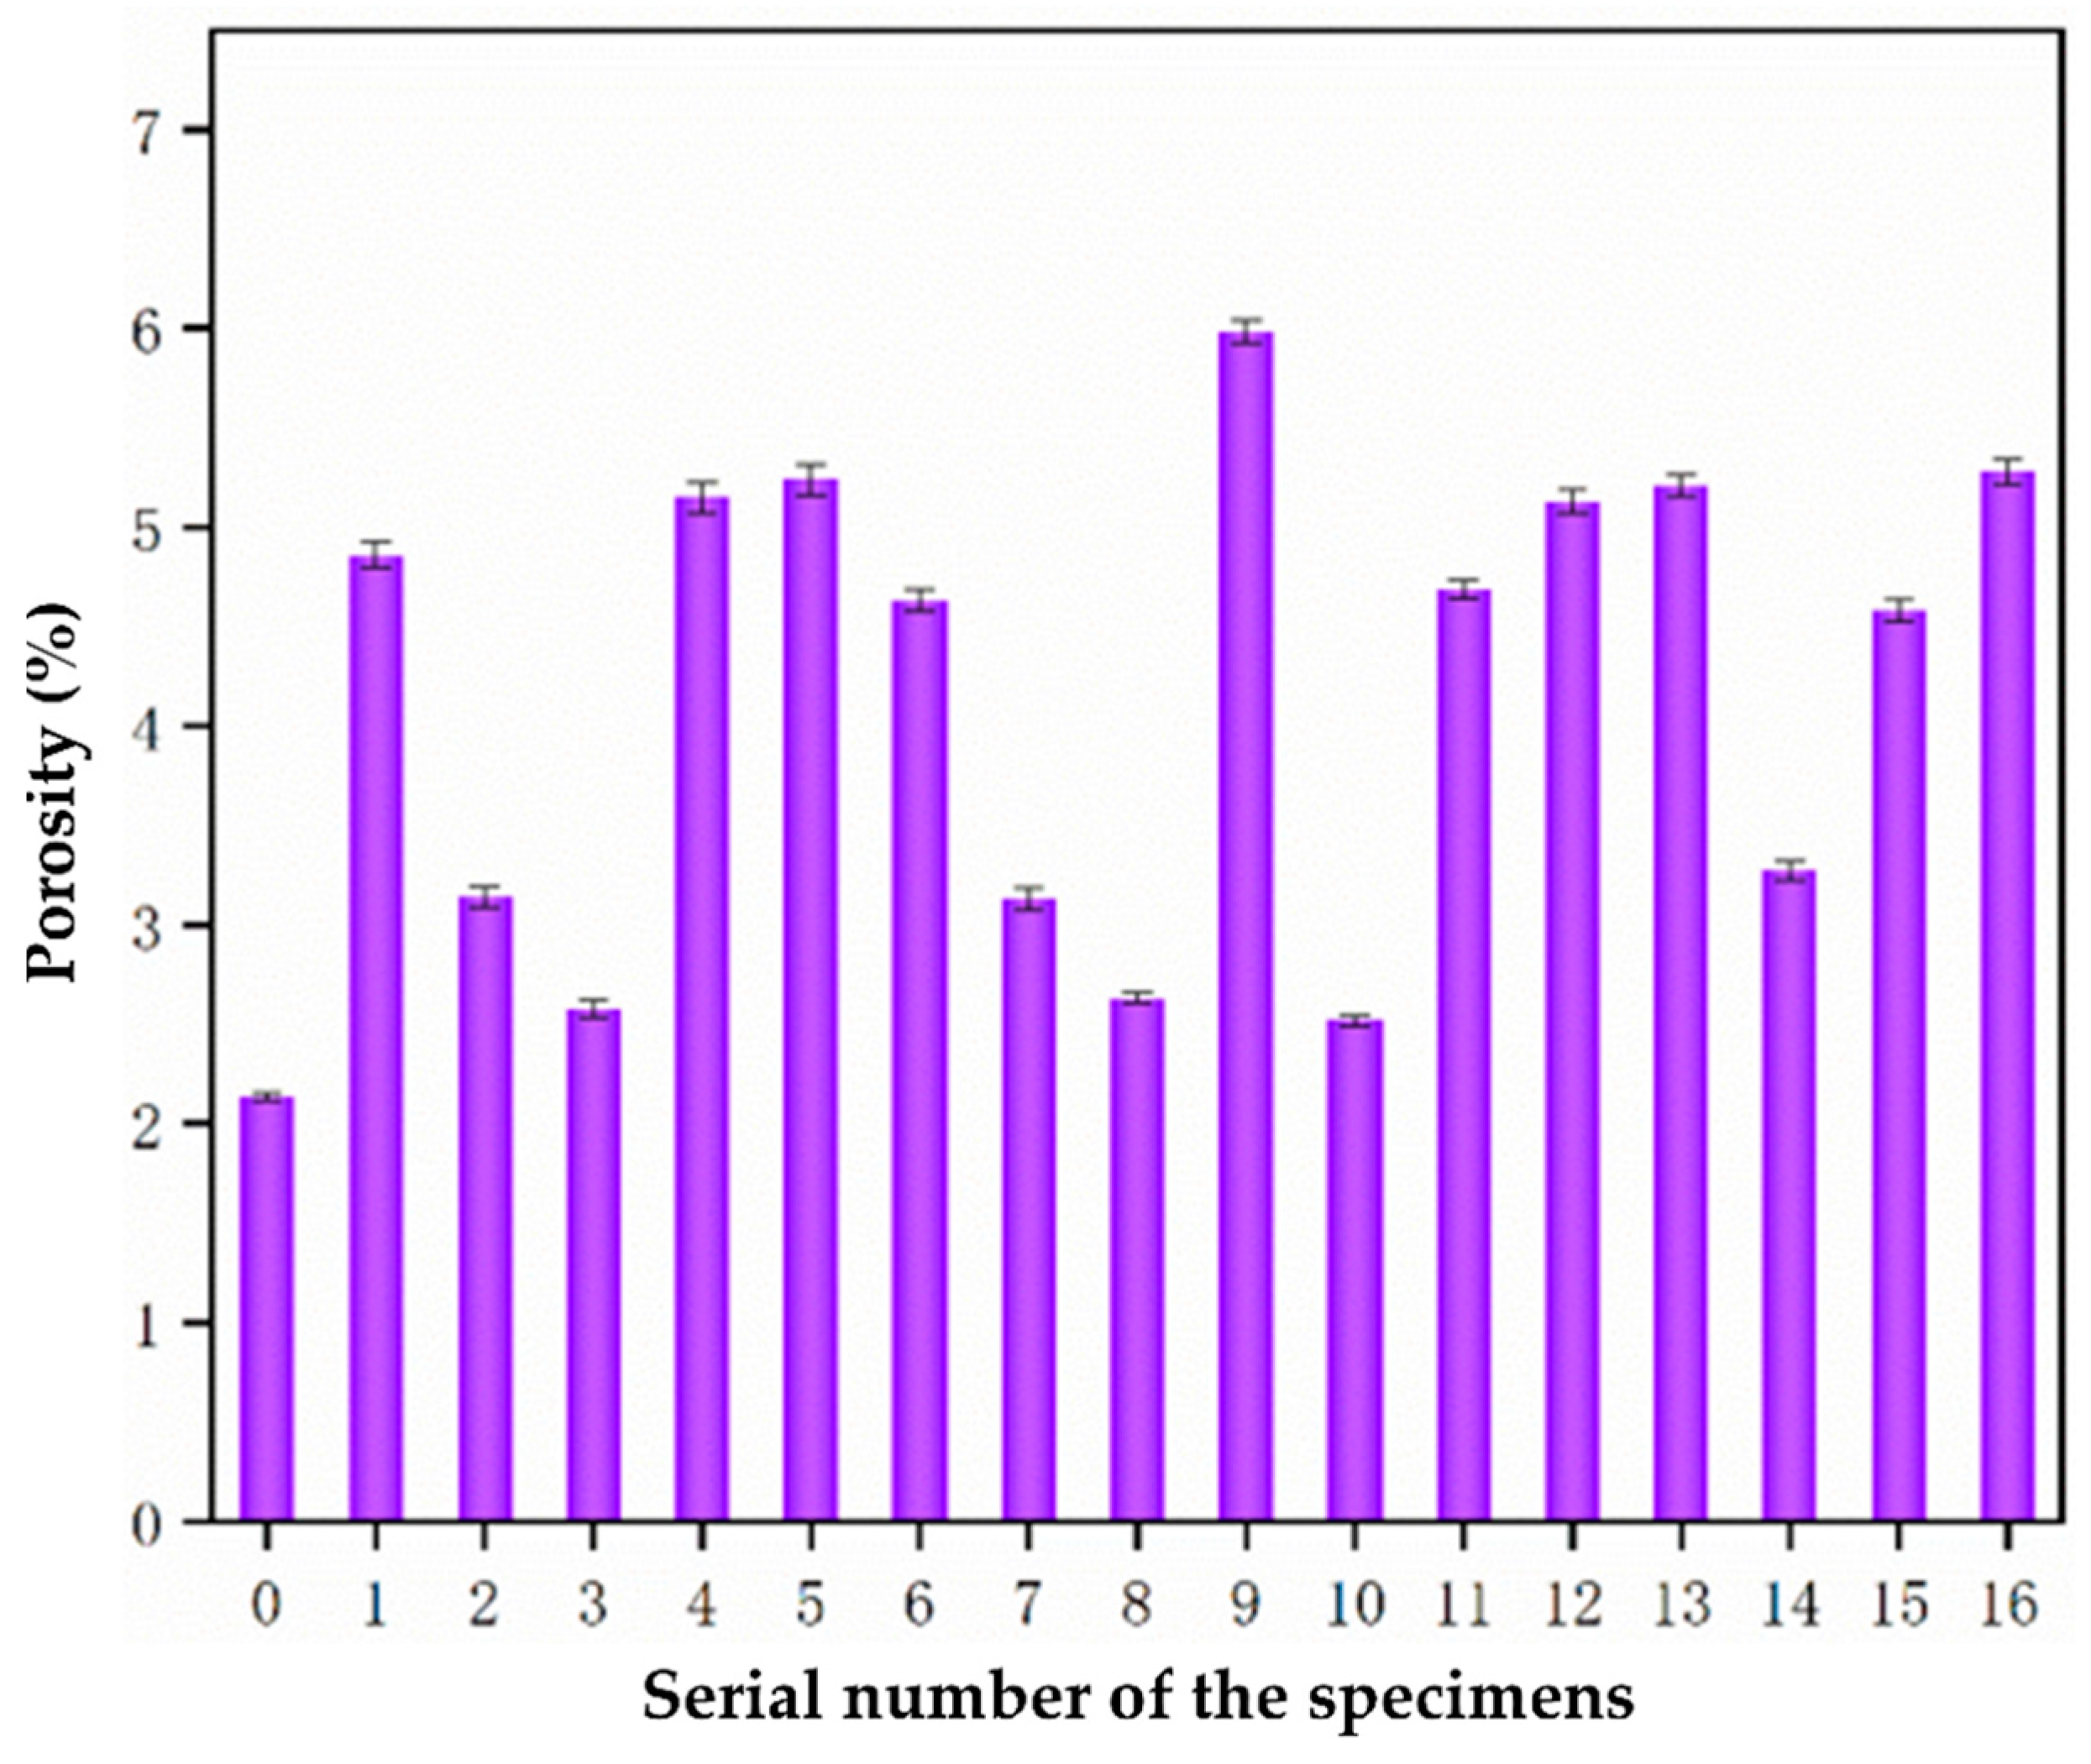
All the samples had a normal porosity range [36], and, although sample 9 had the maximum porosity percentage (5.98%), it was still within the normal range from 40 to <1% [37]. The K1, K2, K3, and K4 values in Table 3 represent the mean values of coating porosity in four levels (Table 1) and correspond, respectively, to the four factors according to Table 2. The porosity exhibited a slight decrease as the arc current was raised from 130 A to 140 A. However, a more pronounced increase in porosity was observed when the arc current was further increased from 140 A to 150 A. The working current was found to have a substantial impact on porosity, as its increase led to a significant initial decrease in porosity. Additionally, the spraying distance was also found to exert a more pronounced influence on porosity.
According to Figure 8, it is evident that the porosity diminished as the plasma gun’s traversing speed increased. When the gun’s traversing speed was low, there was a higher number of particles impacting the substrate simultaneously, resulting in an augmented coating thickness. Consequently, the increased thickness of a single pass contributed to the formation of additional pores and cracks within the coating.
3.2. Effect of Process Parameters on Coating Hardness
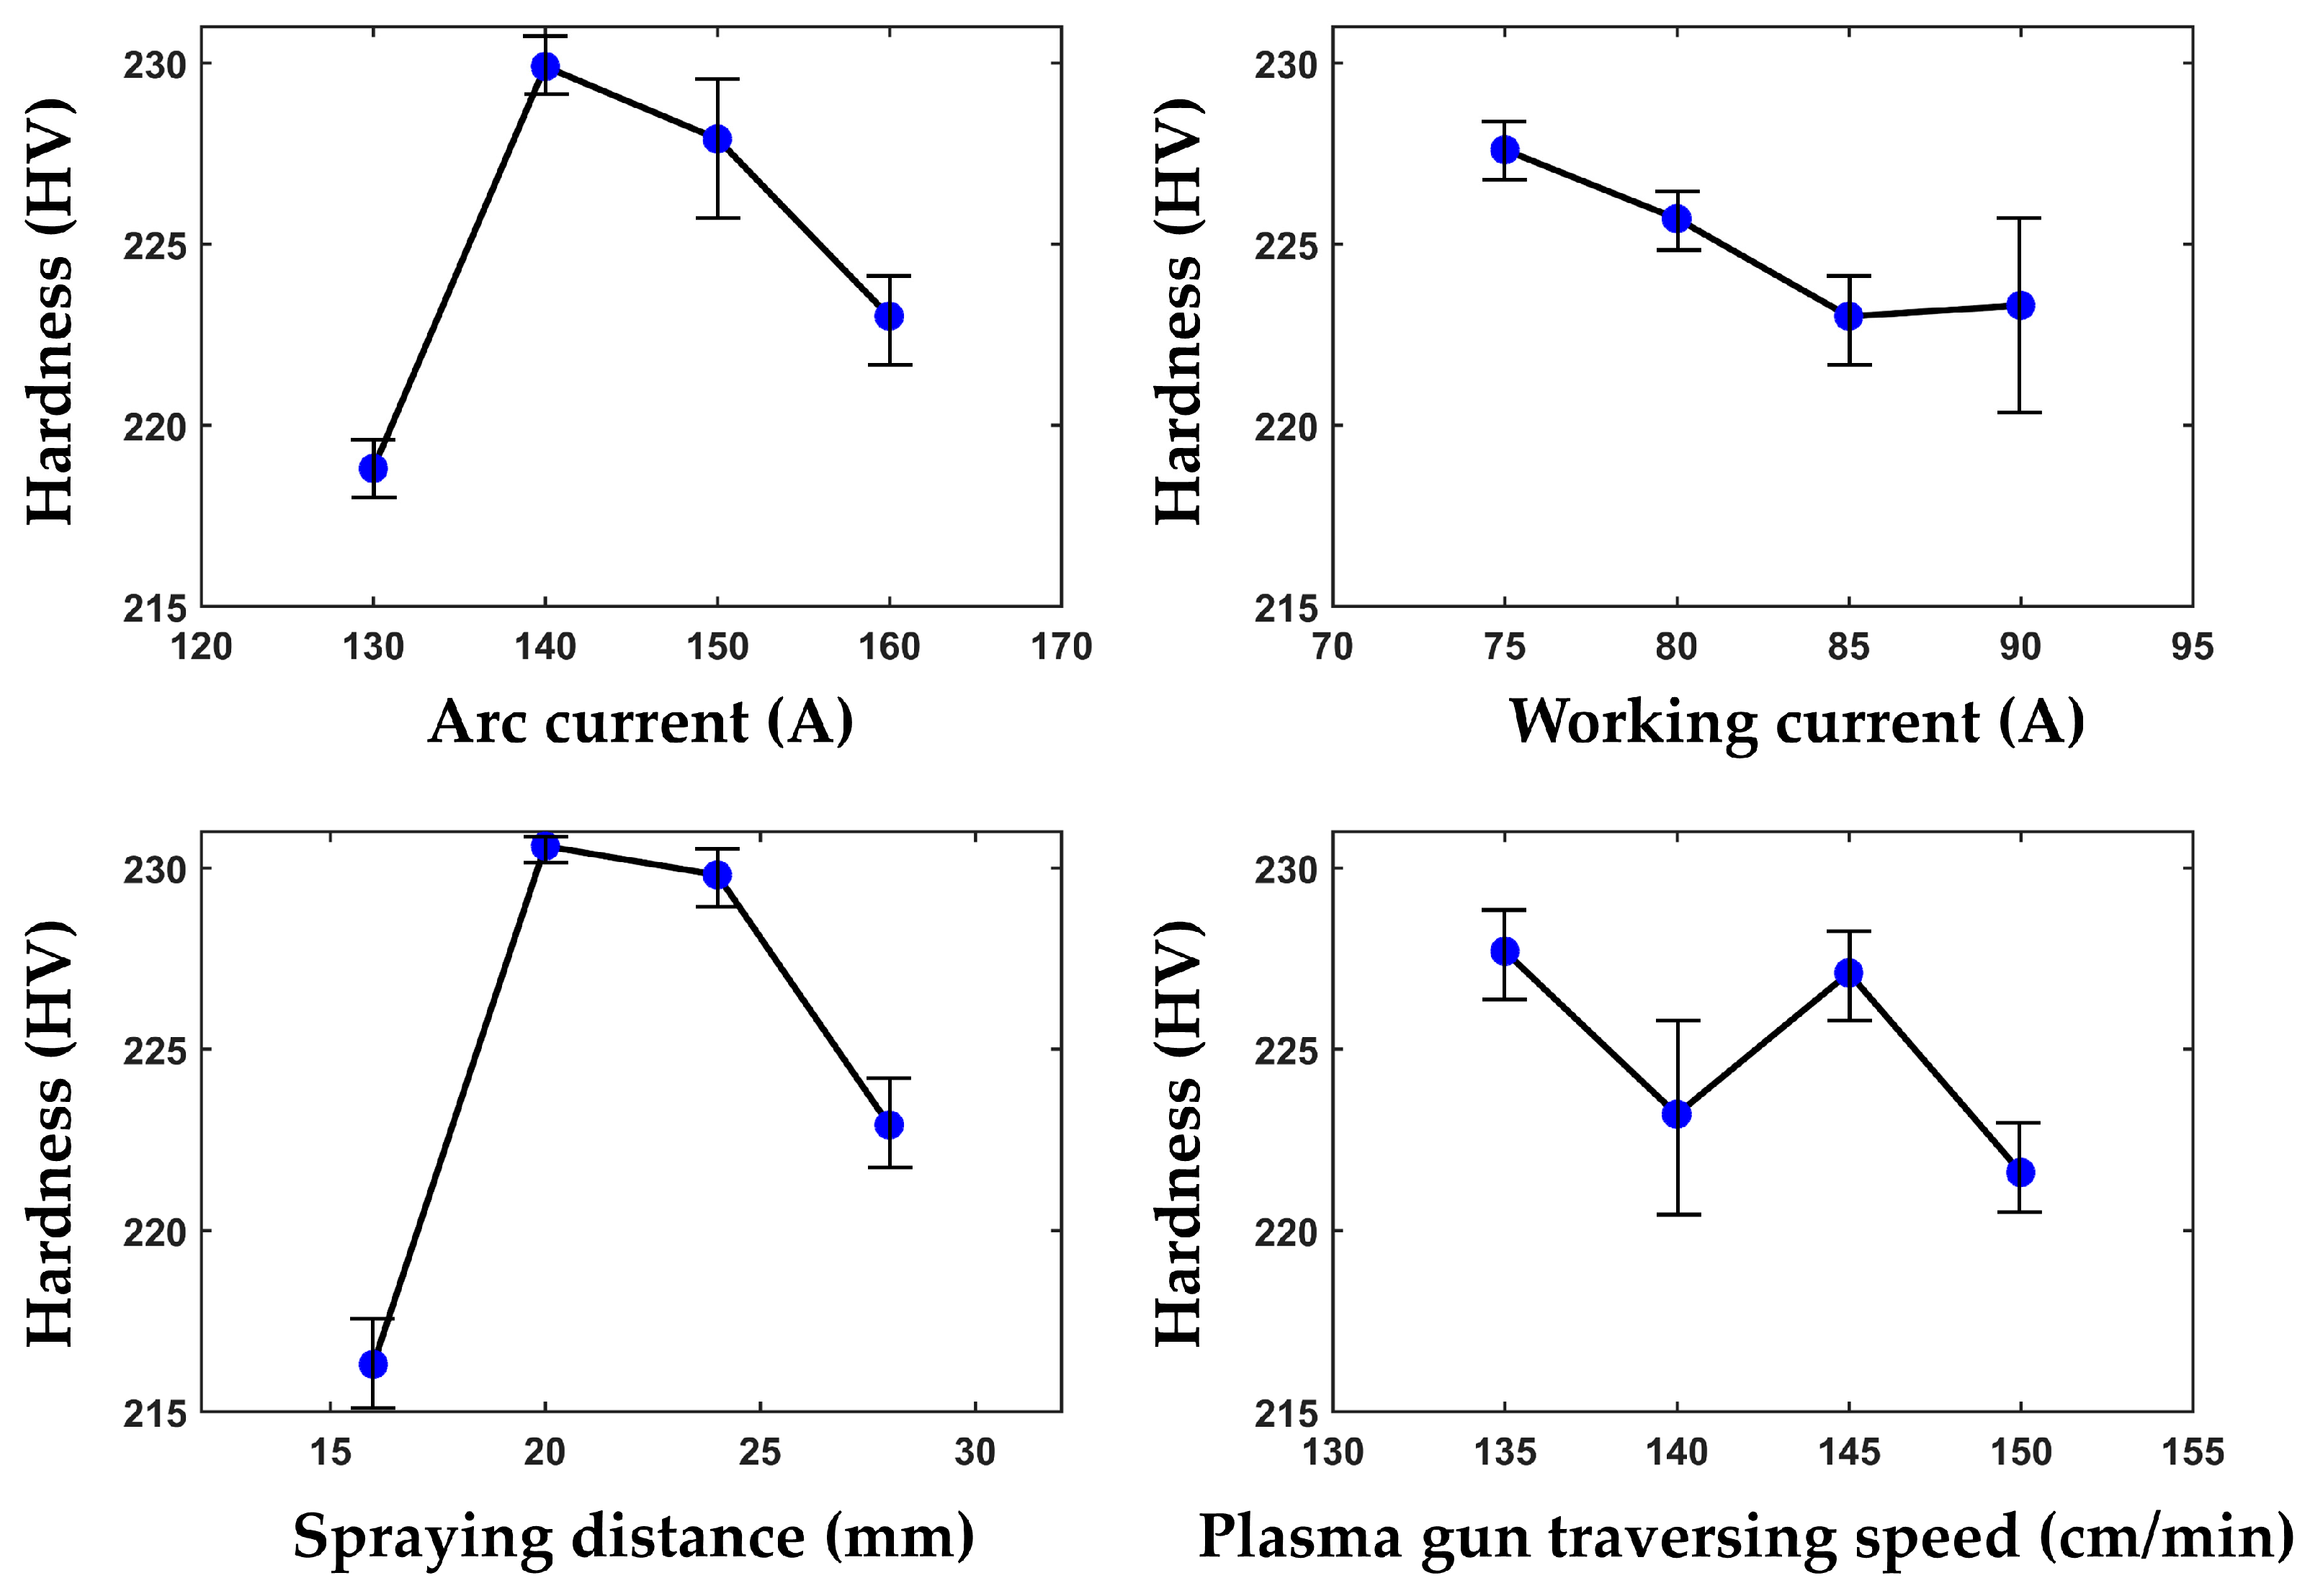
Hardness is a significant characteristic of coatings, as it directly influences their friction and wear performance during usage. Consequently, a higher hardness value is desirable. The results of an orthogonal test involving 16 parameter groups (as shown in Table 4) were analyzed to determine the range values in coating hardness. Table 5 presents the findings of this analysis, while Figure 9 illustrates the relationship between the factors and the trend of coating hardness.
The hardness values of the coatings varied by a very small amount, fluctuating in a normal range [38] between 207.4 HV and 244.7 HV. The K1, K2, K3, and K4 values in Table 5 represent the mean values of coating hardness and correspond, respectively, to the four factors according to Table 4. As indicated in Table 5, the measured values of coating hardness varied between 207.4 HV and 244.7 HV, with minimal differences observed among the groups. Figure 9 illustrates that an increase in the arc current from 130 A to 140 A resulted in a significant enhancement in coating hardness. Therefore, an arc current of 140 A was identified as one of the parameters for achieving maximum hardness. The hardness of the coatings reached its peak at 140 A due to the minimized coating porosity at this current level. Furthermore, the hardness of the coatings was also maximized when the arc current was increased from 130 A to 140 A. When gradually increasing the working current, the hardness of the coating exhibited a tendency to decrease initially, followed by a slight increase, with the maximum value observed at a working current of 75 A. Similarly, an increase in the spraying distance initially led to an increase in coating hardness, followed by a decrease, with the maximum value observed at a distance of 20 mm. The relationship between plasma gun traversing speed and coating hardness differed from the previous three factors. Specifically, as the plasma gun traversing speed increased, the hardness value initially decreased, then increased, and ultimately reached a maximum. Subsequently, it decreased again. This implies that, within the range of traversing speeds between 135 cm/min and 150 cm/min, it is necessary to select an appropriate plasma gun traversing speed.
3.3. Effect of Process Parameters on Coating Bond Strength
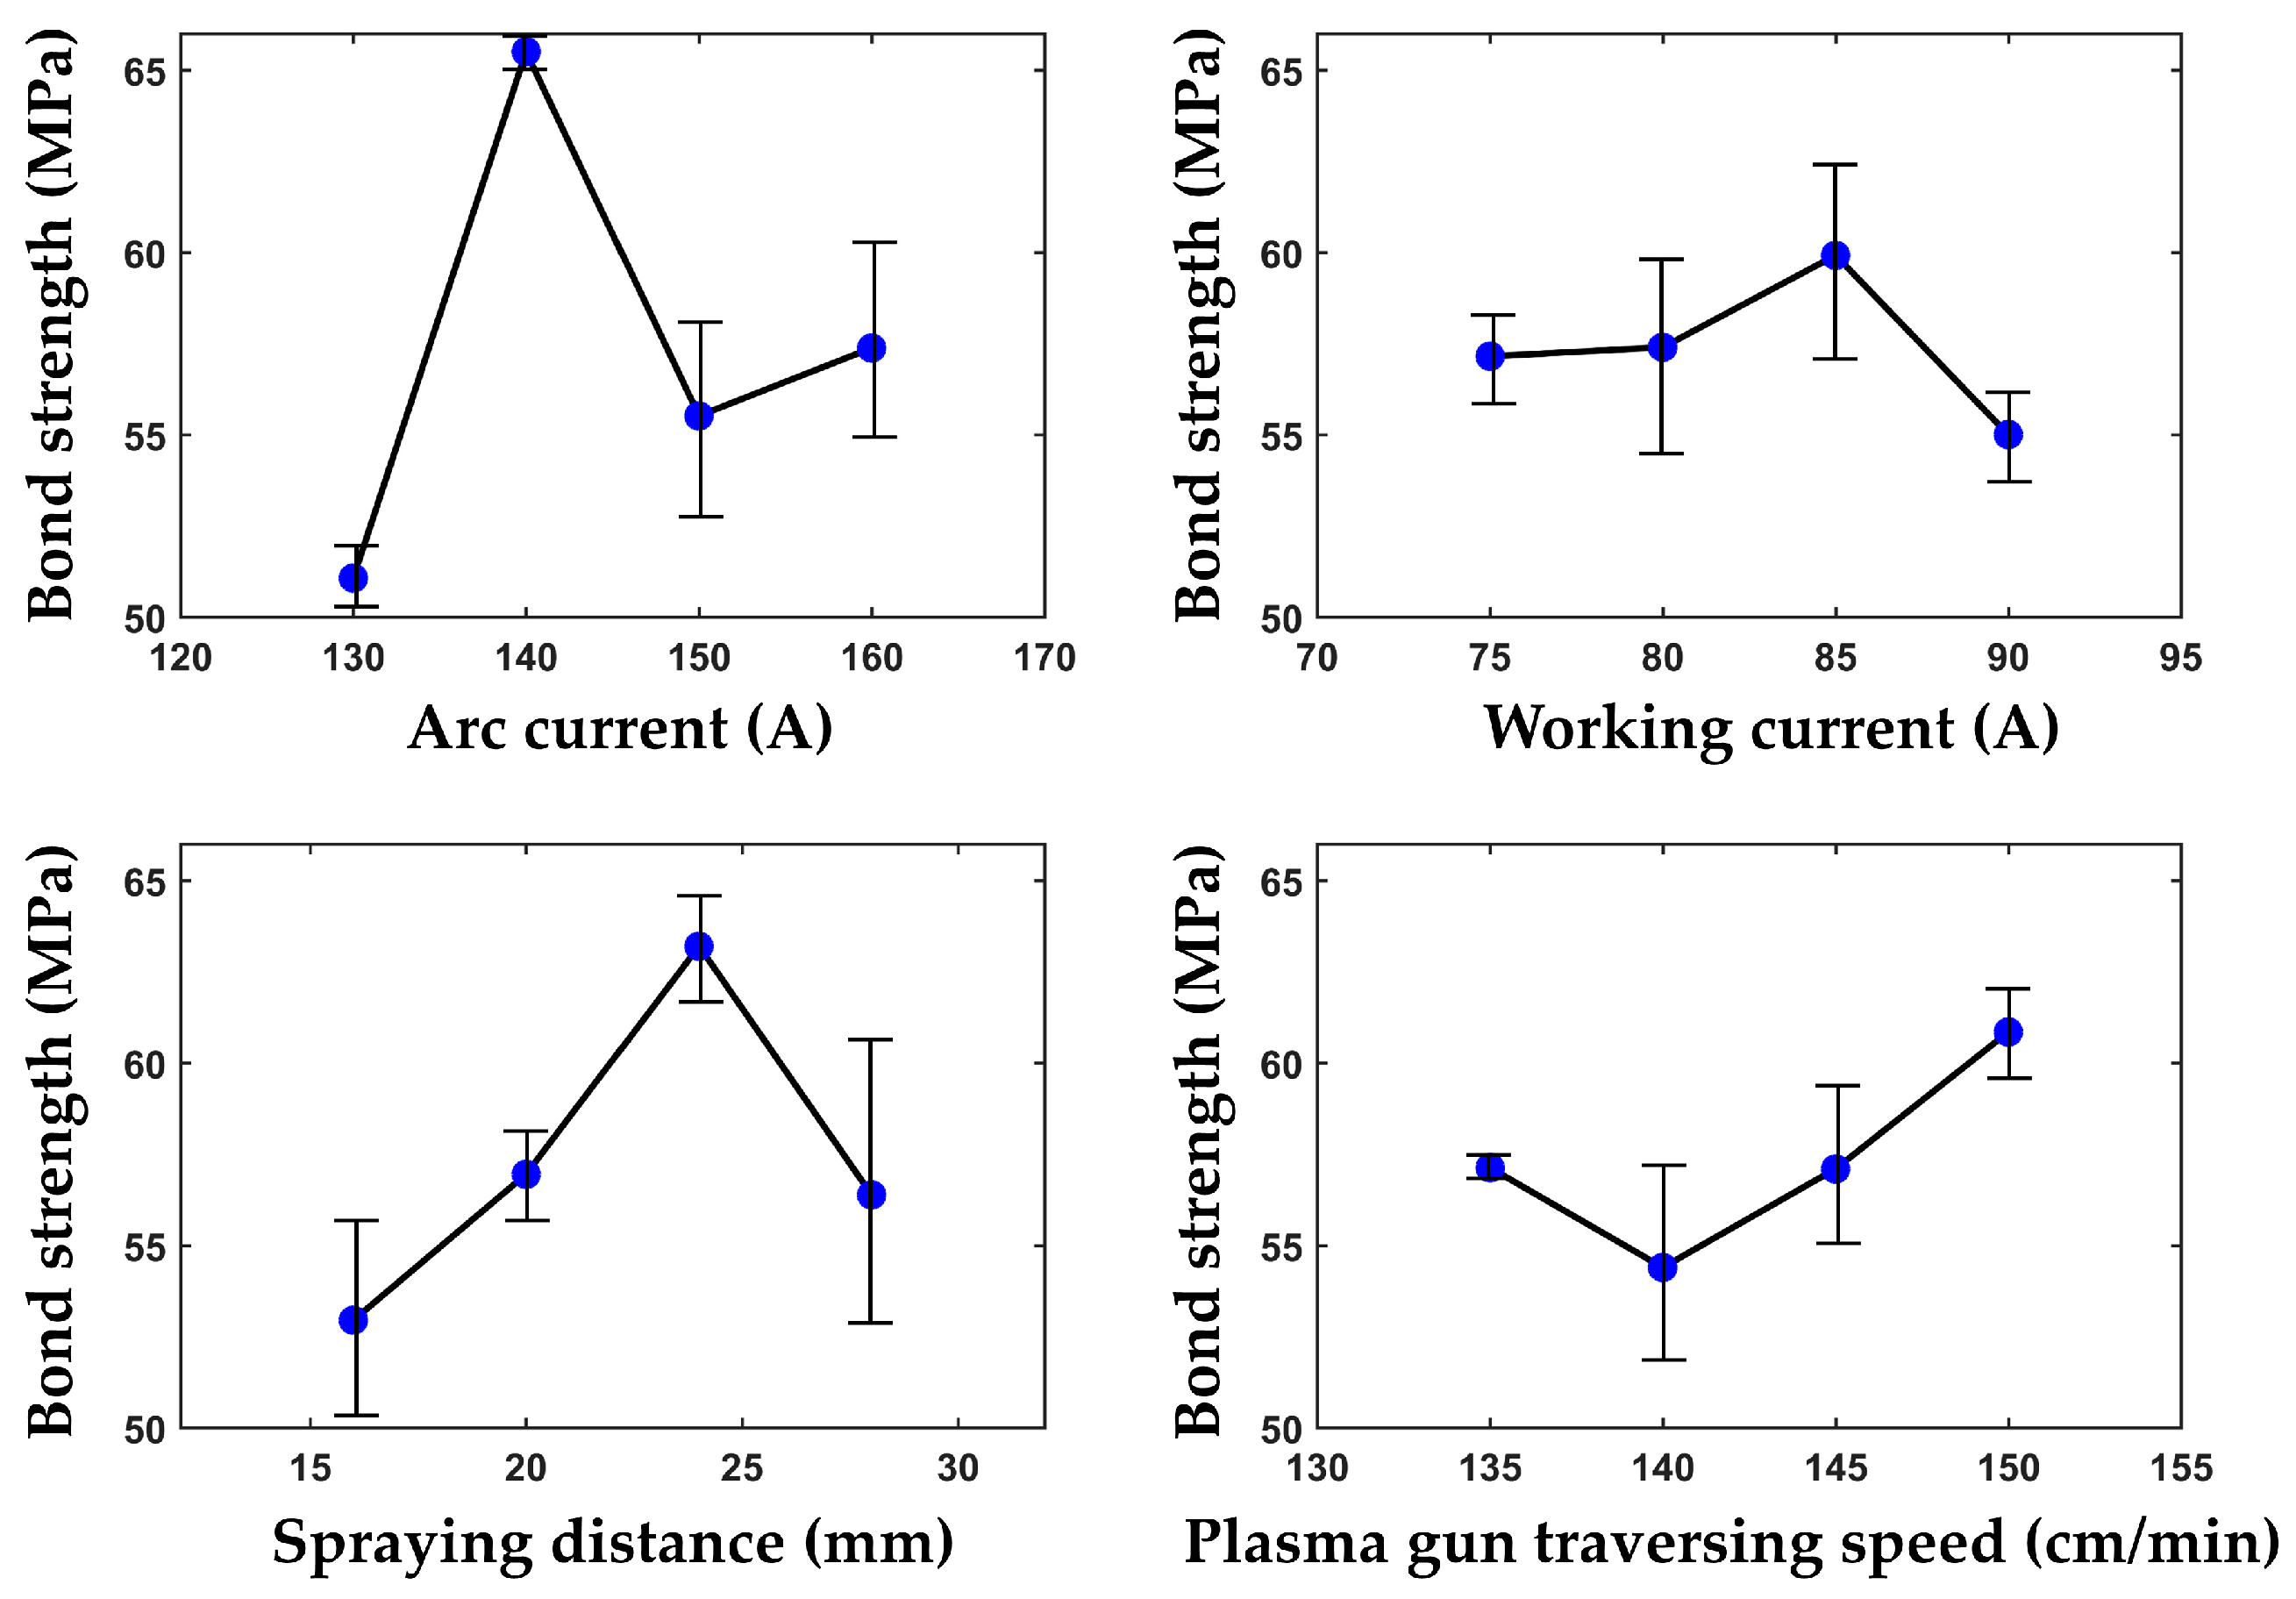
The bonding strength of coatings is a crucial parameter for assessing their performance, as it directly influences their resistance to detachment. Consequently, a higher bonding strength value indicates a superior coating. The coating bonding strength, which was measured by testing 16 sets of parameters, is shown in Table 6. Table 7 presents the outcomes of the range analysis conducted on the coating bonding strength. Additionally, Figure 10 illustrates the graphical representation of the correlation between each factor and the bonding strength of the coating.
The bonding strength of the coatings varied by a very small amount, fluctuating in a normal range [39] between 45.6 MPa and 72.6 MPa. The K1, K2, K3, and K4 values in Table 7 represent the mean values of bonding strength and correspond, respectively, to the four factors according to Table 6. As indicated in Table 7, the measured bond strength values varied between 45.6 and 72.6 MPa, with notable discrepancies observed among the different groups. Figure 10 illustrates that an increase in the arc current from 130 A to 140 A resulted in a significant enhancement in the bond strength of the coating. However, further increases in the arc current led to a notable decrease in the bond strength. Consequently, it can be inferred that an arc current of 140 A is a crucial parameter for achieving the maximum bond strength. The primary factor influencing the coating’s bond strength is the interaction between the first layer of particles and the substrate surface, as well as the overlap between the particles. Increasing the arc current enhanced the speed and heat of the particles when they collided with the substrate, consequently raising the pressure of contact and facilitating a more pronounced flattening of the particles. Consequently, the coatings exhibited higher bond strength. Conversely, excessively high arc currents resulted in particle over-melting, leading to insufficient flattening and spreading upon impact with the substrate, ultimately diminishing the bond strength.
The influence of the working current on the bond strength was found to be less significant compared to that of the arc current. The growth of bond strength was observed to be gradual as the working current increased, reaching its maximum value at 85 A. This suggests that, at this level, the particles achieved the most optimal strength with the substrate surface. Similarly, the effect of the spraying distance on bond strength followed a similar pattern to that of the arc current. As the spraying distance increased, the bond strength of the coating initially increased and then decreased, with the highest bond strength observed at a spraying distance of 24 mm. This particular spraying distance allowed the particles to attain an adequate heating temperature and speed upon impact with the substrate, facilitating particle impact and spreading, thereby enhancing bond strength. By contrast, the effect of plasma gun traversing speed on bond strength differed from the other three factors. As traversing speed increased, the bond strength of the coating initially decreased and then increased. The higher traversing speed enabled the gun to complete a scanning path more quickly and return to the initial origin at a faster rate. This reduced the temperature fluctuations of the substrate, minimized the occurrence of cracks due to thermal stresses, and ultimately improved the bond strength of the coating.
3.4. Process Parameter Optimization and Coating Quality Verification
In this paper, the evaluation of coating quality was conducted using coating porosity, hardness, and bond strength as evaluation indexes. It is generally accepted that lower coating porosity, higher hardness, and higher bond strength indicate better coating quality. However, when multiple evaluation indexes are considered simultaneously, the relative influence of each factor on the evaluation indexes may vary. Therefore, determining the optimal combination of process parameters that take into account each evaluation index is a complex task. Two commonly used methods for achieving this are the comprehensive balance analysis method and the weighted comprehensive evaluation method [40,41,42]. In this study, the weighted comprehensive evaluation method was employed to comprehensively evaluate coating evaluation indexes. Based on the comprehensive evaluation results, the optimal combination of process parameters for coating preparation was determined. The weights assigned to each evaluation index were determined based on practical experience and analysis. Specifically, the weight for porosity was set to 0.3, the weight for hardness was set to 0.2, and the weight for bonding strength was set to 0.5. The sum of the weights for the three evaluation indexes was 1. The weighted integrated scoring results for each set of process parameters were calculated using the formula 0.3 × porosity + 0.2 × hardness + 0.5 × bond strength. The weighted integrated scoring table is presented in Table 8.
The K1, K2, K3, and K4 values in Table 8 represent the mean values of comprehensive scoring and correspond, respectively, to the four factors. Based on the findings presented in Table 8, it is evident that the factors influencing the comprehensive score can be ranked in the following order: arc current, spraying distance, plasma gun traversing speed, and working current. According to the highest mean comprehensive scoring Kmax of the four factors in Table 8, the optimal combination of process parameters can be determined from Table 1. This combination consists of an arc current of 140 A, a working current of 75 A, a spraying distance of 24 mm, and a plasma gun traversing speed of 150 cm/min.
The process parameters that yielded the best results were evaluated based on a comprehensive scoring system. The performance of these parameters was then tested and compared to the results obtained from 16 previous sets of test parameters. The coating porosity, hardness, and bond strength were measured and are presented in Figure 11, Figure 12 and Figure 13, respectively.
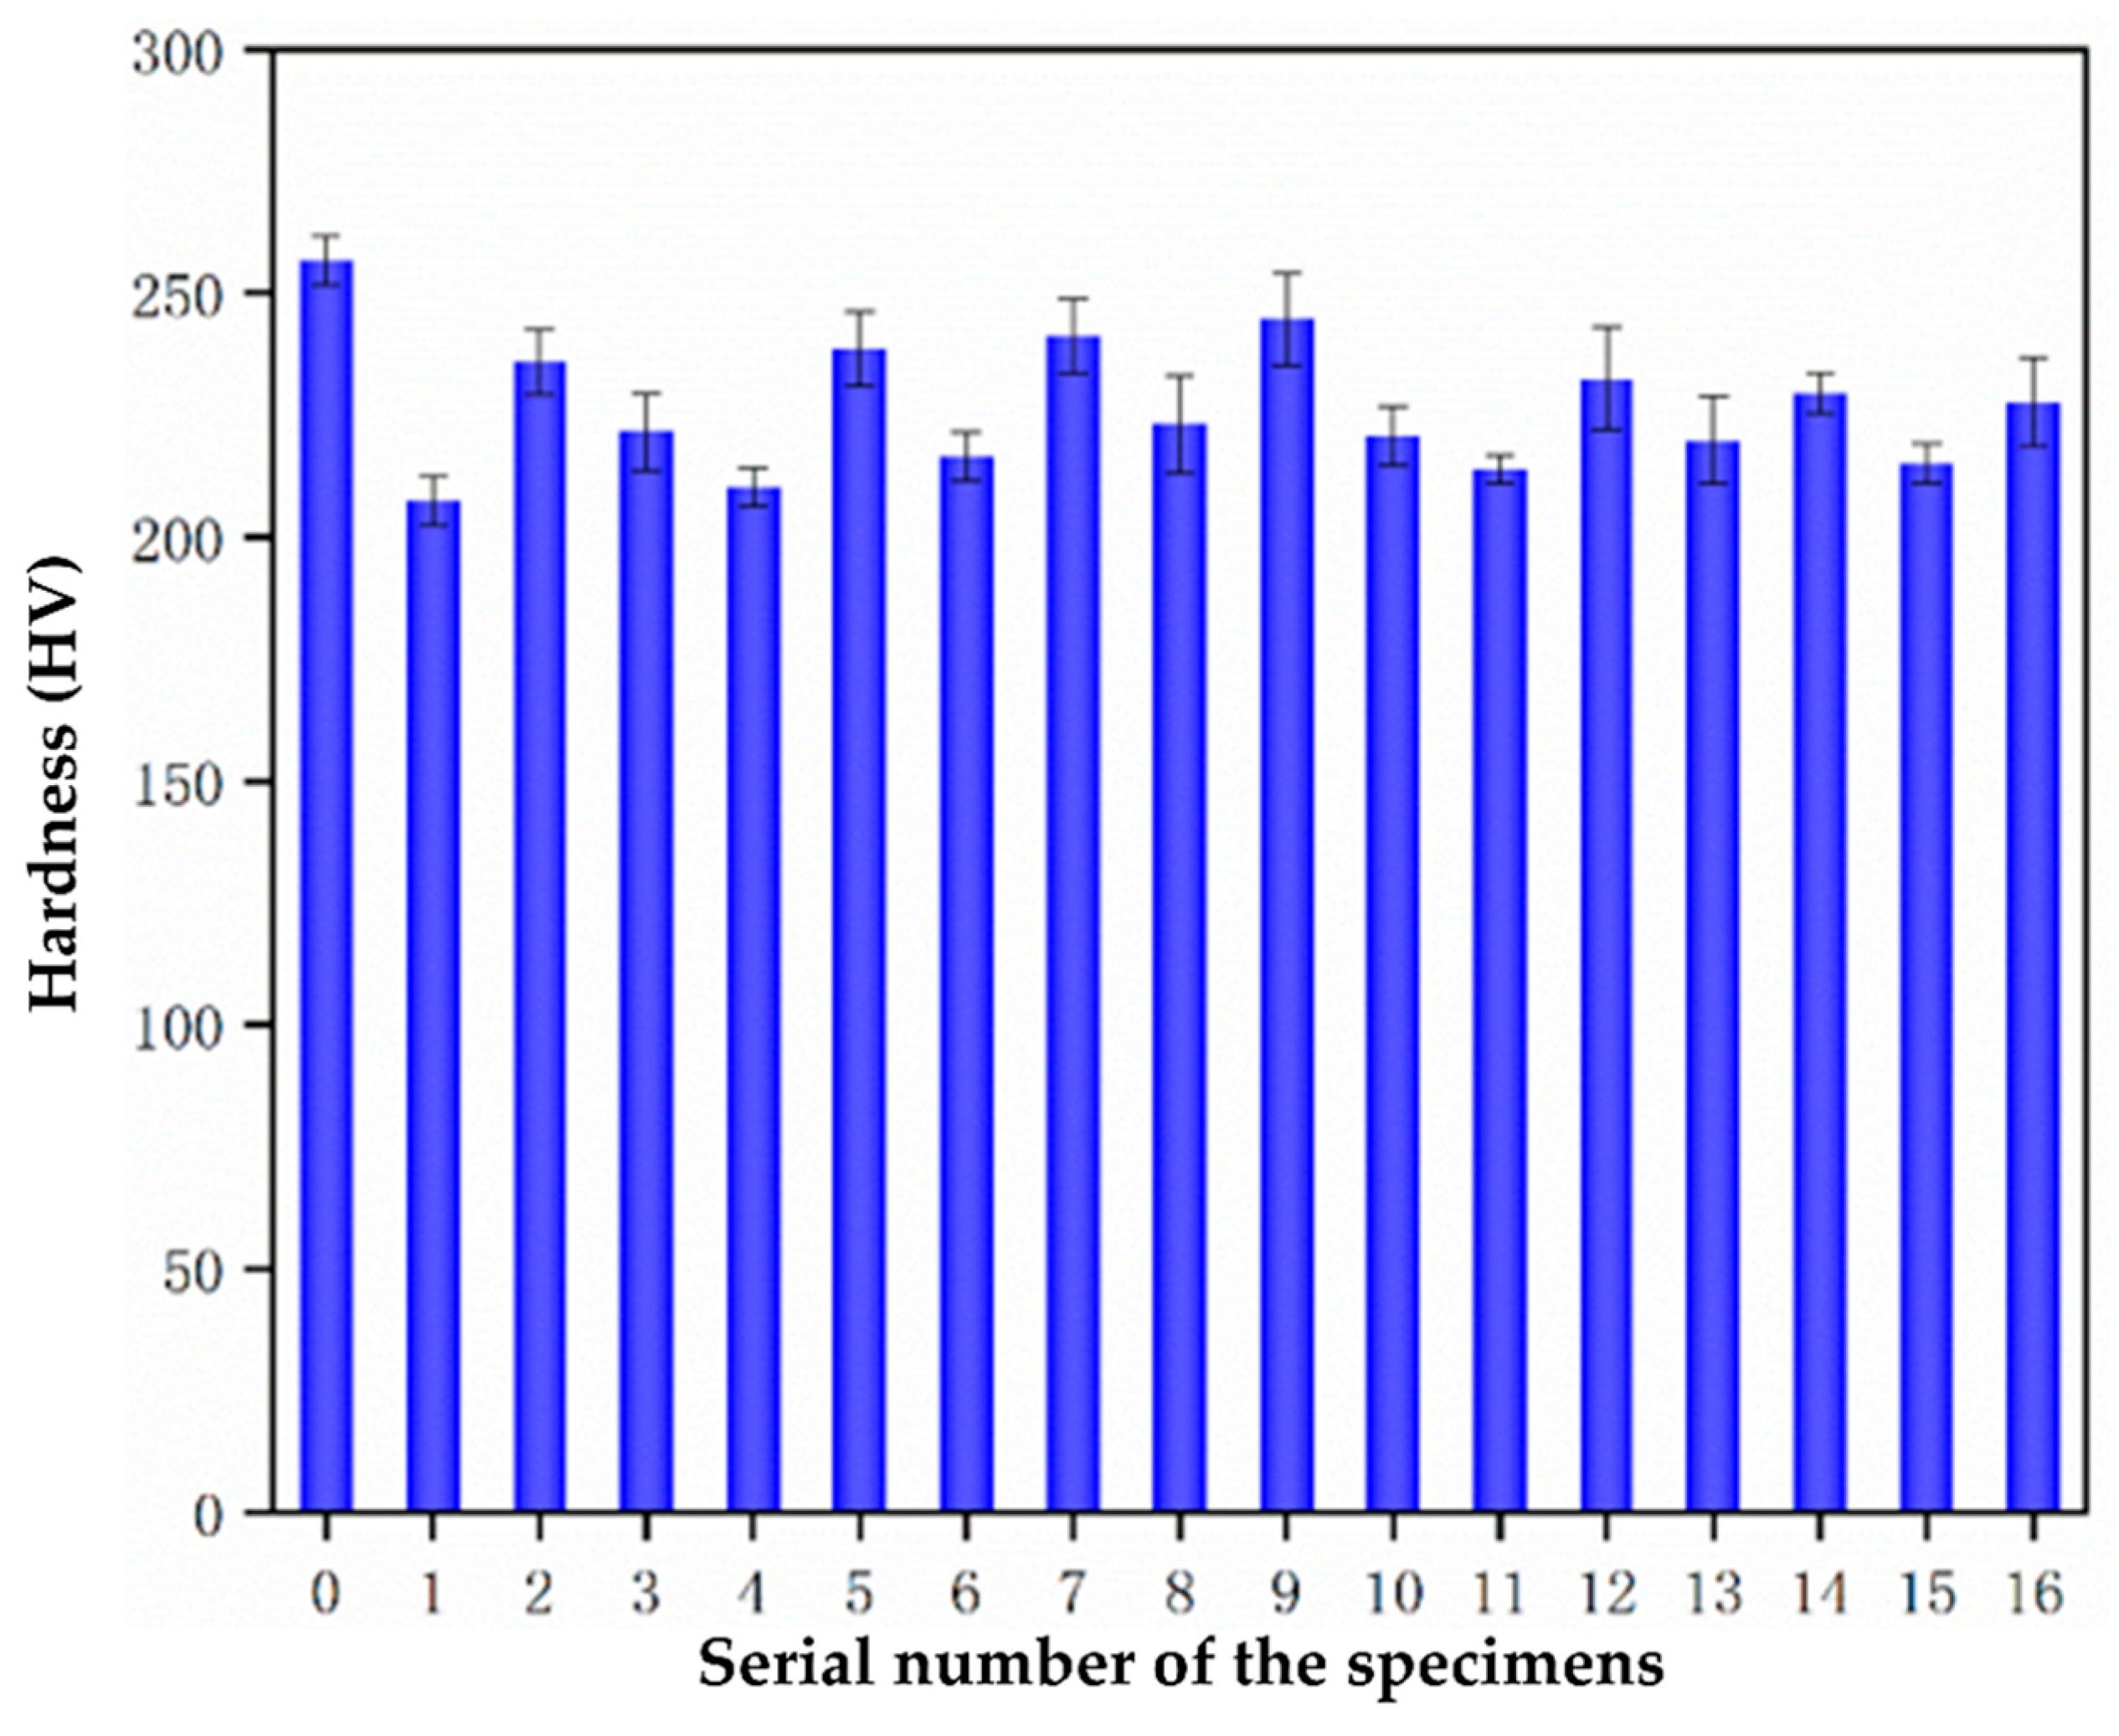
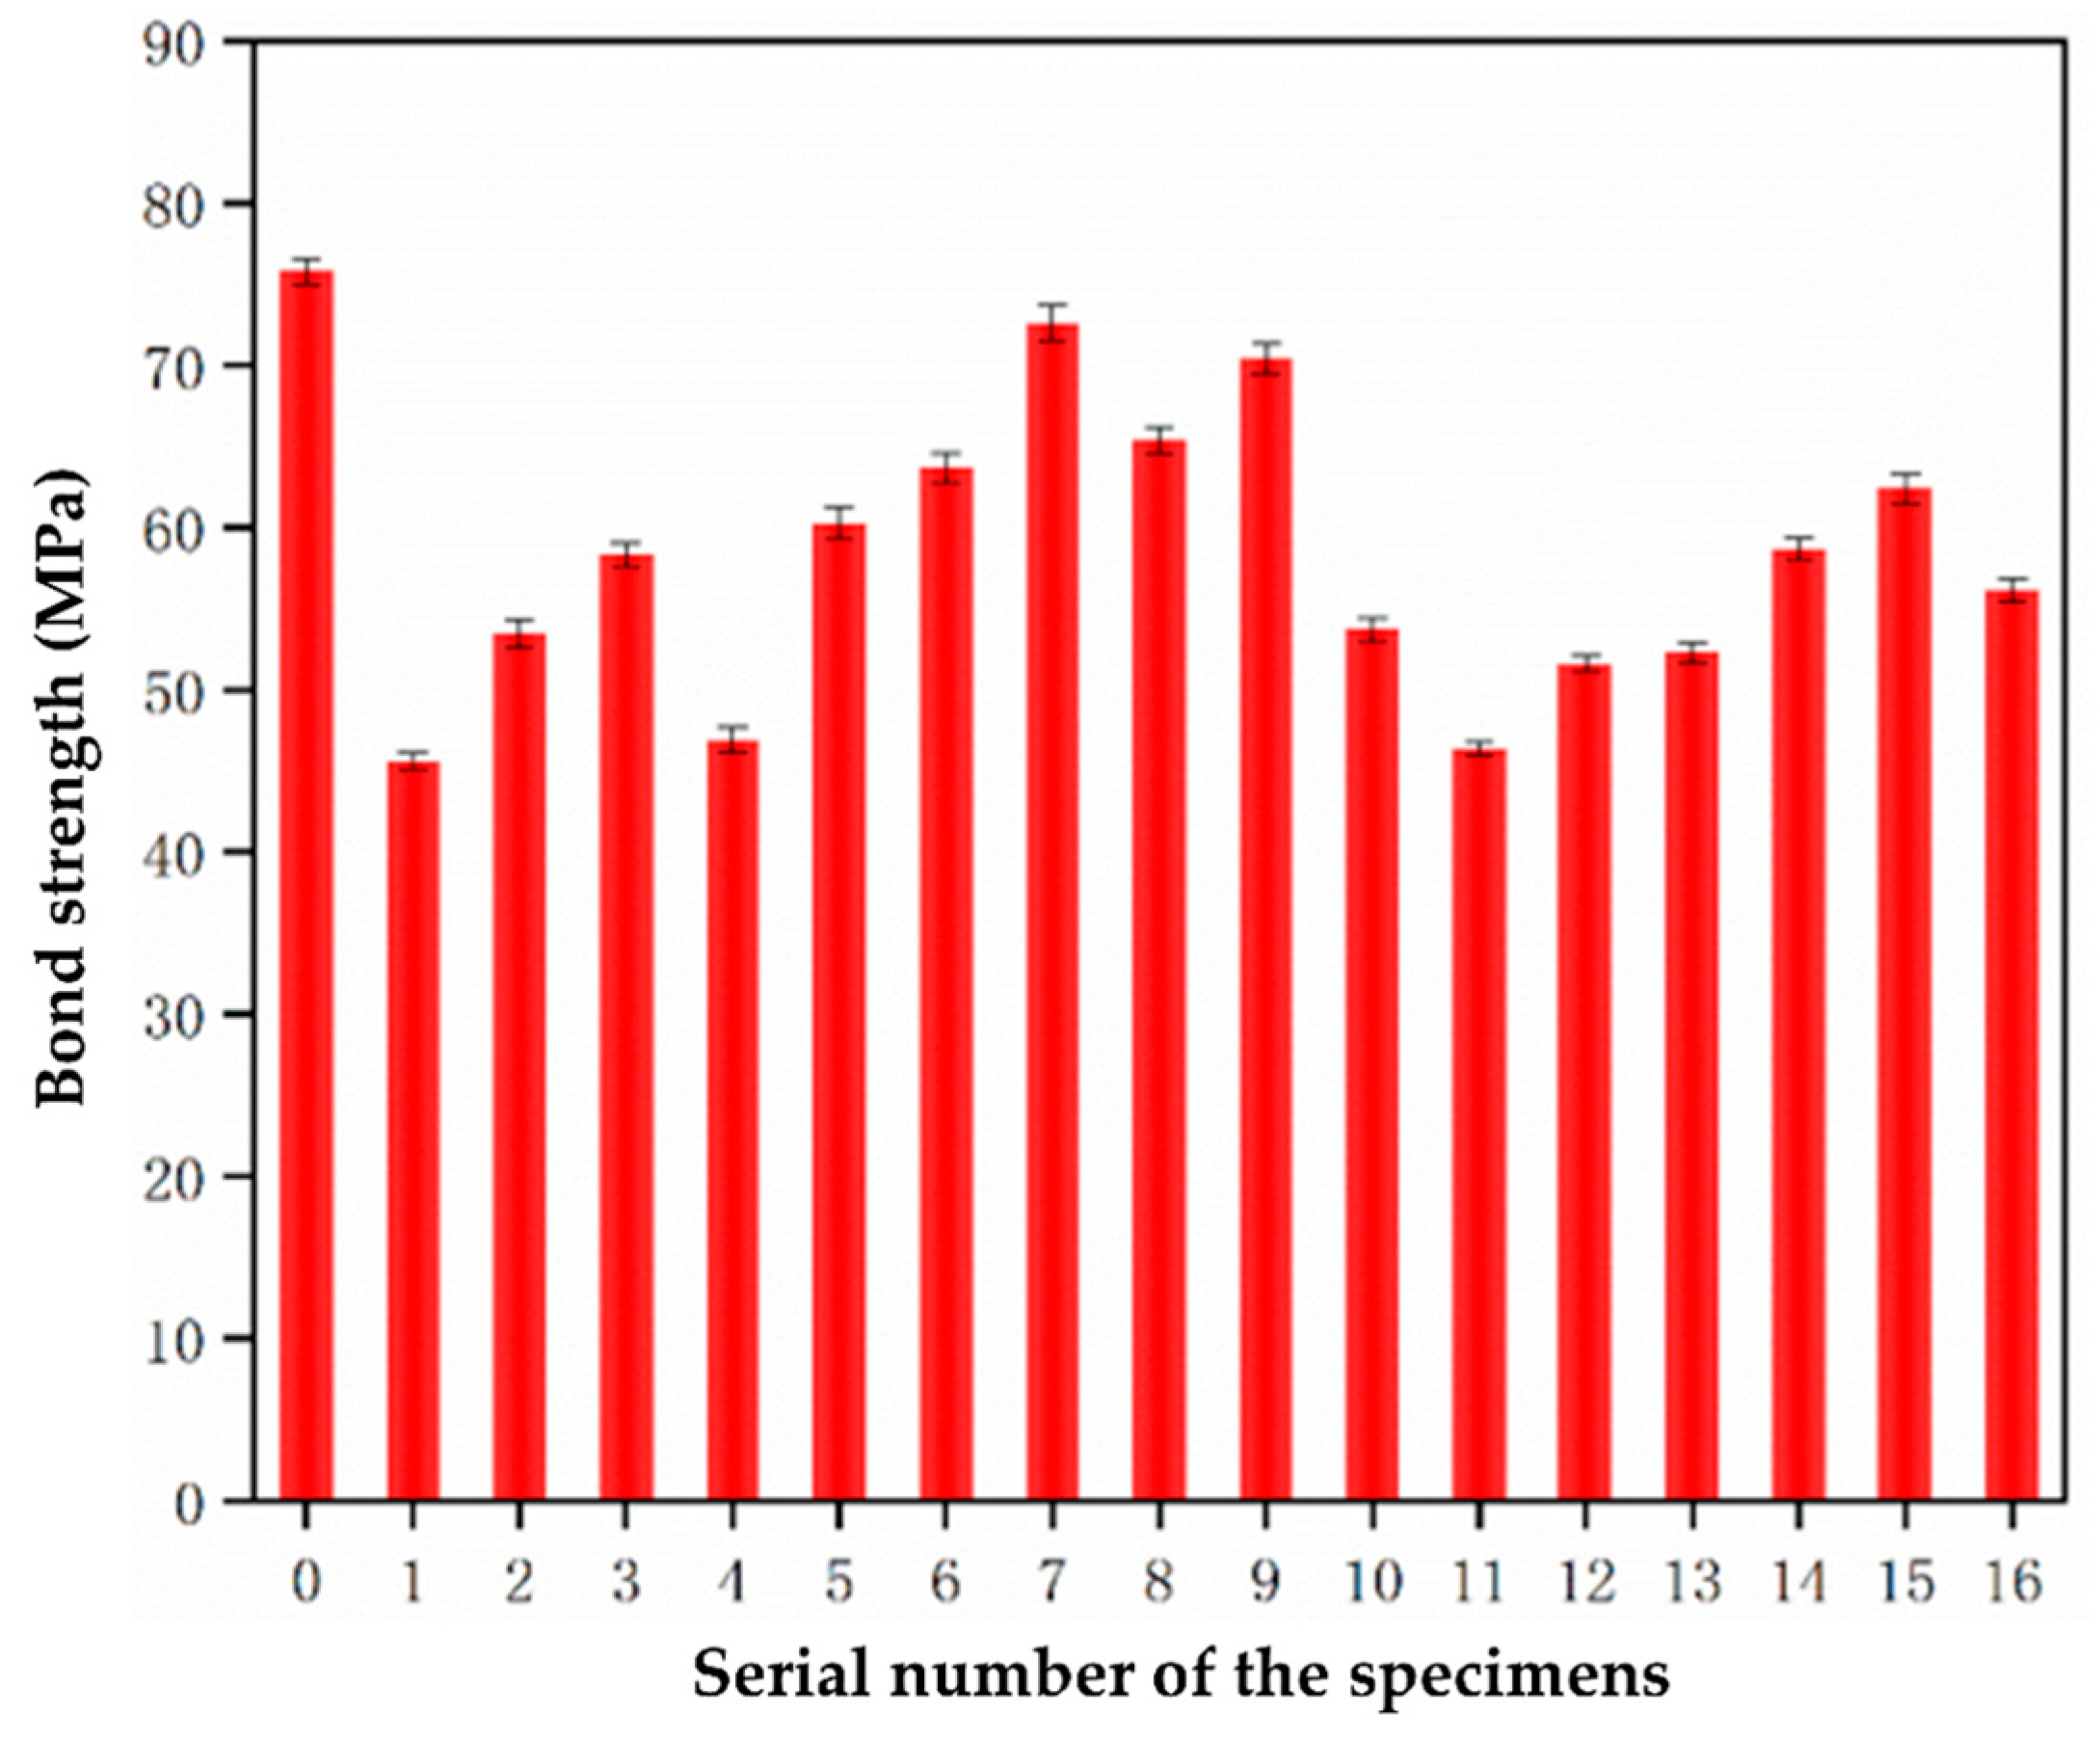
As depicted in Figure 11, the group with the lowest porosity among groups 1–16 was group 10, with a porosity of 2.52%. The optimized group exhibited a porosity of 2.14%, representing a decrease of approximately 15.1%. This reduction in porosity suggests that optimizing the parameters improved the melting state of the particles and the flight process. Consequently, the molten droplets were able to spread more effectively upon impact with the matrix, resulting in reduced porosity and improved densification. Figure 12 reveals that the highest hardness value in the orthogonal group was observed in group 9, measuring 244.7 HV. The optimized group exhibited a hardness value of 256.7 HV, representing a slight increase of approximately 4.9% compared to group 9. Regarding bond strength, the highest value in the orthogonal group was found in group 7, measuring 72.6 MPa. In the optimized group, the bond strength increased to 75.8 MPa, representing an increase of approximately 4.4%. This increase in bond strength can be attributed to the improved spreading of molten droplets on the substrate surface and the interloping of molten droplets. Therefore, the enhancement of the melting state of the particles also contributed to the increase in bond strength.
4. Conclusions
An experimental study was conducted to determine the most effective parameter combination for the plasma spray coating process of an Al-Ni coating on a Q235 steel substrate. In this context, a comprehensive evaluation method was proposed as an alternative approach to assess the impact of different spraying parameters on the mechanical and surface characteristics. As a result, the study yielded the following conclusions:
- (1)
- In the chosen range of parameters for the experiment, the porosity of the coating was influenced by several factors. Specifically, as the arc current increased, the porosity initially decreased and then increased. Similarly, the working current, spraying distance, and plasma gun traversing speed also had a similar effect on the coating porosity as the arc current. The order of influence of these factors on the porosity is as follows: working current had the greatest impact, followed by spraying distance, plasma gun traversing speed, and arc current. In reference [18], various coatings with varying levels of porosity were produced by adjusting the spraying parameters, including the flow rate of hydrogen gas, spraying power, and powder feed rate. The parameters in this study varied from those in reference [18]; however, the porosities all fall within the range of 1% to 8%, which is considered reasonable.
- (2)
- The hardness of the coating was influenced by several factors. Firstly, an increase in the arc current initially led to an increase in hardness, followed by a decrease. Similarly, the spraying distance also affected the hardness of the arc current. Secondly, an increase in the working current resulted in a decrease in hardness initially, followed by an increase. Lastly, an increase in plasma gun traversing speed led to a decrease in hardness initially, followed by an increase. The order of influence of each factor on the hardness of the coating is as follows: spraying distance had the greatest impact, followed by arc current, plasma gun traversing speed, and working current. Experimental results in reference [18] showed that the measured data of the hardness of the coating exhibited high scattering and followed the Weibull distribution, which was not observed here due to variations in microstructural characteristics and chemical compositions. Within the assessed parameters, appropriately modifying the spraying distance led to the generation of coatings with enhanced hardness, which was consistent with the conclusions in reference [28].
- (3)
- The bond strength of a coating was affected by various factors. The influence of these factors can be summarized as follows: an increase in arc current initially led to an increase in bond strength, followed by a decrease. Similarly, the working current and spraying distance exhibited a similar pattern of influence on bond strength as the arc current. On the other hand, an increase in plasma gun traversing speed initially resulted in a decrease in bond strength, followed by an increase. In terms of the order of influence, the arc current had the greatest impact on bond strength, followed by the spraying distance, plasma gun traversing speed, and, finally, the working current.
- (4)
- The weighted comprehensive evaluation method yielded the optimal parameter combinations for the arc current, working current, spraying distance, and plasma gun traversing speed as 140 A, 75 A, 24 mm, and 150 cm/min, respectively. Subsequent testing using these preferred parameters and comparing the results with those obtained from the orthogonal group demonstrated a reduction in coating porosity by 15.1%, an increase in hardness by 4.9%, and an increase in bond strength by 4.4%. These improvements indicated a certain enhancement in the performance of the coating.
Based on extensive experimentation, this comprehensive evaluation method facilitated the convenient and rational determination of an optimal parameter combination, resulting in superior performance advantages when compared to orthogonal experimental groups. Optimized plasma spray parameters can assist in the development of improved TBC processes within the aeronautics industry.
It is important to acknowledge that the statistical significance has been relatively limited. Therefore, it is inferred that the narrow range of parameters studied may have hindered the identification of substantial variations in mechanical properties. Subsequent research endeavors will encompass a wider range of plasma spray parameters for comprehensive evaluation. Additionally, other plasma spray parameters and a wider variety of materials will also be investigated.
Author Contributions
Conceptualization, S.W.; Data curation, M.L., Q.H., Z.L., X.L. and S.X.; Funding acquisition, S.C.; Investigation, S.W.; Methodology, S.W.; Resources, S.C.; Validation, S.W.; Writing—Original draft, S.W. All authors have read and agreed to the published version of the manuscript.
Funding
This research was funded by the Key Program of Jiangxi Educational Committee (GJJ2200801) and Jiangxi Provincial Department of Education Science and Technology Fund (GJJ2203607).
Institutional Review Board Statement
Not applicable.
Informed Consent Statement
Not applicable.
Data Availability Statement
Data are contained within the article.
Conflicts of Interest
The authors declare no conflict of interest.
References
- Legg, K.O.; Sartwell, B.D.; Legoux, J.-G.; Nestler, M.; Dambra, C.; Wang, D.; Quets, J.; Natishan, P.; Bretz, P.; Devereaux, J. Investigation of Plasma Spray Coatings as an Alternative to Hard Chrome Plating on Internal Surfaces; Report NRL/MR/6170–06-8987; Naval Research Lab: Washington, DC, USA, 2006. [Google Scholar]
- Legg, K.O. Overview of chromium and cadmium alternative technologies. In Surface Modification Technologies XV; ASM International, Materials Park: Novelty, OH, USA; IOM Communications Ltd.: London, UK, 2002. [Google Scholar]
- Espallargas, N.; Berget, J.; Guilemany, J.; Benedetti, A.; Suegama, P. Cr3C2–NiCr and WC–Ni thermal spray coatings as alternatives to hard chromium for erosion–corrosion resistance. Surf. Coat. Technol. 2008, 202, 1405–1417. [Google Scholar] [CrossRef]
- United States Environmental Protection Agency (EPA US). National Emission Standards for Hazardous Air Pollutant Emissions: Hard and Decorative Chromium Electroplating and Chromium Anodizing Tanks; and Steel Pickling—HCl Process Facilities and Hydrochloric Acid Regeneration Plants. Dly. J. U. S. Gov. 2012, 77, 58219–58253. [Google Scholar]
- Miguel, J.M.; Vizcaino, S.; Lorenzana, C.; Cinca, N.; Guilemany, J.M. Tribological Behavior of Bronze Composite Coatings Obtained by Plasma Thermal Spraying. Tribol. Lett. 2011, 42, 263–273. [Google Scholar] [CrossRef]
- Guilemany, J.M.; Navarro, J.; Lorenzana, C.; Vizcaino, S.; Miguel, J.M. Tribological behaviour of abradable coatings obtained by atmospheric plasma spraying (APS). In Proceedings of the International Thermal Spray Conference, Singapore, 28–30 May 2001; pp. 1115–1118. [Google Scholar]
- Carter, T.J. Common failures in gas turbine blades. Eng. Fail. Anal. 2005, 12, 237–247. [Google Scholar] [CrossRef]
- Mazur, Z.; Luna-Ramírez, A.; Juárez-Islas, J.; Campos-Amezcua, A. Failure analysis of a gas turbine blade made of Inconel 738LC alloy. Eng. Fail. Anal. 2005, 12, 474–486. [Google Scholar] [CrossRef]
- Tawancy, H.; Mohammad, A.; Al-Hadhrami, L.; Dafalla, H.; Alyousf, F. On the performance and failure mechanism of thermal barrier coating systems used in gas turbine blade applications: Influence of bond coat/superalloy combination. Eng. Fail. Anal. 2015, 57, 1–20. [Google Scholar] [CrossRef]
- Kumar, S.; Kumar, M.; Handa, A. Comparative study of high temperature oxidation behavior and mechanical properties of wire arc sprayed Ni Cr and Ni Al coatings. Eng. Fail. Anal. 2019, 106, 104173. [Google Scholar] [CrossRef]
- Padture, N.P.; Gell, M.; Jordan, E.H. Thermal Barrier Coatings for Gas-Turbine Engine Applications. Science 2002, 296, 280–284. [Google Scholar] [CrossRef]
- Bakan, E.; Vassen, R. Ceramic Top Coats of Plasma-Sprayed Thermal Barrier Coatings: Materials, Processes, and Properties. J. Therm. Spray Technol. 2017, 26, 992–1010. [Google Scholar] [CrossRef]
- Heimann, R.B. Principles of Thermal Spraying. In Plasma-Spray Coating: Principles and Applications; Wiley: Weinheim, Germany, 1996. [Google Scholar]
- Luo, X.; Smith, G.M.; Sampath, S. On the Interplay between Adhesion Strength and Tensile Properties of Thermal Spray Coated Laminates—Part I: High Velocity Thermal Spray Coatings. J. Therm. Spray Technol. 2018, 27, 296–307. [Google Scholar] [CrossRef]
- Xu, C.; Du, L.; Yang, B.; Zhang, W. The effect of Al content on the galvanic corrosion behaviour of coupled Ni/graphite and Ni–Al coatings. Corros. Sci. 2011, 53, 2066–2074. [Google Scholar] [CrossRef]
- Cai, F.; Jiang, C. Influences of Al particles on the microstructure and property of electrodeposited Ni–Al composite coatings. Appl. Surf. Sci. 2014, 292, 620–625. [Google Scholar] [CrossRef]
- Bang, J.; Kwon, H.; Byon, E.; Lee, E. Understanding of microstructures and mechanical properties of thermal sprayed Ni-based coatings with Al and Mo addition. J. Adv. Mar. Eng. Technol. (JAMET) 2022, 46, 342–347. [Google Scholar] [CrossRef]
- Zhang, X.C.; Xu, B.S.; Xuan, F.Z.; Tu, S.T.; Wang, H.D.; Wu, Y.X. Porosity and effective mechanical properties of plasma-sprayed Ni-based alloy coatings. Appl. Surf. Sci. 2009, 255, 4362–4371. [Google Scholar] [CrossRef]
- Ghanbari, S.; Mahboubi, F. Corrosion resistance of electrodeposited Ni–Al composite coatings on the aluminum substrate. Mater. Des. 2011, 32, 1859–1864. [Google Scholar] [CrossRef]
- Liu, H.; Chen, W. Porosity-dependent cyclic-oxidation resistance at 850 °C of annealed Ni–Al-based coatings via electroplating. Surf. Coat. Technol. 2008, 202, 4019–4027. [Google Scholar] [CrossRef]
- Odhiambo, J.G.; Li, W.; Zhao, Y.; Li, C. Porosity and its significance in plasma-sprayed coatings. Coatings 2019, 9, 460. [Google Scholar] [CrossRef]
- Aghasibeig, M.; Tarasi, F.; Lima, R.S.; Dolatabadi, A.; Moreau, C. A review on suspension thermal spray patented technology evolution. J. Therm. Spray Technol. 2019, 28, 1579–1605. [Google Scholar] [CrossRef]
- Fauchais, P.; Vardelle, M.; Vardelle, A.; Goutier, S. What do we know, what are the current limitations of suspension plasma spraying? J. Therm. Spray Technol. 2015, 24, 1120–1129. [Google Scholar] [CrossRef]
- Kim, J.; Han, J.H.; Kim, J.H. A Study on the O2 Plasma Etching Method of Spray-Formed SWCNT Films and Their Utilization as Electrodes for Electrochemical Sensors. Sensors 2023, 23, 7812. [Google Scholar] [CrossRef]
- Yang, J.X.; Zhang, Z.; Tian, Y.P. Preparation and crystal structural characterization of Cu (II) complex with piperidine-4-carboxylic acid. Russ. J. Coord. Chem. 2005, 31, 282–285. [Google Scholar] [CrossRef]
- Gautam, R.K.S.; Rao, U.; Tyagi, R. High temperature tribological properties of Ni-based self-lubricating coatings deposited by atmospheric plasma spray. Surf. Coat. Technol. 2019, 372, 390–398. [Google Scholar] [CrossRef]
- Anupam, A.; Kottada, R.S.; Kashyap, S.; Meghwal, A.; Murty, B.; Berndt, C.; Ang, A. Understanding the microstructural evolution of high entropy alloy coatings manufactured by atmospheric plasma spray processing. Appl. Surf. Sci. 2020, 505, 144117. [Google Scholar] [CrossRef]
- Lorenzo-Bañuelos, M.; Díaz, A.; Rodríguez, D.; Cuesta, I.I.; Fernández, A.; Alegre, J.M. Influence of Atmospheric Plasma Spray Parameters (APS) on the Mechanical Properties of Ni-Al Coatings on Aluminum Alloy Substrate. Metals 2021, 11, 612. [Google Scholar] [CrossRef]
- Prochazka, Z.; Khor, K.A.; Cizek, J. Influence of Input Parameters on Splat Formation and Coating Thermal Diffusivity in Plasma Spraying. Adv. Eng. Mater. 2006, 8, 645–650. [Google Scholar] [CrossRef]
- Nouri, A.; Sola, A. Powder morphology in thermal spraying. J. Adv. Manuf. Process. 2019, 1, 10020. [Google Scholar] [CrossRef]
- Janisson, S.; Vardelle, A.; Coudert, J.F.; Meillot, E.; Pateyron, B.; Fauchais, P. Plasma Spraying Using Ar-He-H2 Gas Mixtures. J. Therm. Spray Technol. 1999, 8, 545–552. [Google Scholar] [CrossRef]
- Ng, H.; Gan, Z. A finite element analysis technique for predicting as-sprayed residual stresses generated by the plasma spray coating process. Finite Elem. Anal. Des. 2005, 41, 1235–1254. [Google Scholar] [CrossRef]
- Teixeira, V.; Andritschky, M.; Fischer, W.; Buchkremer, H.; Stöver, D. Analysis of residual stresses in thermal barrier coatings. J. Mater. Process. Technol. 1999, 92–93, 209–216. [Google Scholar] [CrossRef]
- Sarikaya, O. Effect of the substrate temperature on properties of plasma sprayed Al2O3 coatings. Mater. Des. 2005, 26, 53–57. [Google Scholar] [CrossRef]
- Fogarassy, P.; Turquier, F.; Lodini, A. Residual stress in plasma sprayed zirconia on cylindrical components. Mech. Mater. 2003, 35, 633–640. [Google Scholar] [CrossRef]
- Pawlowski, L. The Science and Engineering of Thermal Spray Coatings; John Wiley & Sons: Hoboken, NJ, USA, 2008. [Google Scholar]
- Tucker, R.C., Jr. Introduction to coating design and processing. Therm. Spray Technol. 2013, 5, 76–88. [Google Scholar]
- Zhao, L.; Du, B.; Yao, J.; Chen, H.; Ding, R.; Li, K. Microstructure and Mechanical Properties of Nickel-Aluminum Bronze Coating on 17-4PH Stainless Steel by Laser Cladding. Chin. J. Mech. Eng. 2022, 35, 140. [Google Scholar] [CrossRef]
- Wu, D.; Liu, S.; Yuan, Z.; Cao, P.; Wei, X.; Zhang, C. Effect of pre-oxidation on high-temperature chlorine-induced corrosion properties of air plasma-sprayed Ni-5% Al coatings. J. Therm. Spray Technol. 2021, 30, 1927–1939. [Google Scholar] [CrossRef]
- Cunha, H.; Loureiro, D.; Sousa, G.; Covas, D.; Alegre, H. A comprehensive water balance methodology for collective irrigation systems. Agric. Water Manag. 2019, 223, 105660. [Google Scholar] [CrossRef]
- Qin, C.; Li, B.; Shi, B.; Qin, T.; Xiao, J.; Xin, Y. Location of substation in similar candidates using comprehensive evaluation method base on DHGF. Measurement 2019, 146, 152–158. [Google Scholar] [CrossRef]
- Yang, L.; Chen, J. A comprehensive evaluation of microbial differential abundance analysis methods: Current status and potential solutions. Microbiome 2022, 10, 130. [Google Scholar] [CrossRef]
Figure 1.
The microscopic morphology of the Al-Ni powder with different magnifications: (a) magnification is 200×; (b) magnification is 500×; (c) magnification is 4.5K×; (d) magnification is 6K×.
Figure 1.
The microscopic morphology of the Al-Ni powder with different magnifications: (a) magnification is 200×; (b) magnification is 500×; (c) magnification is 4.5K×; (d) magnification is 6K×.

Figure 2.
The particle size distribution and XRD spectrum of the Al-Ni powder. (a) Particle size distribution, (b) XRD spectrum.
Figure 2.
The particle size distribution and XRD spectrum of the Al-Ni powder. (a) Particle size distribution, (b) XRD spectrum.

Figure 3.
Two different shapes and sizes of the specimens. (a) Square samples; (b) cylindrical samples.
Figure 3.
Two different shapes and sizes of the specimens. (a) Square samples; (b) cylindrical samples.

Figure 4.
Relevant equipment of plasma spraying.

Figure 5.
Several crucial experimental apparatuses.

Figure 6.
Macroscopic morphology images of the surface of the Al-Ni coating.

Figure 7.
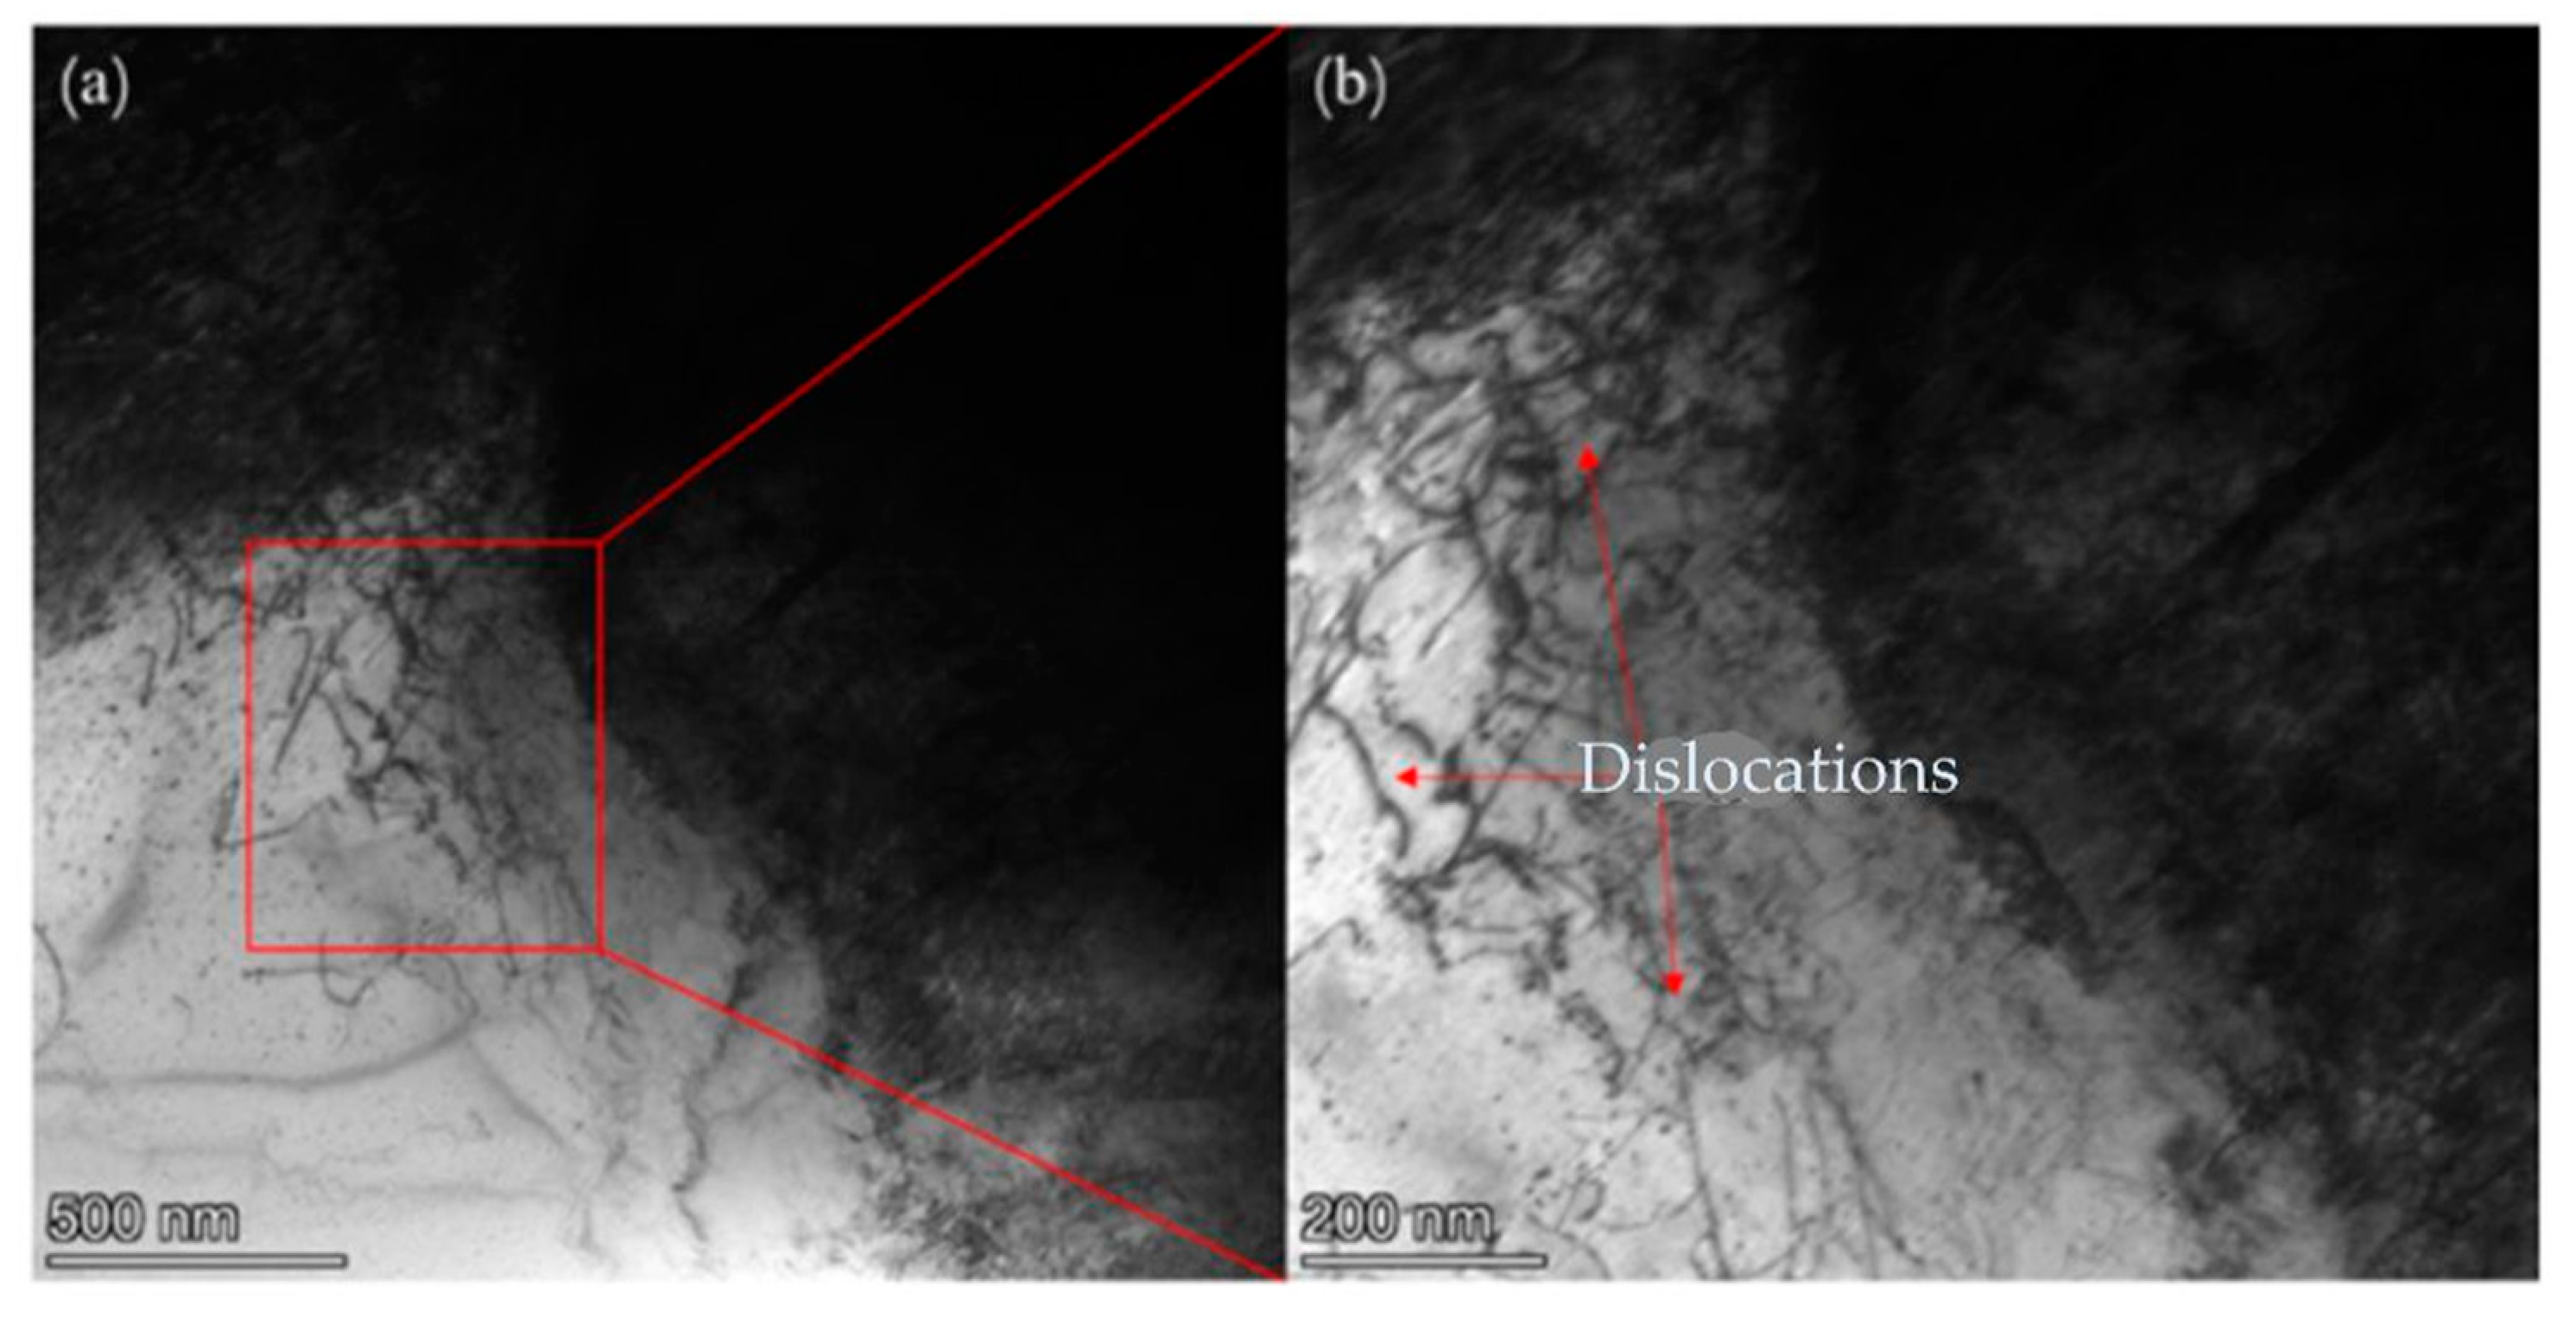
Microscopic micrographs image of cross-section of Al-Ni coating: (a) dislocation region; (b) enlarged view of the dislocation region.
Figure 7.
Microscopic micrographs image of cross-section of Al-Ni coating: (a) dislocation region; (b) enlarged view of the dislocation region.

Figure 8.
The relationship between each factor and porosity.

Figure 9.
The relationship between each factor and hardness.

Figure 10.
The relationship between each factor and bond strength.

Figure 11.
The coating porosity of the specimen with the optimal combination of parameters (group 0) and 16 previous sets of test specimens.
Figure 11.
The coating porosity of the specimen with the optimal combination of parameters (group 0) and 16 previous sets of test specimens.

Figure 12.
The hardness of the specimen with the optimal combination of parameters (group 0) and 16 previous sets of test specimens.
Figure 12.
The hardness of the specimen with the optimal combination of parameters (group 0) and 16 previous sets of test specimens.

Figure 13.
The bond strength of the specimen with the optimal combination of parameters (group 0) and 16 previous sets of test specimens.
Figure 13.
The bond strength of the specimen with the optimal combination of parameters (group 0) and 16 previous sets of test specimens.


Table 1.
Factors and levels of the orthogonal experimental table.
| Factors | Levels | |||
|---|---|---|---|---|
| 1 | 2 | 3 | 4 | |
| arc current (A) | 130 | 140 | 150 | 160 |
| working current (A) | 75 | 80 | 85 | 90 |
| spraying distance (mm) | 16 | 20 | 24 | 28 |
| plasma gun traversing speed (cm/min) | 135 | 140 | 145 | 150 |
Table 2.
The coating porosity of 16 specimens.
| Factors | Porosity (%) | ||||
|---|---|---|---|---|---|
| Arc Current | Working Current | Spraying Distance | Plasma Gun Traversing Speed | ||
| 1 | 130 | 75 | 16 | 135 | 4.86 |
| 2 | 130 | 80 | 20 | 140 | 3.14 |
| 3 | 130 | 85 | 24 | 145 | 2.58 |
| 4 | 130 | 90 | 28 | 150 | 5.15 |
| 5 | 140 | 75 | 20 | 145 | 5.24 |
| 6 | 140 | 80 | 16 | 150 | 4.63 |
| 7 | 140 | 85 | 28 | 135 | 3.13 |
| 8 | 140 | 90 | 24 | 140 | 2.63 |
| 9 | 150 | 75 | 24 | 150 | 5.98 |
| 10 | 150 | 80 | 28 | 145 | 2.52 |
| 11 | 150 | 85 | 16 | 140 | 4.69 |
| 12 | 150 | 90 | 20 | 135 | 5.13 |
| 13 | 160 | 75 | 28 | 140 | 5.21 |
| 14 | 160 | 80 | 24 | 135 | 3.27 |
| 15 | 160 | 85 | 20 | 150 | 4.58 |
| 16 | 160 | 90 | 16 | 145 | 5.28 |
Table 3.
The range analysis of the coating porosity.
| Mean Value (%) | Factors | |||
|---|---|---|---|---|
| Arc Current | Working Current | Spraying Distance | Plasma Gun Traversing Speed | |
| K1 | 3.93 | 5.32 | 4.86 | 4.09 |
| K2 | 3.91 | 3.39 | 4.52 | 3.91 |
| K3 | 4.58 | 3.74 | 3.61 | 3.90 |
| K4 | 4.59 | 4.55 | 4.00 | 5.08 |
| R = Kmax − Kmin | 0.68 | 1.93 | 1.25 | 1.18 |
Table 4.
The hardness of 16 specimens.
| Factors | Hardness (HV) | ||||
|---|---|---|---|---|---|
| Arc Current | Working Current | Spraying Distance | Plasma Gun Traversing Speed | ||
| 1 | 130 | 75 | 16 | 135 | 207.4 |
| 2 | 130 | 80 | 20 | 140 | 236.0 |
| 3 | 130 | 85 | 24 | 145 | 221.6 |
| 4 | 130 | 90 | 28 | 150 | 210.1 |
| 5 | 140 | 75 | 20 | 145 | 238.6 |
| 6 | 140 | 80 | 16 | 150 | 216.5 |
| 7 | 140 | 85 | 28 | 135 | 241.3 |
| 8 | 140 | 90 | 24 | 140 | 223.2 |
| 9 | 150 | 75 | 24 | 150 | 244.7 |
| 10 | 150 | 80 | 28 | 145 | 220.6 |
| 11 | 150 | 85 | 16 | 140 | 213.9 |
| 12 | 150 | 90 | 20 | 135 | 232.5 |
| 13 | 160 | 75 | 28 | 140 | 219.8 |
| 14 | 160 | 80 | 24 | 135 | 229.5 |
| 15 | 160 | 85 | 20 | 150 | 215.2 |
| 16 | 160 | 90 | 16 | 145 | 227.6 |
Table 5.
The range analysis of the coating hardness.
| Mean Value (HV) | Factors | |||
|---|---|---|---|---|
| Arc Current | Working Current | Spraying Distance | Plasma Gun Traversing Speed | |
| K1 | 218.8 | 227.6 | 216.3 | 227.7 |
| K2 | 229.9 | 225.7 | 230.6 | 223.2 |
| K3 | 227.9 | 223.0 | 229.8 | 227.1 |
| K4 | 223.0 | 223.3 | 222.9 | 221.6 |
| R = Kmax − Kmin | 11.1 | 4.6 | 14.2 | 6.1 |
Table 6.
The bonding strength of the 16 specimens.
| Factors | Bonding Strength (MPa) | ||||
|---|---|---|---|---|---|
| Arc Current | Working Current | Spraying Distance | Plasma Gun Traversing Speed | ||
| 1 | 130 | 75 | 16 | 135 | 45.6 |
| 2 | 130 | 80 | 20 | 140 | 53.5 |
| 3 | 130 | 85 | 24 | 145 | 58.3 |
| 4 | 130 | 90 | 28 | 150 | 46.9 |
| 5 | 140 | 75 | 20 | 145 | 60.3 |
| 6 | 140 | 80 | 16 | 150 | 63.7 |
| 7 | 140 | 85 | 28 | 135 | 72.6 |
| 8 | 140 | 90 | 24 | 140 | 65.4 |
| 9 | 150 | 75 | 24 | 150 | 70.4 |
| 10 | 150 | 80 | 28 | 145 | 53.7 |
| 11 | 150 | 85 | 16 | 140 | 46.4 |
| 12 | 150 | 90 | 20 | 135 | 51.6 |
| 13 | 160 | 75 | 28 | 140 | 52.3 |
| 14 | 160 | 80 | 24 | 135 | 58.7 |
| 15 | 160 | 85 | 20 | 150 | 62.4 |
| 16 | 160 | 90 | 16 | 145 | 56.1 |
Table 7.
The range analysis of the bonding strength.
| Mean Value (MPa) | Factors | |||
|---|---|---|---|---|
| Arc Current | Working Current | Spraying Distance | Plasma Gun Traversing Speed | |
| K1 | 51.07 | 57.15 | 52.95 | 57.13 |
| K2 | 65.50 | 57.40 | 56.95 | 54.40 |
| K3 | 55.52 | 59.92 | 63.20 | 57.10 |
| K4 | 57.38 | 55.00 | 56.38 | 60.85 |
| R = Kmax − Kmin | 14.43 | 4.92 | 10.25 | 6.45 |
Table 8.
The range analysis of comprehensive scoring.
| Comprehensive Scoring | Factors | |||
|---|---|---|---|---|
| Arc Current | Working Current | Spraying Distance | Plasma Gun Traversing Speed | |
| K1 | 70.47 | 75.70 | 71.20 | 75.33 |
| K2 | 79.90 | 74.85 | 75.95 | 73.02 |
| K3 | 74.72 | 75.69 | 78.63 | 75.14 |
| K4 | 74.67 | 73.53 | 73.98 | 76.28 |
| R = Kmax − Kmin | 9.43 | 2.16 | 7.43 | 3.26 |
Disclaimer/Publisher’s Note: The statements, opinions and data contained in all publications are solely those of the individual author(s) and contributor(s) and not of MDPI and/or the editor(s). MDPI and/or the editor(s) disclaim responsibility for any injury to people or property resulting from any ideas, methods, instructions or products referred to in the content. |
© 2023 by the authors. Licensee MDPI, Basel, Switzerland. This article is an open access article distributed under the terms and conditions of the Creative Commons Attribution (CC BY) license (https://creativecommons.org/licenses/by/4.0/).
Share and Cite
MDPI and ACS Style
Wang, S.; Chen, S.; Liu, M.; Huang, Q.; Liu, Z.; Li, X.; Xu, S. The Effect of Plasma Spray Parameters on the Quality of Al-Ni Coatings. Coatings 2023, 13, 2063. https://0-doi-org.brum.beds.ac.uk/10.3390/coatings13122063
AMA Style
Wang S, Chen S, Liu M, Huang Q, Liu Z, Li X, Xu S. The Effect of Plasma Spray Parameters on the Quality of Al-Ni Coatings. Coatings. 2023; 13(12):2063. https://0-doi-org.brum.beds.ac.uk/10.3390/coatings13122063
Chicago/Turabian StyleWang, Shenglian, Shuang Chen, Ming Liu, Qinghua Huang, Zimo Liu, Xin Li, and Shaofeng Xu. 2023. "The Effect of Plasma Spray Parameters on the Quality of Al-Ni Coatings" Coatings 13, no. 12: 2063. https://0-doi-org.brum.beds.ac.uk/10.3390/coatings13122063
Note that from the first issue of 2016, this journal uses article numbers instead of page numbers. See further details here.