
Physicomechanical Properties of Gypsum with Mineral Additions at Elevated Temperatures


1
Department of Civil Engineering, Tsinghua University, Beijing 100084, China
2
Department of Civil Engineering, Xi’an Jiaotong-Liverpool University, Suzhou 215123, China
*
Author to whom correspondence should be addressed.
Coatings 2023, 13(12), 2091; https://0-doi-org.brum.beds.ac.uk/10.3390/coatings13122091
Submission received: 3 November 2023
/
Revised: 4 December 2023
/
Accepted: 4 December 2023
/
Published: 15 December 2023
(This article belongs to the Special Issue Effective Coating Barriers for Protection of Reinforced Concrete)
Abstract
:Gypsum, from either nature or industrial by-products, can be a lower-cost and cleaner alternative binder to Portland cement used in construction projects, such as affordable housing in developing countries. Although various building products have successfully used gypsum as the binder, some drawbacks of this material have still been claimed, for example, in the aspects of mechanical strength and some other physical properties. Using mineral additions to gypsum seems to be a possible solution to create composite gypsum with improved properties. This work has investigated the possibility of two common minerals (silica flour and talc powder) in modifying composite gypsum’s physical and mechanical performance at elevated temperatures (100–1100 °C), including hydration, strength, thermal conduction and stability, and microstructure. The results suggest that 10% gypsum replacement by silica flour or talc powder modifies gypsum’s physical and mechanical properties, with silica flour performing better than talc powder. The performance of composite gypsum at elevated temperatures depends on the treatment temperature and reflects the combined effects of gypsum phase change and the filler effects of silica flour or talc powder. Thermal treatment at ≤200 °C increased the thermal resistance of all gypsum boards but decreased their compressive strength. Thermal treatment at ≥300 °C significantly increased the compressive strength of gypsum with silica flour and talc powder but induced intensive microcracks and thus failed the thermal insulation. This investigation indicates that silica flour can potentially raise the mechanical performance of gypsum. At the same time, talc powder can hold water and lubricate, which may help with the continuous hydration of gypsum phases and the rheology of its mixtures.
1. Introduction
Portland cement has been the leading cementitious material for construction worldwide. It will likely dominate for the following decades, given that it is complicated, if not impossible, to replace Portland cement with alternative cement entirely [1,2]. Still, considering the many environmental impacts of using Portland cement and its relatively high cost in developing countries, other cementitious materials with lower prices and easier local availability may increasingly be used in construction, such as for low-cost houses [3]. Gypsum can be a cementitious material as it can be sourced from nature in many countries or from various industries where gypsum is produced as solid waste [4]. Other local materials, e.g., silicate and clay minerals, can also be combined with gypsum as fillers to prepare binders with improved properties [5,6,7].
Gypsum has been successfully used in multiple construction fields, such as cement production, interior panels and decorations, and self-leveling composites. Gypsum boards also have fire-resistance capacity owing to their phase change from gypsum dihydrate (CaSO4·2H2O) to hemihydrate (CaSO4·0.5H2O) and anhydrite (CaSO4) when exposed to fire or intense heat [8]. These states could be interchangeable depending on the thermal exposure and availability of moisture. The phase change process usually comes with water vapor release and pore structure change, leading to decreased heat conduction and possibly enhanced strength in the gypsum building elements, extending their protection time before structural collapse during the fire. In addition, gypsum is a renewable resource that can be obtained through recycling construction waste, among other methods. In addition, gypsum has relatively low raw material costs and production costs compared to cement. Furthermore, the manufacturing process of gypsum requires less energy than that of cement, which helps reduce the carbon footprint and environmental impact.
However, the properties of gypsum may be further improved in aspects such as the processing time of fresh mixtures [9], mechanical strength [10], and thermal stability after exposure at elevated temperatures [11], making it more suitable for use in housing projects. Bicer and Kar [12] used expanded polystyrene and tragacanth within gypsum mixtures, finding that the thermal conductivity and compressive strength decreased simultaneously. Gencel et al. [13] reported an effective way to improve mechanical and thermal resistance by adding diatomite and polypropylene fibers. Camarini et al. [14] and Lanzón and García-Ruiz [15] added citric acid to the gypsum plaster to improve its workability and physical properties. Khalil et al. [16] reported that adding natural sand, silica fume, and anhydrous silica gel could improve gypsum plaster composites’ physical and mechanical properties. They also indicated that some waste additives, such as unburnt rice husk, blast furnace slag, calcium carbonate, and polyvinyl alcohol polymer, could improve gypsum’s mechanical properties. Pundir et al. [17] reported that a sulfonated melamine formaldehyde condensate-based superplasticizer could accelerate the hydration of gypsum and form a dense and compacted structure of gypsum plaster. Tokarev et al. [18] added single-wall carbon nanotubes with Portland cement, microsilica, and metakaolin to the gypsum plaster. They reported that the microstructure and mechanical properties were improved in the gypsum. Zhu et al. [19] reported a significant improvement in the mechanical properties of gypsum-based composites with the addition of polyvinyl alcohol and polypropylene fibers. Sophia and Sakthieswaran [6] showed that gypsum plaster with enhanced water and thermal stability could be produced through the addition of zeolite (natural and calcined) and shell powders (egg, conch, cuttlebone, and scallop).
This work investigated the possibility of adding two regular minerals, silica flour and talc powder, to gypsum pastes, intending to improve gypsum’s physical and mechanical performances. These two types of minerals are readily available in many parts of the world and have been generally used in cementitious material fields as mineral fillers [20,21,22,23]. Silica flour can also be equivalently obtained in the manufactured sand industry as a by-product (sand dust), the fine residue from crushing rocks into manufactured sand for construction use [24]. As a hydrated magnesium silicate clay mineral, talc powder demonstrated the potential of being incorporated into cementitious compositions owing to its properties such as water absorption [25,26] and lubrication [27] that may help with the hydration and rheology of cementitious systems. This study was focused on the physical and mechanical aspects of blended gypsum paste with silica flour and talc powder additions. It also looked at gypsum property changes after being treated at elevated temperatures. The properties investigated included compressive strength, thermal conductivity, weight loss, phase assemblage, and the composite gypsum paste microstructure to prove the concept.
2. Experimental Program
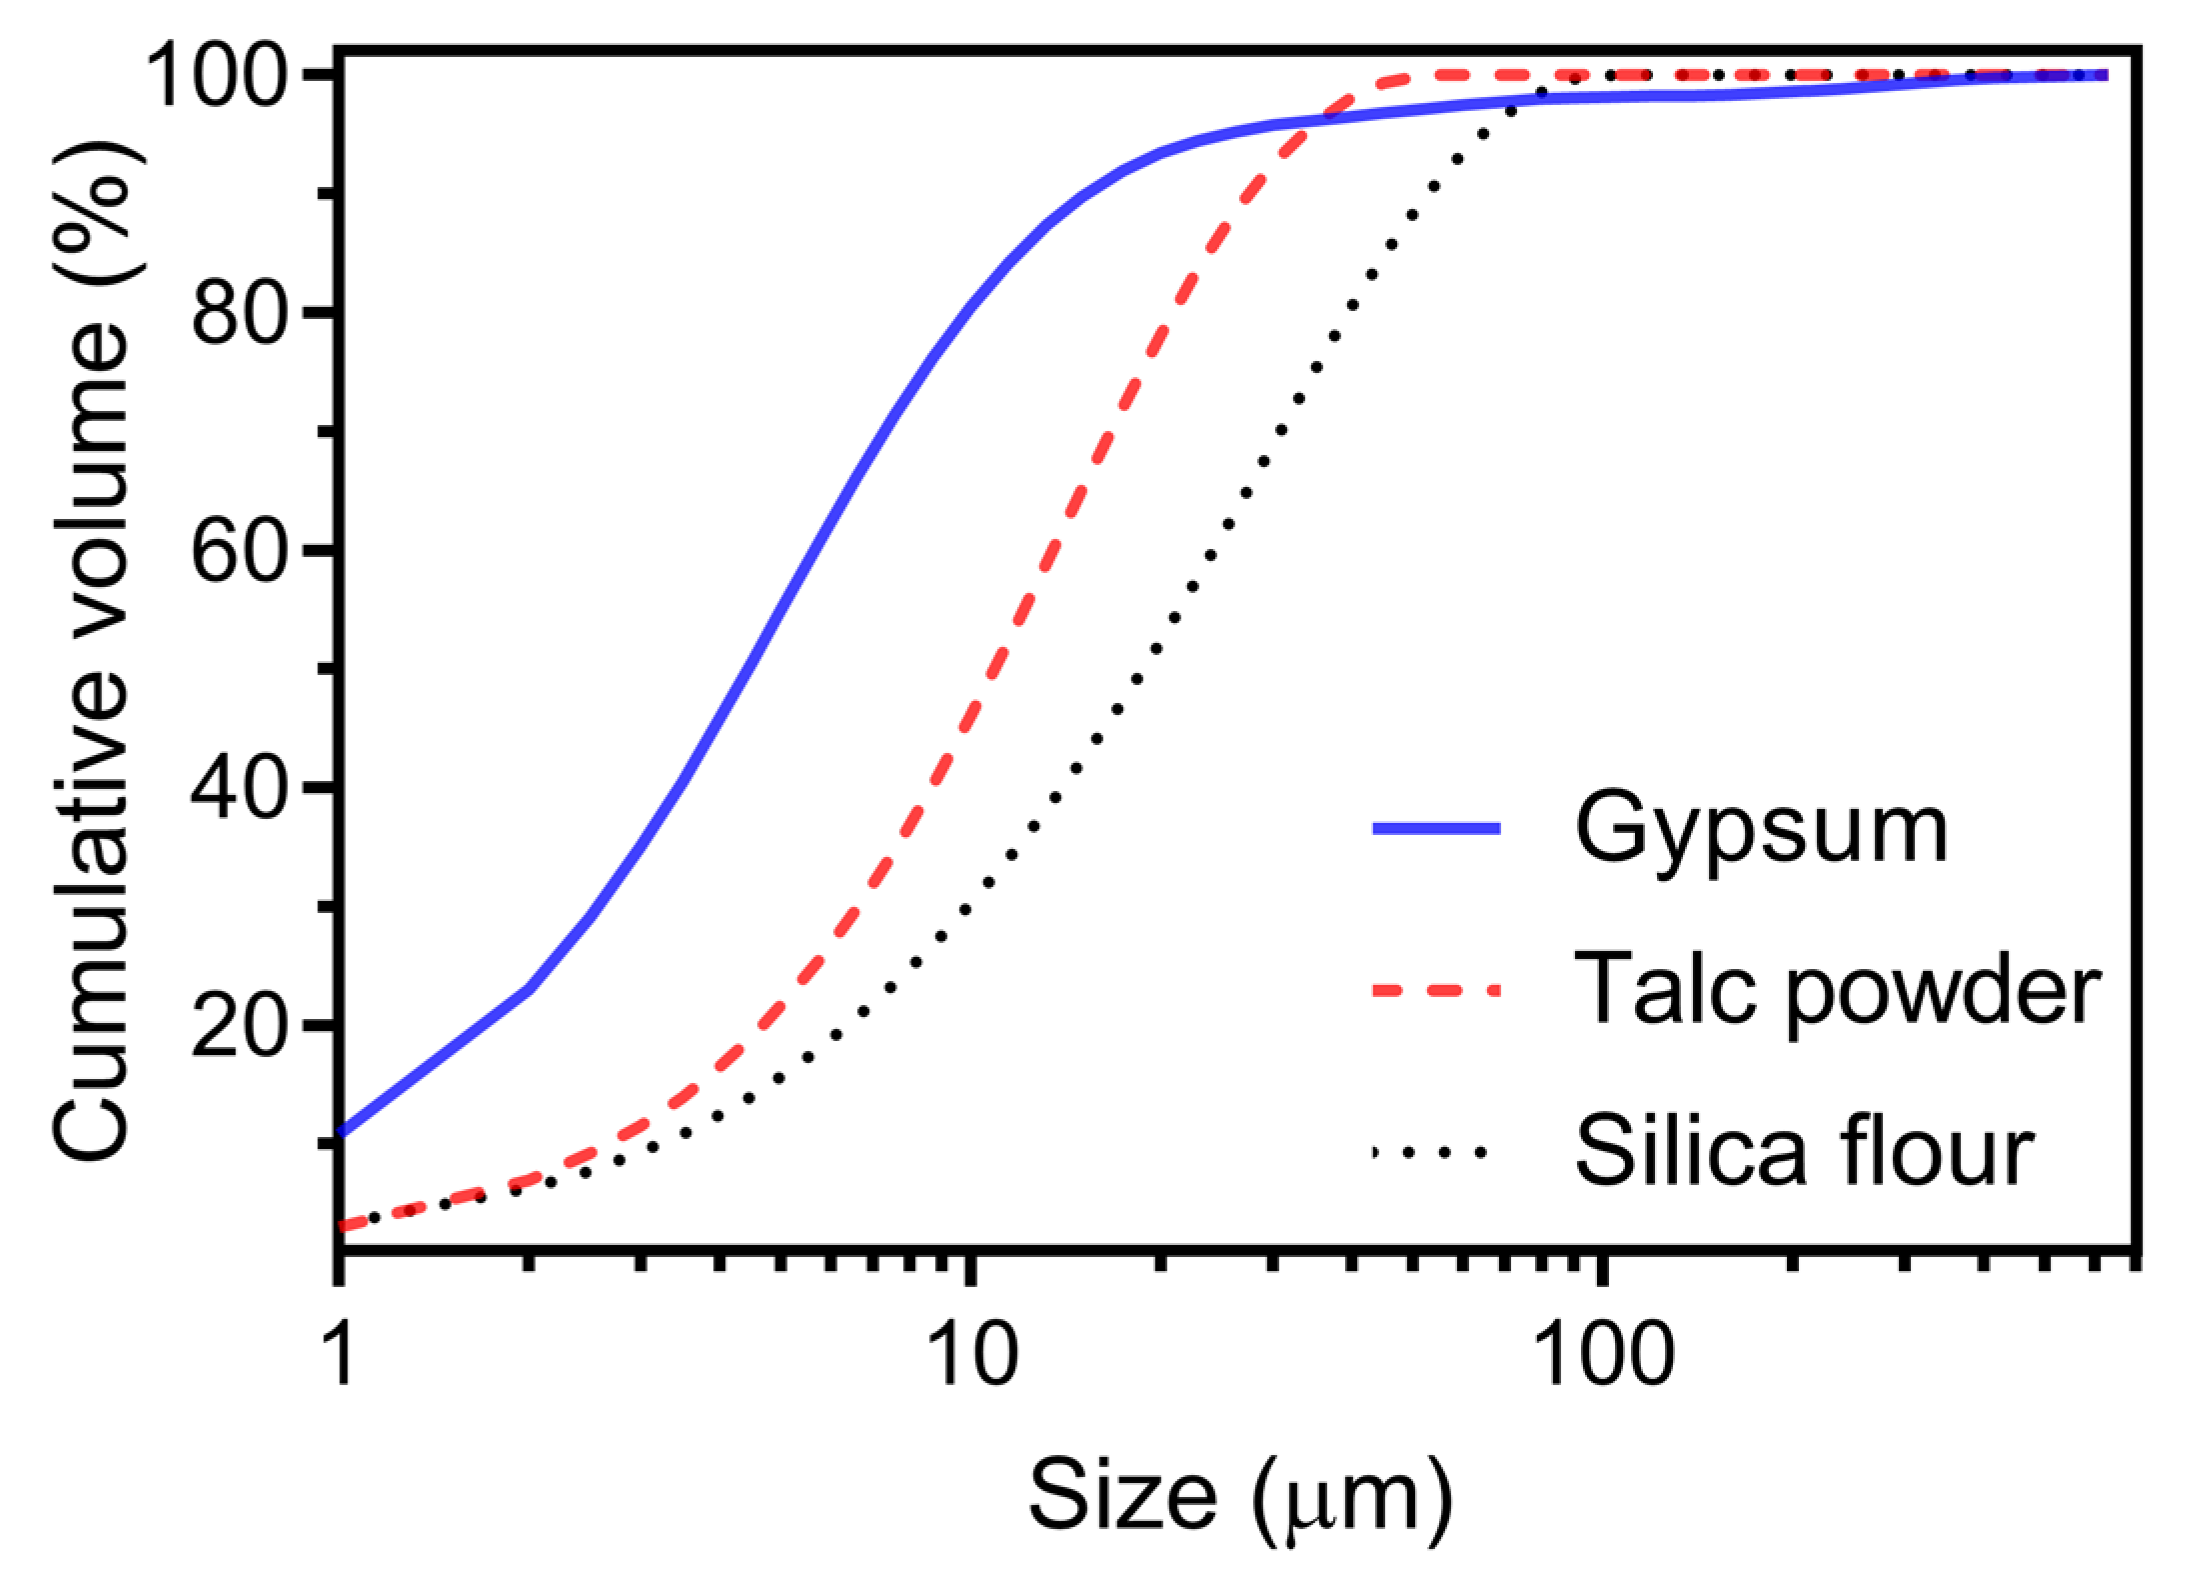
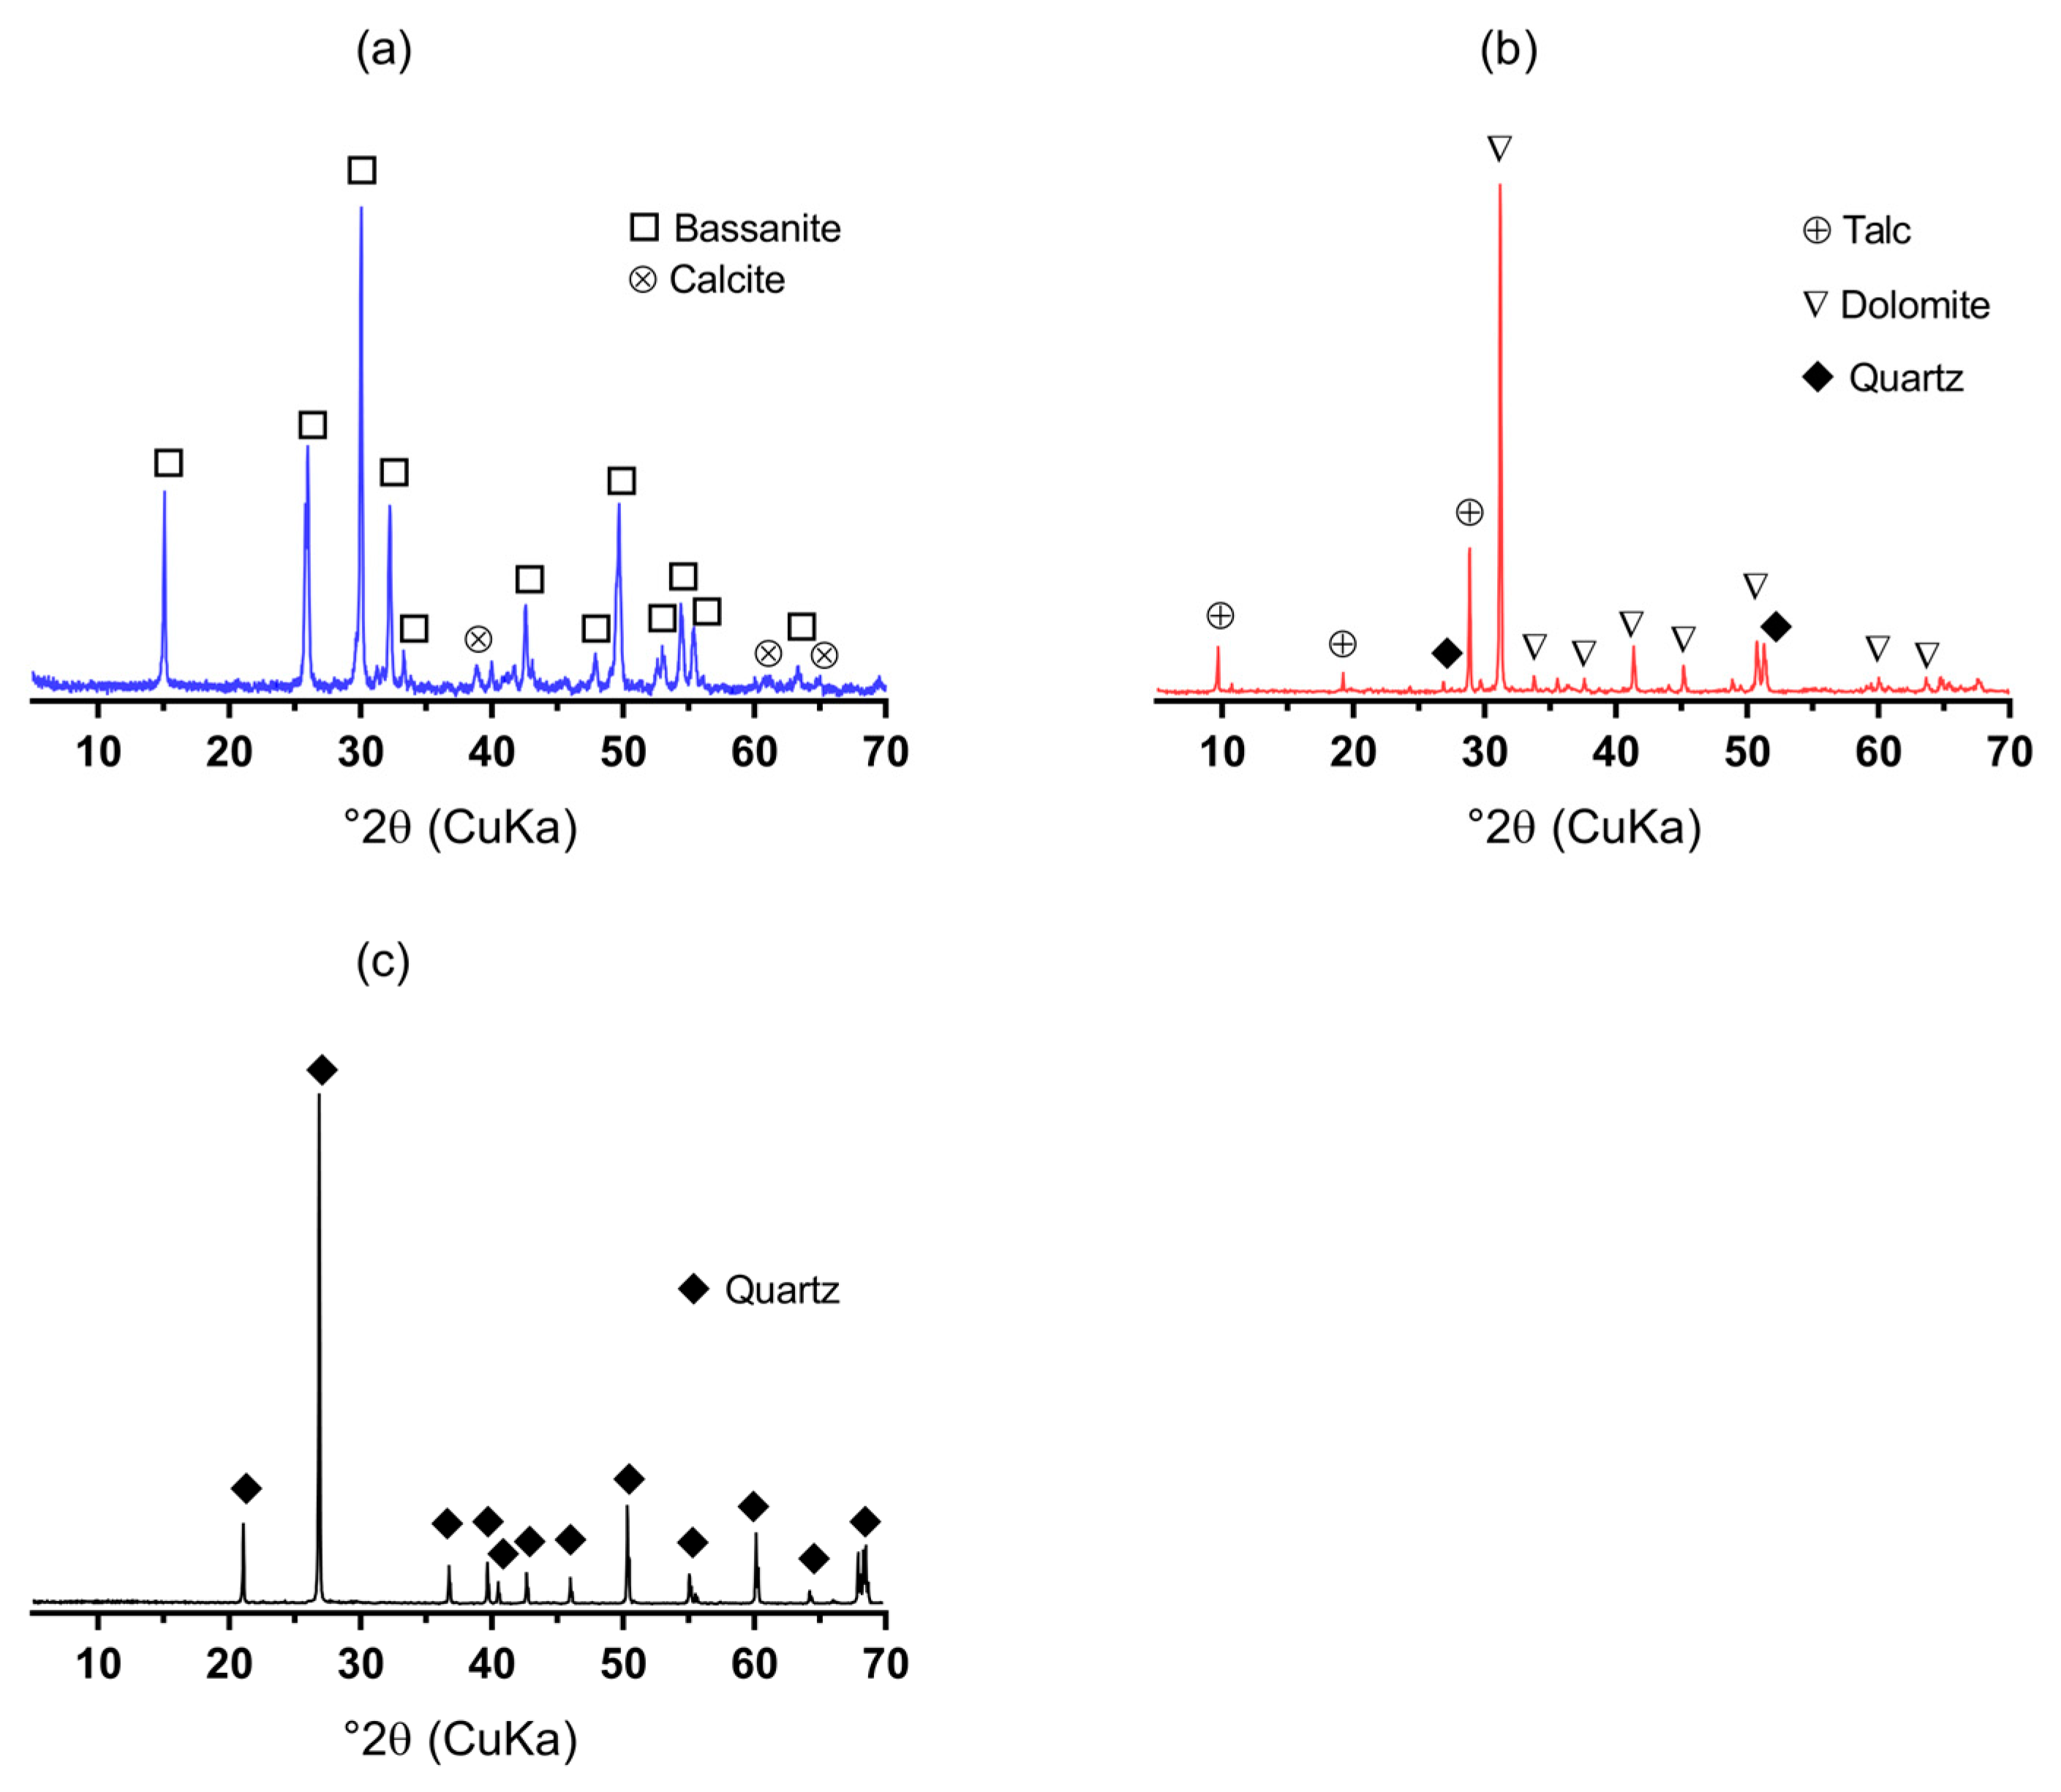
Raw materials: Gypsum powder, talc powder, and silica flour were used as received from local suppliers. The samples were dried in a vacuum drying oven at 40 °C for 48 h, followed by sieving through 200 mesh screens to obtain the specimens intended for XRD and XRF analysis. Table 1 shows their rough chemical compositions measured by an X-ray fluorescence (XRF) spectrometer (Rigaku NEC GC). Gypsum has the oxides CaO and SO3, while talc includes CaO, SiO2, and MgO, and silica flour has SiO2 as the main compositional component. Figure 1 shows that gypsum powder has the smallest particle size on average, followed by talc powder and silica flour. Figure 2 plots the XRD patterns of the three minerals, indicating that gypsum powder mainly contains hemihydrate (CaSO4·0.5H2O) and some calcite, while talc powder has talc and dolomite together with some quartz, and, lastly, silica flour contains quartz entirely. The high LOI in gypsum and talc powder could be due to the existence of moisture absorbed from the air.
Gypsum paste preparation: Three types of gypsum pastes were prepared in this work. The first one, made with pure gypsum, was used as the reference (named GYP). TAC and SIL were blended gypsum pastes made with 90 wt% gypsum and 10 wt% talc powder or silica flour, respectively. The water content was constant at 60% by powder mass in the paste. To prepare the mixture, gypsum powder and talc powder (or silica flour) were dry-mixed well for 1 min in a lab mixer at a medium mixing speed. After that, deionized water was added to the dry blend and mixed with high shear for 2 min until completion. The fresh paste was cast immediately into cube molds (25 mm × 25 mm × 25 mm) and slab molds (300 mm × 300 mm × 25 mm) and then vibrated for 10 s to remove entrained air bubbles. The samples’ curing was conducted in an environmental chamber at 20 °C and 97% R.H. The specimens were de-molded after 24 h of curing. Three samples were prepared for each group for the measurement of physical properties.
Thermal treatment: The samples were heated at a rate of 10 °C/min from room temperature to a target temperature. The target temperature was then held for 6 h before cooling back to room temperature. The target temperatures selected in this study were 100 °C, 200 °C, 300 °C, 600 °C, and 1100 °C. The samples kept at room temperature (about 25 °C) were used as references.
Hydration heat: The hydration heat flow rate and total heat of hydration of the gypsum pastes were recorded by a standard isothermal calorimeter (Calmetrix I-Cal 8000). A total of 20 g of powder (pure gypsum, gypsum with silica flour, or gypsum with talc powder) and 12 g of deionized water were mixed manually for 30 s in the measurement cell. After that, the cell was immediately sealed and loaded into the calorimeter chamber. The hydration heat was monitored for 72 h.
Thermal conductivity: A standard heat flow meter in the field (TA instruments NETZSCH HFM 436/3/1 E Lambda) was utilized to measure the thermal conductivity of the slab samples (300 mm × 300 mm × 25 mm) after being treated at elevated temperatures. During the measurement, the temperature of the testing chamber was maintained at 25 °C.
Compressive strength: A universal testing machine was used to compress cube specimens (25 mm × 25 mm × 25 mm) for their strengths. The compression was operated in a displacement control mode with a loading rate of 0.02 mm/s. The compressive strength was based on the average of three values.
Thermogravimetric analysis (TGA): The TGA tests were conducted using a simultaneous thermogravimetric analyzer (Hitachi STA7300). About 10 mg of the grounded powder sample was loaded into a platinum pan, with another empty platinum pan used as the reference in the machine furnace [28,29]. The furnace was stabilized for 30 min to reach the isothermal condition (at 25 °C), followed by rising its temperature to 900 °C at a 10 °C/min rate. The nitrogen gas flow was the protection medium in the furnace during the testing of samples.
X-ray diffraction (XRD) and scanning electron microscopy (SEM): The selected gypsum paste sample (around 2 g) was manually ground in a laboratory mortar and pestle set with about 1 g of fine powder for XRD analysis. A standard diffractometer using Kα radiation was used to conduct the analysis. The sample underwent 10 scans in each measurement with the 2θ from 5° to 70° (PIXcel detector), which were performed using a PANalytical Empyrean diffractometer and operating at 45 kV and 40 mA in a Bragg–Brentano geometry. The SEM (Quanta 450 FEG) tests were conducted on selected sample pieces of gypsum paste. After being coated with gold for 240 s, each specimen was observed in the microscope chamber with a high vacuum and secondary electron mode for micromorphology.
3. Experimental Results
3.1. Hydration Heat
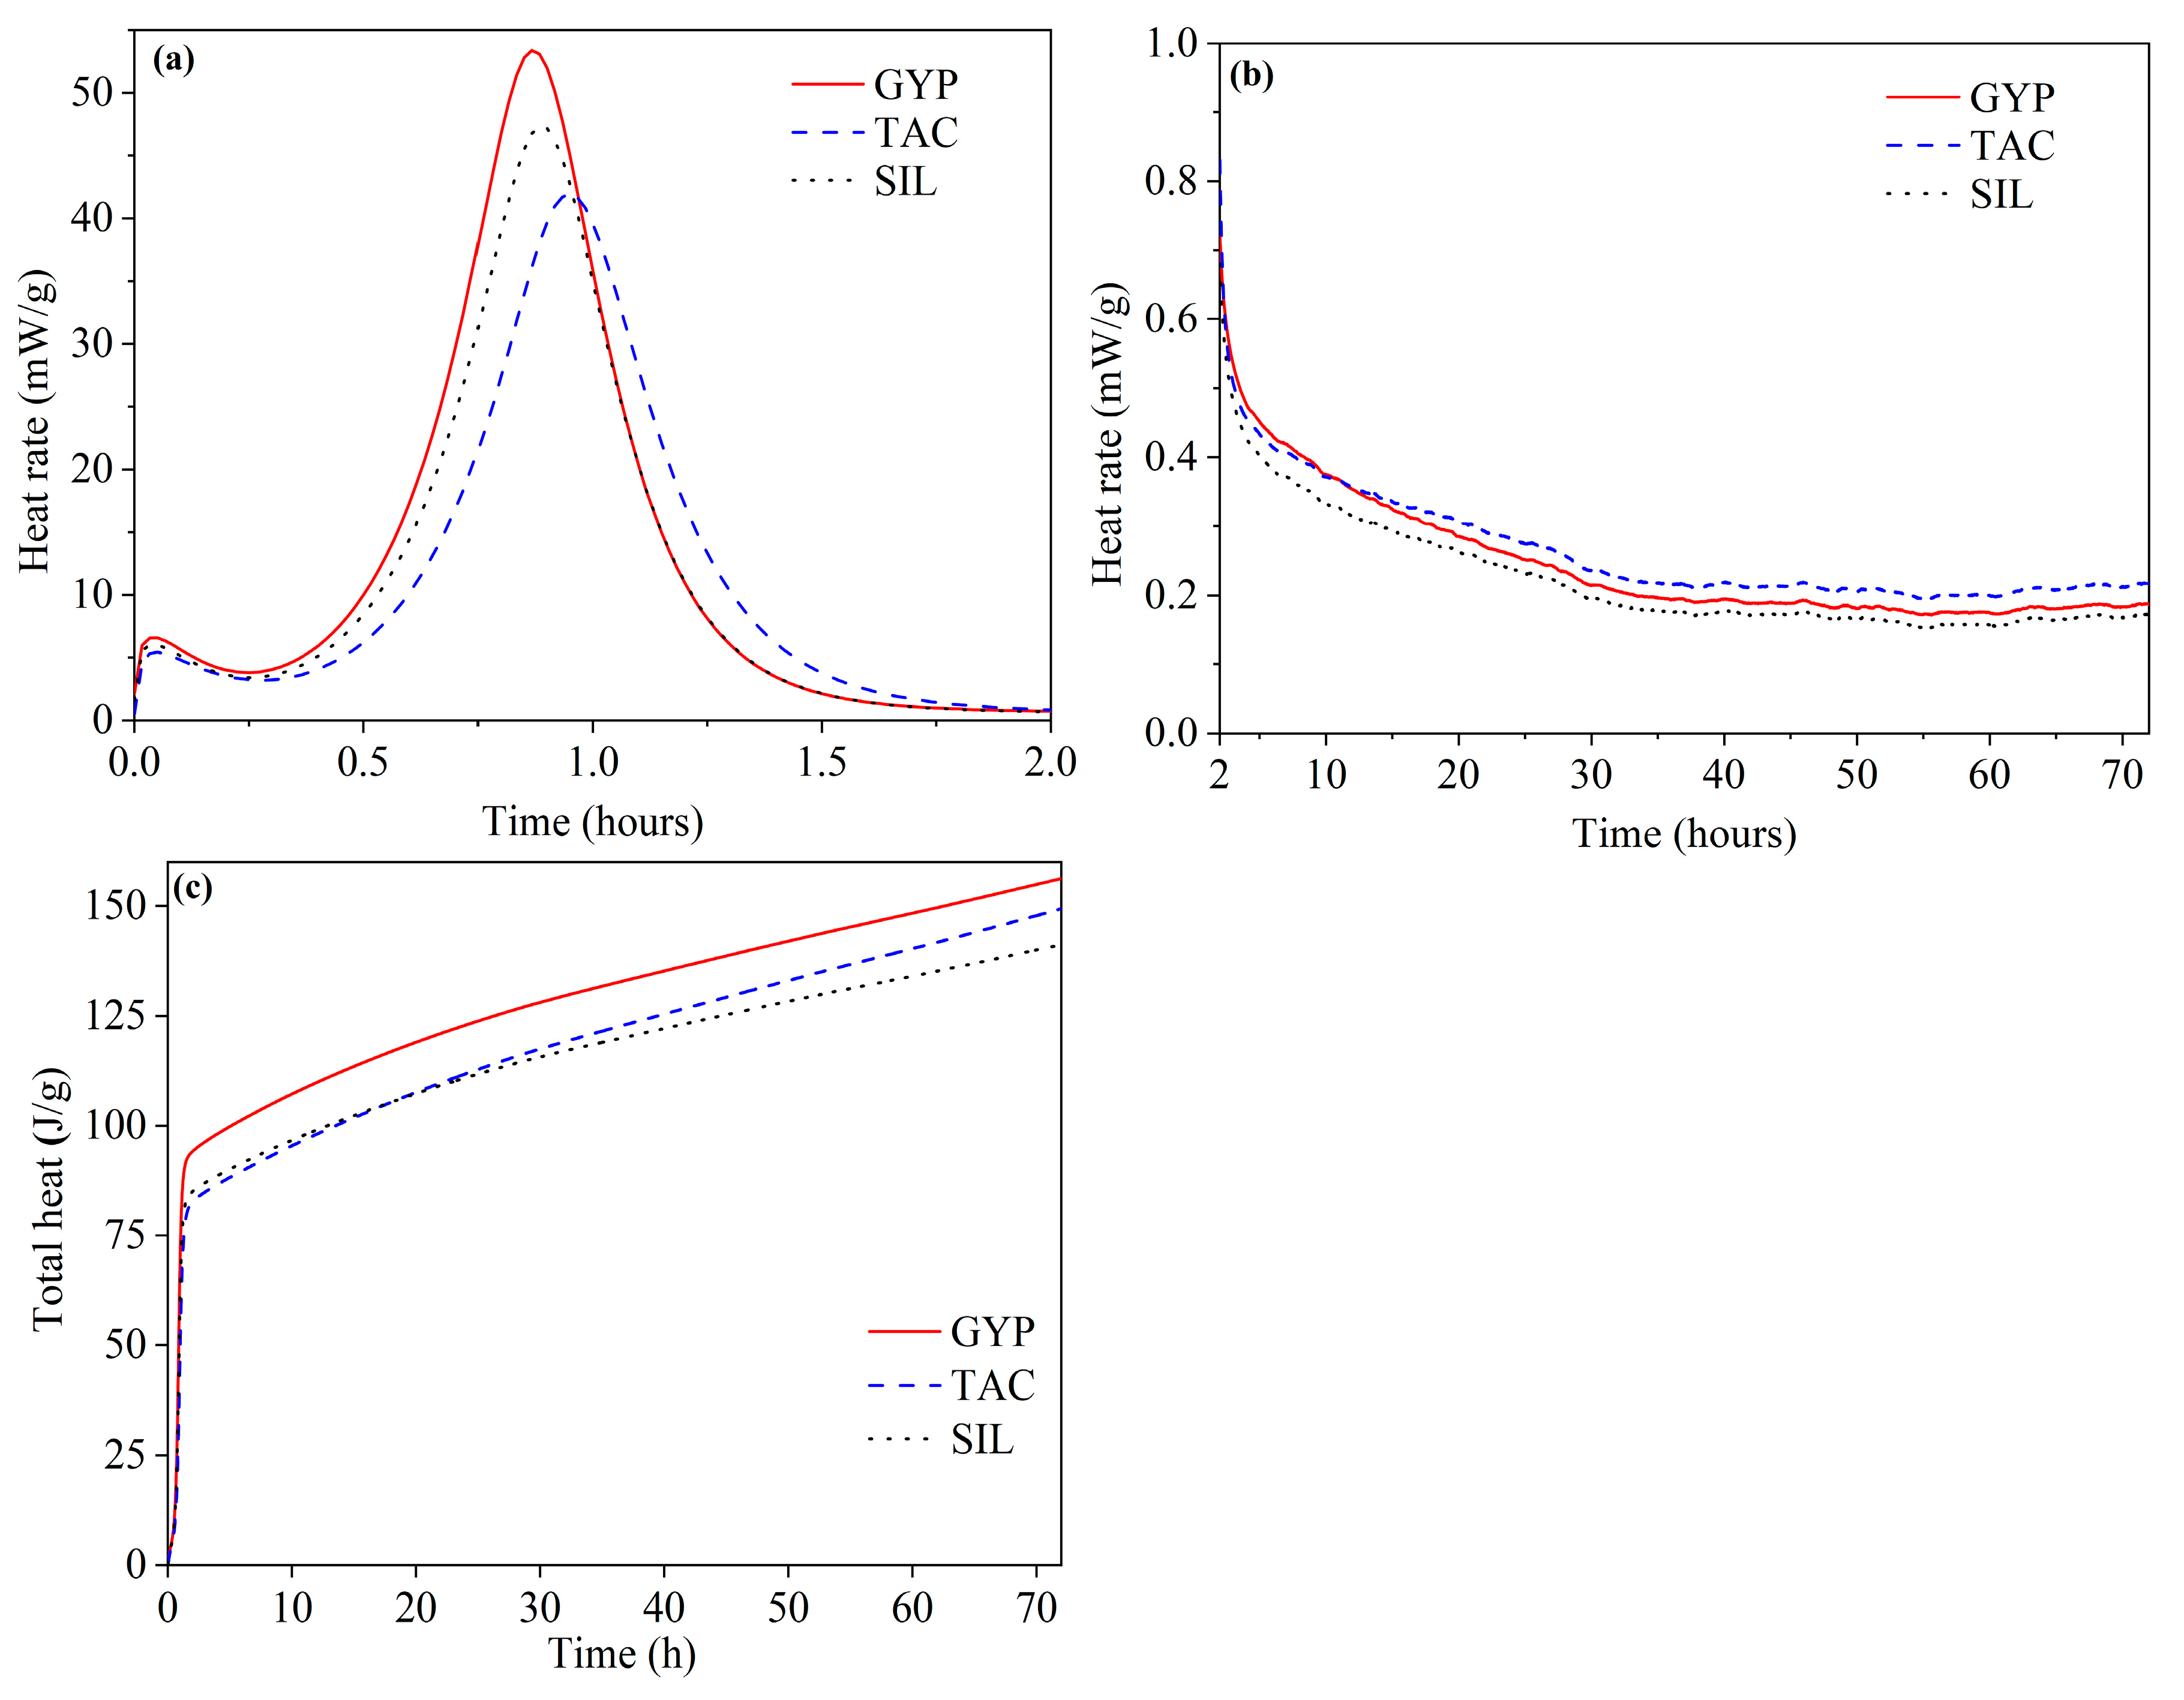
Figure 3 shows the heat flow rate and total released heat of hydration of the three gypsum mixtures (GYP, TAC, and SIL). The heat flow rate within and after 2 h is presented separately in Figure 3a,b to clearly show their different trends. Figure 3a shows that the first peak at 2–3 min indicates the initiation of gypsum dissolution in water. The second peak demonstrates that gypsum hydrates with water, which generates lots of heat [30,31]. Both peak heights were reduced when the gypsum was replaced by talc powder or silica flour compared to the pure gypsum mixture (GYP). The peak appearance time was also delayed in the TAC and SIL mixtures. The peak appeared 2 min and 5 min later in the SIL and TAC mixtures, respectively, than in the GYP mixture. The peak height value of the SIL mixture was higher than that of the TAC mixture, indicating that silica flour performed better on gypsum hydration than talc powder.
After about 10 h, as shown in Figure 3b, the TAC mixture exhibited the highest heat flow rate among the three (even higher than the pure gypsum mixture, GYP). The delayed hydration was the main reason for this phenomenon, and there was relatively more gypsum to hydrate after 10 h than in the other two mixtures. Figure 3c demonstrates the total related heat from the three mixtures during the 72 h of hydration. The TAC mixture started to generate more hydration heat than the SIL mixture at around the 25 h mark, continuing until the 72 h mark. This finding might reveal the role of talc powder in promoting the later-stage hydration of gypsum, possibly due to the release of absorbed water from talc that supported the continuous hydration of gypsum, similar to the well-known concept of internal curing in the field [32].
3.2. Compressive Strength
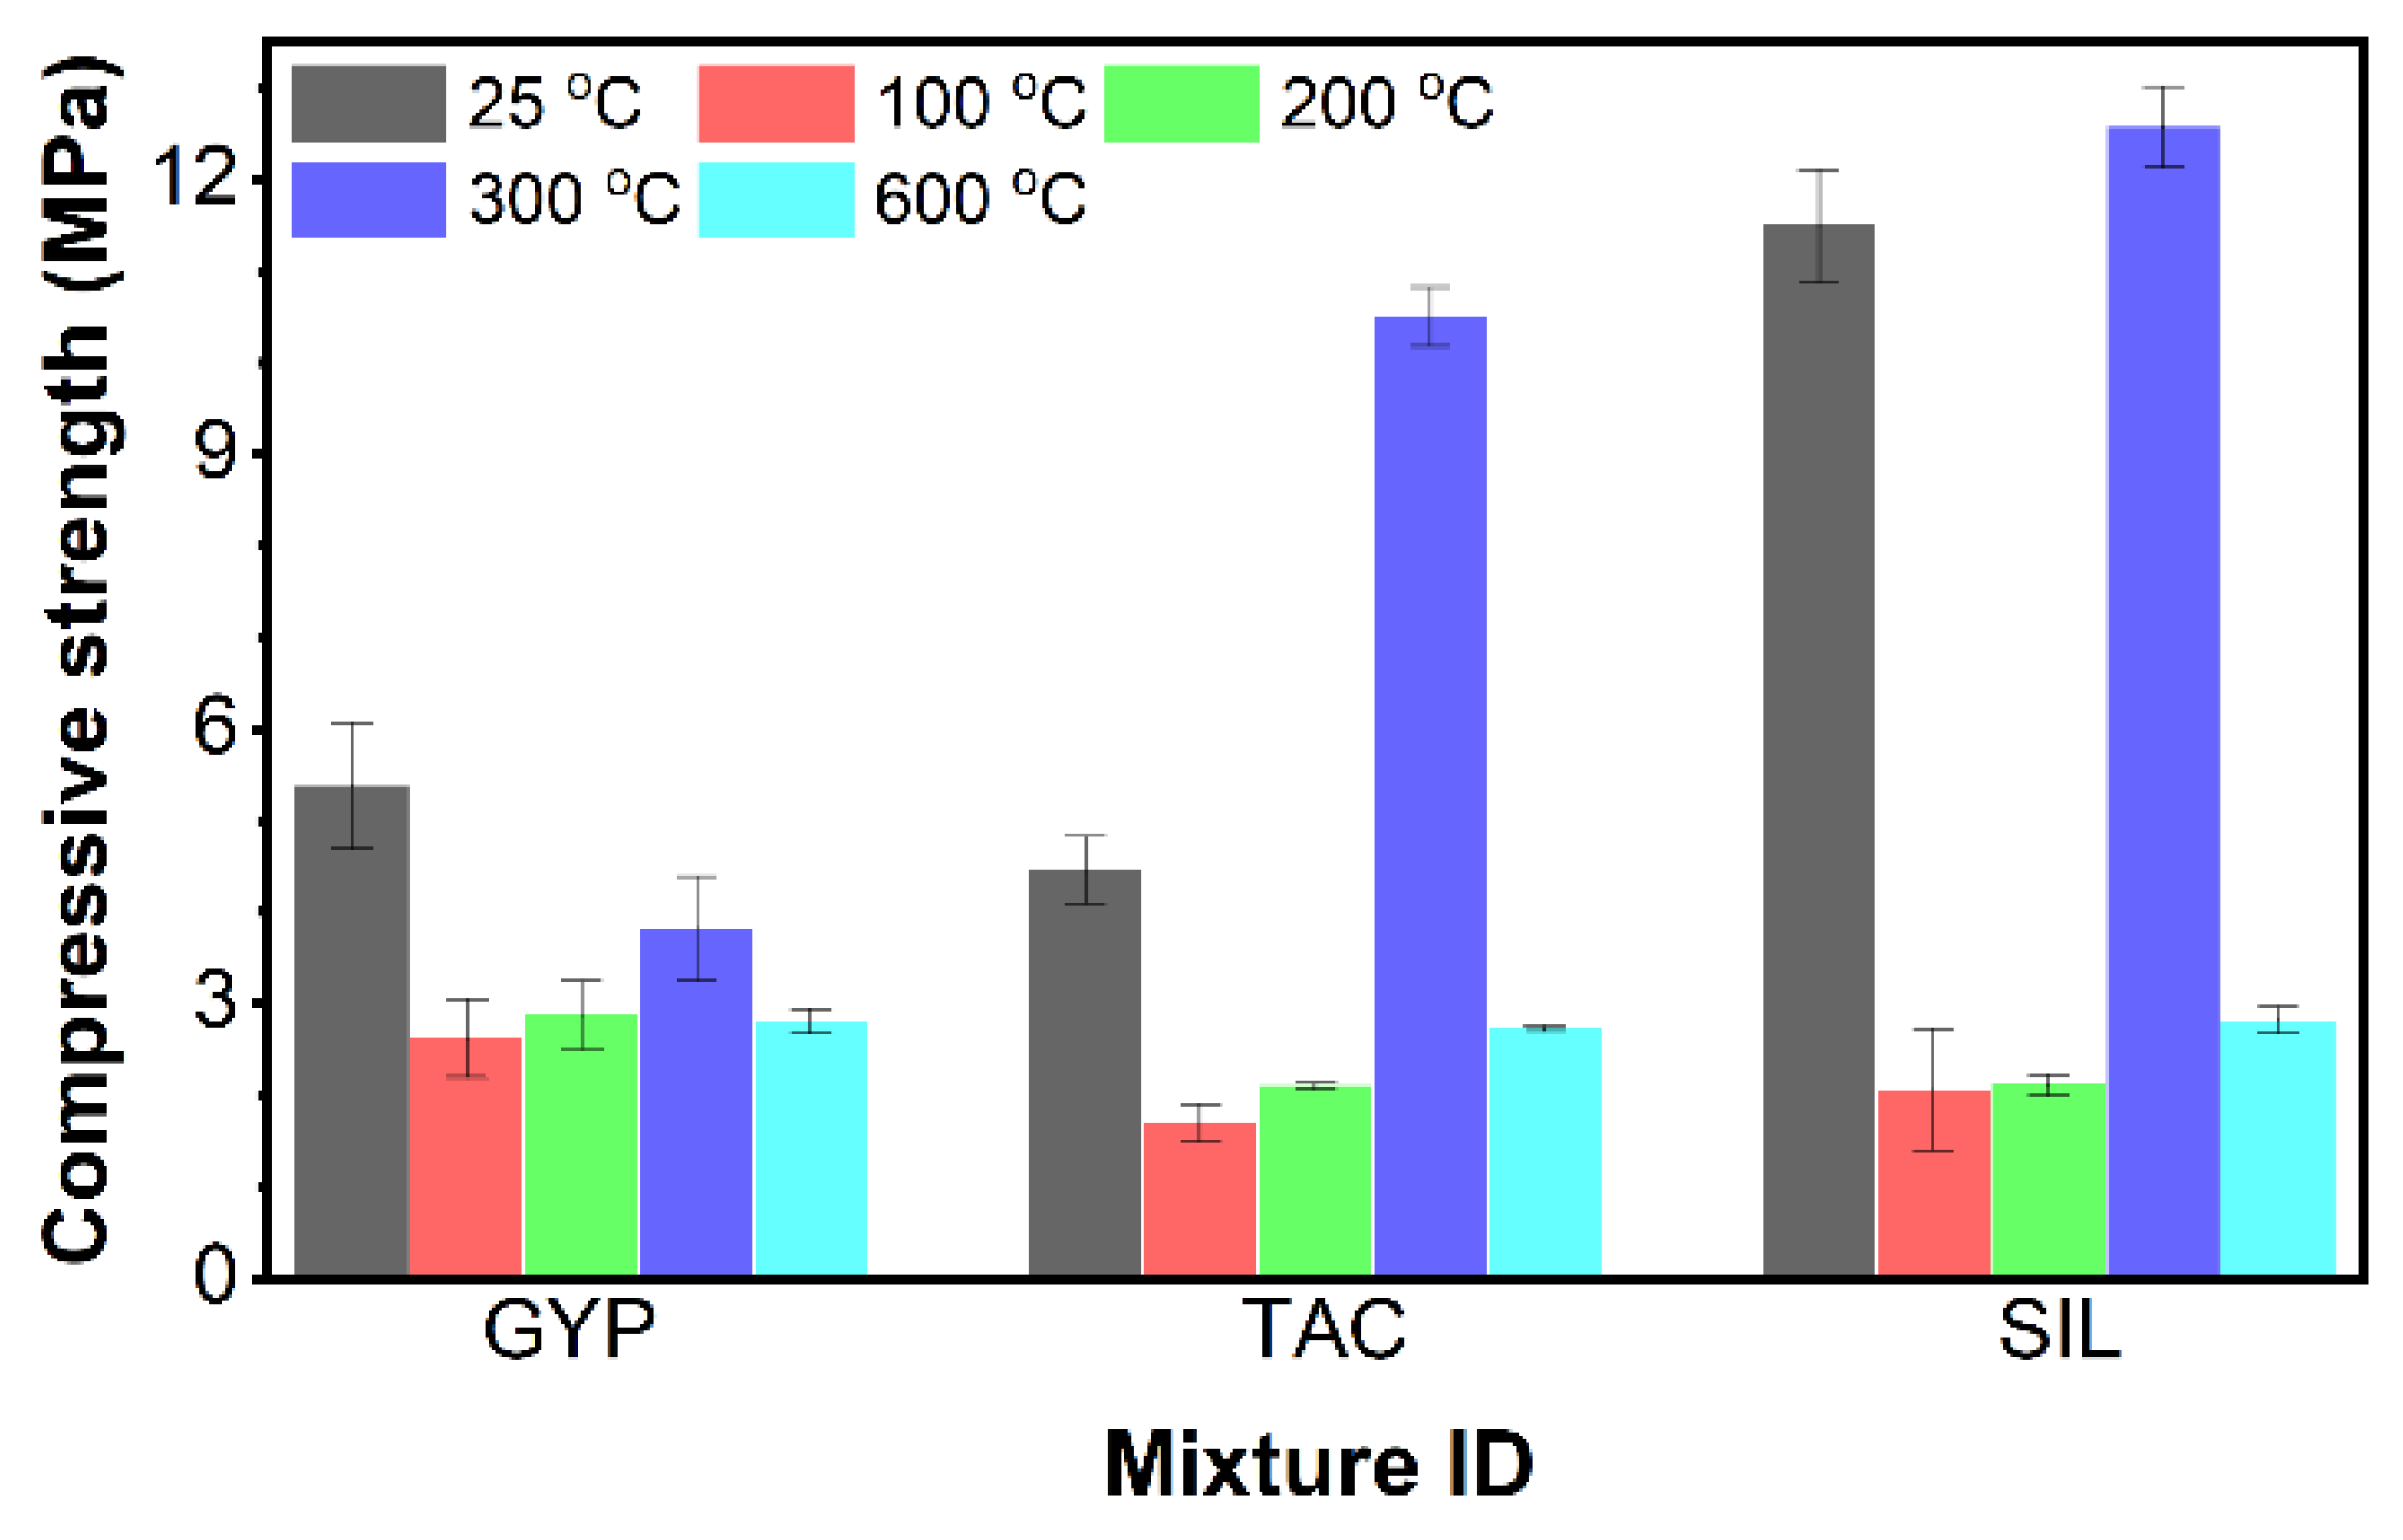
Figure 4 shows the compressive strength of gypsum pastes at elevated temperatures, with the standard temperature (25 °C) as the reference. The results at 1100 °C were unavailable because significant macrocracking formed in the specimen after the treatment. It can be seen that, at 25 °C, SIL samples had the highest strength among the three, more than twice that of GYP. The TAC samples had slightly lower compressive strength than the GYP samples. This result suggested that adding silica flour was influential in developing high-strength gypsum mixtures, possibly due to the higher hardness of silica than gypsum. Also, the average particle size of silica flour was bigger than that of gypsum, as shown in Figure 1. Thus, silica flour particles performed as a solid skeleton that increased the strength of the gypsum matrix [33]. Talc powder, however, was softer than gypsum, and, more importantly, it had physically adsorbed water on the particle surface due to its water-absorbing nature. Therefore, the interfacial region of talc and gypsum negatively influenced the strength of gypsum from this perspective.
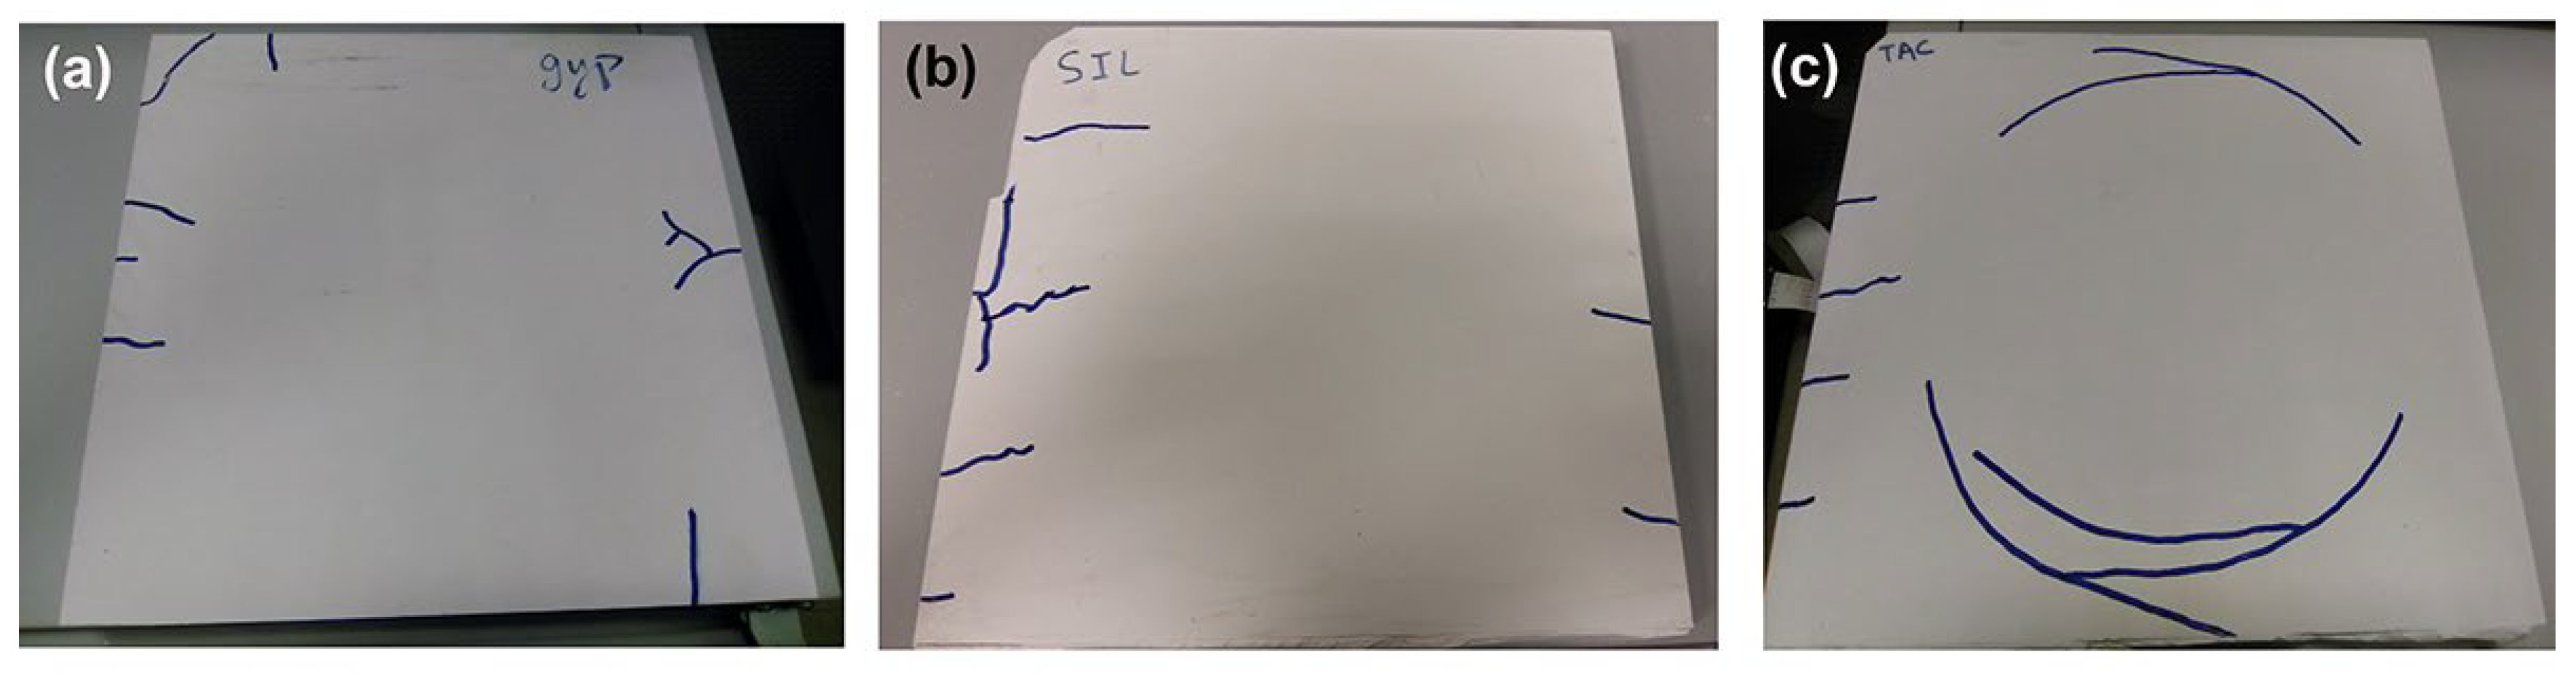
With the increase in treatment temperature, the strength of all specimens decreased at 100 °C and 200 °C but increased remarkably at 300 °C and then decreased again at 600 °C. There was tremendous pore water loss, and gypsum dehydration happened at 100 °C and 200 °C, leading to a porous structure that weakened the strength of the gypsum matrix. After the 300 °C treatment, the dehydration of gypsum was likely completed, forming a more robust anhydrate phase that increased the strength of the gypsum matrix [11]. Also, talc particles lost their physically adsorbed water after the temperature treatment, turning into surface-dry fillers better embedded into the gypsum matrix [25]. Silica flour worked similarly to talc powder but contributed more to the strength of gypsum owing to its higher hardness. Furthermore, Figure 5 shows the microcracking (highlighted in blue) on the gypsum specimens after the 300 °C treatment, which might have contributed to energy and stress dissipation, particularly considering the strength of the gypsum matrix increased after the 300 °C treatment. The 600 °C treatment, however, developed detrimental microcracks in the specimens and thus significantly decreased their compressive strength values.
3.3. Thermal Conductivity, Weight Loss, and Shrinkage
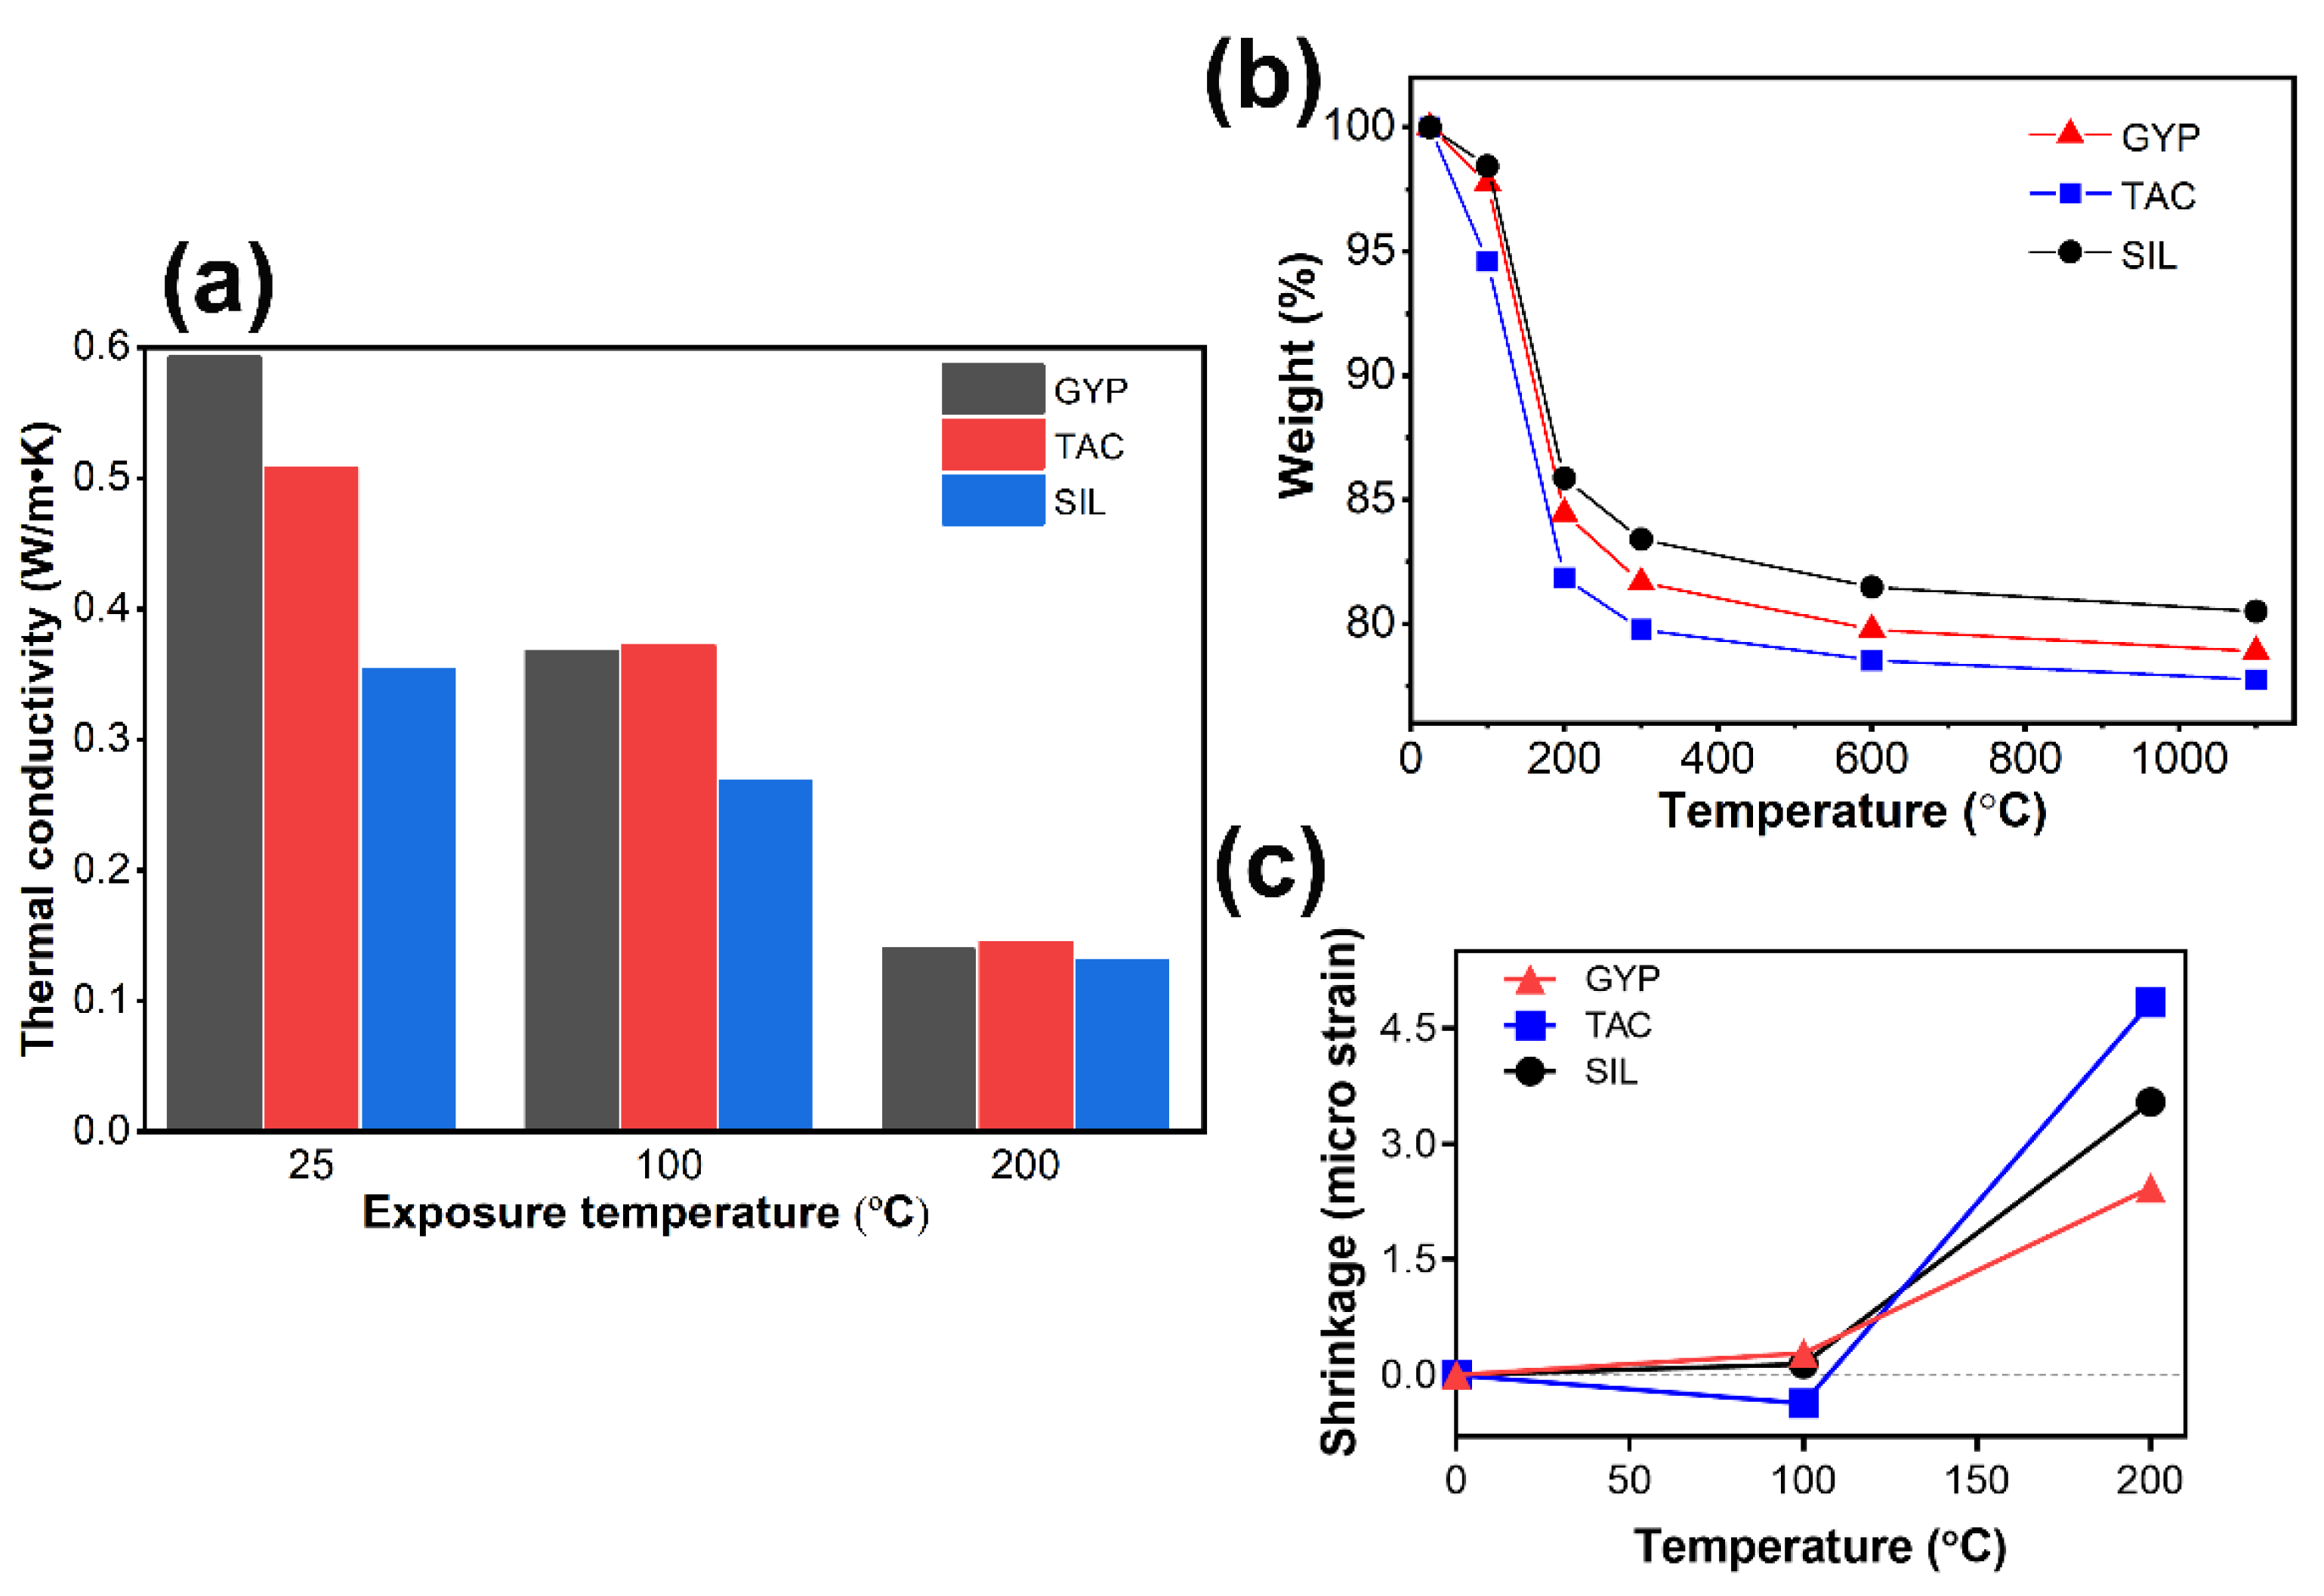
Figure 6a shows the thermal conductivity of gypsum specimens after being treated at 100 °C and 200 °C (25 °C as the reference). The specimens treated at 300 °C were not measurable due to the thermal cracking that affected the heat flow testing. At 25 °C (without heat treatment), the thermal conductivity of GYP specimens was the highest among the three, followed by the TAC and SIL specimens. The reason could be the more homogeneous structure and composition in the GYP matrix, which encouraged heat conduction. Talc powder’s water adsorption was responsible for the higher thermal conductivity of TAC specimens than SIL. After the 100 °C treatment, all samples demonstrated reductions in thermal conductivity because the gypsum’s dehydration left a porous structure in the matrix [34]. The GYP and TAC specimens performed similarly in terms of thermal conductivity, indicating that the material composition difference was less influential than the structural change. In contrast, the SIL specimens still had the lowest thermal conductivity, possibly owing to less water retained in the matrix than the GYP and TAC specimens. After the 200 °C treatment, all specimens reduced their thermal conductivity and demonstrated comparable performance regardless of their different material compositions. This phenomenon was due to the profound dehydration and water evaporation that left a more porous structure in the gypsum matrix, which played a leading role.
Figure 6b shows the weight loss of the gypsum specimens after treatment at elevated temperatures. Most weight losses happened before 300 °C, e.g., 15% at 200 °C and 20% at 300 °C, corresponding roughly to gypsum dihydrate becoming hemihydrate and then anhydrite. The weight loss amount from SIL specimens was the smallest among the three at all exposure temperatures, followed by the GYP and TAC specimens. The water absorption of talc powder was superior to that of silica flour in the gypsum mixtures and thus contributed to a much higher weight loss in the TAC specimens. Figure 6c shows the linear shrinkage of gypsum bar specimens after treatment at 100 °C and 200 °C. The shrinkage of the 300 °C treatment was unavailable because all the bar specimens broke after the heat treatment. At 100 °C, the GYP and SIL samples demonstrated a sensible shrinkage; however, the TAC specimens had no shrinkage but a slight expansion. This was possibly due to the rehydration of gypsum hemihydrate/anhydrite with the water harvested from the talc powder parallel to the dehydration [35]. At 200 °C, the TAC specimens shrank the most (due to a much more substantial water loss beyond gypsum dehydration) compared to the GYP and SIL specimens.
3.4. TGA and XRD
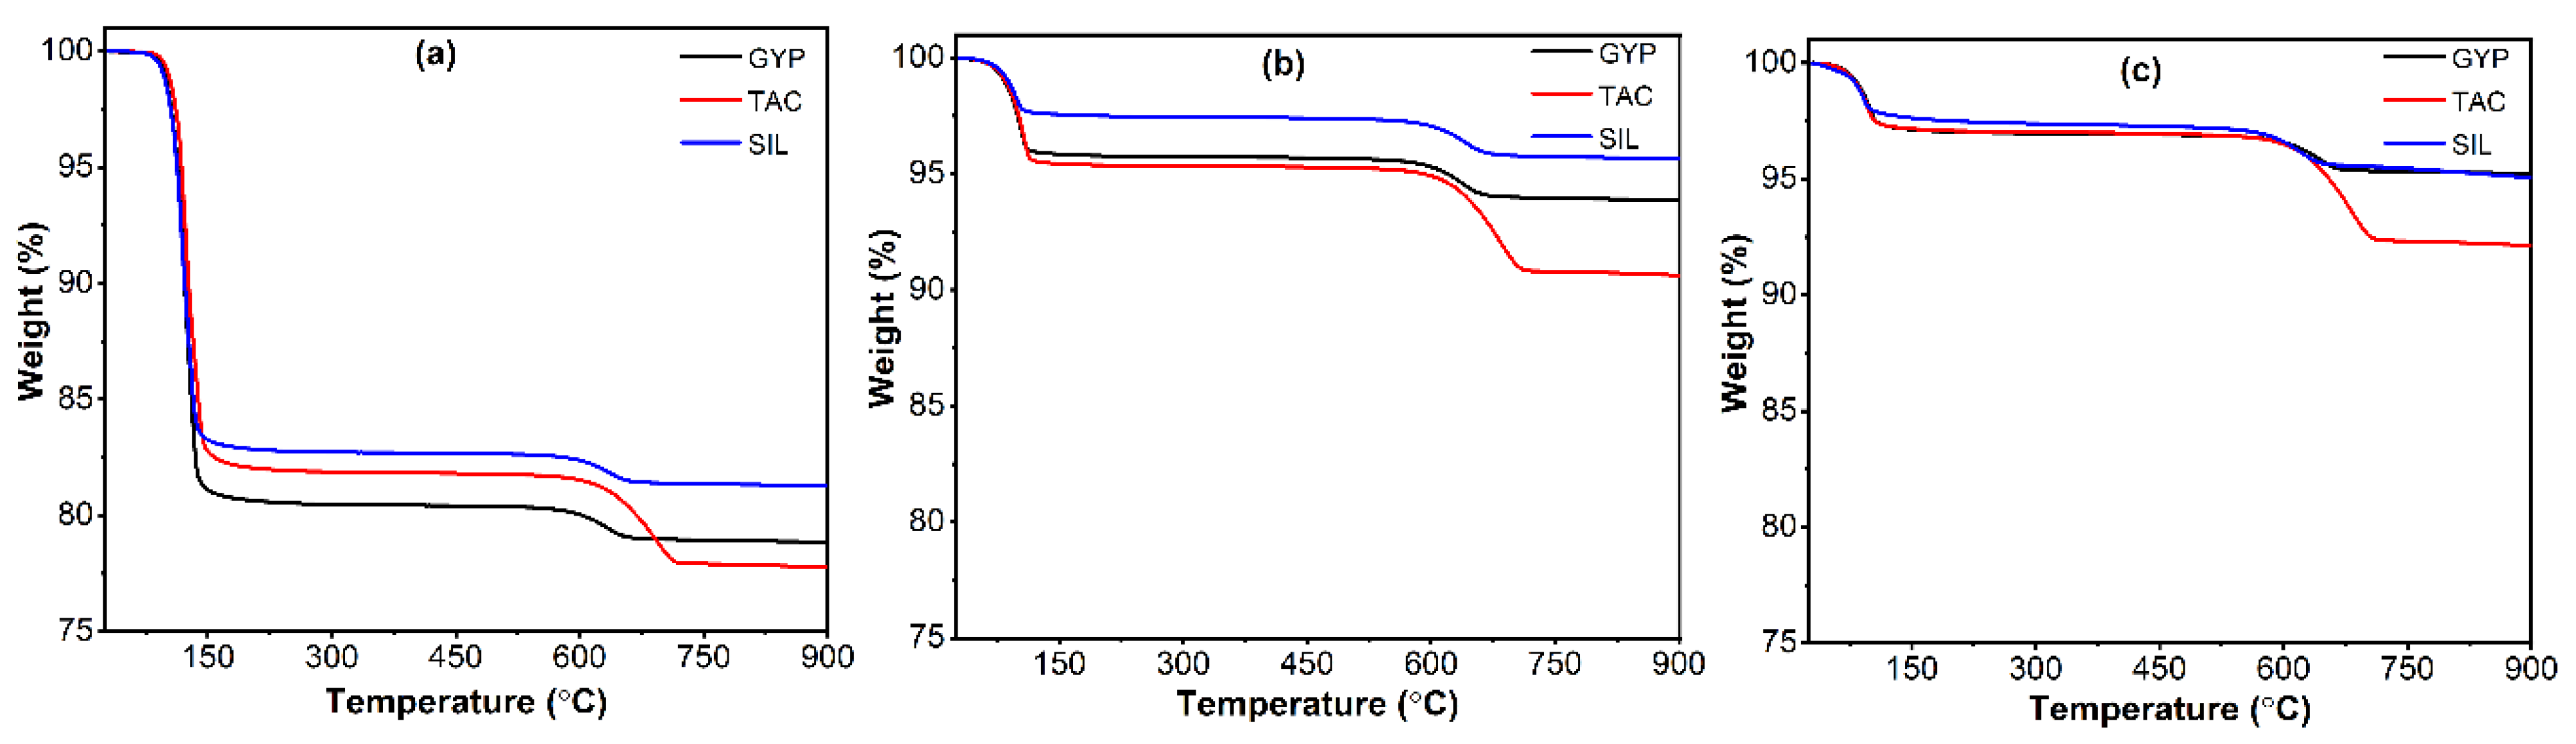
TGA and XRD analyzed gypsum specimens after treatment at elevated temperatures to identify weight loss and phase information, as shown in Figure 7 and Figure 8. In Figure 7, the weight loss in the 100–200 °C region was mainly due to matrix-confined water loss and gypsum dehydration [36], and in the 600–700 °C region, to the decomposition of carbonate and possibly talc [37]. The results in Figure 7a indicate that there was roughly about 20% water weight confined in the material matrix and gypsum dihydrate. After the 200 °C treatment, this amount of water was reduced by about 15%, as shown in Figure 7b, suggesting that almost all the gypsum dihydrate turned into hemihydrate. After the 300 °C treatment, the weight loss was further reduced in the specimens compared to the 200 °C treatment, as shown in Figure 7c, suggesting that the gypsum hemihydrate was dehydrated into anhydrite. The findings in TGA are also supported by the XRD results shown in Figure 8.
The GYP specimen had the most weight loss at 25 °C (without thermal treatment), followed by the TAC and SIL specimens, as shown in Figure 7a. This weight loss was attributable to gypsum dehydration and matrix-confined water. The GYP specimen contained the most gypsum hydrate, demonstrating the most weight loss among the three. In the SIL and TAC specimens, there was 10% of gypsum replaced by silica flour or talc powder, and thus the amount of gypsum hydrate was reduced (resulting in a decreased weight loss). The free water in the matrix likely evaporated during the curing of the specimens. The amount of matrix-confined water in the TAC specimen was higher than in the SIL specimen, as talc powder adsorbed water better than silica flour due to its smaller average particle size and stronger water affinity. After the thermal treatment at 200 °C and 300 °C (Figure 7b,c), the weight loss in the SIL specimen was still the lowest among the three, while the weight loss values in the TAC and GYP specimens were comparable. The reason might be the water confinement by talc during the dehydration of gypsum, so this amount of water contributed to the weight loss after the thermal treatment at 200 °C and 300 °C in the TAC specimen.
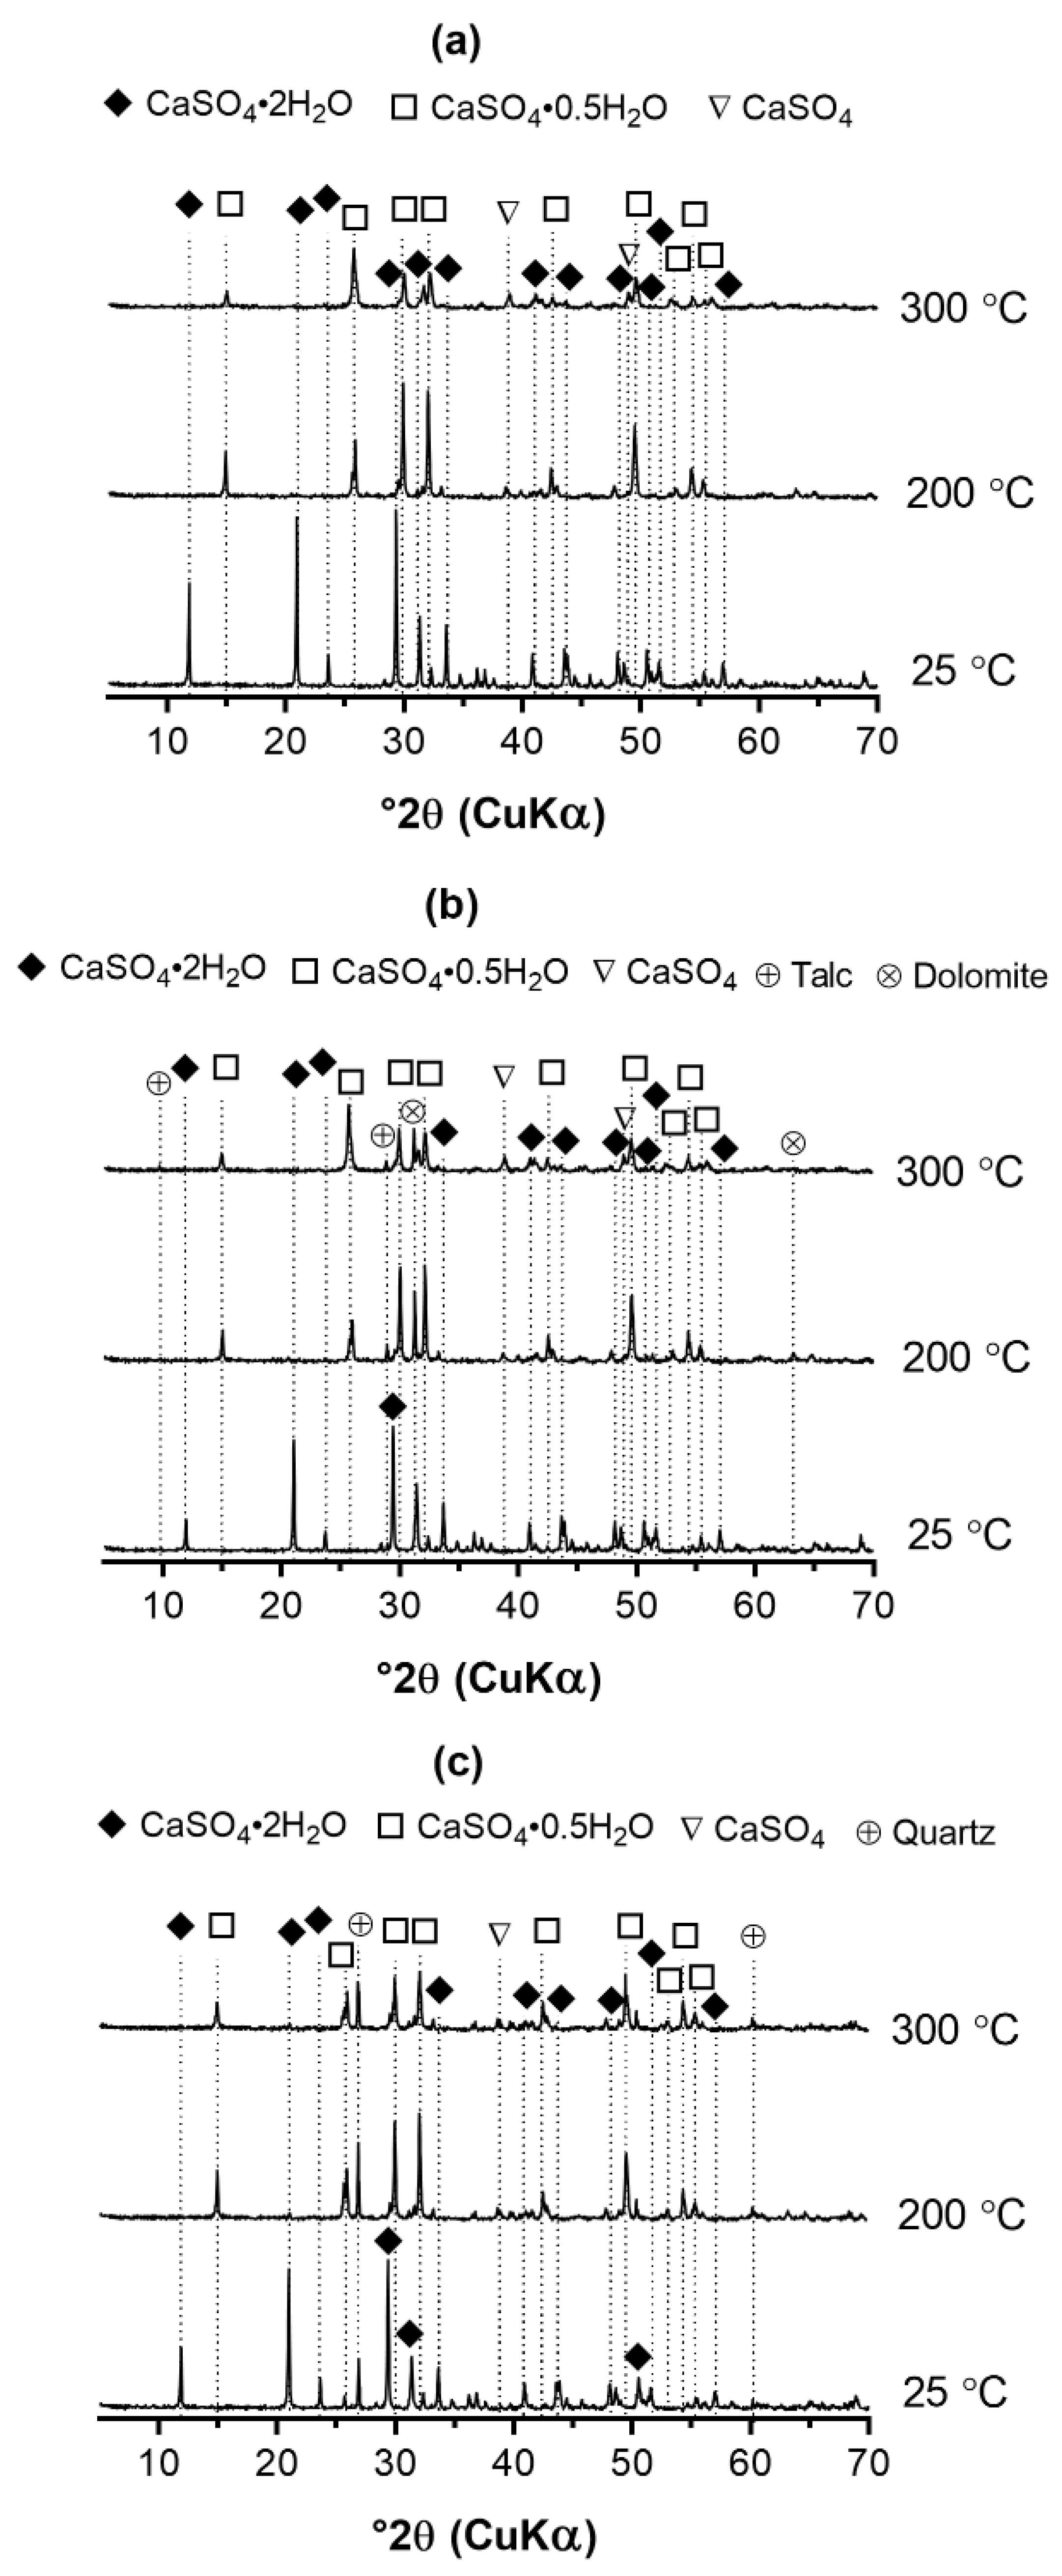
It can be seen from Figure 8 that gypsum dihydrate was the mineral in the hydrated gypsum matrix without thermal treatment (25 °C). After the thermal treatment at 200 °C, the gypsum dihydrate lost one and a half moles of water and transformed into gypsum hemihydrate (with half a mole of water left). After the treatment at 300 °C, gypsum dihydrate was directly transformed into anhydrite (CaSO4). Some anhydrite was further transformed into gypsum hemihydrate upon contact with vapor in the air during the cooling stage [38]. Talc and dolomite were shown in the TAC samples, and quartz was identified in the SIL specimens. There were no noticeable changes in their peaks with the thermal treatments.
3.5. Microstructural Morphology
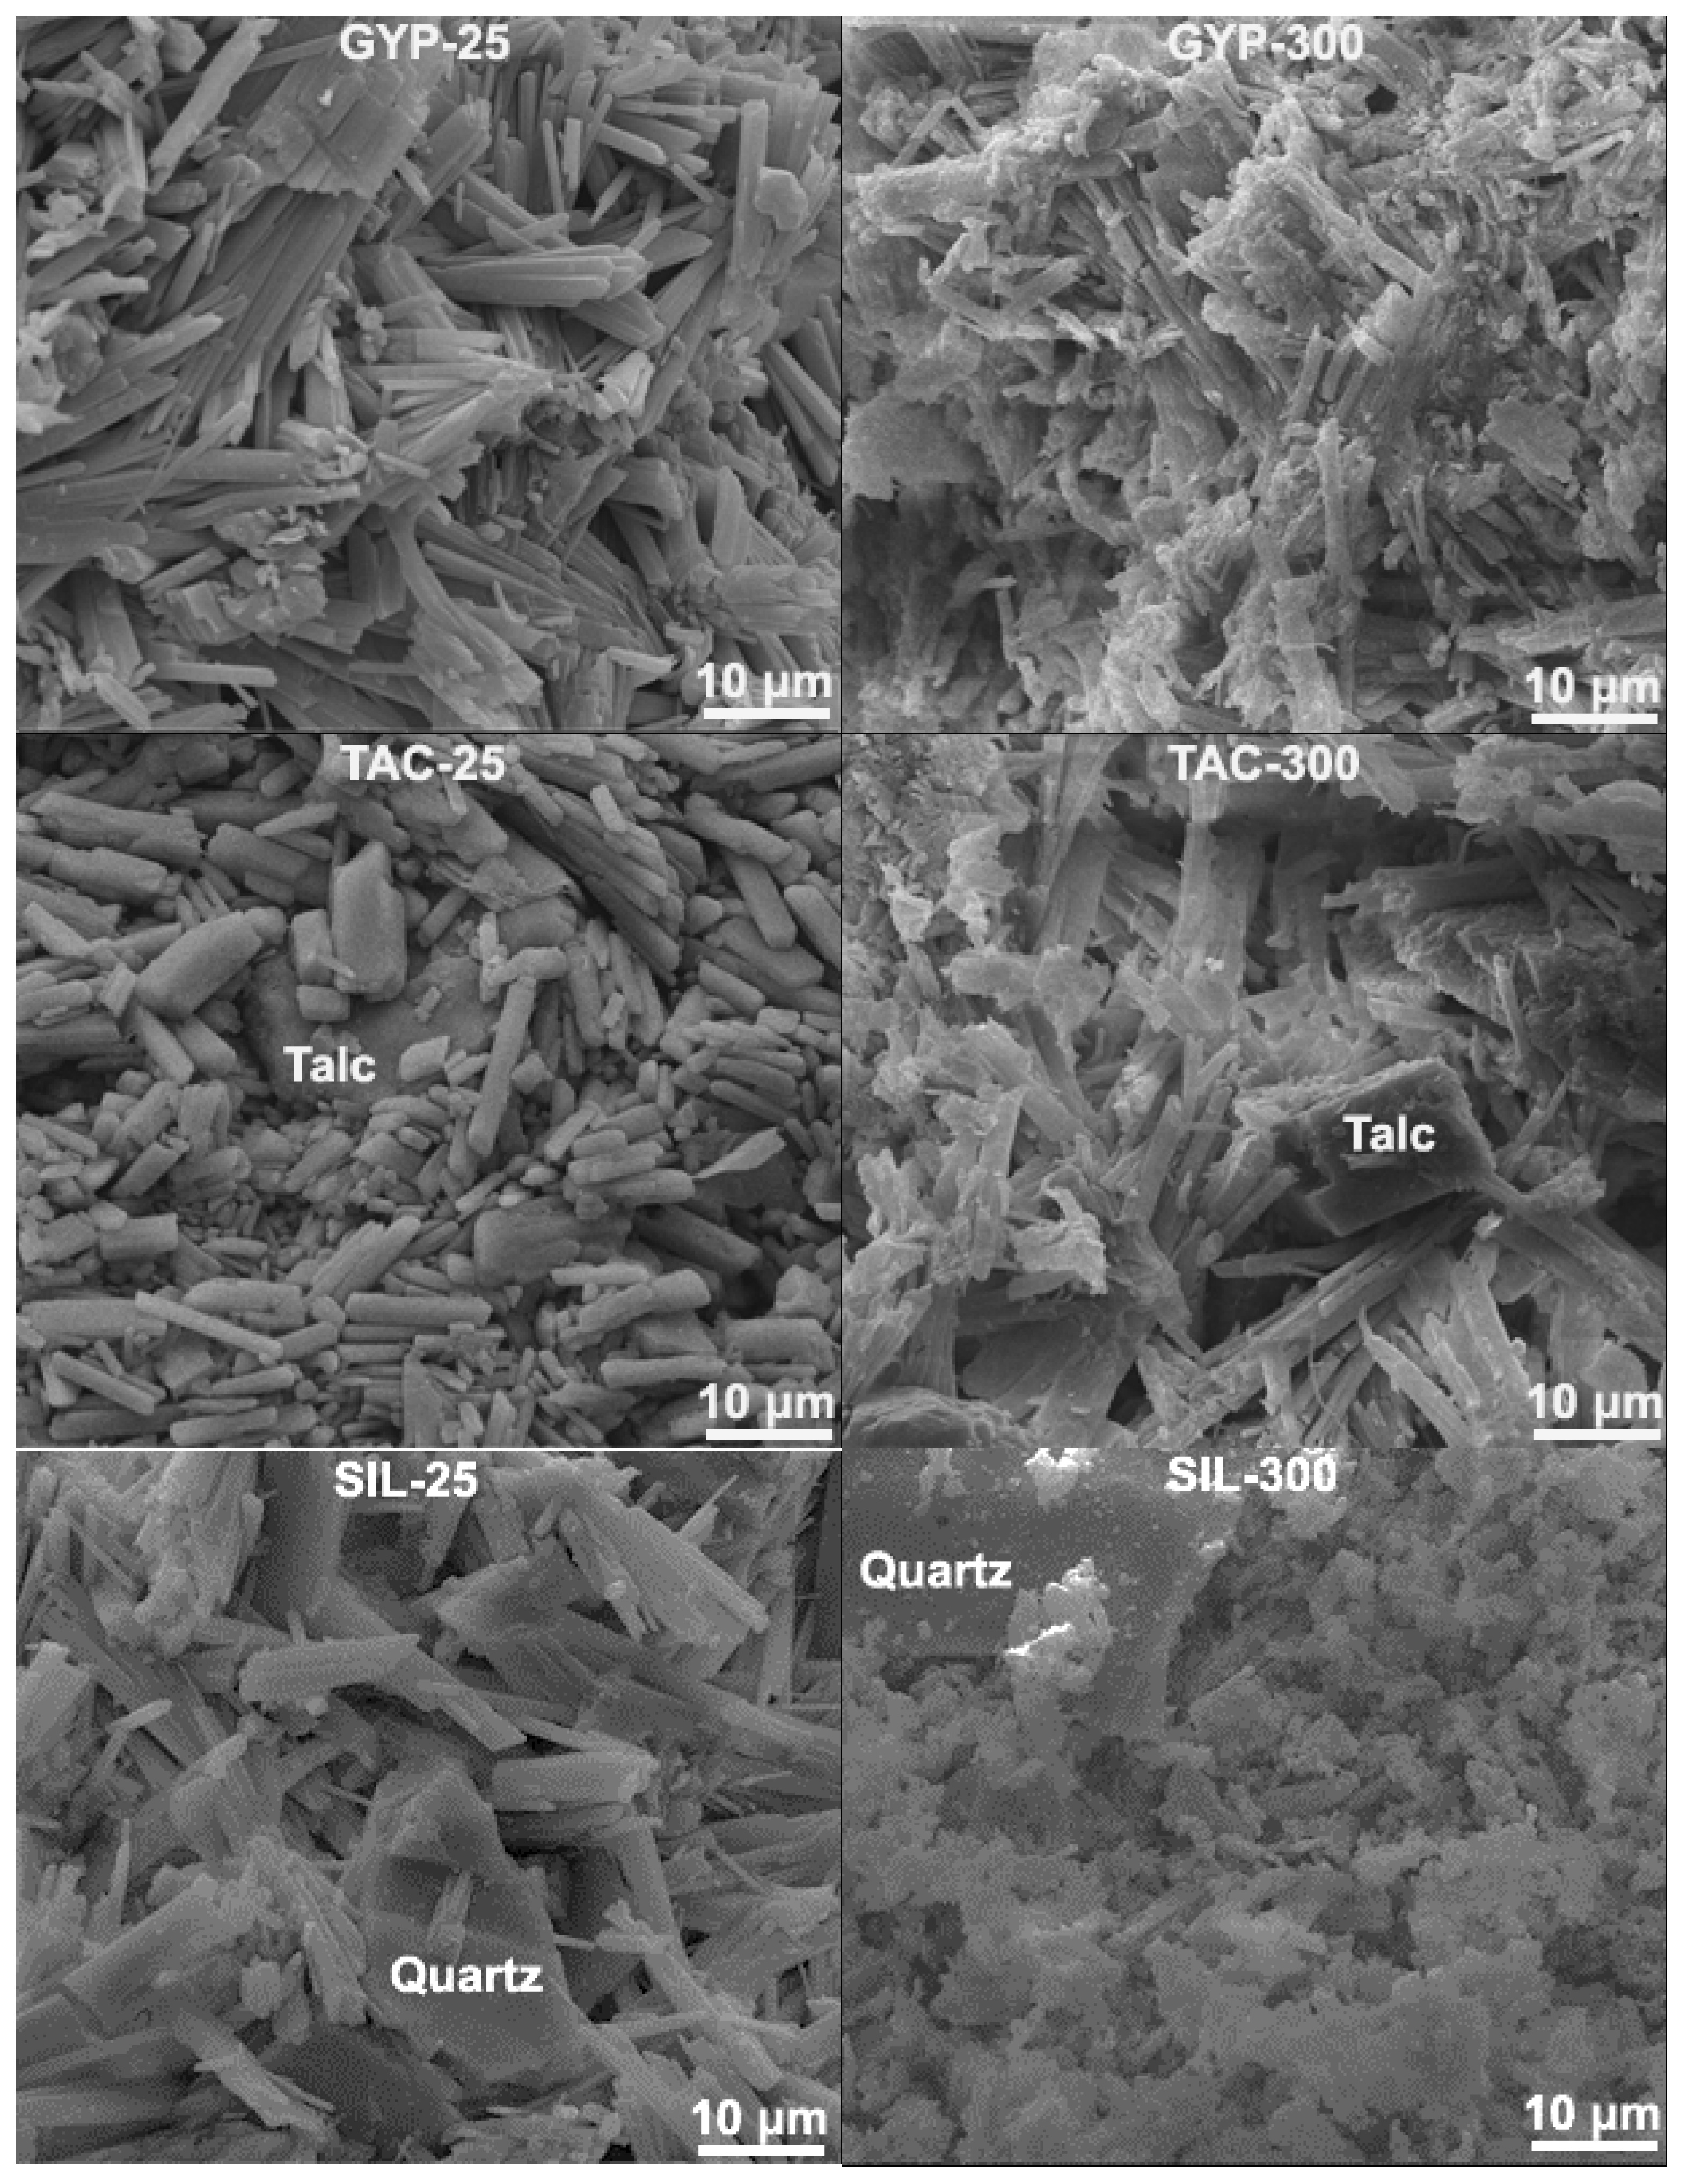
This work’s three types of mixtures demonstrated good mechanical strength at standard temperature (25 °C) and after being thermally treated at 300 °C, compared with the thermal treatment at the other temperatures. Figure 9 mainly shows the morphologies of the GYP, TAC, and SIL specimens without thermal treatment (at 25 °C) and after being treated at 300 °C. At 25 °C, the microstructure of the GYP specimen demonstrated needle-shaped crystals bonded together into various clusters distributed among the whole matrix. The bonding between single crystals or crystal clusters seemed negatively influenced (discontinued) by the matrix’s gel and capillary pores [39,40]. The TAC specimen demonstrated a gypsum matrix different from the GYP specimen. The morphology of the gypsum crystal was quite varied in diameter and length, with apparently weak bonding among single crystals. The crystal clusters seemed not to have formed in this matrix, and, meanwhile, the interface between the talc and gypsum crystals was discontinuous with some gaps. The matrix appeared loosely ordered and organized, lacked consistent crystals and tight integration, and contained apparent voids and relatively big pores. The SIL specimen presented a well-developed matrix of gypsum crystals integrated firmly with silica flour particles. The morphology of each gypsum crystal appeared similar to that of the GYP specimen. Still, the cluster formed by bonded crystals looked more consistent and well-distributed than that in the GYP specimen. The interface between silica flour particles and gypsum crystals was continuous without showing apparent gaps or voids. The whole matrix was compact, consistent, and bonded without showing problematic porosity, partially due to silica flour particles’ filling capacity. The microstructural settings of the three gypsum matrixes agreed well with their mechanical properties observed at the macroscopic level.
After being treated at 300 °C, as shown in Figure 9 (right column), the gypsum phases in the matrix turned into gypsum hemihydrate and anhydrite, which was also confirmed by the XRD results in Figure 8. For the TAC and SIL specimens, the talc and quartz remained intact in the matrix after being treated at 300 °C. For the GYP specimen, the thermal treatment generally reduced its mechanical strength due to phase change and pore formation, as shown in the SEM images. Although the mechanical strength was better than at 100 °C and 200 °C after being treated at 300 °C owing to the formation of anhydrite, its strength was still lower than at 25 °C (without treatment). However, in the TAC and SIL specimens, the strength after being treated at 300 °C was notably increased compared with the treatments at 100 °C and 200 °C and without treatment (25 °C). This was related to the combined gypsum phase change and the filling or skeletal effects of talc and silica flour particles in the gypsum matrix at the microscopic level.
4. Discussion
Adding talc powder or silica flour to gypsum reduced the hydration heat flow of the gypsum blends. Talc powder was more effective in delaying gypsum hydration, allowing extended sample casting and preparation time. Replacing 10% of gypsum with talc powder decreased the compressive strength of blended gypsum at 25 °C. Still, it reduced the thermal conductivity of the blend by 30% compared to the GYP (pure gypsum) specimen. Replacing 10% of gypsum with silica flour increased the compressive strength of blended gypsum at 25 °C. Also, the thermal conductivity of the blended gypsum was reduced by more than 60% compared to the GYP specimen. Silica flour seemed more effective than talc powder in modifying blended gypsum’s strength and thermal conductivity. The TAC specimen had higher weight loss and shrinkage than the SIL specimen during the thermal treatment, likely due to talc powder’s capacity to hold water on its particle surfaces more robustly than silica flour particles.
Silica flour was superior to talc powder in blended gypsum because the SIL specimen developed higher compressive strength, lower thermal conductivity, less weight loss, and smaller shrinkage than the TAC specimen. The weight loss of all gypsum specimens continued to increase with the increase in thermal treatment temperature. This was mainly due to water being driven from the gypsum matrix at temperatures up to about 300 °C and gases (such as CO2 and SO2) from the decomposition of relevant minerals at higher treatment temperatures being released. The samples’ thermal conductivity decreased with the treatment temperature up to 200 °C. The results at 300 °C and beyond were unavailable due to significant cracking in the specimens. It was interesting to see that, at 100 °C, the TAC specimen exhibited a negative shrinkage (slight expansion), resulting from the evaporation of water in the vicinity of talc powder particles that possibly rehydrated the relevant gypsum phases during the same period.
The compressive strength of hardened gypsum decreased after being treated at 100 °C and 200 °C, but it increased again after being treated at 300 °C. Such a strength increase was even more significant in the blended gypsum specimens with talc powder or silica flour. Anhydrite and gypsum hemihydrate were the two primary phase assemblages in the gypsum matrix after being treated at 300 °C. Anhydrite was likely formed first during the treatment, while a portion was rehydrated with water vapor into gypsum hemihydrate during the cooling process. Anhydrite was a more robust phase from a strength point of view than the other gypsum phases. The filler and skeletal functions provided by talc powder or silica flour in the matrix facilitated the strength increase after the 300 °C treatment. Meanwhile, the microcracking developed in the matrix during the heat treatment might have contributed to energy dissipation and stress redistribution. This required further investigation regarding the temperature-dependent mechanism since the cracking intensified at higher temperatures, so the specimens became weaker against the external load.
5. Conclusions
This work investigated mineral additions (talc powder and silica flour) to gypsum and their influences on blended gypsum’s physical and mechanical properties at elevated temperatures. The experimental results and discussions indicate the following conclusions:
- (1)
- The addition of silica flour (10% replacement of gypsum) improved gypsum’s physical and mechanical properties, such as compressive strength, thermal conductivity, and shrinkage at elevated temperatures. Silica flour performed better than talc powder (at the same dosage) in achieving blended gypsum’s physical and mechanical properties in this work. It is suggested that silica flour can be added to gypsum for better performance in normal temperatures and high-temperature resistance. The addition of silica powder could fill in some micropores, thereby increasing the density of the gypsum board.
- (2)
- The thermal treatment at 100 °C and 200 °C decreased the mechanical properties of gypsum paste owing to the loss of water, phase change, and formation of pores. However, the mechanical strength of gypsum paste recovered to some extent after being treated at 300 °C due to the formation of a more robust anhydrite phase. With the addition of talc powder or silica flour, the strength regained in the gypsum paste after being treated at 300 °C was remarkable, owing to the filler and skeletal effects of the talc powder and silica flour particles in the gypsum matrix combined with gypsum’s phase change.
- (3)
- The thermal-induced cracking seemed to cause no structural damage to the specimens when this work’s thermal treatment temperature was lower than 300 °C. To a certain extent, microcracks can enhance the ability of gypsum boards to absorb more energy. However, further investigations were needed to explore the relationship between thermal-induced cracking and mechanical properties. Both silica flour and talc powder demonstrated no apparent roles in controlling thermal-induced crack formation in the gypsum matrix.
Author Contributions
Conceptualization, J.W. and E.L.; Methodology, J.W. and E.L.; Software, J.W.; Validation, J.W.; Formal analysis, J.W.; Investigation, J.W.; Resources, E.L.; Data curation, J.W.; Writing—original draft, J.W. and E.L.; Writing—review & editing, J.W. and E.L.; Supervision, E.L.; Project administration, E.L.; Funding acquisition, E.L. All authors have read and agreed to the published version of the manuscript.
Funding
This work has been funded by the Xi’an Jiaotong-Liverpool University Research Development Funding (RDF-19-01-22) and by the Departments of Civil Engineering at Xi’an Jiaotong-Liverpool University and Tsinghua University.
Institutional Review Board Statement
Not applicable.
Informed Consent Statement
Not applicable.
Data Availability Statement
Data are contained within the article.
Conflicts of Interest
The authors declare no conflict of interest.
References
- Monteiro, P.J.; Miller, S.A.; Horvath, A. Towards sustainable concrete. Nat. Mater. 2017, 16, 698–699. [Google Scholar] [CrossRef] [PubMed]
- Xu, L.; Wang, J.J.; Li, K.F.; Lin, S.Y.; Li, M.L.; Hao, T.Y.; Ling, Z.; Xiang, D.; Wang, T.Y. A systematic review of factors affecting properties of thermal-activated recycled cement. Resour. Conserv. Recycl. 2022, 185, 106432. [Google Scholar] [CrossRef]
- Murat, M.; Attari, A. Modification of some physical properties of gypsum plaster by addition of clay minerals. Cem. Concr. Res. 1991, 21, 378–387. [Google Scholar] [CrossRef]
- Lushnikova, N.; Dvorkin, L. Sustainability of Gypsum Products as a Construction Material, Sustainability of Construction Materials; Elsevier: Amsterdam, The Netherlands, 2016; pp. 643–681. [Google Scholar]
- Khaliullin, M.; Dimieva, A. Composite gypsum binder under introducing thermally activated clay as a pozzolanic component and adding ground limestone. IOP Conf. Ser. Mater. Sci. Eng. 2020, 890, 012093. [Google Scholar] [CrossRef]
- Sophia, M.; Sakthieswaran, N. Synergistic effect of mineral admixture and bio-carbonate fillers on the physico-mechanical properties of gypsum plaster. Constr. Build. Mater. 2019, 204, 419–439. [Google Scholar] [CrossRef]
- Khaliullin, M.; Gilmanshina, A. The effect of additives of mechanically activated mineral fillers on the properties of composite gypsum binders. In Proceedings of the International Scientific Conference on Socio-Technical Construction and Civil Engineering, Kazan, Russia, 21–28 April 2021; Springer: Cham, Switzerland, 2021; pp. 334–342. [Google Scholar]
- Lanzón, M.; Castellón, F.J.; Ayala, M. Effect of the expanded perlite dose on the fire performance of gypsum plasters. Constr. Build. Mater. 2022, 346, 128494. [Google Scholar] [CrossRef]
- Huang, Y.; Xu, C.; Li, H.; Jiang, Z.; Gong, Z.; Yang, X.; Chen, Q. Utilization of the black tea powder as multifunctional admixture for the hemihydrate gypsum. J. Clean. Prod. 2019, 210, 231–237. [Google Scholar] [CrossRef]
- Lesovik, V.; Chernysheva, N.; Fediuk, R.; Amran, M.; Murali, G.; de Azevedo, A.R. Optimization of fresh properties and durability of the green gypsum-cement paste. Constr. Build. Mater. 2021, 287, 123035. [Google Scholar] [CrossRef]
- Doleželová, M.; Scheinherrová, L.; Krejsová, J.; Vimmrová, A. Effect of high temperatures on gypsum-based composites. Constr. Build. Mater. 2018, 168, 82–90. [Google Scholar] [CrossRef]
- Bicer, A.; Kar, F. Thermal and mechanical properties of gypsum plaster mixed with expanded polystyrene and tragacanth. Therm. Sci. Eng. Prog. 2017, 1, 59–65. [Google Scholar] [CrossRef]
- Gencel, O.; del Coz Diaz, J.J.; Sutcu, M.; Koksal, F.; Rabanal, F.P.Á.; Martinez-Barrera, G. A novel lightweight gypsum composite with diatomite and polypropylene fibers. Constr. Build. Mater. 2016, 113, 732–740. [Google Scholar] [CrossRef]
- Camarini, G.; Pinto, M.C.C.; de Moura, A.G.; Manzo, N.R. Effect of citric acid on properties of recycled gypsum plaster to building components. Constr. Build. Mater. 2016, 124, 383–390. [Google Scholar] [CrossRef]
- Lanzón, M.; García-Ruiz, P. Effect of citric acid on setting inhibition and mechanical properties of gypsum building plasters. Constr. Build. Mater. 2012, 28, 506–511. [Google Scholar] [CrossRef]
- Khalil, A.; Tawfik, A.; Hegazy, A. Plaster composites modified morphology with enhanced compressive strength and water resistance characteristics. Constr. Build. Mater. 2018, 167, 55–64. [Google Scholar] [CrossRef]
- Pundir, A.; Garg, M.; Singh, R. Evaluation of properties of gypsum plaster-superplasticizer blends of improved performance. J. Build. Eng. 2015, 4, 223–230. [Google Scholar] [CrossRef]
- Tokarev, Y.; Ginchitsky, E.; Sychugov, S.; Krutikov, V.; Yakovlev, G.; Buryanov, A.; Senkov, S. Modification of gypsum binders by using carbon nanotubes and mineral additives. Procedia Eng. 2017, 172, 1161–1168. [Google Scholar] [CrossRef]
- Zhu, C.; Zhang, J.; Peng, J.; Cao, W.; Liu, J. Physical and mechanical properties of gypsum-based composites reinforced with PVA and PP fibers. Constr. Build. Mater. 2018, 163, 695–705. [Google Scholar] [CrossRef]
- Azad, A.; Mousavi, S.-F.; Karami, H.; Farzin, S. Application of talc as an eco-friendly additive to improve the structural behavior of porous concrete, Iranian Journal of Science and Technology. Trans. Civ. Eng. 2019, 43, 443–453. [Google Scholar]
- Berodier, E.; Scrivener, K. Understanding the Filler Effect on the Nucleation and Growth of C-S-H. J. Am. Ceram. Soc. 2014, 97, 3764–3773. [Google Scholar] [CrossRef]
- Tavares, L.R.C.; Junior, J.F.T.; Costa, L.M.; da Silva Bezerra, A.C.; Cetlin, P.R.; Aguilar, M.T.P. Influence of quartz powder and silica fume on the performance of Portland cement. Sci. Rep. 2020, 10, 21461. [Google Scholar] [CrossRef]
- Rashad, A.M. Effect of quartz-powder on the properties of conventional cementitious materials and geopolymers. Mater. Sci. Technol. 2018, 34, 2043–2056. [Google Scholar] [CrossRef]
- Ahmed, A.; Mahmoud, A.A.; Elkatatny, S. The Use of the Granite Waste Material as an Alternative for Silica Flour in Oil-Well Cementing. ACS Omega 2020, 5, 32341–32348. [Google Scholar] [CrossRef] [PubMed]
- Liu, X.; Liu, X.; Hu, Y. Investigation of the thermal decomposition of talc. Clays Clay Miner. 2014, 62, 137–144. [Google Scholar] [CrossRef]
- Wentzensen, N.; O’Brien, K.M. Talc, body powder, and ovarian cancer: A summary of the epidemiologic evidence. Gynecol. Oncol. 2021, 163, 199–208. [Google Scholar] [CrossRef]
- Carretero, M.I.; Pozo, M. Clay and non-clay minerals in the pharmaceutical industry: Part I. Excipients and medical applications. Appl. Clay Sci. 2009, 46, 73–80. [Google Scholar] [CrossRef]
- Xu, L.; Wang, J.J.; Li, K.F.; Hao, T.Y.; Li, Z.; Li, L.; Ran, B.; Du, H. New insights on dehydration at elevated temperature and rehydration of GGBS blended cement. Cem. Concr. Compos. 2023, 139, 105068. [Google Scholar] [CrossRef]
- Xu, L.; Wang, J.J.; Li, K.F.; Li, M.L.; Lin, S.Y.; Hao, T.Y.; Wang, T.Y.; Guo, Y.P.; Ling, Z. Investigations on the rehydration of recycled blended SCMs cement. Cem. Concr. Res. 2023, 163, 107036. [Google Scholar] [CrossRef]
- Zhang, L.; Liu, C.; Liu, L.; Zhang, H. Study on early hydration of gypsum-based materials containing different chemical admixtures by isothermal calorimetry and oscillation rheology. J. Therm. Anal. Calorim. 2022, 147, 6099–6107. [Google Scholar] [CrossRef]
- Magallanes-Rivera, R.; Escalante-Garcia, J.; Gorokhovsky, A. Hydration reactions and microstructural characteristics of hemihydrate with citric and malic acid. Constr. Build. Mater. 2009, 23, 1298–1305. [Google Scholar] [CrossRef]
- Yang, L.; Shi, C.; Liu, J.; Wu, Z. Factors affecting the effectiveness of internal curing: A review. Constr. Build. Mater. 2021, 267, 121017. [Google Scholar] [CrossRef]
- Baux, C.; Melinge, Y.; Lanos, C.; Jauberthie, R. Enhanced gypsum panels for fire protection. J. Mater. Civ. Eng. 2008, 20, 71–77. [Google Scholar] [CrossRef]
- Rahmanian, I.; Wang, Y. A combined experimental and numerical method for extracting temperature-dependent thermal conductivity of gypsum boards. Constr. Build. Mater. 2012, 26, 707–722. [Google Scholar] [CrossRef]
- Ritterbach, L.; Becker, P. Temperature and humidity dependent formation of CaSO4· xH2O (x= 0... 2) phases. Glob. Planet. Change 2020, 187, 103132. [Google Scholar] [CrossRef]
- Borrachero, M.; Paya, J.; Bonilla, M.; Monzó, J. The use of thermogravimetric analysis technique for the characterization of construction materials: The gypsum case. J. Therm. Anal. Calorim. 2008, 91, 503–509. [Google Scholar] [CrossRef]
- Piga, L.; Villieras, F.; Yvon, J. Thermogravimetric analysis of a talc mixture. Thermochim. Acta 1992, 211, 155–162. [Google Scholar] [CrossRef]
- Tang, Y.; Gao, J.; Liu, C.; Chen, X.; Zhao, Y. Dehydration pathways of gypsum and the rehydration mechanism of soluble anhydrite γ-CaSO4. ACS Omega 2019, 4, 7636–7642. [Google Scholar] [CrossRef]
- He, H.; Wang, Y.; Wang, J. Effects of aggregate micro fines (AMF), aluminum sulfate and polypropylene fiber (PPF) on properties of machine-made sand concrete. Appl. Sci. 2019, 9, 2250. [Google Scholar] [CrossRef]
- Wang, Y.; Lu, H.; Wang, J.; He, H. Effects of highly crystalized nano C-S-H particles on performances of Portland cement paste and its mechanism. Crystals 2020, 10, 816. [Google Scholar] [CrossRef]
Figure 1.
Particle size distribution of gypsum powder, talc powder, and silica flour.

Figure 2.
XRD pattern of (a) gypsum powder, (b) talc powder, and (c) silica flour.

Figure 3.
Hydration heat development of the three gypsum mixtures: (a) heat flow rate during the first 2 h, (b) heat flow rate from 2 to 70 h, and (c) total heat of hydration during the 72 h of measurement.
Figure 3.
Hydration heat development of the three gypsum mixtures: (a) heat flow rate during the first 2 h, (b) heat flow rate from 2 to 70 h, and (c) total heat of hydration during the 72 h of measurement.

Figure 4.
Compressive strength of hardened gypsum pastes at elevated temperatures.

Figure 5.
Microcracking in gypsum specimens after the 300 °C treatment: (a) GYP, (b) SIL, and (c) TAC.
Figure 5.
Microcracking in gypsum specimens after the 300 °C treatment: (a) GYP, (b) SIL, and (c) TAC.

Figure 6.
Thermal conductivity (a), weight loss (b), and linear shrinkage (c) of gypsum specimens after being treated at elevated temperatures.
Figure 6.
Thermal conductivity (a), weight loss (b), and linear shrinkage (c) of gypsum specimens after being treated at elevated temperatures.

Figure 7.
TGA results of gypsum specimens after being treated at elevated temperatures: (a) 25 °C as the reference, (b) 200 °C, and (c) 300 °C.
Figure 7.
TGA results of gypsum specimens after being treated at elevated temperatures: (a) 25 °C as the reference, (b) 200 °C, and (c) 300 °C.

Figure 8.
XRD patterns of gypsum specimens after being treated at 200 °C and 300 °C, with 25 °C as the reference: (a) GYP, (b) TAC, and (c) SIL.
Figure 8.
XRD patterns of gypsum specimens after being treated at 200 °C and 300 °C, with 25 °C as the reference: (a) GYP, (b) TAC, and (c) SIL.

Figure 9.
Electron microscope images of GYP, TAC, and SIL specimens before (25 °C, left column) and after the thermal treatment at 300 °C (right column).
Figure 9.
Electron microscope images of GYP, TAC, and SIL specimens before (25 °C, left column) and after the thermal treatment at 300 °C (right column).


Table 1.
Chemical compositions of gypsum powder, talc powder, and silica flour, indicated by X-ray fluorescence spectroscopy in mass %.
Table 1.
Chemical compositions of gypsum powder, talc powder, and silica flour, indicated by X-ray fluorescence spectroscopy in mass %.
| Oxides | Gypsum Powder | Talc Powder | Silica Flour |
|---|---|---|---|
| CaO | 32.60 | 21.40 | 0.24 |
| SiO2 | 0.68 | 17.40 | 94.00 |
| SO3 | 35.30 | 0.10 | 0.05 |
| SrO | 0.24 | — | — |
| ZrO2 | 0.56 | 0.42 | 0.34 |
| MnO | — | 0.07 | — |
| MgO | — | 12.00 | 0.13 |
| Fe2O3 | 0.09 | 1.27 | 0.05 |
| LOI | 30.53 | 47.34 | 5.19 |
Disclaimer/Publisher’s Note: The statements, opinions and data contained in all publications are solely those of the individual author(s) and contributor(s) and not of MDPI and/or the editor(s). MDPI and/or the editor(s) disclaim responsibility for any injury to people or property resulting from any ideas, methods, instructions or products referred to in the content. |
© 2023 by the authors. Licensee MDPI, Basel, Switzerland. This article is an open access article distributed under the terms and conditions of the Creative Commons Attribution (CC BY) license (https://creativecommons.org/licenses/by/4.0/).
Share and Cite
MDPI and ACS Style
Wang, J.; Liu, E. Physicomechanical Properties of Gypsum with Mineral Additions at Elevated Temperatures. Coatings 2023, 13, 2091. https://0-doi-org.brum.beds.ac.uk/10.3390/coatings13122091
AMA Style
Wang J, Liu E. Physicomechanical Properties of Gypsum with Mineral Additions at Elevated Temperatures. Coatings. 2023; 13(12):2091. https://0-doi-org.brum.beds.ac.uk/10.3390/coatings13122091
Chicago/Turabian StyleWang, Junjie, and Engui Liu. 2023. "Physicomechanical Properties of Gypsum with Mineral Additions at Elevated Temperatures" Coatings 13, no. 12: 2091. https://0-doi-org.brum.beds.ac.uk/10.3390/coatings13122091
Note that from the first issue of 2016, this journal uses article numbers instead of page numbers. See further details here.