Article

PVB/ATO Nanocomposites for Glass Coating Applications: Effects of Nanoparticles on the PVB Matrix

1
Istituto di Chimica dei Composti OrganoMetallici, Consiglio Nazionale delle Ricerche-CNR, Via G. Moruzzi 1, 56124 Pisa, Italy
2
Istituto per i Processi Chimico-Fisici, Consiglio Nazionale delle Ricerche-CNR, Via G. Moruzzi 1, 56124 Pisa, Italy
*
Author to whom correspondence should be addressed.
Submission received: 28 March 2019 / Revised: 9 April 2019 / Accepted: 10 April 2019 / Published: 12 April 2019

Abstract

:
Films made of poly(vinyl butyral) (PVB) and antimony-doped tin oxide (ATO) nanoparticles (NPs), both uncoated and surface-modified with an alkoxysilane, were prepared by solution casting at filler volume fractions ranging from 0.08% to 4.5%. The films were characterized by standard techniques including transmission electron microscopy, thermogravimetric analysis and differential scanning calorimetry (DSC). In the polymeric matrix, the primary NPs (diameter ~10 nm) aggregate exhibiting different morphologies depending on the presence of the surface coating. Coated ATO NPs form spherical particles (with a diameter of 300–500 nm), whereas more elongated fractal structures (with a thickness of ~250 nm and length of tens of micrometers) are formed by uncoated NPs. The fraction of the polymer interacting with the NPs is always negligible. In agreement with this finding, DSC data did not reveal any rigid interface and 1H time domain nuclear magnetic resonance (NMR) and fast field-cycling NMR did not show significant differences in polymer dynamics among the different samples. The ultraviolet-visible-near infrared (UV-Vis-NIR) transmittance of the films decreased compared to pure PVB, especially in the NIR range. The solar direct transmittance and the light transmittance were extracted from the spectra according to CEN EN 410/2011 in order to test the performance of our films as plastic layers in laminated glass for glazing.

1. Introduction

Polymer nanocomposites are of major scientific and technological interest. In these systems, mechanical properties may be significantly modified at lower loadings compared to microcomposites due to the larger specific surface area [1,2]. Lower loadings facilitate processing and reduce component weight, which makes them industrially attractive. One main goal in the development of high-performance polymer nanocomposites is to obtain a good dispersion of nanoparticles (NPs), which guarantees a high surface area, favoring the interaction with the polymer matrix [3,4]. This is impeded by NP aggregation, which mainly depends on interparticle forces, polymer–NP interactions, and NP shape, as well as on the preparation procedure [5,6].
Antimony-doped tin oxide (ATO) is an optically transparent conducting oxide absorbing in the near infrared (NIR) region as a result of doping, which gives rise to localized surface plasmon resonance. It has been used as filler to increase the electrical conductivity and to provide NIR shielding combined with optical transparency in a variety of polymers, including copolymer lattices containing acrylic units [7,8,9,10], poly(acrylate) [11], polyurethane (PU) [12], poly(urethane–acrylate) [13], an epoxy matrix [14], poly(vinyl butyral) (PVB) [15], poly(methyl methacrylate) (PMMA) [16], poly(acrylonitrile) (PAN) [17], and poly(vinyl alcohol) [18]. Studies on the dispersion of ATO NPs in these systems showed that ATO NPs tend to aggregate in network structures when they are bare [7,9,10,13,18]. On the other hand, ATO NPs functionalized with an alkoxy silane were reported to form round sub-micrometric particles in PU [12], PVB [15], and PMMA [16] matrices, and networks of chainlike NPs in PAN [17]. In a study focusing on electrical conductivity [19], ATO/acrylate films were loaded with ATO NPs which were surface-modified using 3-methacryloxypropyltrimethoxysilane (MPS). The ATO NPs gave a fractal type network when a small amount of MPS was used, whereas they formed smaller aggregates in the case of large amounts, indicating that the degree of surface modification affects the morphology of the NP dispersion.
In this work, films of PVB (Figure 1) and ATO NP nanocomposites were prepared by solution casting using NPs, either bare (ATOu) or totally surface modified by MPS (ATOc), at different loading levels. Films were thoroughly characterized using a multi-technique approach, in order to obtain information on the structural and dynamic properties of the different components at the microscopic level, as well as to determine optical properties useful for the application of films as glass coatings. In particular, the dispersion of the NPs in the starting mixtures and in the films was characterized by dynamic light scattering (DLS) and transmission electron microscopy (TEM). The effects of NPs on the thermal properties of the films were investigated by thermogravimetric analysis (TGA) and differential scanning calorimetry (DSC). The fraction of the polymer interacting with the NPs was estimated from TEM measurements. The effects of the filler on the dynamics of the PVB chains were studied by 1H time domain nuclear magnetic resonance (NMR) and fast field-cycling (FFC) NMR relaxometry. These two techniques are less standard in material characterization, although they have often been employed to get insight into structural and dynamic issues in polymer science, including the existence of polymer regions with different mobilities in filled elastomers [20,21,22,23,24,25,26,27]. Finally, considering that the films could be used as plastic layers in the manufacturing of functional safety glass, the effect of both fillers on NIR shielding and optical transparency of the matrix was tested through ultraviolet(UV)-visible(Vis)-NIR transmittance measurements. The influence of the ATO NP surface functionalization on polymer properties was unraveled by comparing data on PVB-ATOu and PVB-ATOc films, while different NP loading levels in the films were exploited to optimize the film composition for applications.

2. Materials and Methods
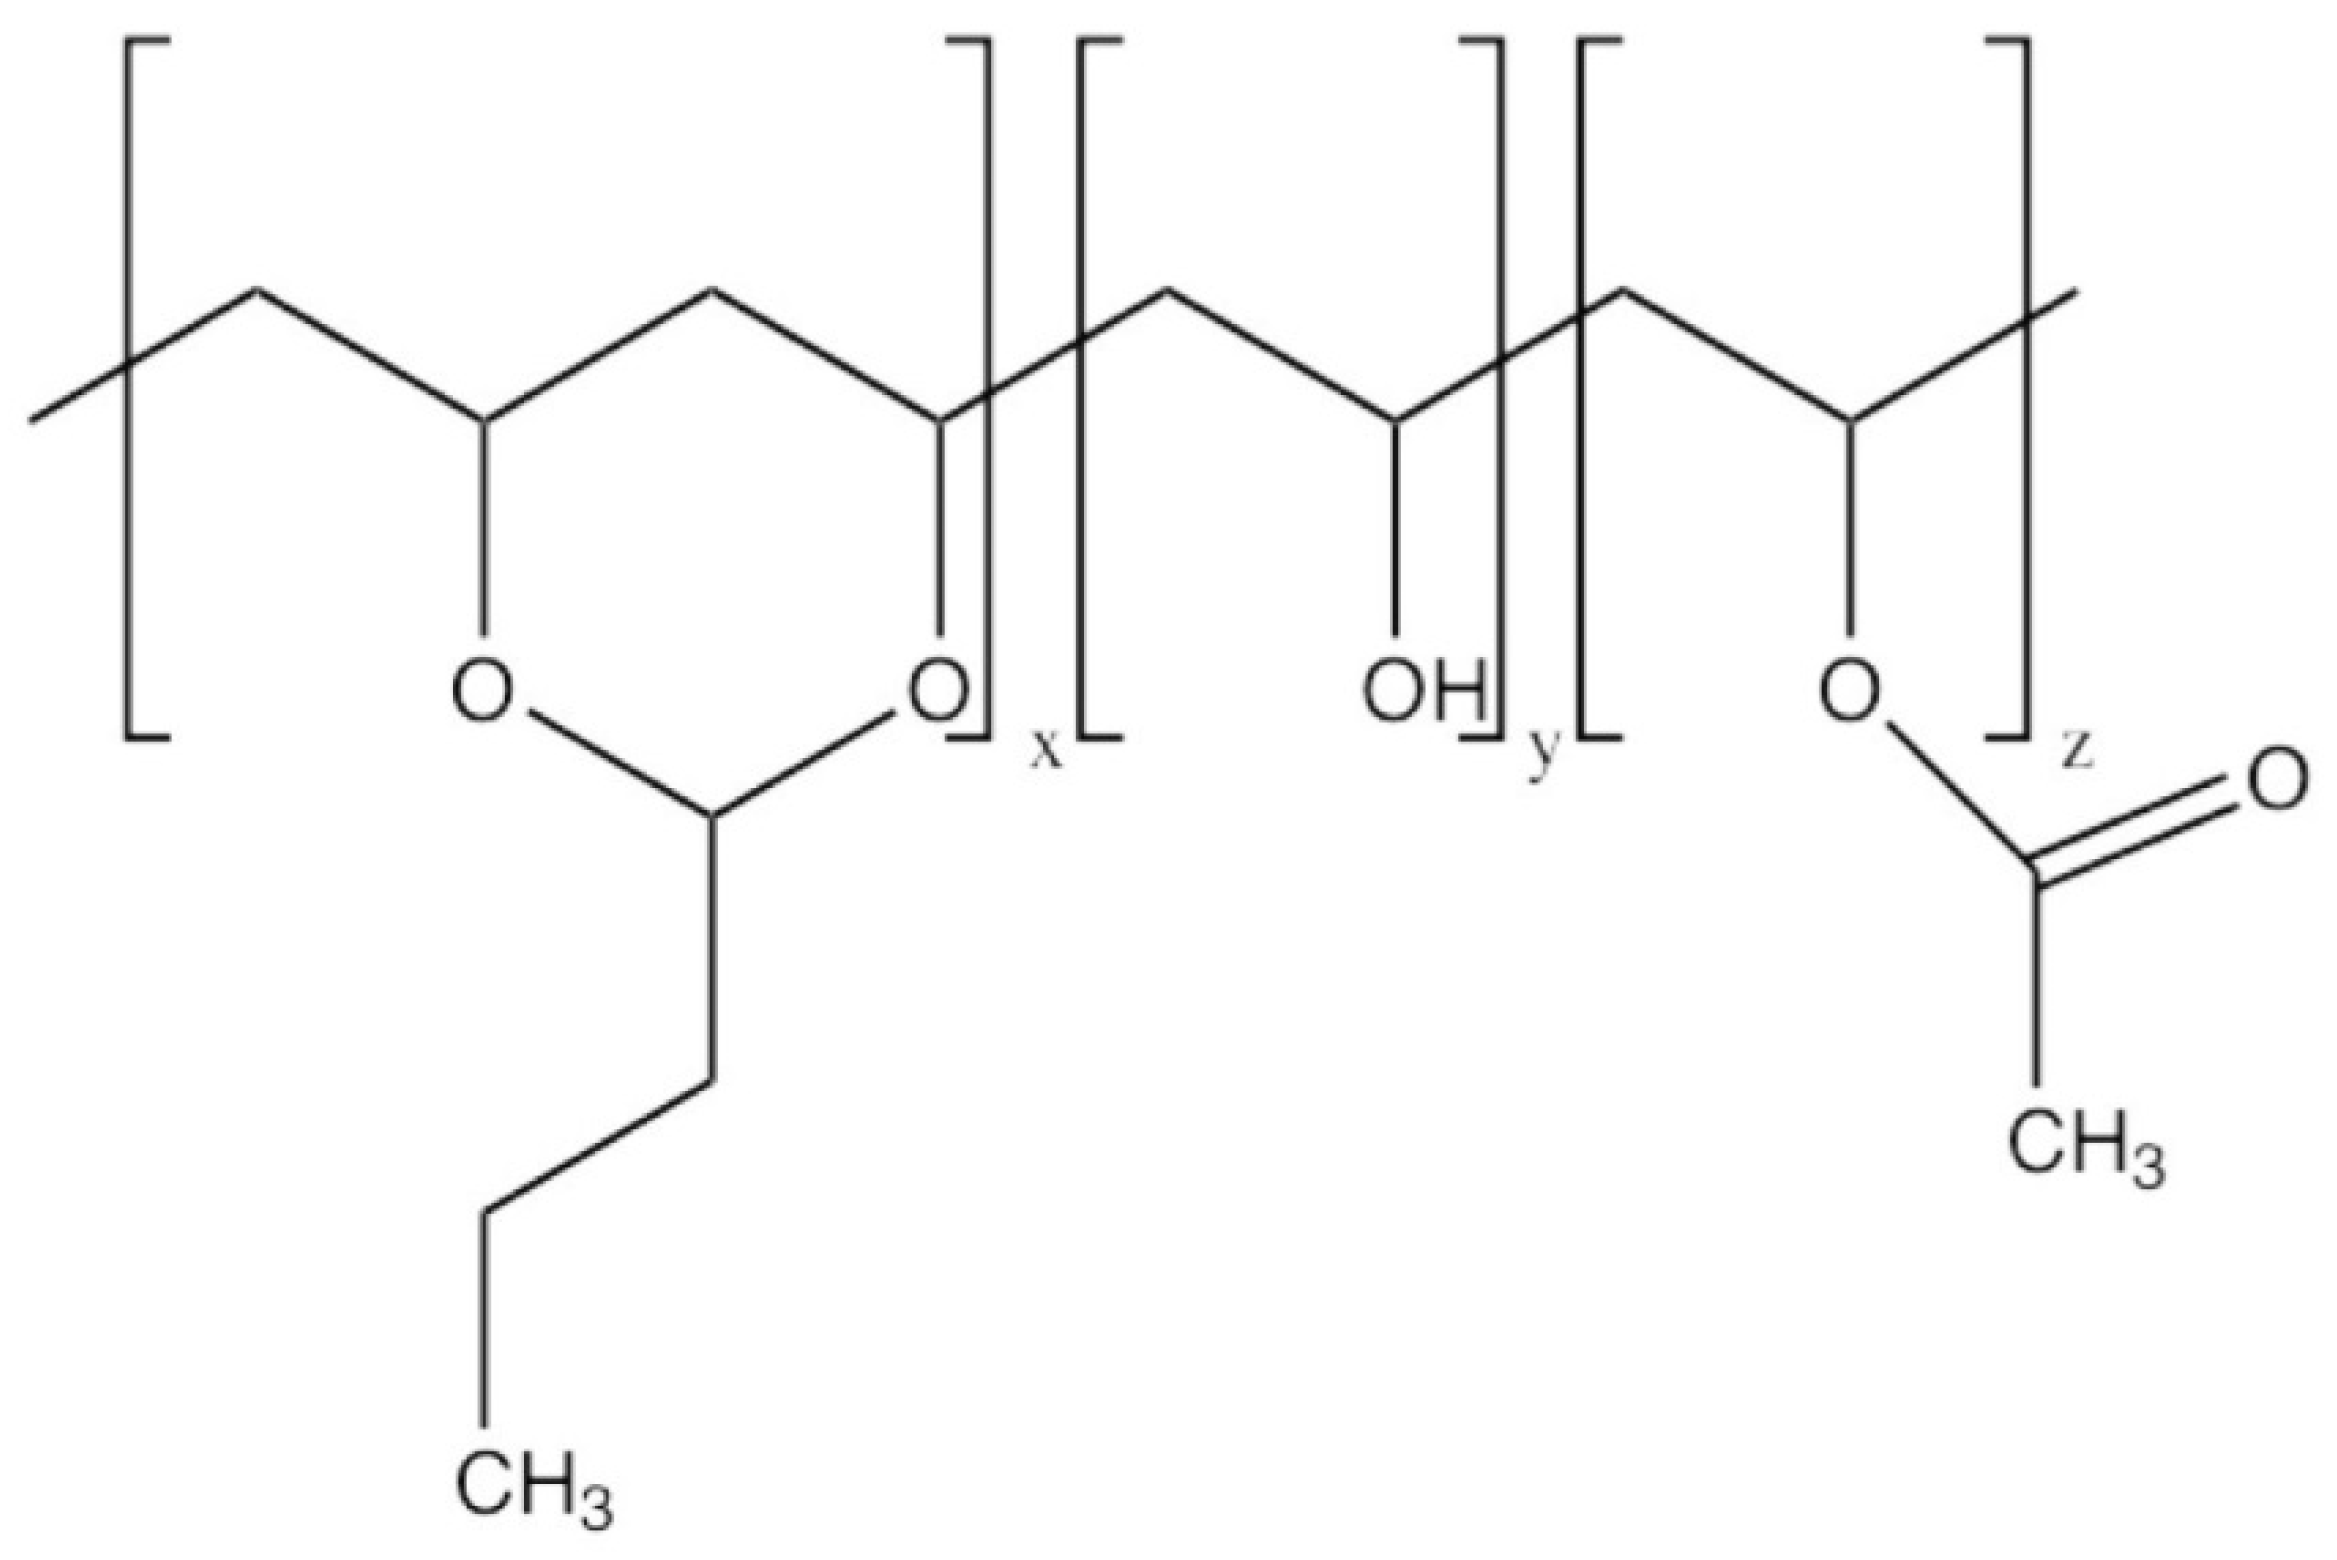
2.1. Materials

PVB (trade name Butvar B98®) was purchased from Sigma-Aldrich (St. Louis, MO, USA). The weight average molecular weight, determined using size exclusion chromatography, was 79 kg/mol with a polydispersity of 2.4. The molar fractions of the vinyl butyral, vinyl alcohol, and vinyl acetate units, verified by means of 1H NMR in CDCl3 [28], were 0.55–0.57, 0.41–0.45 and 0–0.02, respectively. Uncoated ATO (ATOu) nanoparticles with a nominal content of Sb2O5 equal to 7–11 wt % were purchased from Sigma-Aldrich. Coated ATO (ATOc) nanoparticles dispersed in ethyl alcohol (10 wt % of ATO) were kindly provided by Kriya Materials (Geleen, The Netherlands) and used as received. The coating agent was MPS.

2.2. Sample Preparation

2.2.1. Suspension of Uncoated ATO Nanoparticles

ATOu nanoparticles were added to ethyl alcohol, ultrasonically dispersed for 30 min, and then subjected to centrifugation (6000 rpm) for 10 min. The dispersed nanoparticles remained suspended in the supernatant, while the undispersed ones precipitated. The amount of nanoparticles in the supernatant (1 wt %) was determined gravimetrically after drying a weighed sample in a rotary evaporator.

2.2.2. Films of PVB and PVB Loaded with ATO Nanoparticles

The films were obtained using the solution casting method, according to a procedure already reported for other PVB composites [29,30]. Briefly, for the PVB blank sample, PVB was dissolved in ethyl alcohol at 75 °C at a concentration of about 4 wt %. Then, the solution was transferred into a Petri Teflon dish and let dry in air for several days. In order to completely remove the solvent, the films were further dried under vacuum (10−2 Torr for 10 h). For the loaded samples, PVB was dissolved in ethyl alcohol at 75 °C at a concentration of about 4 wt %. The suspension of ATO nanoparticles, either coated or uncoated, was added to the PVB solution in such an amount that the ATO content in the composite ranged from 0.5 to 23 wt %. The mixture was stirred for 30 min, then transferred into a Petri Teflon dish and let dry in air and then under vacuum. The loaded samples are named PVB-ATOu-i and PVB-ATOc-i, where the letters u and c identify the coated and uncoated oxide, respectively, and i indicates the loading level (0.5, 2, 5, and 23 wt %). The thickness of the obtained films was about 200 μm, as measured by a caliper.

2.3. DLS, TEM, TGA, DSC and UV-Vis-NIR Measurements

DLS was carried out by using a Malvern Zetasizer nano series ZEN1600 (Worcestershire, UK) instrument.
TEM micrographs were collected on suspensions of ATOu and ATOc nanoparticles using a Philips CM12 microscope (Amsterdam, The Netherlands) operating at an accelerating voltage equal to 110 kV and equipped with a Gatan 791 CCD camera. TEM micrographs were also acquired on the films using a Zeiss EM 900 microscope (Oberkochen, Germany) operating at an accelerating voltage equal to 80 kV on ultrathin sections. TEM specimens characterized by a thickness of 40 nm were prepared with a Leica EM FCS cryo-ultracut microtome (Wetzlar, Germany) equipped with a diamond knife.
TGA was performed with a SII TG/DTA 7200 EXSTAR Seiko analyzer (Chiba, Japan), under heating from 30 to 700 °C, at a 10 °C /min rate. Air was fluxed at 200 mL/min during all measurements. The ATOc powder used for the TGA measurement was obtained from the commercial dispersion after evaporation of the ethyl alcohol using a rotary evaporator at 60 °C and 18 mmHg.
DSC experiments were performed on the films using a Seiko SII ExtarDSC7020 calorimeter (Chiba, Japan) with the following thermal protocol: first cooling from 20 to 0 °C; at 0 °C for 2 min; first heating from 0 to 110 °C; 110 °C for 2 min; second cooling from 110 to 0 °C; at 0 °C for 2 min; second heating from 0 to 110 °C; 110 °C for 2 min; third cooling from 110 to 20 °C. The cooling/heating rate was always 10 °C /min except for the last cooling process, when it was fixed to 30 °C /min. The sample amount used for DSC was ~5 mg. Before the DSC measurements, the samples were carefully dried by heating at 100 °C at a pressure of 10−2 Torr for 12 h and afterwards kept under a nitrogen atmosphere. The glass transition temperature was determined using the tangents to the measured heat capacities below and above the heat capacity step via the Muse TA Rheo System software (version 3.0). The heat capacity curves of the polymer fraction in the nanocomposites were directly compared using the procedure reported by Cangialosi et al. [31]. Briefly, specific heat capacities of the polymer fraction in the composites, Cp,polymer, were derived from the measured specific heat capacities, Cp,tot (shown in the Supporting Information, Figure S1), by applying the following equation:
C p , p o l y m e r ( T ) = C p , t o t ( T ) w t % A T O C p , A T O ( T ) w t % p o l y m e r ,
where Cp,ATO is the ATO specific heat and wt %ATO and wt %polymer are the concentrations of ATO NPs and the polymer, respectively. Next, these specific heat capacities were aligned to the specific heat capacity of the pure PVB above the glass transition by shifting and rotating.
UV-Vis-NIR spectra were recorded with an Agilent Cary 5000 UV-Vis-NIR spectrophotometer (Santa Clara, CA, USA) in the wavelength range between 200 and 3000 nm. In order to evaluate the performances of the samples, light transmittance τv (wavelength range 380–780 nm) and solar direct transmittance τe (wavelength range 780–2500 nm) were calculated in compliance with CEN EN 410/2011 [32].

2.4. NMR Measurements and Data Analysis

Time domain 1H NMR measurements were performed at 20.7 MHz using a Niumag permanent magnet interfaced with a Stelar PC-NMR console. The temperature of the samples was controlled within ±0.1 °C through a Stelar VTC90 variable temperature controller (Mede, Italy). The 1H 90° pulse duration was 3 μs. On-resonance signals were recorded using the solid echo pulse sequence [33] with an echo time of 14 μs. One hundred and twenty-eight transients were accumulated, and the recycle delay was 3 s. The experiments were performed at 30 and 100 °C, inserting the sample in the pre-heated probe and letting it equilibrate for 10 min. At 100 °C, the signal decay was so slow that field inhomogeneity effects became relevant. In order to exclude these effects, we also performed experiments applying the Carr–Purcell–Meiboom–Gill (CPMG) pulse sequence [34]. The time between successive 180° pulses was 32 μs and the number of transients accumulated was 400.
The 1H longitudinal relaxation times, T1, were measured at different Larmor frequency values over the 10 kHz–35 MHz range using a Spinmaster FFC-2000 (Stelar srl, Mede, Italy) relaxometer. The measurements were performed using the prepolarized and non-prepolarized pulse sequences below and above 10 MHz, respectively [35,36]. In the former case, a polarizing field of 0.6 T, corresponding to a 1H Larmor frequency of 25.0 MHz, was used. The detection field was 0.5 T, corresponding to a 1H Larmor frequency of 21.5 MHz; the switching time was 3 ms and the probe dead time was 14 μs. The 90° pulse duration was 9.7 μs and 2 scans were accumulated. All the other experimental parameters were optimized for each experiment. Each relaxation trend was acquired with at least 16 values of the variable delay t and was then fitted to the following equation using the SpinMaster fitting procedure.
M ( t ) = M r e l a x + ( M p o l M r e l a x ) e x p ( t / T 1 ) ,
In this equation, Mpol and Mrelax represent the magnetization values in the polarizing and relaxation fields, respectively, with Mpol = 0 for the non-prepolarized experiments. In all cases, the experimental trends were well reproduced by this equation, with errors on T1 values lower than 5%. Experiments were performed on heating in the 90–120 °C temperature range, letting the sample temperature equilibrate for 10 min. The temperature of the sample was controlled within ±0.1 °C with a Stelar VTC90 unit.
Before the NMR measurements, the films were heated at 100 °C at a pressure of 10−2 Torr for 12 h and afterwards kept under a nitrogen atmosphere. All the measurements were carried out using air as heating gas.

3. Results and Discussion

3.1. Estimate of Coating Degree in ATOc Nanoparticles

Thermogravimetric analysis was performed on the uncoated ATOu and coated ATOc NPs, as well as on the pure MPS coating; results are shown in Figure 2. For both NP samples, the weight loss below 100 °C can be attributed to the desorption of water from the oxide surface, which was more relevant in ATOu, which showed most of the mass loss (2.4%) at temperatures below 100 °C. On the other hand, ATOc exhibited a mass loss lower than 1% below 100 °C, but it lost 9 wt % of its mass between 100 and 700 °C because of the degradation of the coating agent MPS, with the maximum degradation rate occurring at about 330 °C. Since pure MPS shows a TGA profile typical of an evaporating liquid, with the maximum weight loss rate reached at 185 °C (see inset of Figure 2), the behavior of ATOc indicates that MPS is chemically bonded to the surface of ATO particles.
The amount of MPS on the ATO surface, Q, could be estimated using the weight loss (wl) in the range between 100 and 700 °C and obtaining the surface area of the remaining 100-wl ATO, SATO, from the DLS nanoparticle diameter, d, according to the equation
S A T O = 6 V A T O d = 6 d 100 w l ρ A T O .
Assuming a density for ATO, ρATO, of 6.8 g/cm3, Q (= wl/(MwMPSSATO), where MwMPS is the MPS molecular weight) resulted to be 8 ± 1 μmol/m2, which is close to the calculated value of 6.9 μmol/m2 needed for a monolayer when the rod-shaped MPS molecules are perpendicular to the surface [37,38].

3.2. Dispersion of ATO NPs in Ethyl Alcohol and in PVB-ATO Films

Figure 3 shows TEM micrographs of suspensions of ATOu and ATOc NPs in ethyl alcohol. It can be observed that, in both cases, primary particles (with diameters of about 10 nm) tended to form aggregates with average dimensions on the order of a few tens of nanometers; the size distribution was more uniform for ATOc than for ATOu. The analysis of DLS data gave a major population with average diameters of 34 ± 2 nm and 18 ± 2 nm for ATOu and ATOc NPs, respectively, with also a minor population of larger NPs for ATOu. Considering the primary nanoparticle diameter determined from TEM micrographs, we can infer that DLS detected the nanoparticle aggregates present in the dispersions.
TEM micrographs of the PVB-ATOu-5 and PVB-ATOc-5 composite films are shown in Figure 4: the images clearly show that the primary nanoparticles form aggregates in the polymer matrix. In the PVB-ATOc-5 sample (Figure 4b,d), round sub-micrometric/micrometric aggregates were observed together with elongated structures characterized by a thickness of up to a few hundreds of nanometers and length of tens of micrometers. The analysis of TEM images indicated a relatively broad distribution of round aggregate sizes (Figure 5) with a mode of 300 nm and a median of 500 nm. It should be noticed that these are upper bounds for the real sizes because superposition effects resulting from the thickness of the TEM specimens may lead to overestimating the real sizes [39]. In the PVB-ATOu-5 sample (Figure 4a,c), essentially only elongated structures were observed with a width of about 250 nm.
The morphologies shown by the two samples may be grossly accounted for considering that the films were prepared by casting a dispersion of ATO NPs in an alcoholic solution of PVB. After this dispersion was transferred onto the Teflon dish, all the particles moved about through Brownian motion during ethyl alcohol evaporation, allowing particles to arrange into microstructures in accordance with the evolution of interactions between them during the drying process [9]. In general, in the absence of a repulsive barrier between the NPs, aggregation is expected to be faster and controlled by Brownian motion, thus resulting in tenuous and open fractal structures; on the other hand, if a repulsive barrier exists, aggregation should be slower and controlled by the repulsive interparticle potential, giving rise to denser aggregates which may tend towards round shapes [40]. In our systems, no repulsive barrier exists between the uncoated NPs, whereas a repulsive net interaction between the coated NPs establishes due to the MPS layer [41]. Therefore, our observations reflect the tendency of ATO NPs to aggregate in network structures when they are bare [7,9,10,13,18] and to form round sub-micrometric particles when they are coated [12,15,16].
An estimate of the distance between the surfaces of two neighbouring NP aggregates, h, was obtained from the analysis of TEM data using Equation (4):
h = L [ ( φ m φ ) 1 n 1 ] ,
with n = 3 or 2 for spherical or cylindrical aggregates, respectively [42]. φ is the aggregate volume fraction, φm is the maximum packing fraction (assumed to be 0.64, the value for random close packing of spheres [43] or 0.91 for aligned cylinders packed with hexagonal symmetry [44]), and L is the diameter of the aggregate.
For PVB-ATOu-5, where only chain-like structures were observed, h was estimated setting n = 2 and found to be around 2 μm. Assuming the same chain dimensions for PVB-ATOu-23, h was found 700 nm. For PVB-ATOc-5, h values in the range between 1 and 3 μm were estimated, assuming that all aggregates are spherical; since also chain-like structures are present, these represent lower limiting values.

3.3. Thermal Degradation of the PVB-ATO Nanocomposites

Considering that the thermal stability is an important property for nanocomposite applications, the effect of ATO on the thermal degradation of our films under oxidative conditions was also investigated. Thermogravimetric analyses of neat PVB and PVB-ATO composites are shown in Figure 6. The TGA profile of PVB (Figure 6a) is similar to that reported for Butvar B90® in similar conditions [45]. The 2.3% weight loss below 100 °C, shown in the inset, is due to water desorption [46]. This process was shifted to higher temperatures in the composites and was completed by 120 °C. For the main degradation process, the temperature of the maximum degradation rate, Tmax, obtained from the TG derivative profile, dTG, was 376 °C for PVB. Tmax shifted to a lower value for the composites, with the effect being more pronounced for samples containing ATOu, as displayed in Table 1. In fact, it has been observed that some oxides [47,48] and acids [49] accelerate the decomposition of PVB.

3.4. Interaction between PVB and ATO NPs in the Nanocomposites

3.4.1. Fraction of Interacting Polymer

The fraction of the interacting polymer was estimated from TEM data using Equation (5) [50]:
f b o u n d   p o l y m e r = V b o u n d   p o l y m e r V t o t a l   p o l y m e r = ( L 2 + I L ) n ( L 2 ) n ( L 2 ) n φ 1 φ ,
where IL is the width of the polymer layer that interacts with the NP aggregates, and the other parameters are defined as in Equation (4). Setting IL = 2 nm, which is a typical reported value [31], and considering spherical aggregates, we found that fbound polymer is only 0.2% for PVB-ATOc-23, the nanocomposite with the higher NP loading. If no aggregation occurred, a theoretical value of 8%–10% would be expected. In the case of the PVB-ATOu-23, where the morphology of the aggregates is approximately cylindrical, the fraction of interacting polymer resulted as even lower (0.1%). On the basis of these results, we can state that, as expected, the aggregation of ATO NPs in our systems brings a dramatic reduction of the fraction of interacting polymer fbound polymer, which indeed becomes negligible.

3.4.2. DSC Data

In order to appreciate the possible effect of the NPs on the thermal properties of the polymer, DSC was conducted on the PVB-ATO composites and on PVB. The DSC thermograms, shown in Figure 7, were aligned according to the procedure outlined in the Materials and Methods section to allow a direct comparison of the heat capacity curves due to the polymer fraction. All the thermograms displayed a baseline shift corresponding to the change in the specific heat from the glass to the melt. For PVB, the glass transition occurred at 70.0 °C. With increasing in the ATO NP content, the glass transition temperature, Tg, slightly increased for the PVB-ATOu composites, whereas it decreased for the PVB-ATOc ones (Table 1). However, since the Tg values changed by only 2–3 °C for a loading level as high as 23 wt %, the observed differences were judged insignificant. As a matter of fact, recent investigations have shown negligible changes in Tg in polymeric nanocomposites, regardless of the polymer–surface interactions, which have been explained by considering that the DSC glass transition is sensitive only to the bulk of the sample and not to the interface [51,52].
In addition, one should notice that for PVB-ATOu-23, the height of the specific heat capacity step at Tg, as determined from the curve in Figure 7, was significantly reduced compared to that observed in the other samples. Considering the low fraction of the interacting polymer estimated for this sample, this reduction is attributed to an enhanced specific heat of the polymer in the glassy state in the nanocomposite compared to the neat PVB, in line with studies reported on other nanocomposites characterized by relatively low loadings [31]. We exclude that the reduction could be attributed to the presence of an immobilized polymer layer close to the NP surface, as done in cases where the specific surface area is considerably larger than that estimated in the present work [53].

3.4.3. NMR Data

The interaction of the polymer with the filler might induce changes in the dynamics of PVB. In order to detect possible differences in the mobility of PVB in the composites with respect to pristine PVB, 1H free induction decays (FIDs) were acquired using the solid echo pulse sequence. This technique allows motions with characteristic frequencies smaller or larger than tens of kHz, corresponding to the static 1H–1H dipolar interaction, to be revealed. In particular, slower motions result in a short decaying signal, whereas faster ones give rise to longer decays. In the glass at 30 °C, no differences among the samples were detected, as shown in Figure 8a. In all cases, the decay occurred within 30 μs, indicating that the hydrogen atoms of the polymer were in a rigid glassy environment with characteristic motional frequencies smaller than tens of kHz. At 100 °C, the decays occurred over a much longer time scale for all samples, with the signals persisting after 200 μs from the echo maximum (Figure 8b). At this temperature, CPMG experiments, in which effects on the signal decay due to field inhomogeneities are avoided, confirmed the similar behavior for all the samples (data not shown). These findings indicate a softening of the polymer above Tg, with no detectable residual glassy domains at the interface between the NPs and the polymer, in agreement with the negligible interacting polymer fraction estimated by TEM. The very similar results obtained for pristine PVB and PVB-ATO at different loadings also show that the polymer dynamics was not appreciably affected by the filler.
It is worthy of note that similar signal decays might be observed notwithstanding the different frequency distribution of chain motions. In order to verify possible effects on the motional frequency distribution, a more detailed analysis of the motional behavior was performed by exploiting 1H FFC NMR relaxometry. Indeed, this technique allows polymer dynamics to be investigated by measuring the dependence of the proton longitudinal relaxation rates 1/T1 on the Larmor frequency; i.e., the so-called NMR relaxation dispersion (NMRD) curve. This technique is sensitive to motions characterized by frequencies ranging from 10 kHz to tens of MHz. In a previous study on pure PVB [54], FFC NMR relaxometry allowed different motional processes to be identified above Tg: segmental dynamics with characteristic frequencies of 105–106 Hz and faster local motions with frequencies higher than 107 Hz. In the present work, the NMRD curves were acquired on the PVB-ATO composites in the temperature range between 90 and 120 °C; representative curves are shown in Figure 9. The acquired NMRD curves clearly showed that the motional processes occurring in PVB between 105 and 107 Hz range were not affected by the presence of ATO nanoparticles.

3.5. Optical Properties of PVB-ATO Composites

3.5.1. UV-Vis-NIR Transmittance

To investigate how the content of ATO NPs affects the optical properties of the composites, we measured the UV-Vis-NIR transmittance of PVB loaded with both ATOu and ATOc NPs at filler fractions ranging from 0.5 to 5 wt %; the spectra are shown in Figure 10. The high shielding efficiency in the NIR region is due to ATO absorption [55] and has been previously observed for other nanocomposites containing ATO [12,14]. The transmittance in the visible region decreased with increased the ATO content and, at the same loading level, it was more pronounced for the composites containing ATOc compared to ATOu. This can be attributed to the fact that the morphology and dimensions of the ATOc NP aggregates favor light scattering. In fact, the intensity of the scattered light is known to increase drastically when the size of the particles is on the order of the wavelength of visible light [56]. In PVB-ATOc-5, the aggregate sizes were within the visible light wavelength range for more than half of the aggregates (Figure 5), whereas the width of the elongated NP aggregates observed in PVB-ATOu-5 (Figure 4c) was only about 250 nm.
In order to quantitatively compare the behavior of the films towards visible and near infrared light, the transmittance values of each sample were averaged over each wavelength range and are reported in Table 2. Considering that glasses in car windshields are required to have a visible transmittance larger than 70% [57], we can state that only PVB-ATOu-0.5 resulted to be almost optically transparent. In addition, this sample showed a 25% decrease in NIR transmittance with respect to neat PVB. These findings make PVB-ATOu-0.5 a promising material for the industry of functional safety glass.

3.5.2. Solar and Luminous Characteristics

The performance of the investigated films as plastic layers in low emissive laminated glasses for glazing in energy-saving buildings was evaluated on the basis of visible light transmittance τv and solar direct transmittance τe, as defined in CEN EN 410/2011 [32]. τv represents the glazing system capacity to diffuse the natural light indoors as perceived by the human eye. A higher τv value ensures a better capacity, which is desirable for saving electric energy in the daytime. τe contributes to the total solar energy transmittance (solar factor) together with a heat transfer factor. In this case, a lower solar factor is desirable because it means a lower heat penetration inside and a consequent reduction in air-conditioning operating costs. τv and τe values for the PVB-ATO films at different loading levels were extracted from the UV-Vis-NIR spectral data and are shown in Figure 11. The trends of τv and τe are similar to those reported in Table 2 for Vis and NIR transmittances, respectively, and confirm that PVB-ATOu-0.5 is the best-performing material. In fact, it induces a significant reduction of τe compared to pure PVB while leaving τv at acceptably high values.

4. Conclusions

Films of PVB-ATO composites prepared by solution casting were studied using a multi-technique approach. The primary ATO NPs were found to aggregate in different morphologies depending on the presence of a coating on the NP surface: elongated fractal structures characterized by a thickness of about 250 nanometers and a length of tens of micrometers and spherical aggregates with sizes of hundreds of nm were found for the uncoated and coated NPs, respectively. This aggregation, reducing the filler surface area, resulted in a negligible fraction of polymer interacting with the NPs, as also suggested by the lack of significant effects on the polymer glass transition temperature and on the polymer dynamics, as determined by calorimetric and NMR relaxometry experiments. On the other hand, ATO NPs significantly modified the optical properties of the films, with their presence resulting in a high shielding efficiency in the NIR region together with a reduced transmittance in the visible region. These effects were more pronounced for the composites containing ATOc and were ascribed to the comparable size of the NP aggregates with the light wavelength. PVB-ATOu-0.5 showed the best performance in terms of light transmittance and solar direct transmittance, which are both relevant parameters for glazing in building.
The applied thorough multi-technique approach was extremely useful in unraveling the effect of ATO NPs on PVB properties which are fundamental for potential industrial applications, such as glass transition temperature, thermal degradation and response to UV, Vis and NIR light, and allowed these properties to be correlated to structural and dynamic properties of the different composite components at the microscopic level.

Supplementary Materials

The following are available online at https://0-www-mdpi-com.brum.beds.ac.uk/2079-6412/9/4/247/s1, Figure S1: Specific heat capacity of nanocomposites in respect to sample mass. Specific heat capacities of ATOu and ATOc are also shown.

Author Contributions

Conceptualization, S.P. and S.B.; Methodology, T.G., S.B., S.P., L.C.; Software, T.G., C.S. and S.P.; Validation, C.S., T.G., S.P. and L.C.; Formal Analysis, T.G., C.S. and S.P.; Investigation, T.G., C.S., S.P. and L.C.; Resources, C.F. and S.B.; Data Curation, S.P. and S.B.; Writing—Original Draft Preparation, S.P.; Writing—Review & Editing, S.P., C.F., L.C., T.G. and S.B.; Visualization, S.P., T.G. and C.S.; Supervision, S.P., L.C. and S.B.; Project Administration, S.P. and S.B.; Funding Acquisition, S.B.

Funding

This work was partially supported by Regione Toscana in the framework of the project SELFIE (Bando FAR-FAS 2014-Programma PAR FAS 2007-2013- Linea d’Azione 1.1).

Acknowledgments

We acknowledge Marco Geppi for kindly letting us use the 20.7 MHz spectrometer and Maria Cristina Righetti for helpful discussion. In addition, we would like to acknowledge the contribution of the COST Action CA15209 (Eurelax: European Network on NMR Relaxometry).

Conflicts of Interest

The authors declare no conflict of interest.

References

  1. Alexandre, M.; Dubois, P. Polymer-layered silicate nanocomposites: Preparation, properties and uses of a new class of materials. Mater. Sci. Eng. R Rep. 2000, 28, 1–63. [Google Scholar] [CrossRef]
  2. Winey, K.I.; Vaia, R.A. Polymer nanocomposites. MRS Bull. 2007, 32, 314–322. [Google Scholar] [CrossRef]
  3. Krishnamoorti, R. Strategies for dispersing nanoparticles in polymers. MRS Bull. 2007, 32, 341–347. [Google Scholar] [CrossRef]
  4. Mackay, M.E.; Tuteja, A.; Duxbury, P.M.; Hawker, C.J.; Van Horn, B.; Guan, Z.; Chen, G.; Krishnan, R.S. General strategies for nanoparticle dispersion. Science 2006, 311, 1740–1743. [Google Scholar] [CrossRef] [PubMed]
  5. Min, Y.; Akbulut, M.; Kristiansen, K.; Golan, Y.; Israelachvili, J. The role of interparticle and external forces in nanoparticle assembly. Nat. Mater. 2008, 7, 527–538. [Google Scholar] [CrossRef]
  6. Natarajan, B.; Li, Y.; Deng, H.; Brinson, L.C.; Schadler, L.S. Effect of interfacial energetics on dispersion and glass transition temperature in polymer nanocomposites. Macromolecules 2013, 46, 2833–2841. [Google Scholar] [CrossRef]
  7. Sun, J.; Gerberich, W.W.; Francis, L.F. Electrical and optical properties of ceramic-polymer nanocomposite coatings. J. Polym. Sci. Part B: Polym. Phys. 2003, 41, 1744–1761. [Google Scholar] [CrossRef]
  8. Sun, J.; Velamakanni, B.V.; Gerberich, W.W.; Francis, L.F. Aqueous Latex/Ceramic Nanoparticle dispersions: Colloidal stability and coating properties. J. Colloid Interface Sci. 2004, 280, 387–399. [Google Scholar] [CrossRef] [PubMed]
  9. Wang, Y.; Anderson, C. Formation of thin transparent conductive composite films from aqueous colloidal dispersions. Macromolecules 1999, 32, 6172–6179. [Google Scholar] [CrossRef]
  10. Wakabayashi, A.; Sasakawa, Y.; Dobashi, T.; Yamamoto, T. Optically transparent conductive network formation induced by solvent evaporation from tin-oxide-nanoparticle suspensions. Langmuir 2007, 23, 7990–7994. [Google Scholar] [CrossRef]
  11. Kleinjan, W.E.; Brokken-Zijp, J.C.M.; van de Belt, R.; Chen, Z.; de With, G. Antimony-doped tin oxide nanoparticles for conductive polymer nanocomposites. J. Mater. Res. 2008, 23, 869–880. [Google Scholar] [CrossRef]
  12. Zhou, H.; Wang, H.; Tian, X.; Zheng, K.; Cheng, Q. Preparation and properties of waterborne polyurethane/antimony doped Tin oxide nanocomposite coatings via Sol–Gel reactions. Polym. Compos. 2014, 35, 1169–1175. [Google Scholar] [CrossRef]
  13. Wu, K.; Xiang, S.; Zhi, W.; Bian, R.; Wang, C.; Cai, D. Preparation and characterization of UV curable waterborne Poly(Urethane-Acrylate)/Antimony doped Tin Oxide thermal insulation coatings by Sol-Gel process. Prog. Org. Coat. 2017, 113, 39–46. [Google Scholar] [CrossRef]
  14. Mei, S.-G.; Ma, W.-J.; Zhang, G.-L.; Wang, J.-L.; Yang, J.-H.; Li, Y.-Q. Transparent ATO/Epoxy nanocomposite coating with excellent thermal insulation property. Micro Nano Lett. 2012, 7, 12–14. [Google Scholar] [CrossRef]
  15. Zhang, G.; Yan, W.; Jiang, T. Fabrication and thermal insulating properties of ATO/PVB nanocomposites for energy saving glass. J. Wuhan Univ. Technol. Mater. Sci. Ed. 2013, 28, 912–915. [Google Scholar] [CrossRef]
  16. Pan, W.; Zhang, H.; Chen, Y. Electrical and mechanical properties of PMMA/Nano-ATO composites. J. Mater. Sci. Tech. (Shenyang, China) 2009, 25, 247–250. [Google Scholar]
  17. Pan, W.; Zou, H. Characterization of PAN/ATO nanocomposites prepared by solution blending. Bull. Mater. Sci. 2008, 31, 807–811. [Google Scholar] [CrossRef]
  18. Pan, W.; He, X.; Chen, Y. Preparation and characterization of Poly (Vinyl Alcohol)/Antimony-Doped Tin Oxide nanocomposites. Int. J. Polym. Mater. Polym. Biomater. 2011, 60, 223–232. [Google Scholar] [CrossRef]
  19. Posthumus, W.; Laven, J.; de With, G.; van der Linde, R. Control of the electrical conductivity of composites of antimony Doped Tin Oxide (ATO) nanoparticles and acrylate by grafting of 3-Methacryloxypropyltrimethoxysilane (MPS). J. Colloid Interface Sci. 2006, 304, 394–401. [Google Scholar] [CrossRef] [PubMed]
  20. Kaufman, S.; Slichter, W.P.; Davis, D. Nuclear magnetic resonance study of rubber–carbon black interactions. J. Polym. Sci. A-2, Polym. Phys. 1971, 9, 829–839. [Google Scholar] [CrossRef]
  21. Litvinov, V.; Steeman, P. EPDM−Carbon Black Interactions and the reinforcement mechanisms, As studied by Low-Resolution 1H NMR. Macromolecules 1999, 32, 8476–8490. [Google Scholar] [CrossRef]
  22. Dreiss, C.A.; Cosgrove, T.; Benton, N.J.; Kilburn, D.; Alam, M.A.; Schmidt, R.G.; Gordon, G.V. Effect of crosslinking on the mobility of PDMS filled with polysilicate nanoparticles: positron Lifetime, rheology and NMR relaxation studies. Polymer (Guildf) 2007, 48, 4419–4428. [Google Scholar] [CrossRef]
  23. Papon, A.; Montes, H.; Hanafi, M.; Lequeux, F.; Guy, L.; Saalwächter, K. Glass-Transition temperature gradient in nanocomposites: evidence from nuclear magnetic resonance and differential scanning calorimetry. Phys. Rev. Lett. 2012, 108, 1–5. [Google Scholar] [CrossRef] [PubMed]
  24. Kim, S.Y.; Meyer, H.W.; Saalwächter, K.; Zukoski, C.F. Polymer dynamics in PEG-Silica nanocomposites: Effects of polymer molecular weight, temperature and solvent dilution. Macromolecules 2012, 45, 4225–4237. [Google Scholar] [CrossRef]
  25. Valle Iulianelli, G.C.; dos S. David, G.; dos Santos, T.N.; Sebastião, P.J.O.; Tavares, M.I.B. Influence of TiO2 nanoparticle on the thermal, morphological and molecular characteristics of PHB matrix. Polym. Test. 2018, 65, 156–162. [Google Scholar] [CrossRef]
  26. Brito, L.M.; Chávez, F.V.; Bruno Tavares, M.I.; Sebastião, P.J.O. Molecular dynamic evaluation of starch-PLA blends nanocomposite with organoclay by proton NMR relaxometry. Polym. Test. 2013, 32, 1181–1185. [Google Scholar] [CrossRef]
  27. Krzaczkowska, J.; Strankowski, M.; Jurga, S.; Jurga, K.; Pietraszko, A. NMR dispersion studies of Poly(Ethylene Oxide)/Sodium montmorillonite nanocomposites. J. Non-Cryst. Solids 2010, 356, 945–951. [Google Scholar] [CrossRef]
  28. Fernández, M.D.; Fernández, M.J.; Hoces, P. Synthesis of Poly (Vinyl Butyral)s in homogeneous phase and their thermal properties. J. Appl. Polym. Sci. 2006, 102, 5007–5017. [Google Scholar] [CrossRef]
  29. Gupta, S.; Seethamraju, S.; Ramamurthy, P.C.; Madras, G. Polyvinylbutyral based hybrid organic/inorganic films as a moisture barrier material. Ind. Eng. Chem. Res. 2013, 52, 4383–4394. [Google Scholar] [CrossRef]
  30. Roy, A.S.; Gupta, S.; Seethamraju, S.; Madras, G.; Ramamurthy, P.C. Impedance spectroscopy of novel hybrid composite films of Polyvinylbutyral (PVB)/Functionalized mesoporous silica. Compos. Part B Eng. 2014, 58, 134–139. [Google Scholar] [CrossRef]
  31. Cangialosi, D.; Boucher, V.M.; Alegría, A.; Colmenero, J. Enhanced physical aging of polymer nanocomposites: The key role of the area to volume ratio. Polymer (Guildf) 2012, 53, 1362–1372. [Google Scholar] [CrossRef] [Green Version]
  32. IS EN 410 Glass in Building. Determination of Luminous and Solar Characteristics of Glazing; National Standards Authority of Ireland: Dublin, Ireland, 2011. [Google Scholar]
  33. Powles, J.G.; Strange, J.H. Zero Time resolution nuclear magnetic resonance transient in solids. Proc. Phys. Soc. Lond. 1963, 82, 6–15. [Google Scholar] [CrossRef]
  34. Meiboom, S.; Gill, D. Modified spin—Echo method for measuring nuclear relaxation times. Rev. Sci. Instrum. 1958, 29, 688–691. [Google Scholar] [CrossRef]
  35. Anoardo, E.; Galli, G.; Ferrante, G. Fast-Field-Cycling NMR: Applications and instrumentation. Appl. Magn. Reson. 2001, 20, 365–404. [Google Scholar] [CrossRef]
  36. Kimmich, R.; Anoardo, E. Field-Cycling NMR Relaxometry. Prog. Nucl. Magn. Reson. Spectrosc. 2004, 44, 257–320. [Google Scholar] [CrossRef]
  37. Miller, J.D.; Ishida, H. Quantitative Monomolecular coverage of inorganic particulates by methacryl-functional silanes. Surf. Sci. 1984, 148, 601–622. [Google Scholar] [CrossRef]
  38. Posthumus, W.; Magusin, P.C.M.M.; Brokken-Zijp, J.C.M.; Tinnemans, A.H.A.; van der Linde, R. Surface modification of oxidic nanoparticles using 3-methacryloxypropyltrimethoxysilane. J. Colloid Interface Sci. 2004, 269, 109–116. [Google Scholar] [CrossRef]
  39. Hajji, P.; David, L.; Gerard, J.F.; Pascault, J.P.; Vigier, G. Synthesis, structure, and morphology of polymer–silica hybrid nanocomposites based on hydroxyethyl Methacrylate. J. Polym. Sci. Part B Polym. Phys. 1999, 37, 3172–3187. [Google Scholar] [CrossRef]
  40. Meakin, P.; Jullien, R. The effects of restructuring on the geometry of clusters formed by diffusion-limited, ballistic, and reaction-limited cluster-cluster aggregation. J. Chem. Phys. 1988, 89, 246–250. [Google Scholar] [CrossRef]
  41. Miller, K.T.; Zukoski, C.F. The mechanics of nanoscale suspensions. In Semiconductor Nanoclusters—Physical, Chemical, and Catalytic Aspects; Kamat, P.V., Meisel, D., Eds.; Elsevier: Amsterdam, The Netherlands, 1997; Volume 103, pp. 23–55. [Google Scholar]
  42. Hao, T.; Riman, R.E. Calculation of interparticle spacing in colloidal systems. J. Colloid Interface Sci. 2006, 297, 374–377. [Google Scholar] [CrossRef]
  43. Bernal, J.D.; Mason, J. Packing of spheres: Co-ordination of randomly packed spheres. Nature 1960, 188, 910–911. [Google Scholar] [CrossRef]
  44. Bezdek, A.; Kuperberg, W. Maximum density space packing with congruent circular cylinders of infinite length. Mathematika 1990, 37, 74–80. [Google Scholar] [CrossRef]
  45. Liau, L.C.-K.; Chien, Y.-C. Kinetic investigation of ZrO2, Y2O3, and Ni on Poly (Vinyl Butyral) thermal degradation using nonlinear heating functions. J. Appl. Polym. Sci. 2006, 102, 2552–2559. [Google Scholar] [CrossRef]
  46. Carini, G., Jr.; Bartolotta, A.; Carini, G.; D’Angelo, G.; Federico, M.; Di Marco, G. Water-Driven segmental cooperativity in polyvinyl butyral. Eur. Polym. J. 2018, 98, 172–176. [Google Scholar] [CrossRef]
  47. Masia, S.; Calvert, P.D.; Rhine, W.E.; Bowen, H.K. Effect of oxides on binder burnout during ceramics processing. J. Mater. Sci. 1989, 24, 1907–1912. [Google Scholar] [CrossRef]
  48. Saravanan, S.; Gupta, S.; Ramamurthy, P.C.; Madras, G. Effect of silane functionalized alumina on Poly(Vinyl Butyral) nanocomposite films: Thermal, mechanical, and moisture barrier studies. Polym. Compos. 2014, 35, 1426–1435. [Google Scholar] [CrossRef]
  49. Liu, R.; He, B.; Chen, X. Degradation of Poly(Vinyl Butyral) and its stabilization by bases. Polym. Degrad. Stab. 2008, 93, 846–853. [Google Scholar] [CrossRef]
  50. Becker, C.; Krug, H. Schmidt, tailoring of thermomechanical properties of thermoplastic nanocomposites by surface modification of nanoscale silica particles. Mater. Res. Soc. Symp. Proc. 1996, 435, 237–242. [Google Scholar] [CrossRef]
  51. Moll, J.; Kumar, S.K. Glass transitions in highly attractive highly filled polymer nanocomposites. Macromolecules 2012, 45, 1131–1135. [Google Scholar] [CrossRef]
  52. Holt, A.P.; Griffin, P.J.; Bocharova, V.; Agapov, A.L.; Imel, A.E.; Dadmun, M.D.; Sangoro, J.R.; Sokolov, A.P. Dynamics at the Polymer/Nanoparticle Interface in Poly(2-vinylpyridine)/Silica Nanocomposites. Macromolecules 2014, 47, 1837–1843. [Google Scholar] [CrossRef]
  53. Sargsyan, A.; Tonoyan, A.; Davtyan, S.; Schick, C. The amount of immobilized polymer in PMMA SiO2 nanocomposites determined from calorimetric data. Eur. Polym. J. 2007, 43, 3113–3127. [Google Scholar] [CrossRef]
  54. Pizzanelli, S.; Prevosto, D.; Guazzini, T.; Bronco, S.; Forte, C.; Calucci, L. Dynamics of Poly (Vinyl Butyral) studied using dielectric spectroscopy and 1H NMR relaxometry. Phys. Chem. Chem. Phys. 2017, 19, 31804–31812. [Google Scholar] [CrossRef]
  55. Lee, H.Y.; Cai, Y.; Bi, S.; Liang, Y.N.; Song, Y.; Hu, X.M. A Dual-Responsive nanocomposite toward climate-adaptable solar modulation for energy-saving smart windows. ACS Appl. Mater. Interfaces 2017, 9, 6054–6063. [Google Scholar] [CrossRef]
  56. Kerker, M. The Scattering of Light and Other Electromagnetic Radiation, 1st ed.; Academic Press: New York, NY, USA, 1969. [Google Scholar]
  57. ISO 3917. 2016 Road Vehicles-Safety Glazing Materials-Test Methods for Resistance to Radiation, High Temperature, Humidity, Fire and Simulated Weathering; International Organization for Standardization: Geneva, Switzerland, 2016. [Google Scholar]
Figure 1. Chemical structure of poly(vinyl butyral) (PVB). For the PVB under investigation, the molar fractions of the vinyl butyral (x), vinyl alcohol (y), and vinyl acetate (z) units are 0.55–0.57, 0.41–0.45, and 0–0.02, respectively.
Coatings 09 00247 g001
Figure 2. Thermogravimetric analysis (TGA) thermograms of bare antimony-doped tin oxide (ATOu) (red line) and surface modified ATO (ATOc) (blue line). In the inset, the TGA thermogram of pure 3-methacryloxypropyltrimethoxysilane (MPS) is shown for comparison.
Coatings 09 00247 g002
Figure 3. TEM micrographs of suspensions of ATOu (a) and ATOc (b) in ethyl alcohol.
Coatings 09 00247 g003
Figure 4. TEM micrographs of the PVB-ATOu-5 (a,c) and PVB-ATOc-5 (b,d) composite films.
Coatings 09 00247 g004
Figure 5. Aggregate size distribution of PVB-ATOc-5.
Coatings 09 00247 g005
Figure 6. TGA thermograms of PVB (black line), PVB-ATOu-5 (red solid line), PVB-ATOu-23 (red dashed line), PVB-ATOc-5 (blue solid line) and PVB-ATOc-23 (blue dashed line). The remaining weight percentage with respect to the initial value and the dTG profiles are represented in panel (a) and (b), respectively. The inset in (a) shows the weight loss due to water desorption between 30 and 200 °C.
Coatings 09 00247 g006
Figure 7. Differential scanning calorimetry (DSC) curves recorded for the PVB and PVB-ATO nanocomposites (second heating cycle). The specific heat capacity of the polymer fraction in the nanocomposites is shown and the curves are aligned to the specific heat capacity of the pure polymer above the glass transition as described in the Materials and Methods section.
Coatings 09 00247 g007
Figure 8. Comparison of the free induction decays (FIDs) exhibited by PVB and by the indicated PVB-ATO composites at 30 (a) and 100 °C (b). The FIDs were recorded by applying the solid echo pulse sequence. t indicates the time elapsed from the echo maximum. The signal intensities were scaled to the same value at t = 0 in order to facilitate the comparison of the decay rates.
Coatings 09 00247 g008
Figure 9. Comparison of the nuclear magnetic resonance relaxation dispersion (NMRD) curves exhibited by PVB and by the composites at (a) 90 °C and (b) 120 °C.
Coatings 09 00247 g009
Figure 10. UV-Vis-NIR spectra of PVB-ATOu (a) and of PVB-ATOc (b) at different loadings. The spectrum of neat PVB is reported for comparison. The abrupt jump at 800 nm is due to lamp change.
Coatings 09 00247 g010
Figure 11. Visible light transmittance, τv, and solar direct transmittance, τe, as a function of the ATO content.
Coatings 09 00247 g011
Table 1. ATO nanoparticles (NPs) weight and volume percentages, characteristic degradation temperature Tmax for the main degradation process and calorimetric Tg values of neat PVB and PVB-ATO composites.
SampleATO wt %ATO vol %Tmax (°C)Tg (°C)
PVB37670.0 ± 0.5
PVB-ATOc-550.837169.9 ± 0.5
PVB-ATOc-23234.537067.7 ± 0.5
PVB-ATOu-550.836070.6 ± 0.5
PVB-ATOu-23234.534371.2 ± 0.5
Table 2. Transmittance values of PVB and PVB-ATO films averaged over the wavelength range of visible and near infrared light.
Wt % LoadingTransmittance (%)
PVB-ATOuPVB-ATOc
NIR (780–2400 nm)Vis (380–780 nm)NIR (780–2400 nm)Vis (380–780 nm)
076757675
0.557684760
230431225
5142525

