Numerical Study on the Influence of Shaping Air Holes on Atomization Performance in Pneumatic Atomizers

College of Mechanical and Electrical Engineering, China Jiliang University, Hangzhou 310018, China
*
Author to whom correspondence should be addressed.
Coatings 2019, 9(7), 410; https://0-doi-org.brum.beds.ac.uk/10.3390/coatings9070410
Submission received: 16 May 2019
/
Revised: 23 June 2019
/
Accepted: 24 June 2019
/
Published: 27 June 2019
Abstract
:In pneumatic atomizers, the shaping air holes play an important role in the spraying system. The pressure and intersection of shaping air holes are the two most important parameters in engineering. In this paper, the Euler–Lagrangian method is used to describe the two-phase spray flow. The spraying process of the pneumatic nozzle is simulated numerically, and the experiment is designed to verify this simulation. By setting different air pressures and distances between the intersection and the paint hole, target surface pressure and droplet size distribution are investigated in detail, in order to explore the relationship between shaping air holes in pneumatic nozzles and overspray. From the results of the numerical simulation, it is found that an increase in the distance between the intersection and the paint hole increases the gas velocity at the central axis of the nozzle and the central pressure of the target surface, the droplet size becomes larger, and the distribution of droplets is more concentrated on the target surface, which easily leads to overspray. With the increase in the pressure of the shaping air holes, the central pressure of the target surface decreases, and the ovality of the spraying pattern on the target surface increases.
1. Introduction
Pneumatic atomizers are widely used in the painting industry to obtain uniform and dense coatings or better spatial atomization characteristics, especially in the automotive industry [1]. Pneumatic atomizers are attracting attention for their superior atomization performance, e.g., fine droplet size and spatial distributions. However, compared to other types of air spray painting, such as airless and air-assisted atomizers, pneumatic atomizers have low transfer efficiencies, with overspray happening from time to time. During the spraying process, the uniformity of particles on the target surface is an important factor. When the initial spraying conditions are not well selected, poor coatings with overspray often appear on the target surface.
As the core component of the atomization spraying process, nozzles directly affect the spray-painting quality. The multi-hole structure of the pneumatic nozzle, including the paint hole, annular air hole, assisting air holes, and shaping air holes, makes the primary and secondary atomization more adequate with a smaller particle size and more uniform coatings in the spraying process. In particular, with the quantitative addition of shaping air holes, the original conical flow domain in the entire spatial field is compressed along the airflow direction, from shaping air holes distributed on opposite sides. The spraying pattern changes from circular to elliptical, which makes it easier to obtain high-quality coatings with better patterns and speeds up the efficiency of spraying. The high-speed airflow from shaping air holes also makes the droplets that are formed through annular and assisting holes subject to the shear force again and makes them become more uniform.
Some experimental and numerical studies [1,2,3] of pneumatic atomizers were carried out in recent years, which focused mainly on droplet size distribution, droplets, or the airflow velocity in the flow field. Although Ye [3] studied the effect of shaping air pressure on the liquid film thickness distribution on the plate, and studies [4,5,6,7,8,9,10,11] of other air spray atomizers on overspray were also performed, the influence mechanism of shaping air holes of pneumatic nozzles on overspray was not thoroughly explored.
In this paper, the commercial CFD (Computational Fluid Dynamics) code ANSYS-Fluent 16.1, which is based on the finite-volume approach, was used for numerical simulations. The Euler–Lagrangian method was obtained to describe the two-phase spray flow. Numerical studies on the relationship between pneumatic nozzle structure and overspray are presented through changing the shaping air pressure and the position of the intersection of shaping air holes in spray-coating processes. Meanwhile, the velocity and pressure of the airflow field and the particle characteristics of the target surface at different positions of the intersection are investigated. Furthermore, the pressure and ovality of the pressure contour on the target surface are analyzed when the intersection and shaping air pressure change simultaneously, in order to explore the influence of shaping air holes on spray atomization.
2. Numerical Setup
2.1. Pneumatic Atomizer Geometry
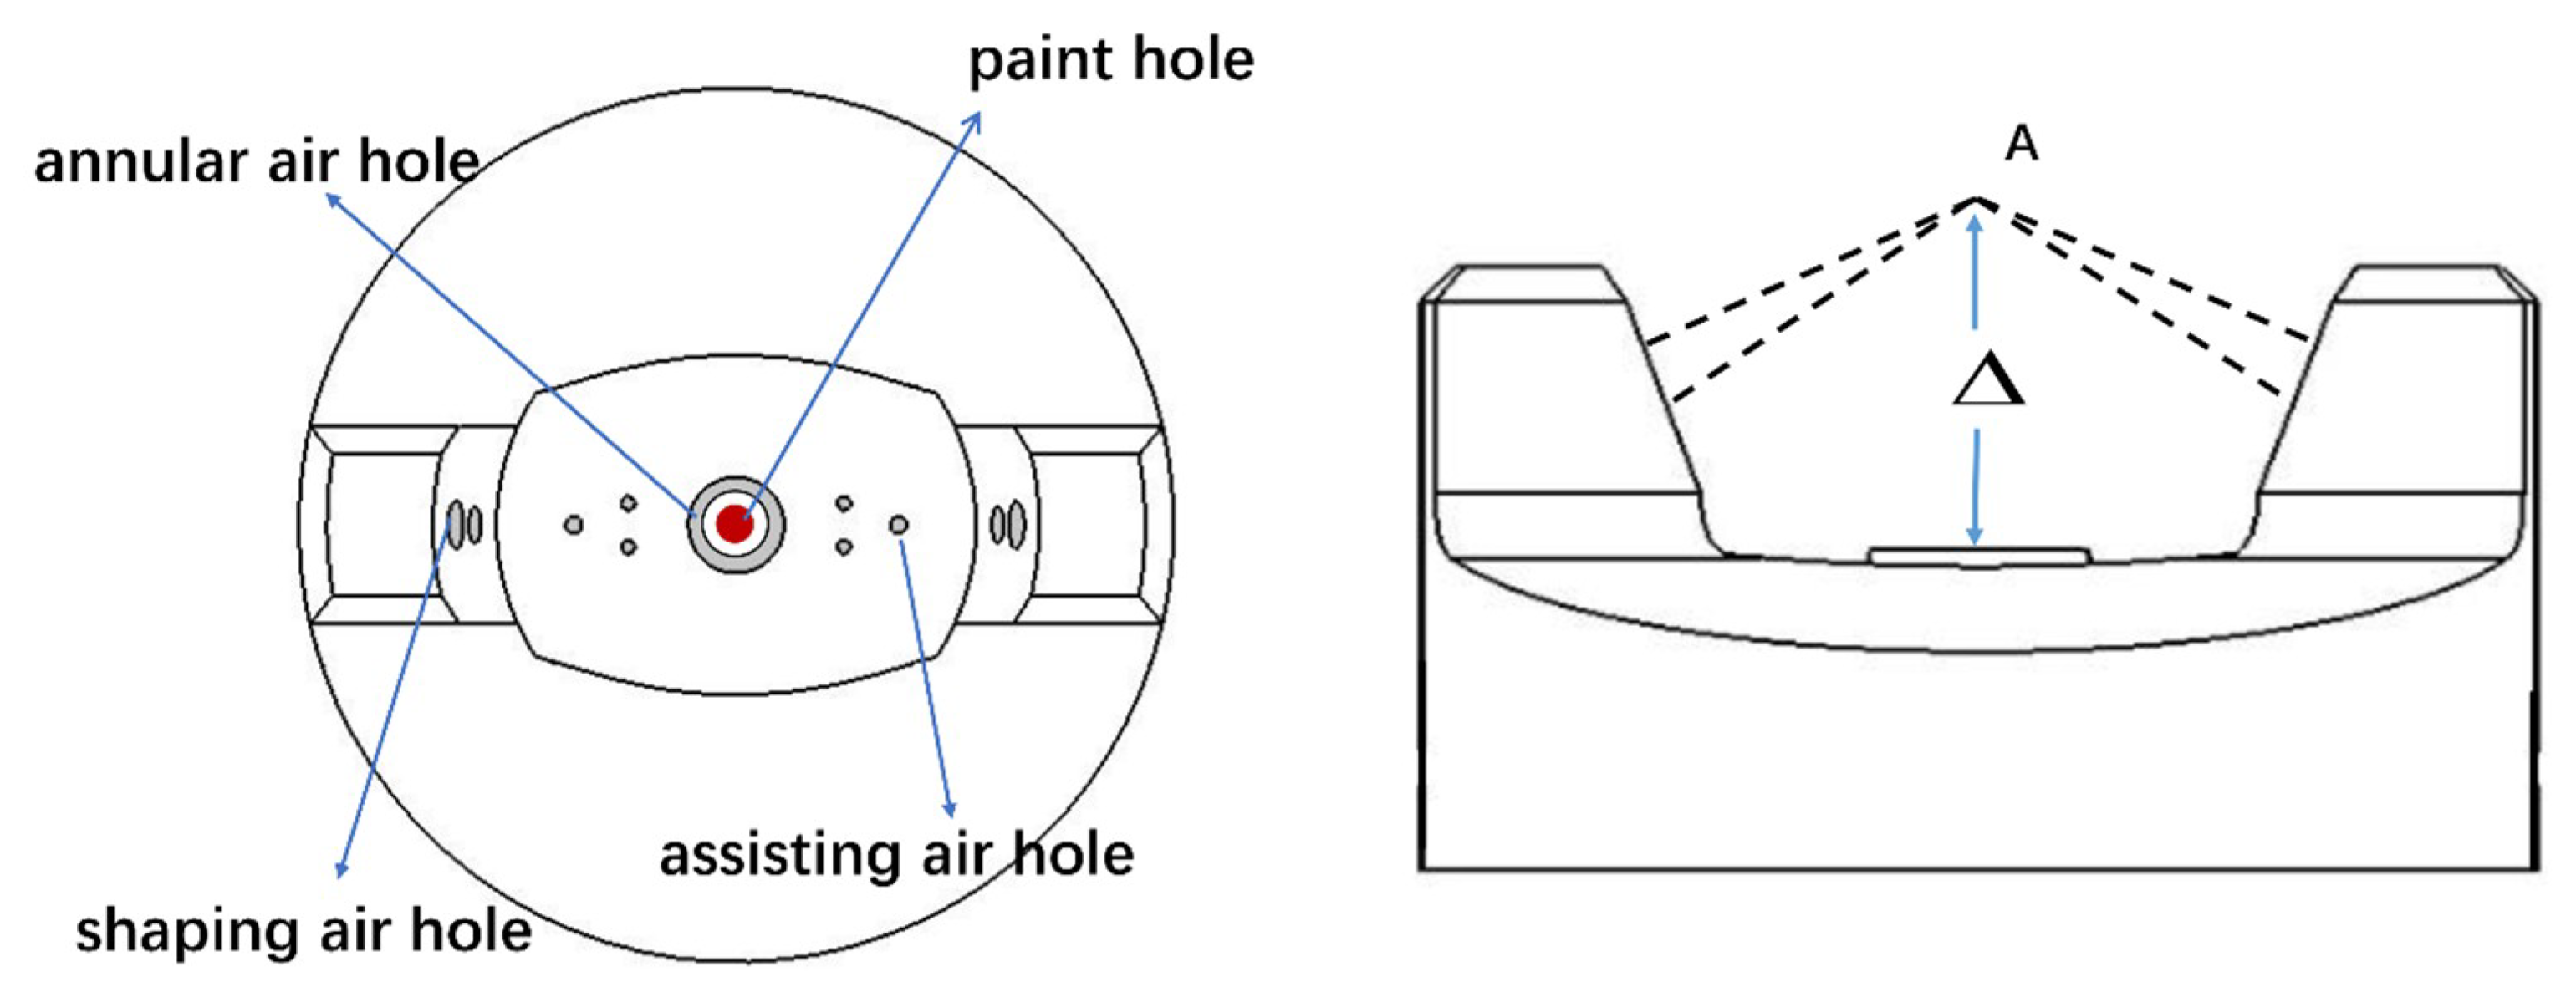
Figure 1 shows the structure of the atomizer used in this simulation. The painting liquid is injected from the paint hole, and the high-speed gas that flows from the annular air hole makes the liquid column break into smaller sub-droplets by shearing; thus, the primary atomization is the first important process in the entire atomization system. Then, small droplets are impacted by the airflow from the assisting air holes, and further broken up into more fine and uniform droplets, completing the secondary atomization of the spraying liquid. With shaping air holes acting on the spraying process, the spraying flow field is deformed from a cylinder into an elliptical column, and a narrow elliptic spraying pattern is formed on the target surface. The spray characteristics on the target surface are greatly influenced by Δ and the pressure of the shaping air hole after the shaping air holes are used in the spraying process.
2.2. Mathematical Model
2.2.1. Gas Phase
The flow field of the gas phase is based on the fundamental conservation law, namely the continuity and momentum equations, as shown in Equations (1) and (2).
where is the gas density, and is the gas velocity.
where is the pressure, is the viscous stress tensor, and is the gravitational acceleration.
The standard turbulence model is also chosen in the gas phase as follows:
where is the generation of turbulence kinetic energy due to the mean velocity gradients, is the generation of turbulence kinetic energy due to buoyancy, , , and are constants, and are the turbulent Prandtl numbers for and , respectively, and is the turbulence viscosity coefficient.
2.2.2. Discrete Phase
The discrete particle model (DPM) is used to simulate the breakup and movement of droplet particles in the nozzle field. The DPM model is a multi-phase flow model based on the Euler–Lagrange method, which can simulate the motion of the discrete phase in the continuous phase. Gas is regarded as a continuous medium in the DPM model, solving the transport equation for the continuous phase in the Eulerian coordinate system, and the droplet particle is regarded as a discrete medium. In the Lagrange coordinate system, the movement of discrete particles is solved by an integrating differential equation of particle force. The equation of motion of a particle under force is
where is the velocity vector of the continuous phase, is the velocity vector of the discrete phase, is the density of the continuous phase, is the density of the discrete phase, is the gravitational acceleration, represents the other forces acting on the particle mass, is the drag force per unit particle mass, and is the relaxation time of the particles.
The Taylor analogy breakup (TAB) [12] model analyzes the similarity between the oscillating droplet and the spring mass system. Under the action of external aerodynamics, the surface tension, and the viscous force of the droplet, the droplet breaks up. The governing equation of droplet oscillation deformation is
where x is the displacement of the droplet equator from its spherical (undisturbed) position, and the coefficient of the equation comes from the analogy of Taylor’s equation.
where is the density of the discrete phase, is the density of the continuous phase, is the initial radius of the droplet, is the relative velocity of the droplet, is the surface tension of the droplet, is the viscosity of the droplet, and , , and , which were chosen to match experiments and theory.
When the deformation of the droplets reaches the critical value, the droplets break up. The breaking requirement is as follows:
where is 0.5, meaning that breakup is assumed to occur when the distortion is equal to half the droplet radius.
2.3. Computational Domain and Initial Conditions
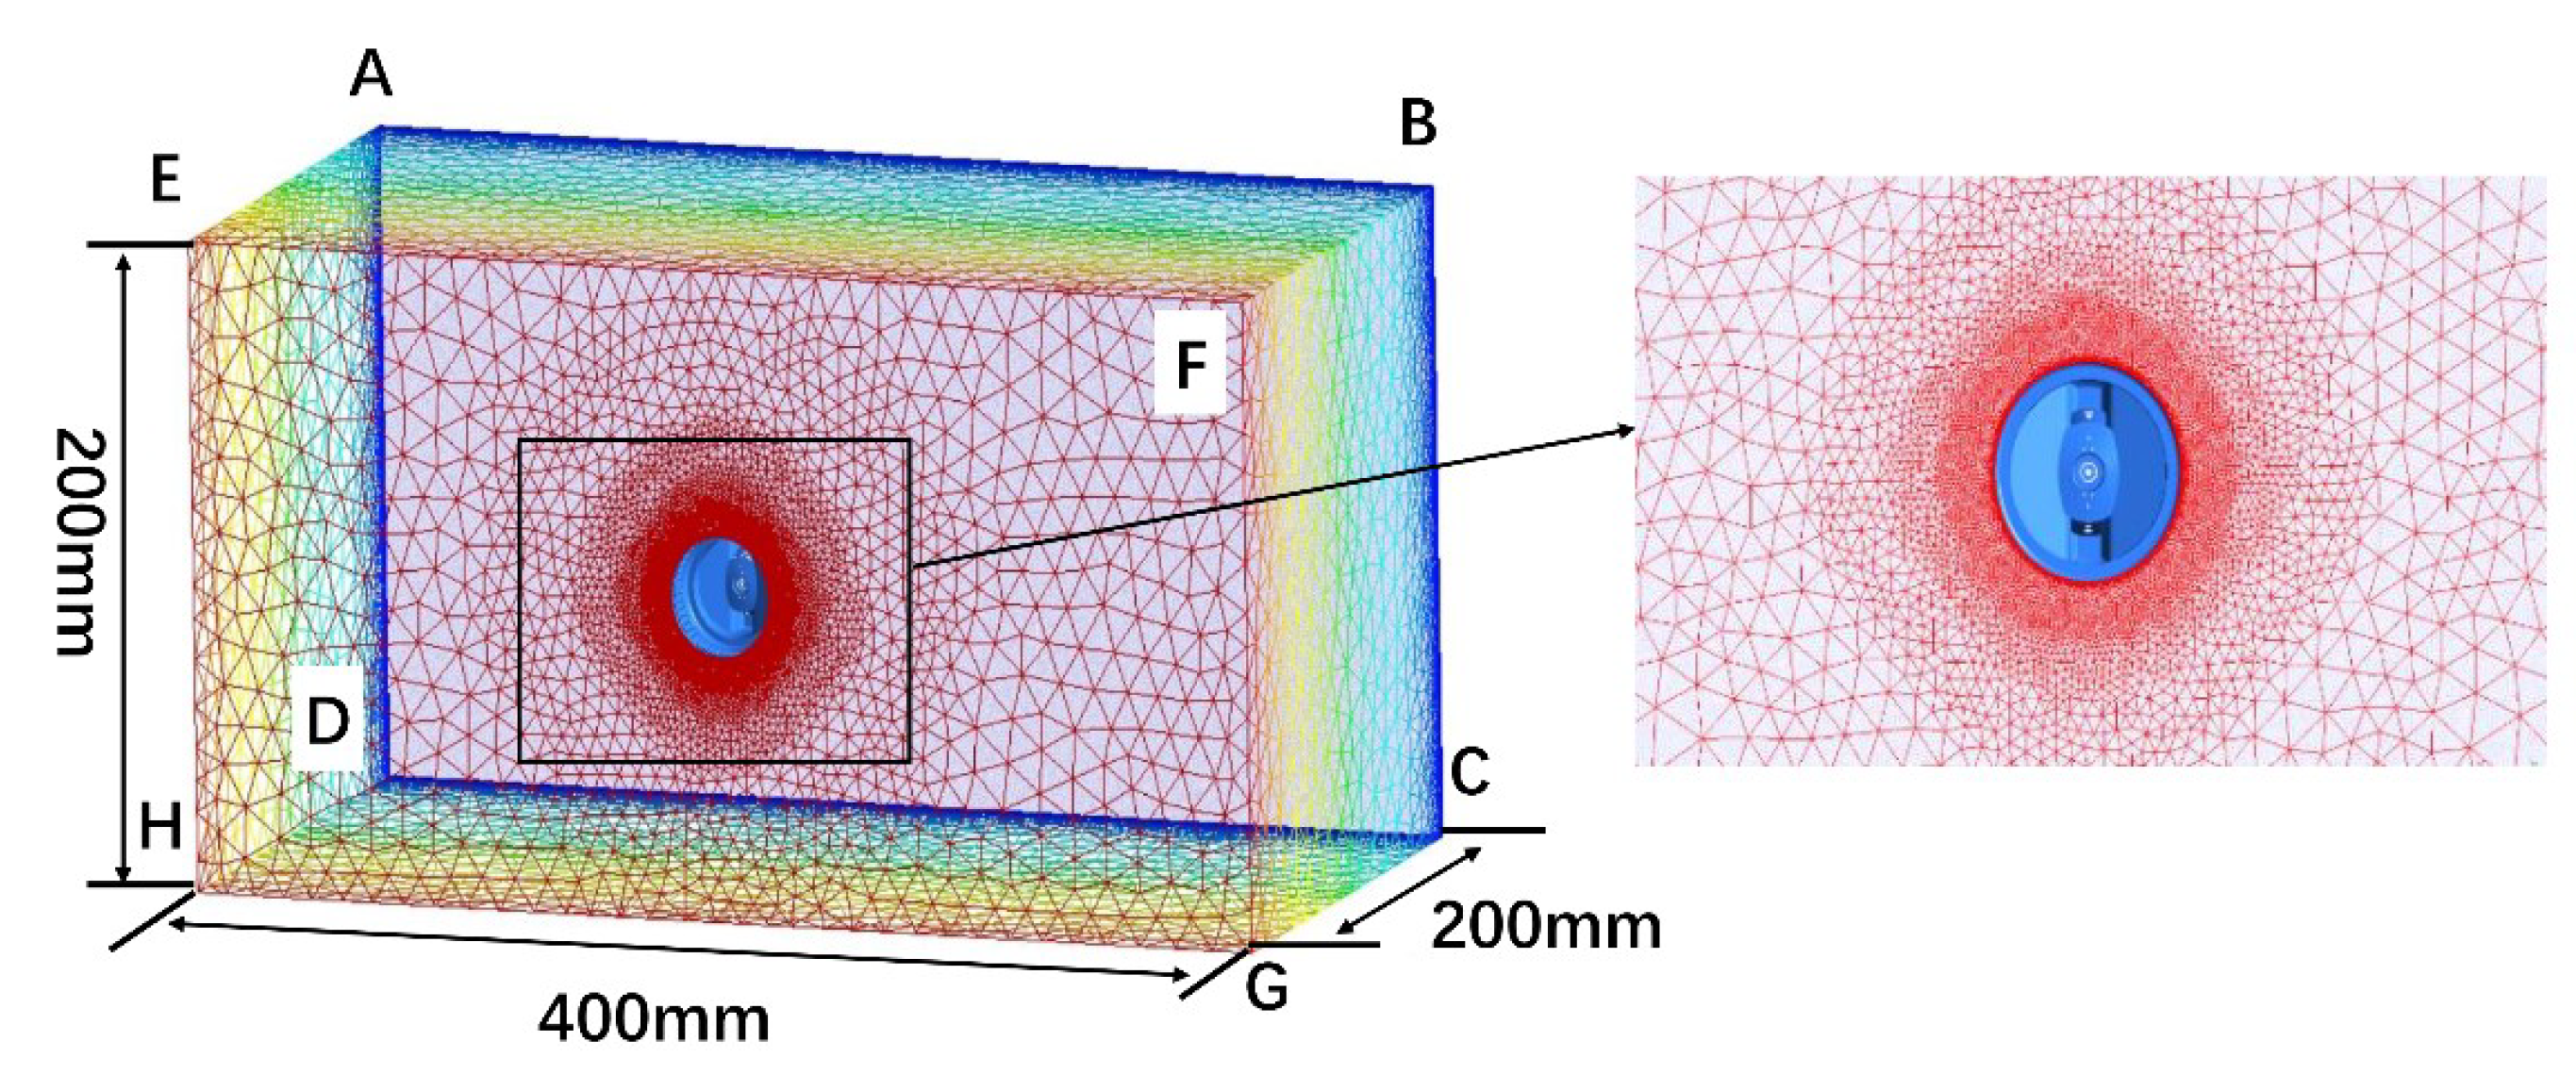
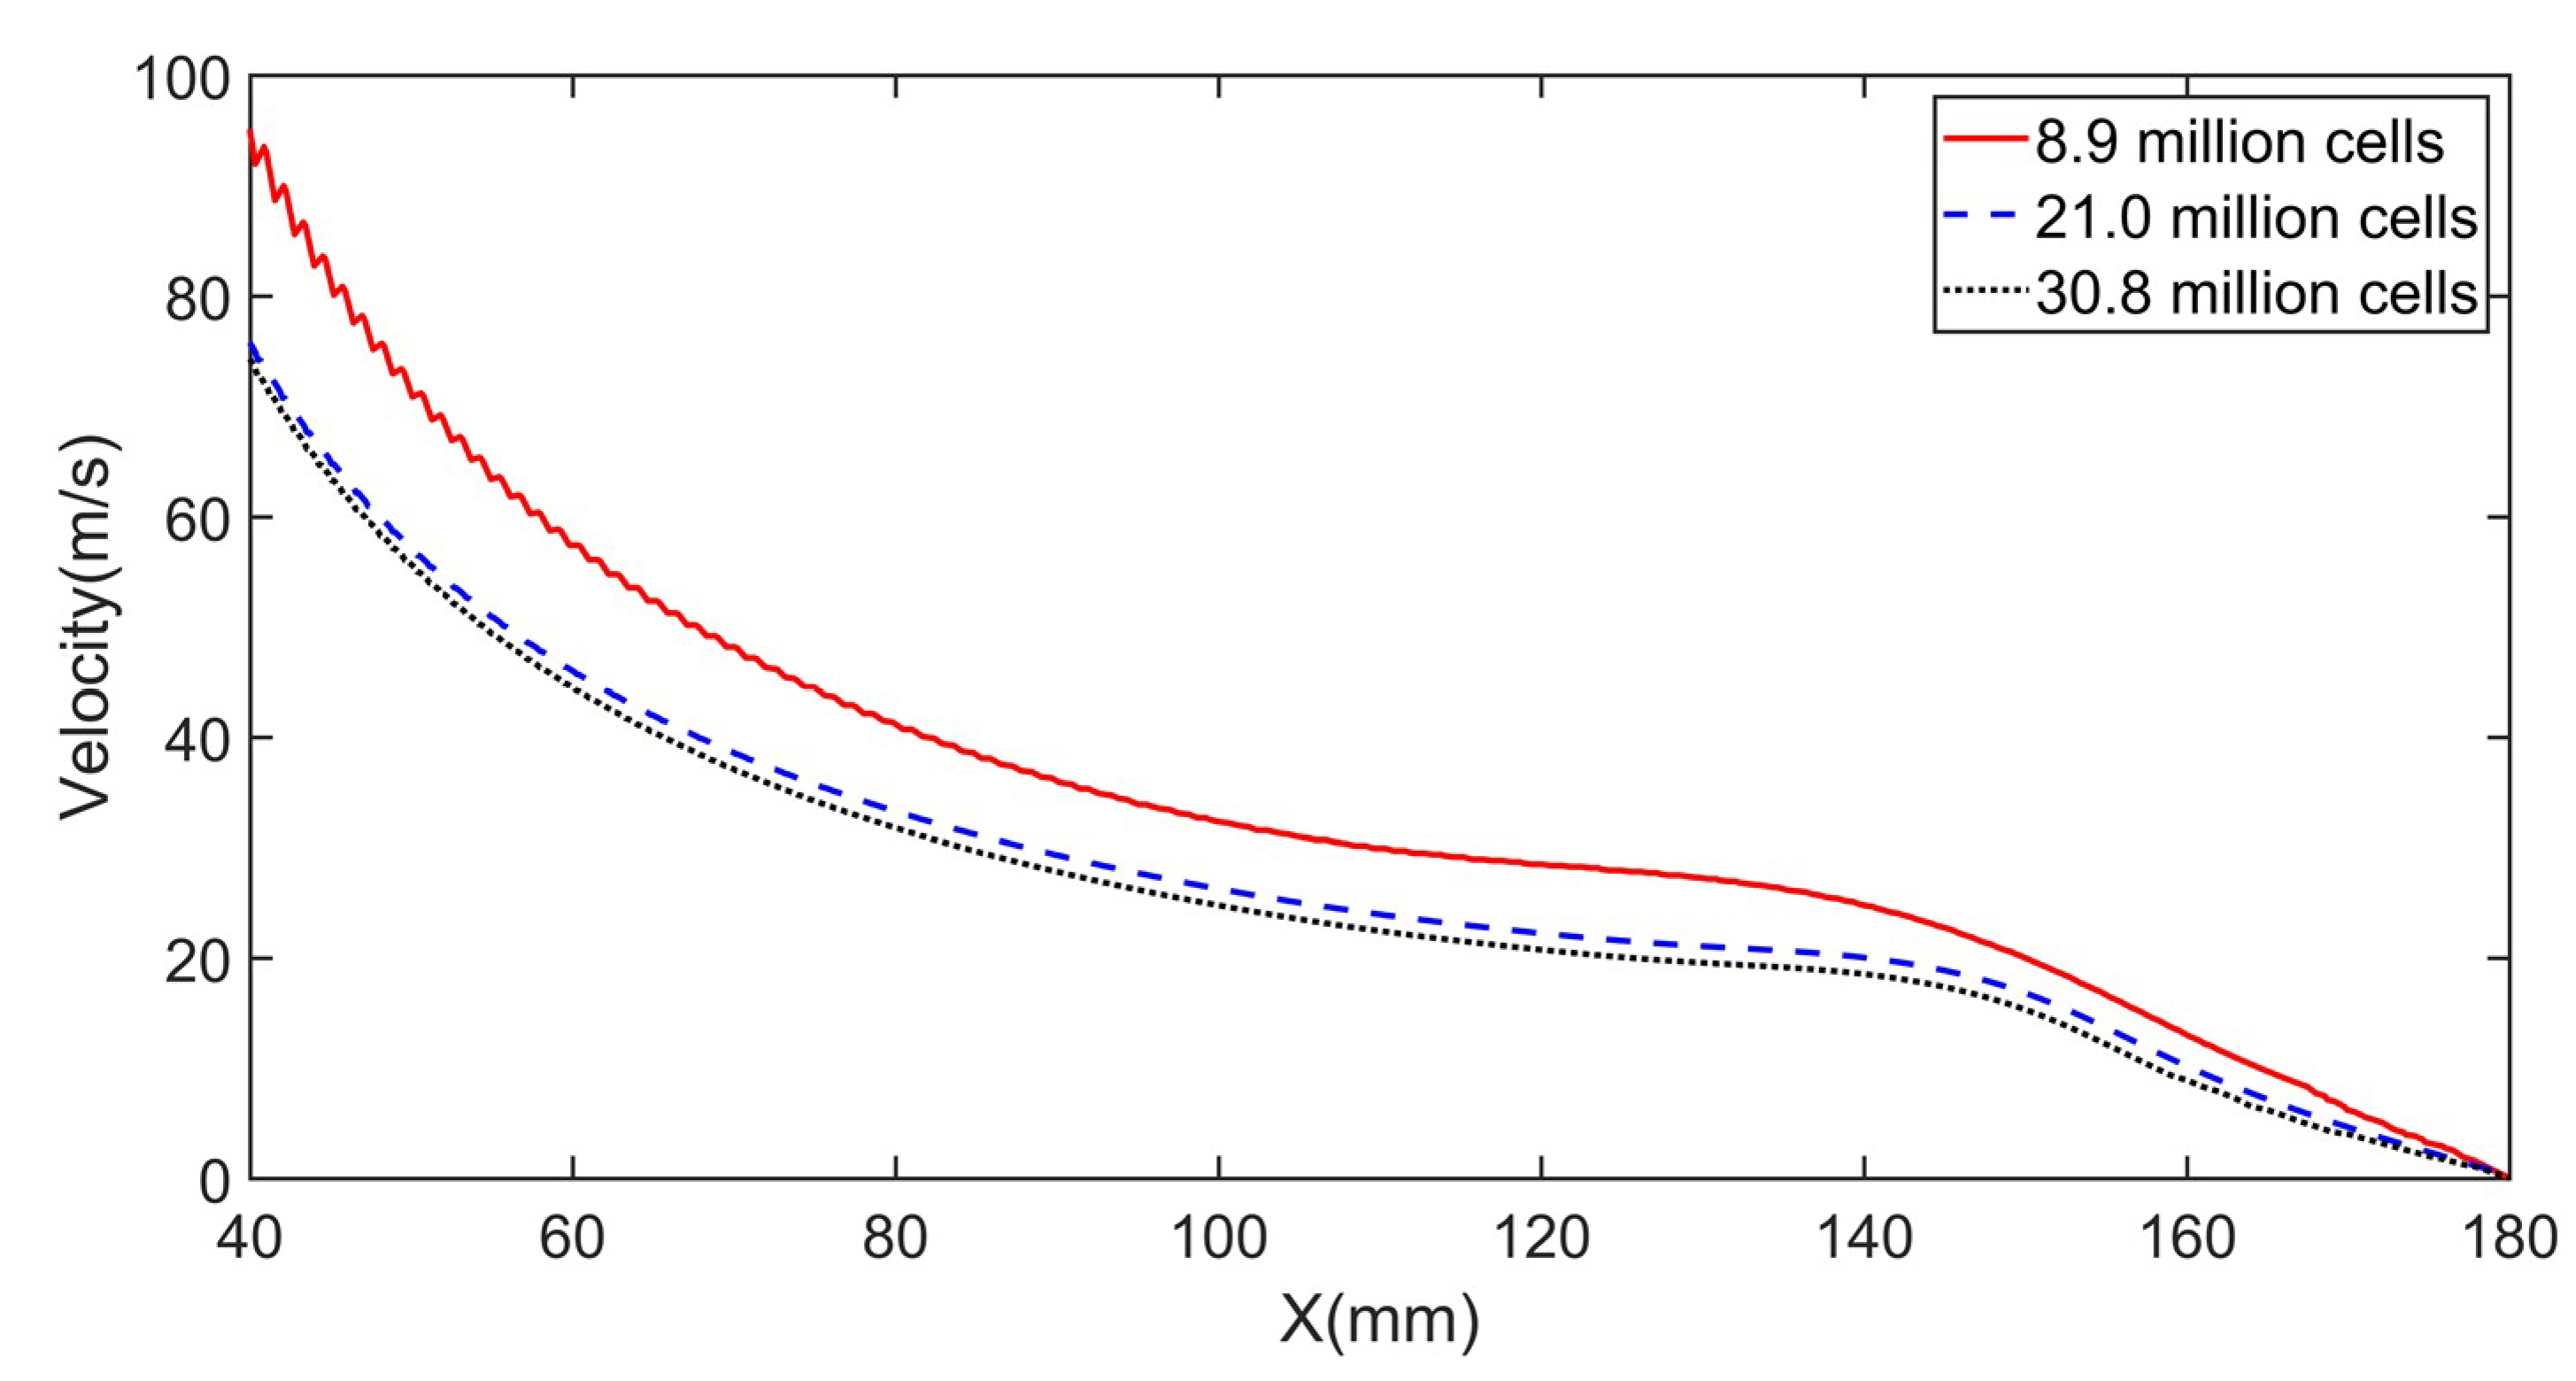
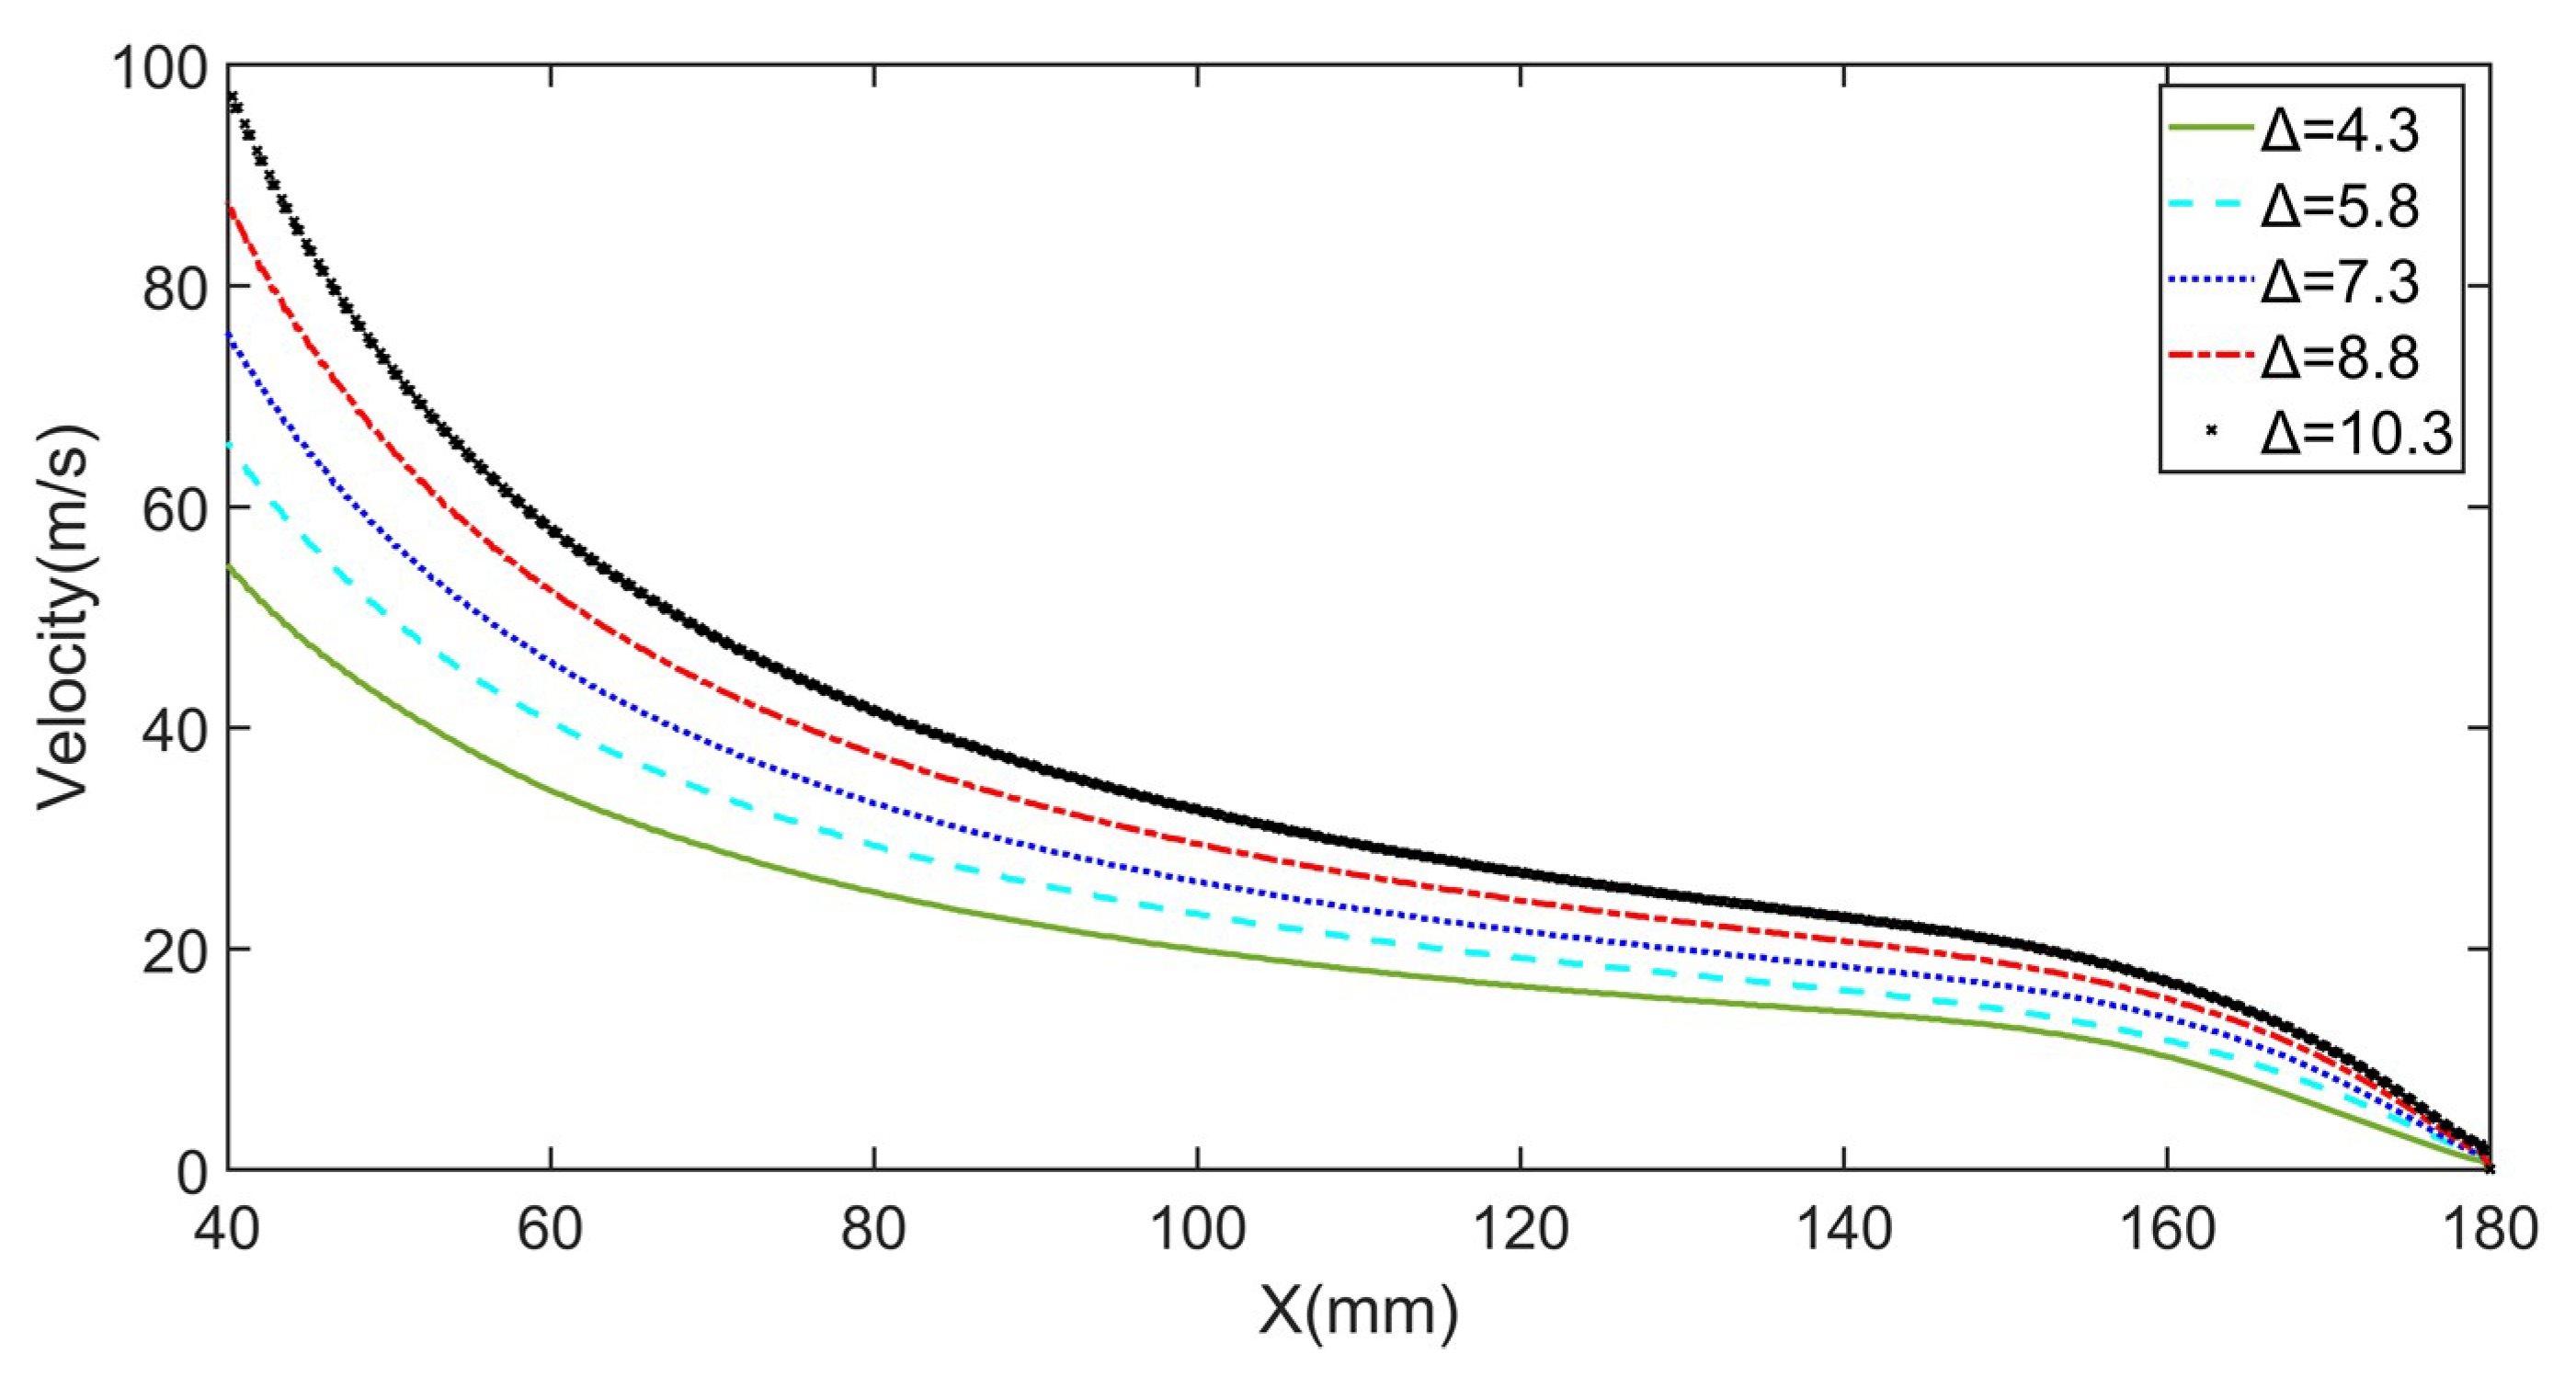
The mesh of the computational domain and the external flow field of the nozzle are shown in Figure 2 and Figure 3, respectively. Considering the characteristics of droplet spraying and the elliptical shape of spraying, the external flow field model in this paper was a cuboid region of 400 mm × 200 mm × 200 mm, and the actual distance from nozzle to target surface was 180 mm. As shown in Figure 2, the grid of the cylindrical area centered on the nozzle was refined to improve the calculation accuracy. Figure 4 shows the results of the gas velocity along the x-axis, which were obtained with different computational cells in the whole domain. It can be seen that, when the numbers of computational cells were 8.9 and 21.0 million, the gas velocity varied greatly. There were some small numerical fluctuations when the case was simulated in a domain that had fewer cells, because the meshes were not fine enough. When the number of cells was increased from 21.0 to 30.8 million, the change in gas velocity was small, and the gas velocity curve was smooth, which means that the results converged in both cases. In order to accurately simulate and take into account the consumption of computational resources, the number of 21.0 million computational cells was chosen in these cases.
The inlet pressures of annular and assisting air holes were 0.12 MPa, and they were 0.05 MPa for shaping air holes. The Wall–Film model was set as the wall boundary condition at the nozzle and target surface (plane ABCD), and the pressure outlet condition was set at the other boundaries (planes ABFE, BCGF, CGHD, ADHE, and EFGH). After convergence in the gas flow field, particles with 65-μm diameter at the position of the paint hole were injected into the airflow field with an initial velocity of 50 m/s along the airflow direction. The initial number of particles was 120 and the material was water. Each case was simulated until the stage at which the spraying pattern of the particles sticking on the target surface was basically formed, and it had roughly the same number of particles with other cases.
3. Results and Discussion
3.1. Experimental Verification
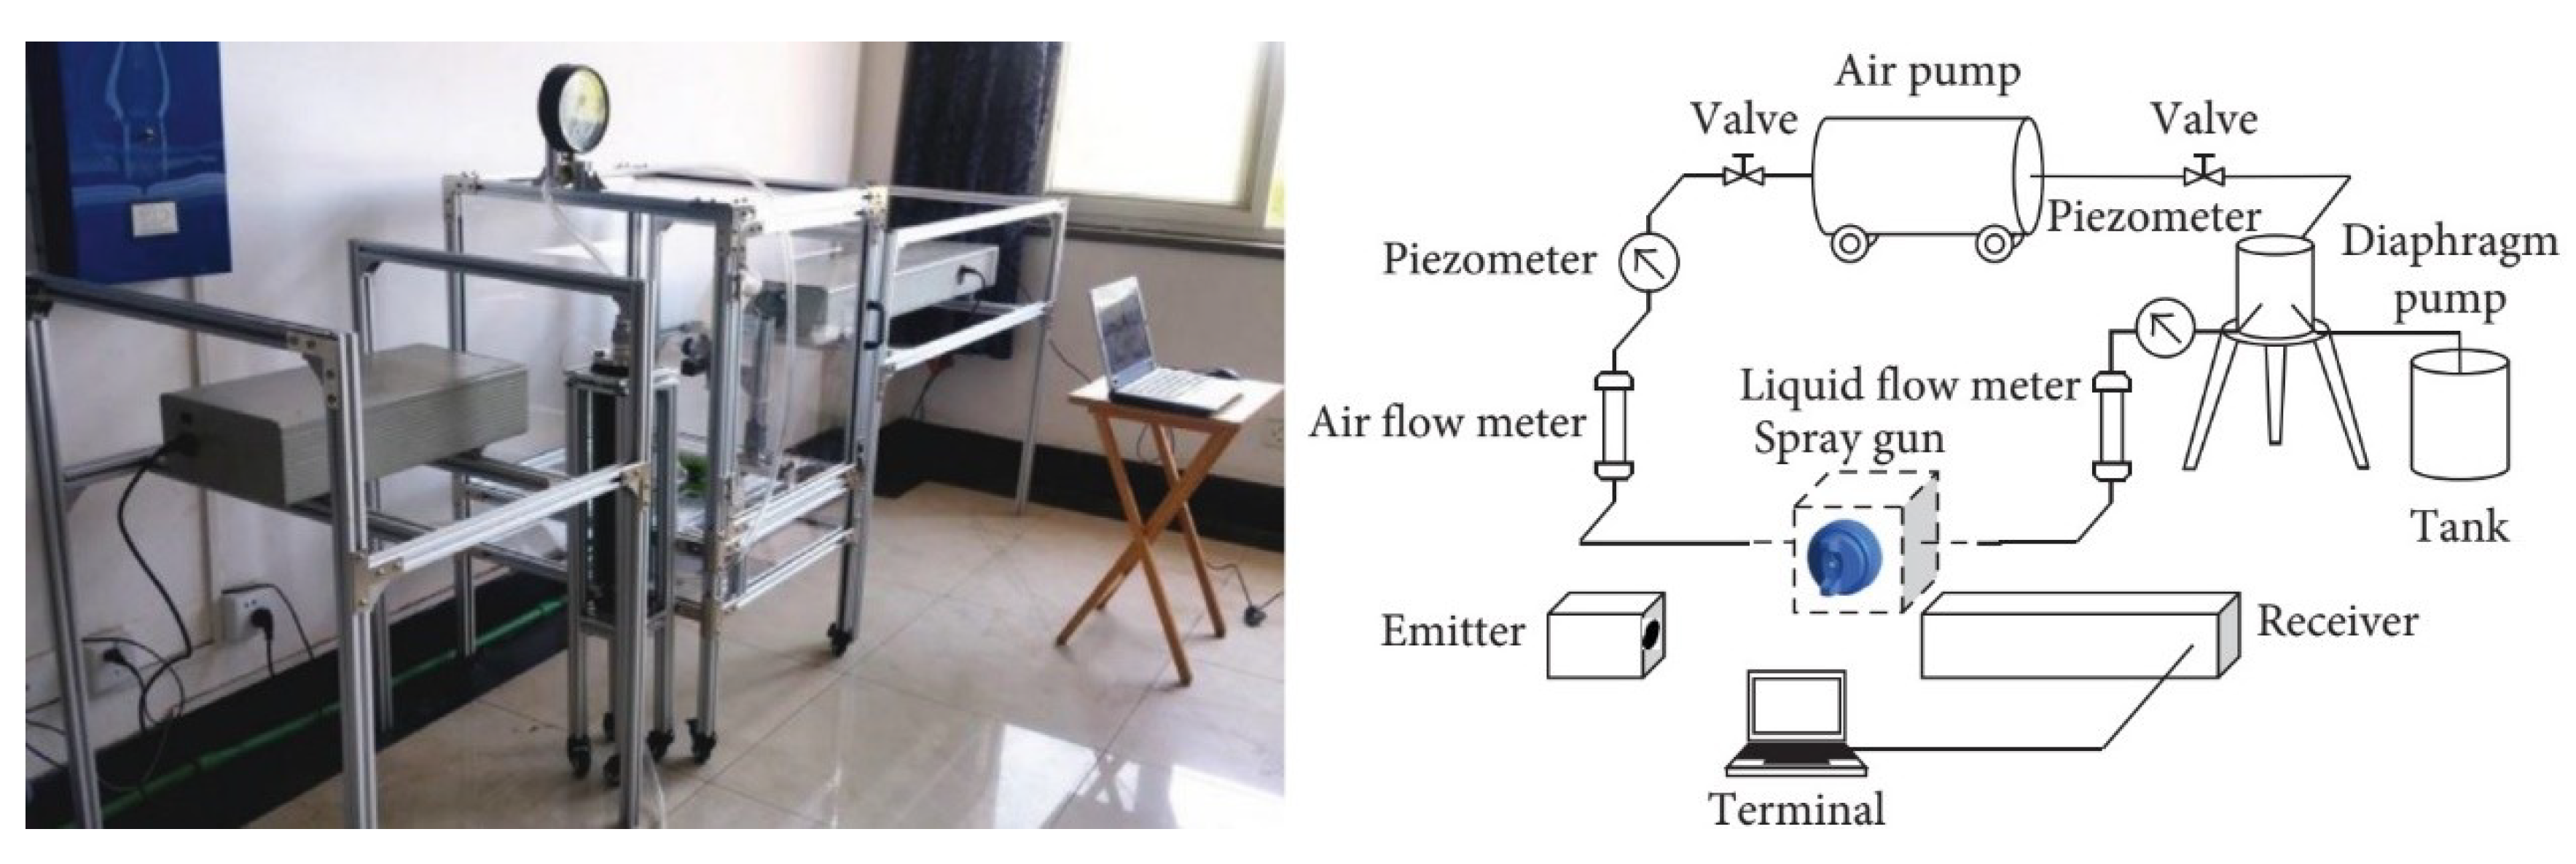
As shown in Figure 5, a laser particle analyzer measurement system (LS-2000, Shanghai University, Shanghai, China) was used to measure the droplet size distribution, which was composed of a laser emitter and a receiver. Droplets scatter the light when the laser the measured droplets. After receiving the scattered light, the receiver processes the measured scattered light energy distribution via an inversion algorithm, and then obtains the size distribution of the measured droplets. The range of particle sizes that can be measured by the instrument is 0.5–1000 μm. In order to facilitate the measurement, the nozzle was sprayed in the flow field without the target surface. The properties of the materials and the experimental parameters are shown in Table 1 and Table 2, respectively.
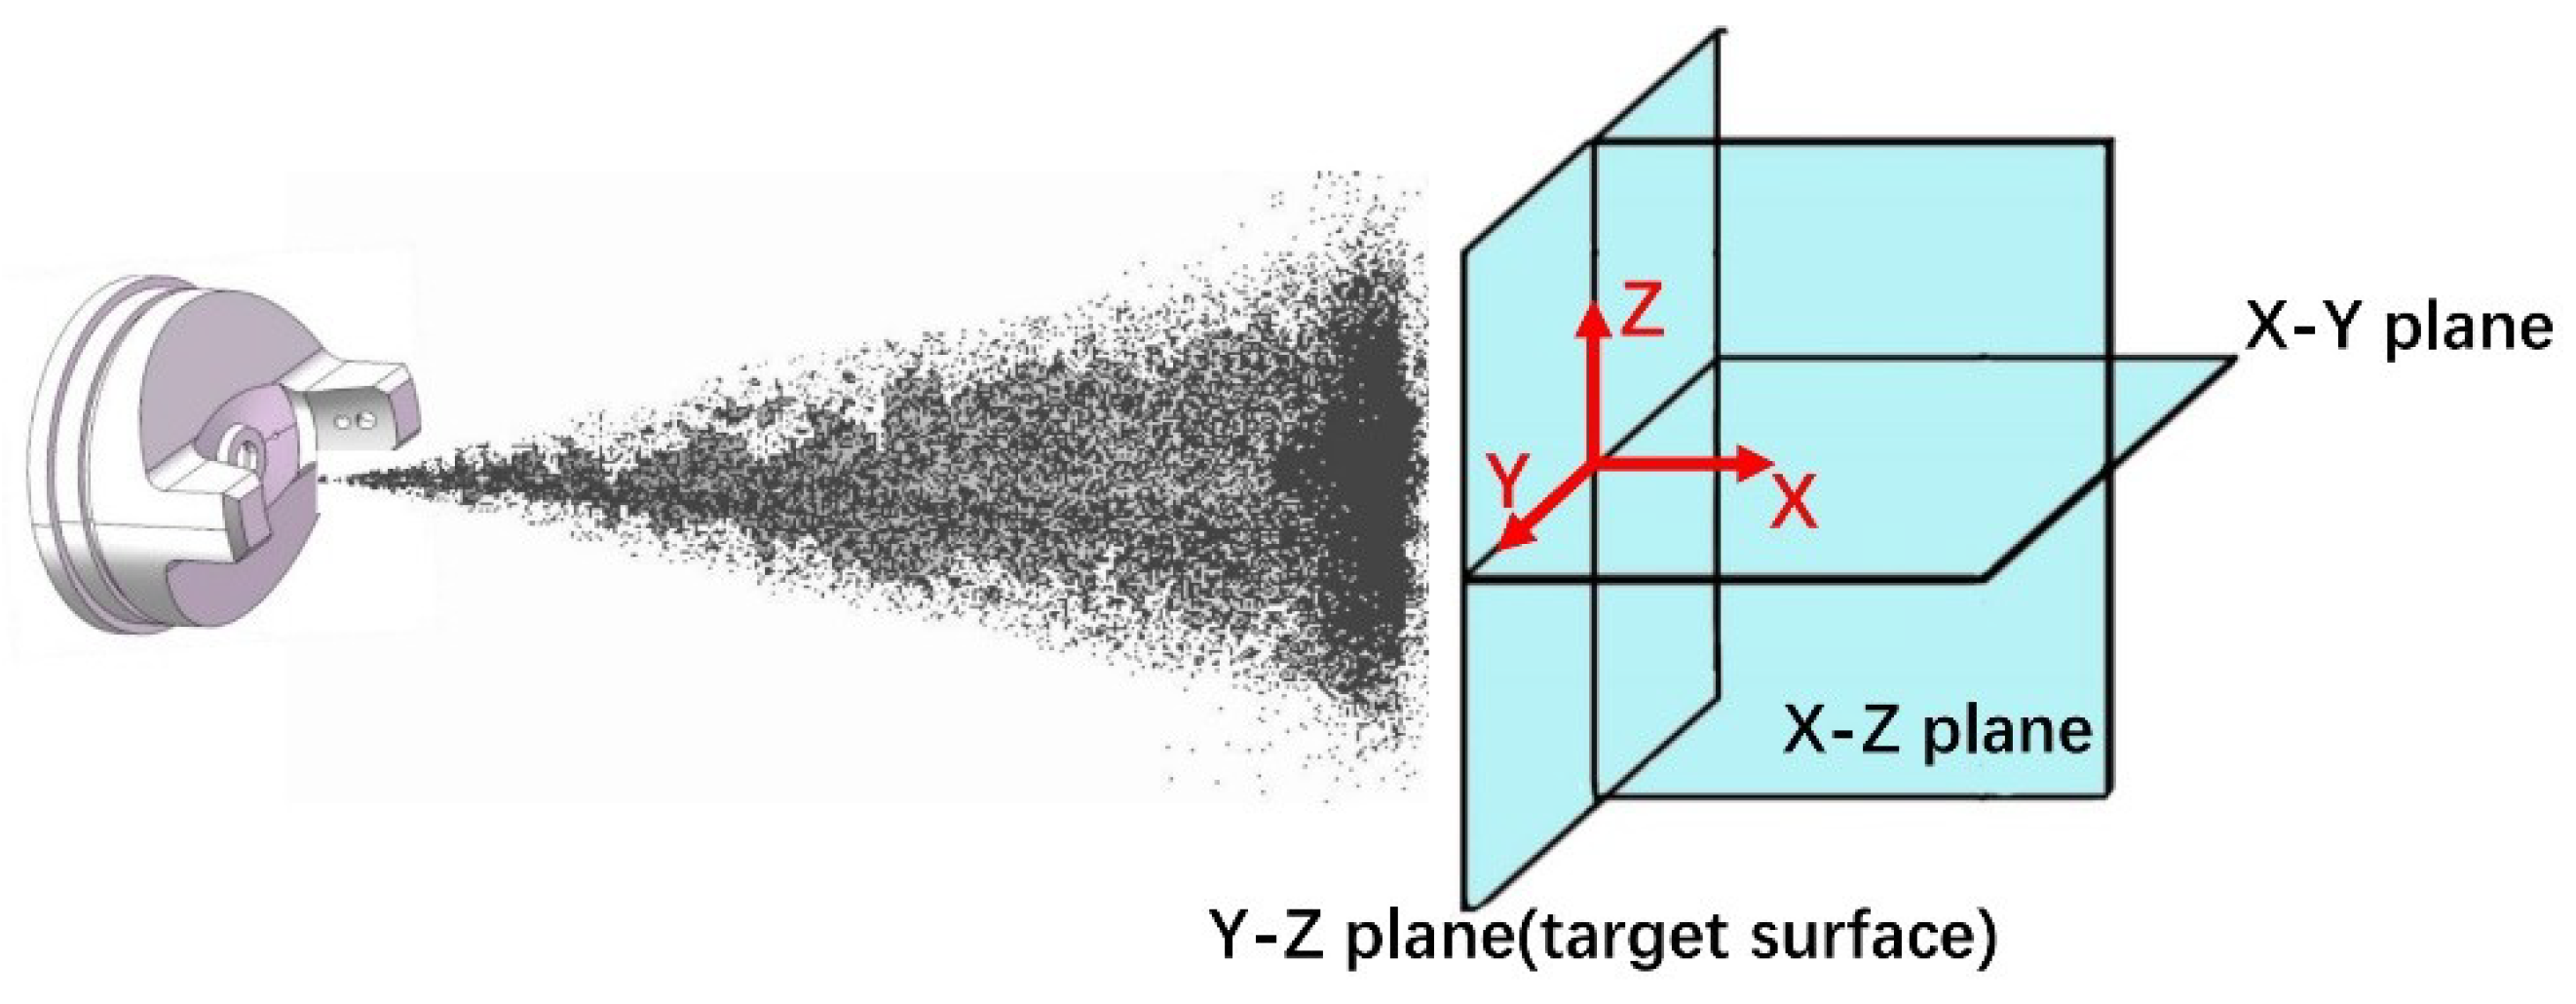
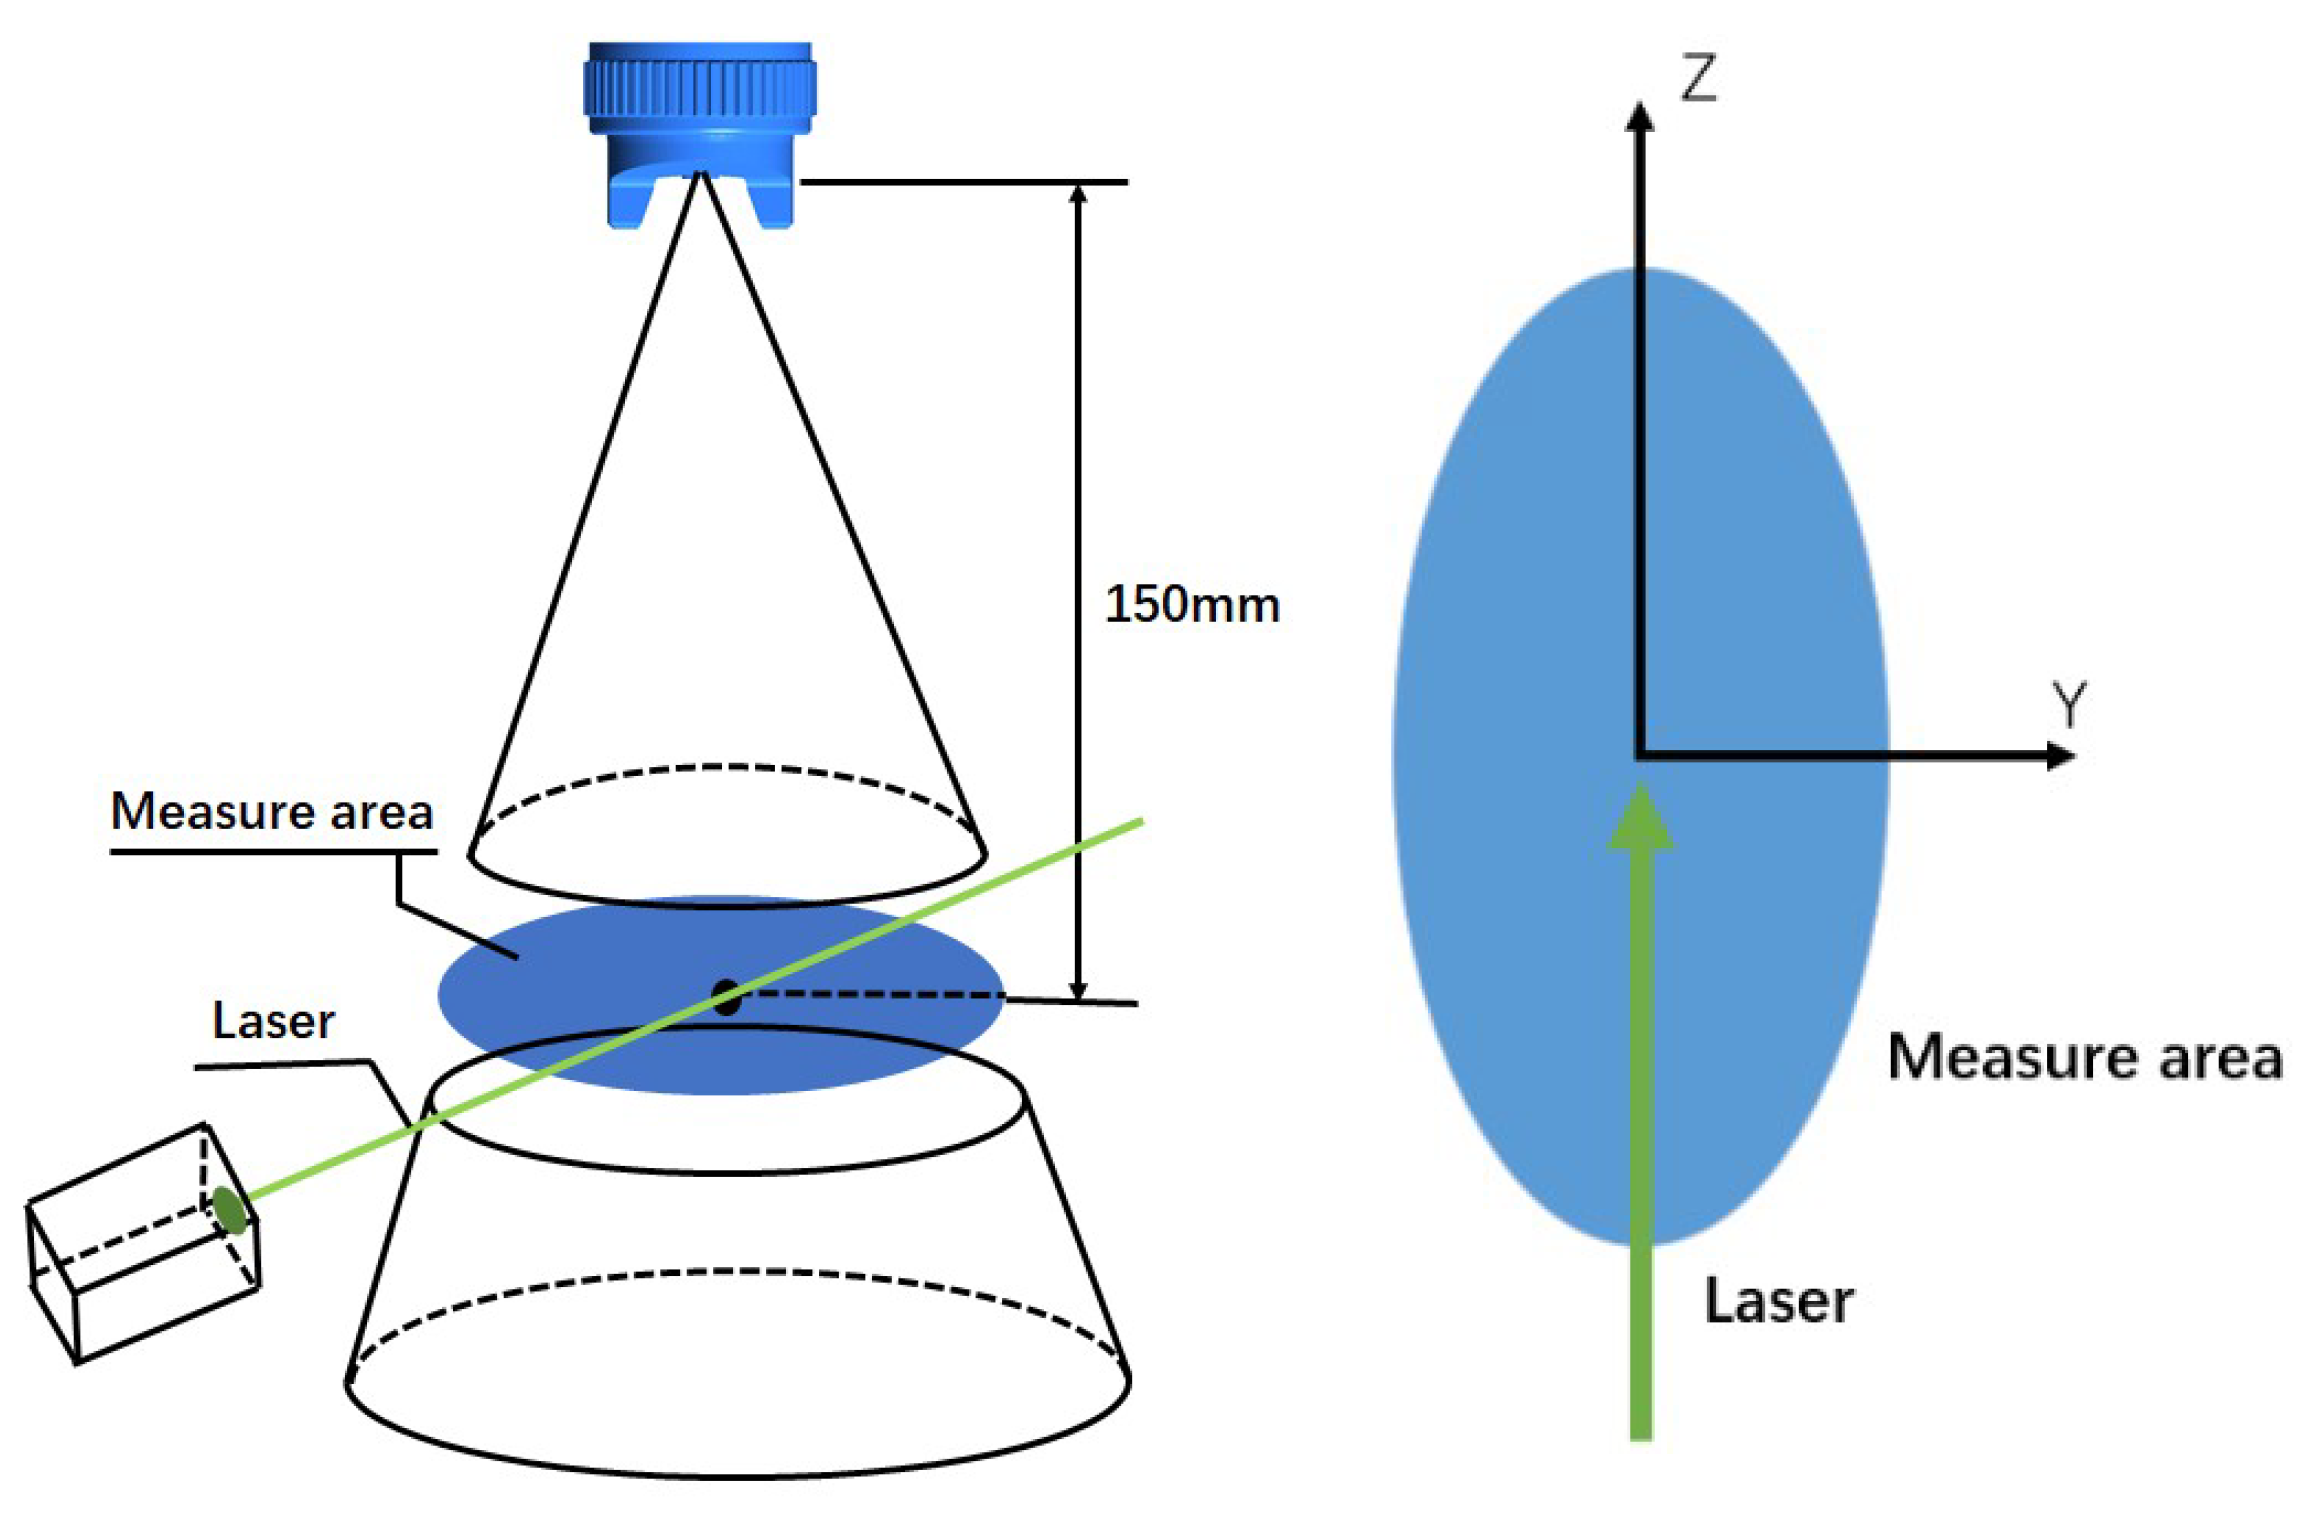
Figure 6 shows the measurement process of droplet size distribution. The laser emitter was adjusted so that the laser was parallel to the measurement plane and passed through the measurement point along the z-axis. When the spray stabilized, the size of particles passing through the laser was measured by the accompanying computer software over a period of time. The particle size distribution in the simulation was obtained under the same conditions.
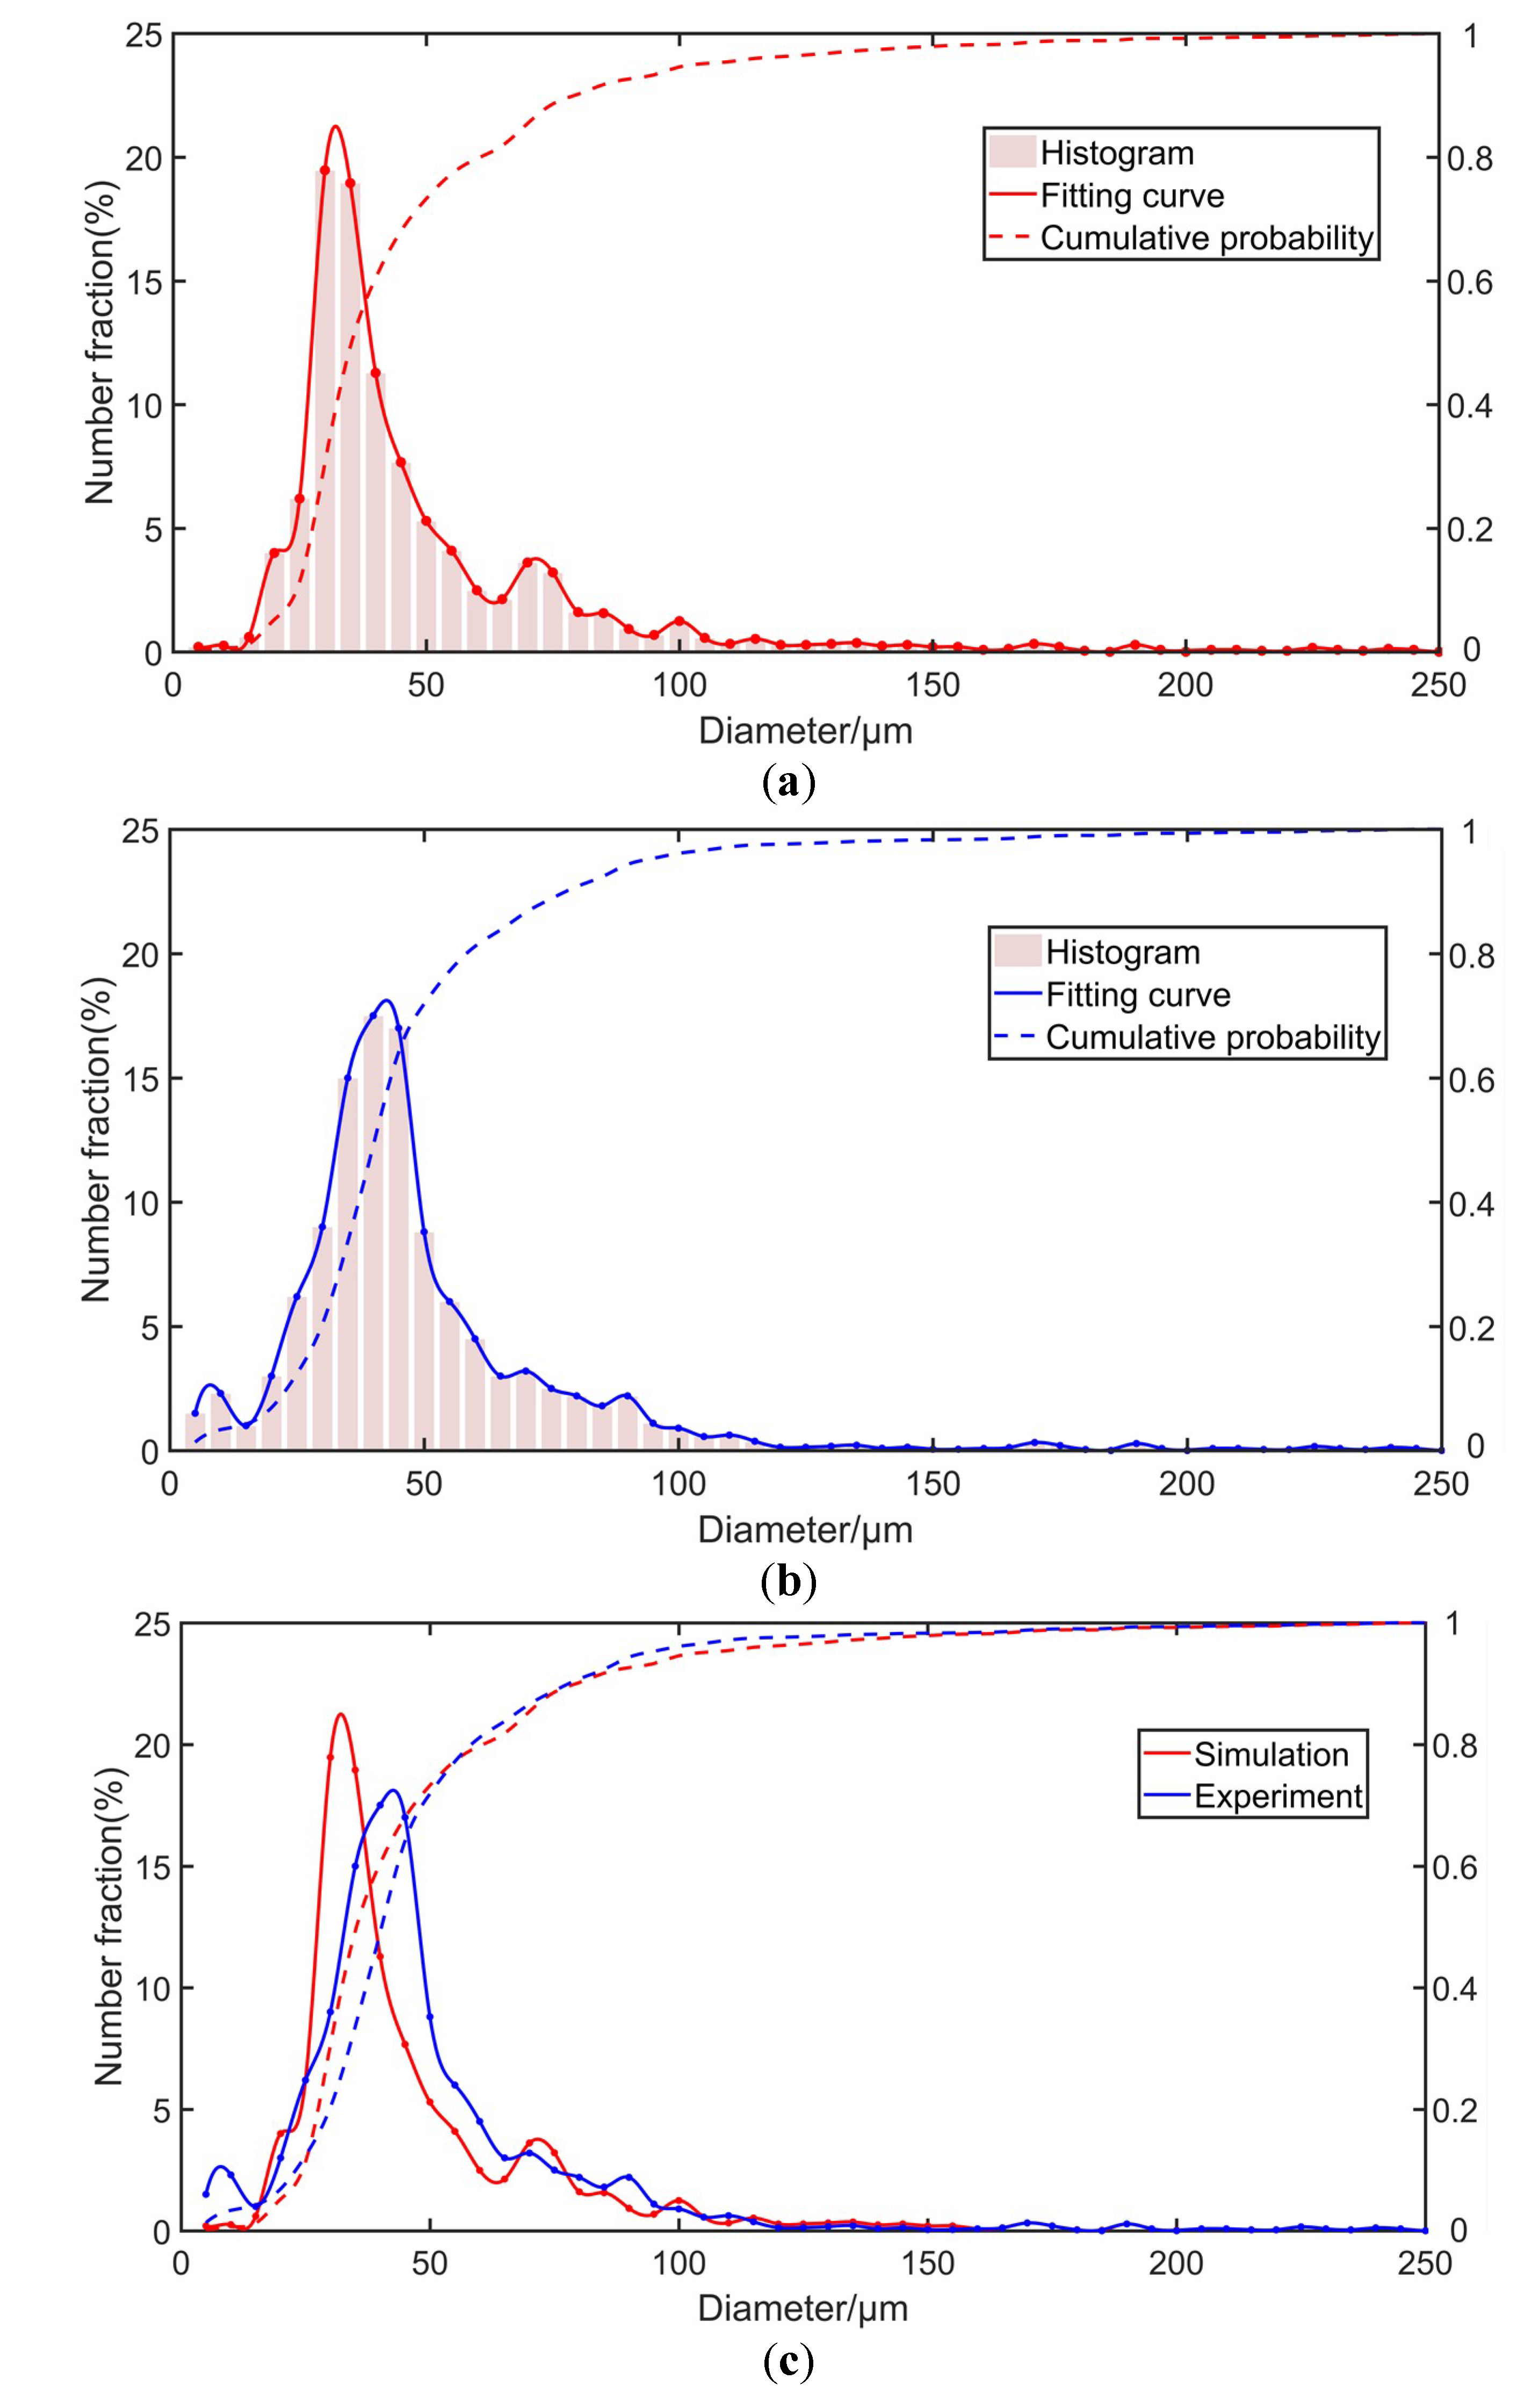
It is worth mentioning that the distance between the intersection and the paint hole was nondimensionalized with the diameter of the paint hole. This distance used in the experiment was 7.3 (Δ/D = 7.3, where D is the diameter of the paint hole). The simulation was investigated using the same nozzle structure as in the experiment. The droplet size distributions derived from the experiment and simulation are shown in Figure 7. It can be seen that, due to the droplet breakup, collision, and coalescent effects, the two sets of droplet sizes were distributed in the range of 0 to 250 μm, mainly concentrated in the range between 15 and 100 μm. The total percentages of particles larger than 100 μm in diameter were 4.98% (simulation) and 5.27% (experiment), respectively. For the experiment, there was a certain proportion of particles in the range below 15 μm; however, for the simulation, the proportion of this part was almost 0. The reason for this is that there was a group of tiny, near-nanometer-scale sub-droplets in the flow field during the experiment, which could not be calculated in the simulation. Comparing the experiment and simulation data, the two distributions were broadly consistent.
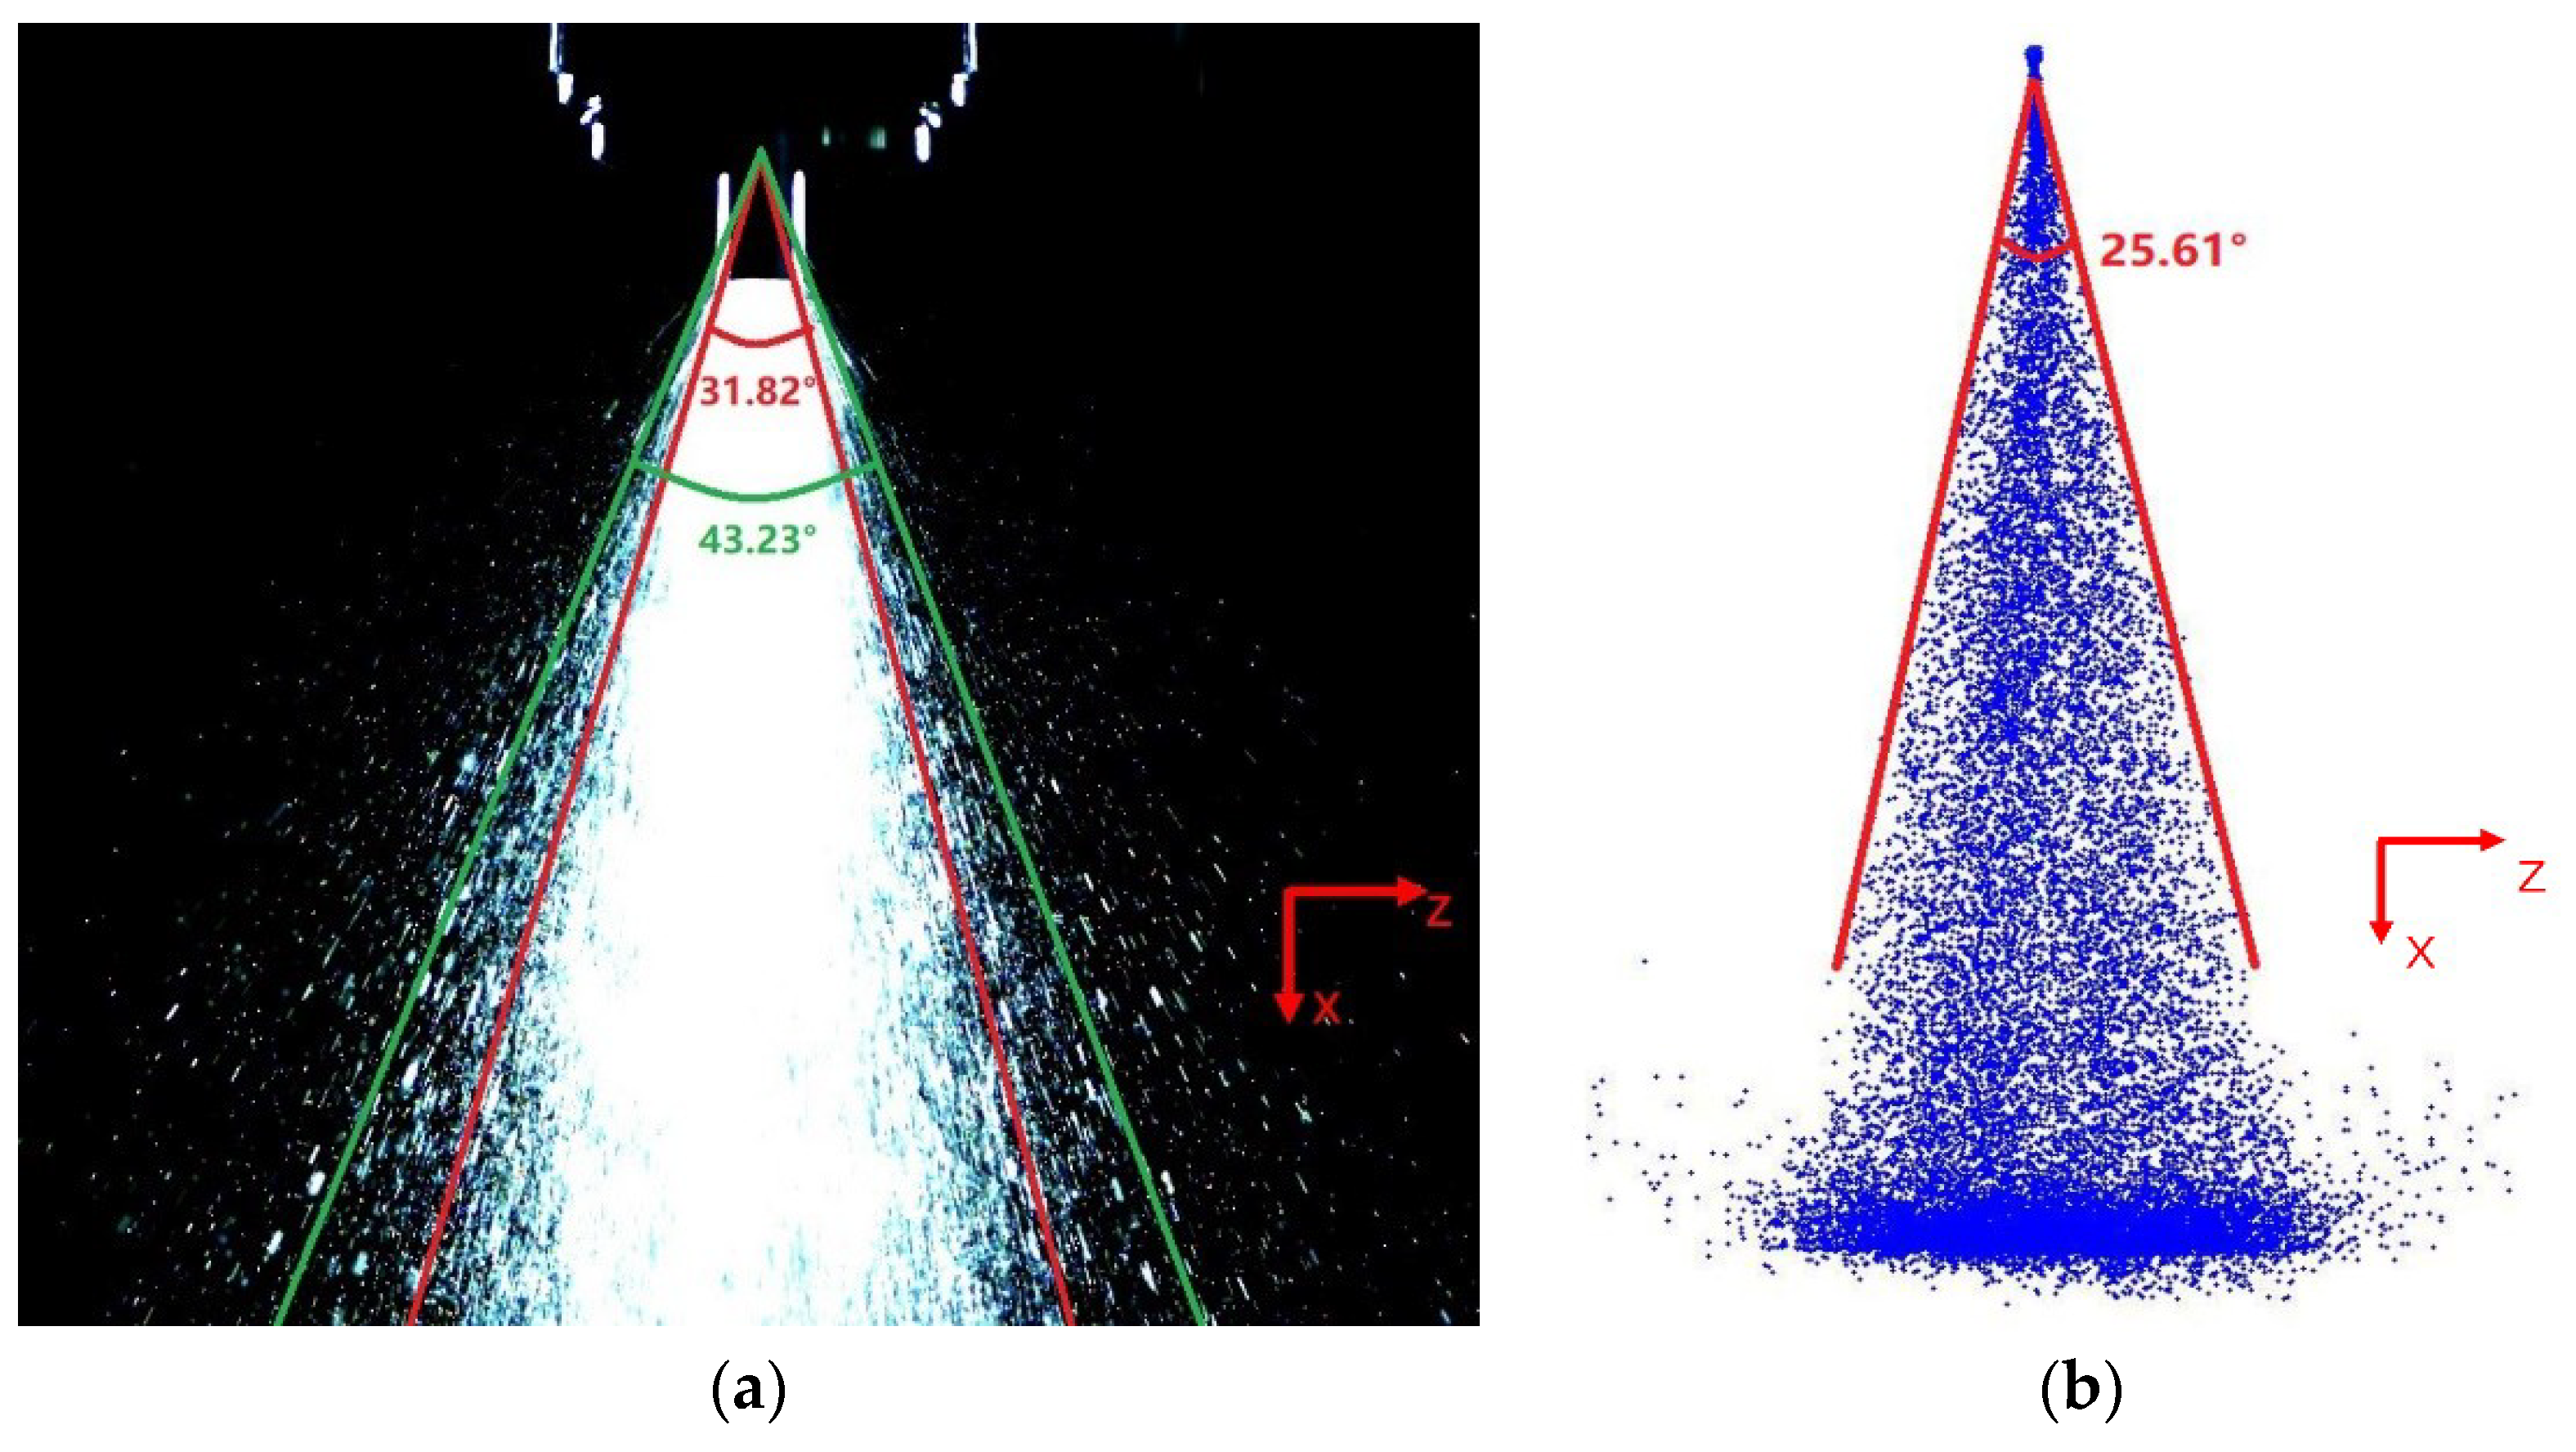
Then, high-speed camera technology was used to obtain the appearance of the spray. The photograph is shown in Figure 8a using a FASTCAM Mini AX created by PHOTRON LIMITED (Tokyo, Japan). The outer boundary, which is obvious, was drawn by red lines tangential to the spray contour just downstream of the exit orifice. The angle between them was the spray cone angle [13,14]. We can find that most droplets were in the area surrounded by the red lines. However, on the outside of this region (between the green and red lines), there were still a few particles. The reason for this may be due to the multi-porous structure of the nozzle. The liquid first passed through the downstream of the annular hole under the shear force of the high-speed gas, breaking up into liquid blocks and ligaments. Then, finer uniform droplets were formed through the effects of assisting holes and shaping holes. In this process, some liquid particles were thrown out of the original cone angle area by the turbulence caused by the high-speed airflow. Figure 8b shows the spray cone angle in simulation cases. We can learn that there was a divergence which could not be ignored around the cone angle, between the experimental data (31.82°) and the calculated result (25.61°). The reasons for this may be due to a certain accuracy error in the machining of the nozzle. The aperture of the air hole was very small, so a tiny deviation had an impact on the spraying characteristics.
3.2. Simulation Results of the Gas Phase
Firstly, five cases were selected (Table 3), and the only difference among them was Δ.
3.2.1. Gas Flow Field
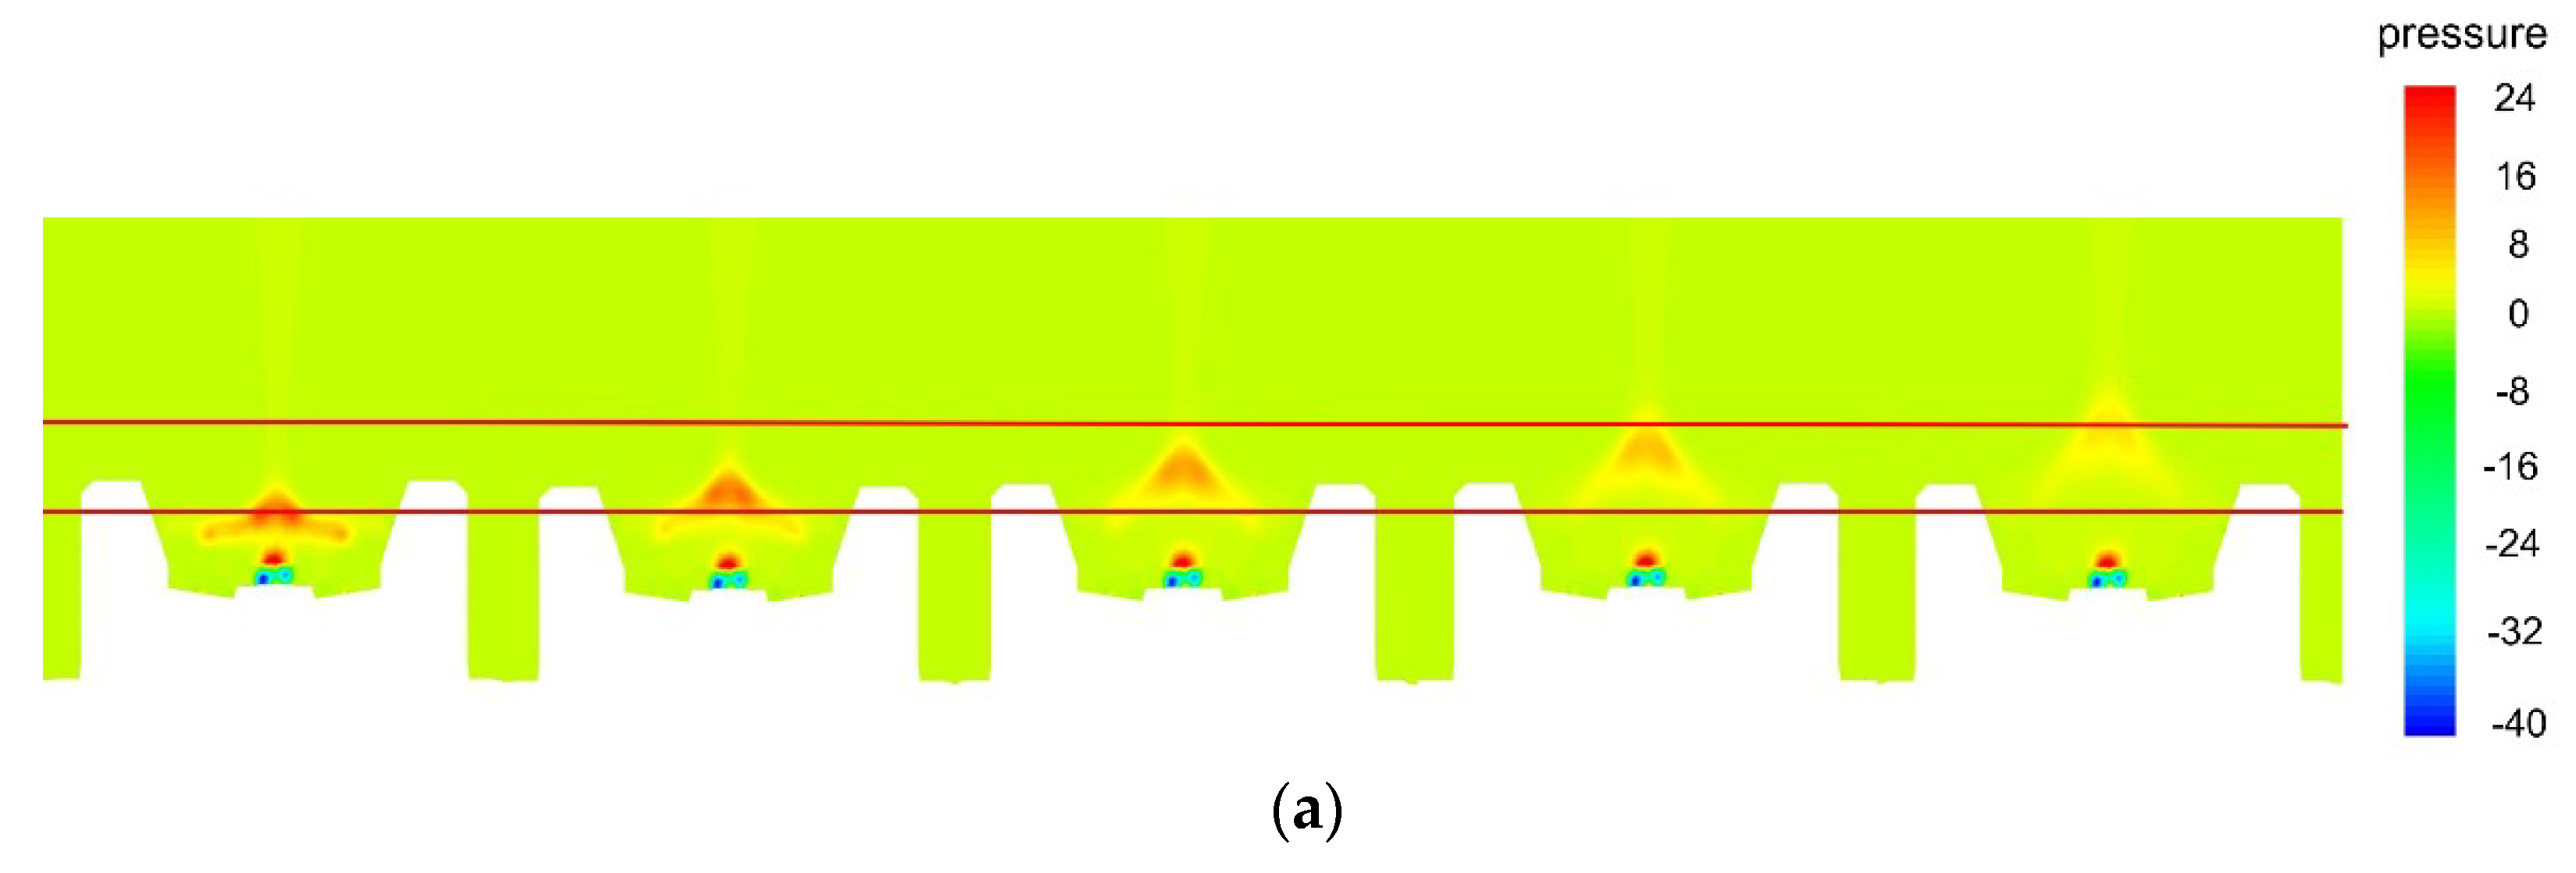
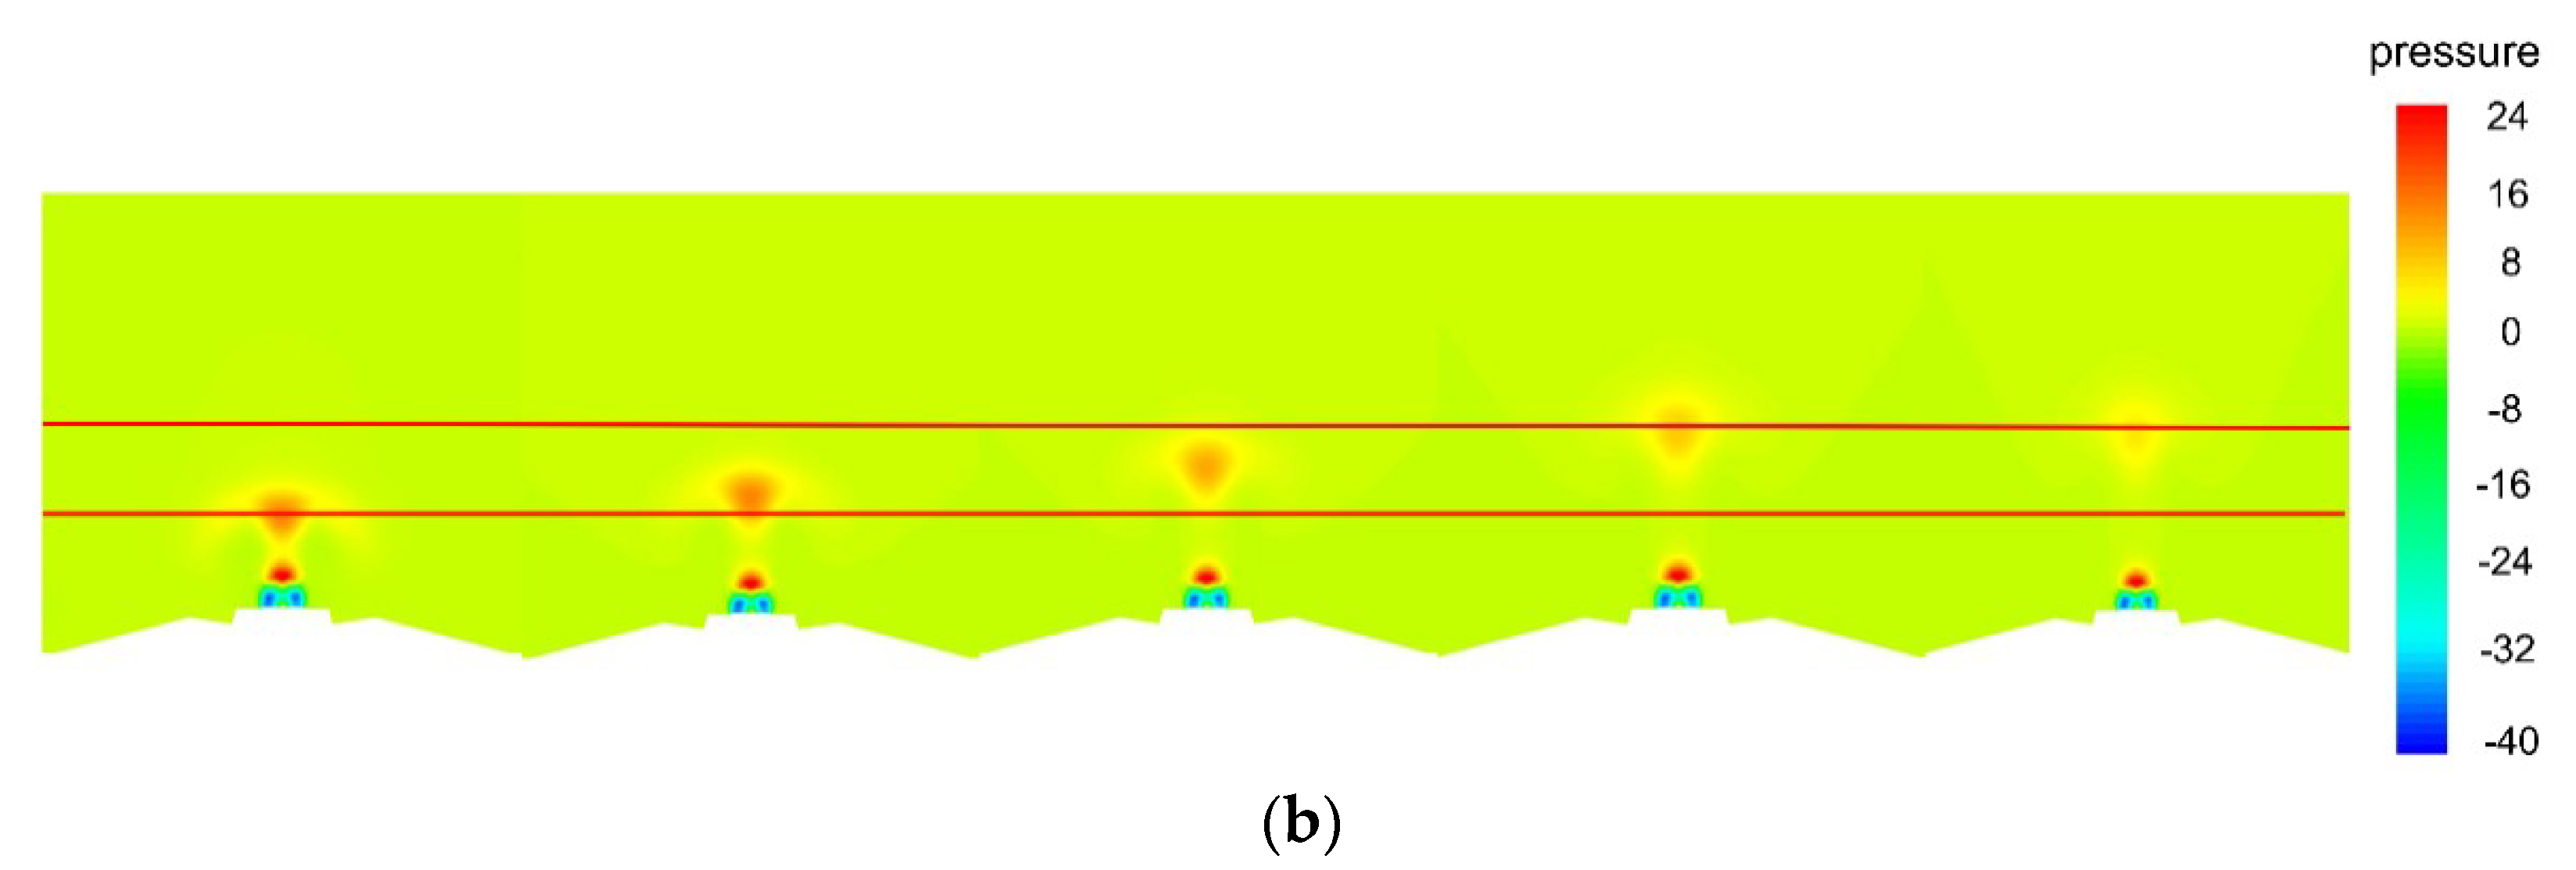
As shown in Figure 9, it can be seen that when the flow field tended to stabilize, a large negative pressure appeared around the paint hole, which caused a huge velocity difference between the gas and the spraying liquid. This velocity difference was conducive to primary atomization. With increasing Δ, the high-pressure area near the intersection moved away from the paint hole, and the maximum pressure decreased gradually.
In Figure 10, the gas velocity near the nozzle was rapidly reduced when the gas phase simulation converged. When the distance exceeded 100 mm, the velocity attenuation slowed down, and the velocity gradually became zero around the target surface. At the same x position, the higher the Δ was, the faster the velocity was. The closer the nozzle was, the more obvious this trend was. When x > 100 mm, the velocity was still different, but the difference gradually decreased and tended to be stable.
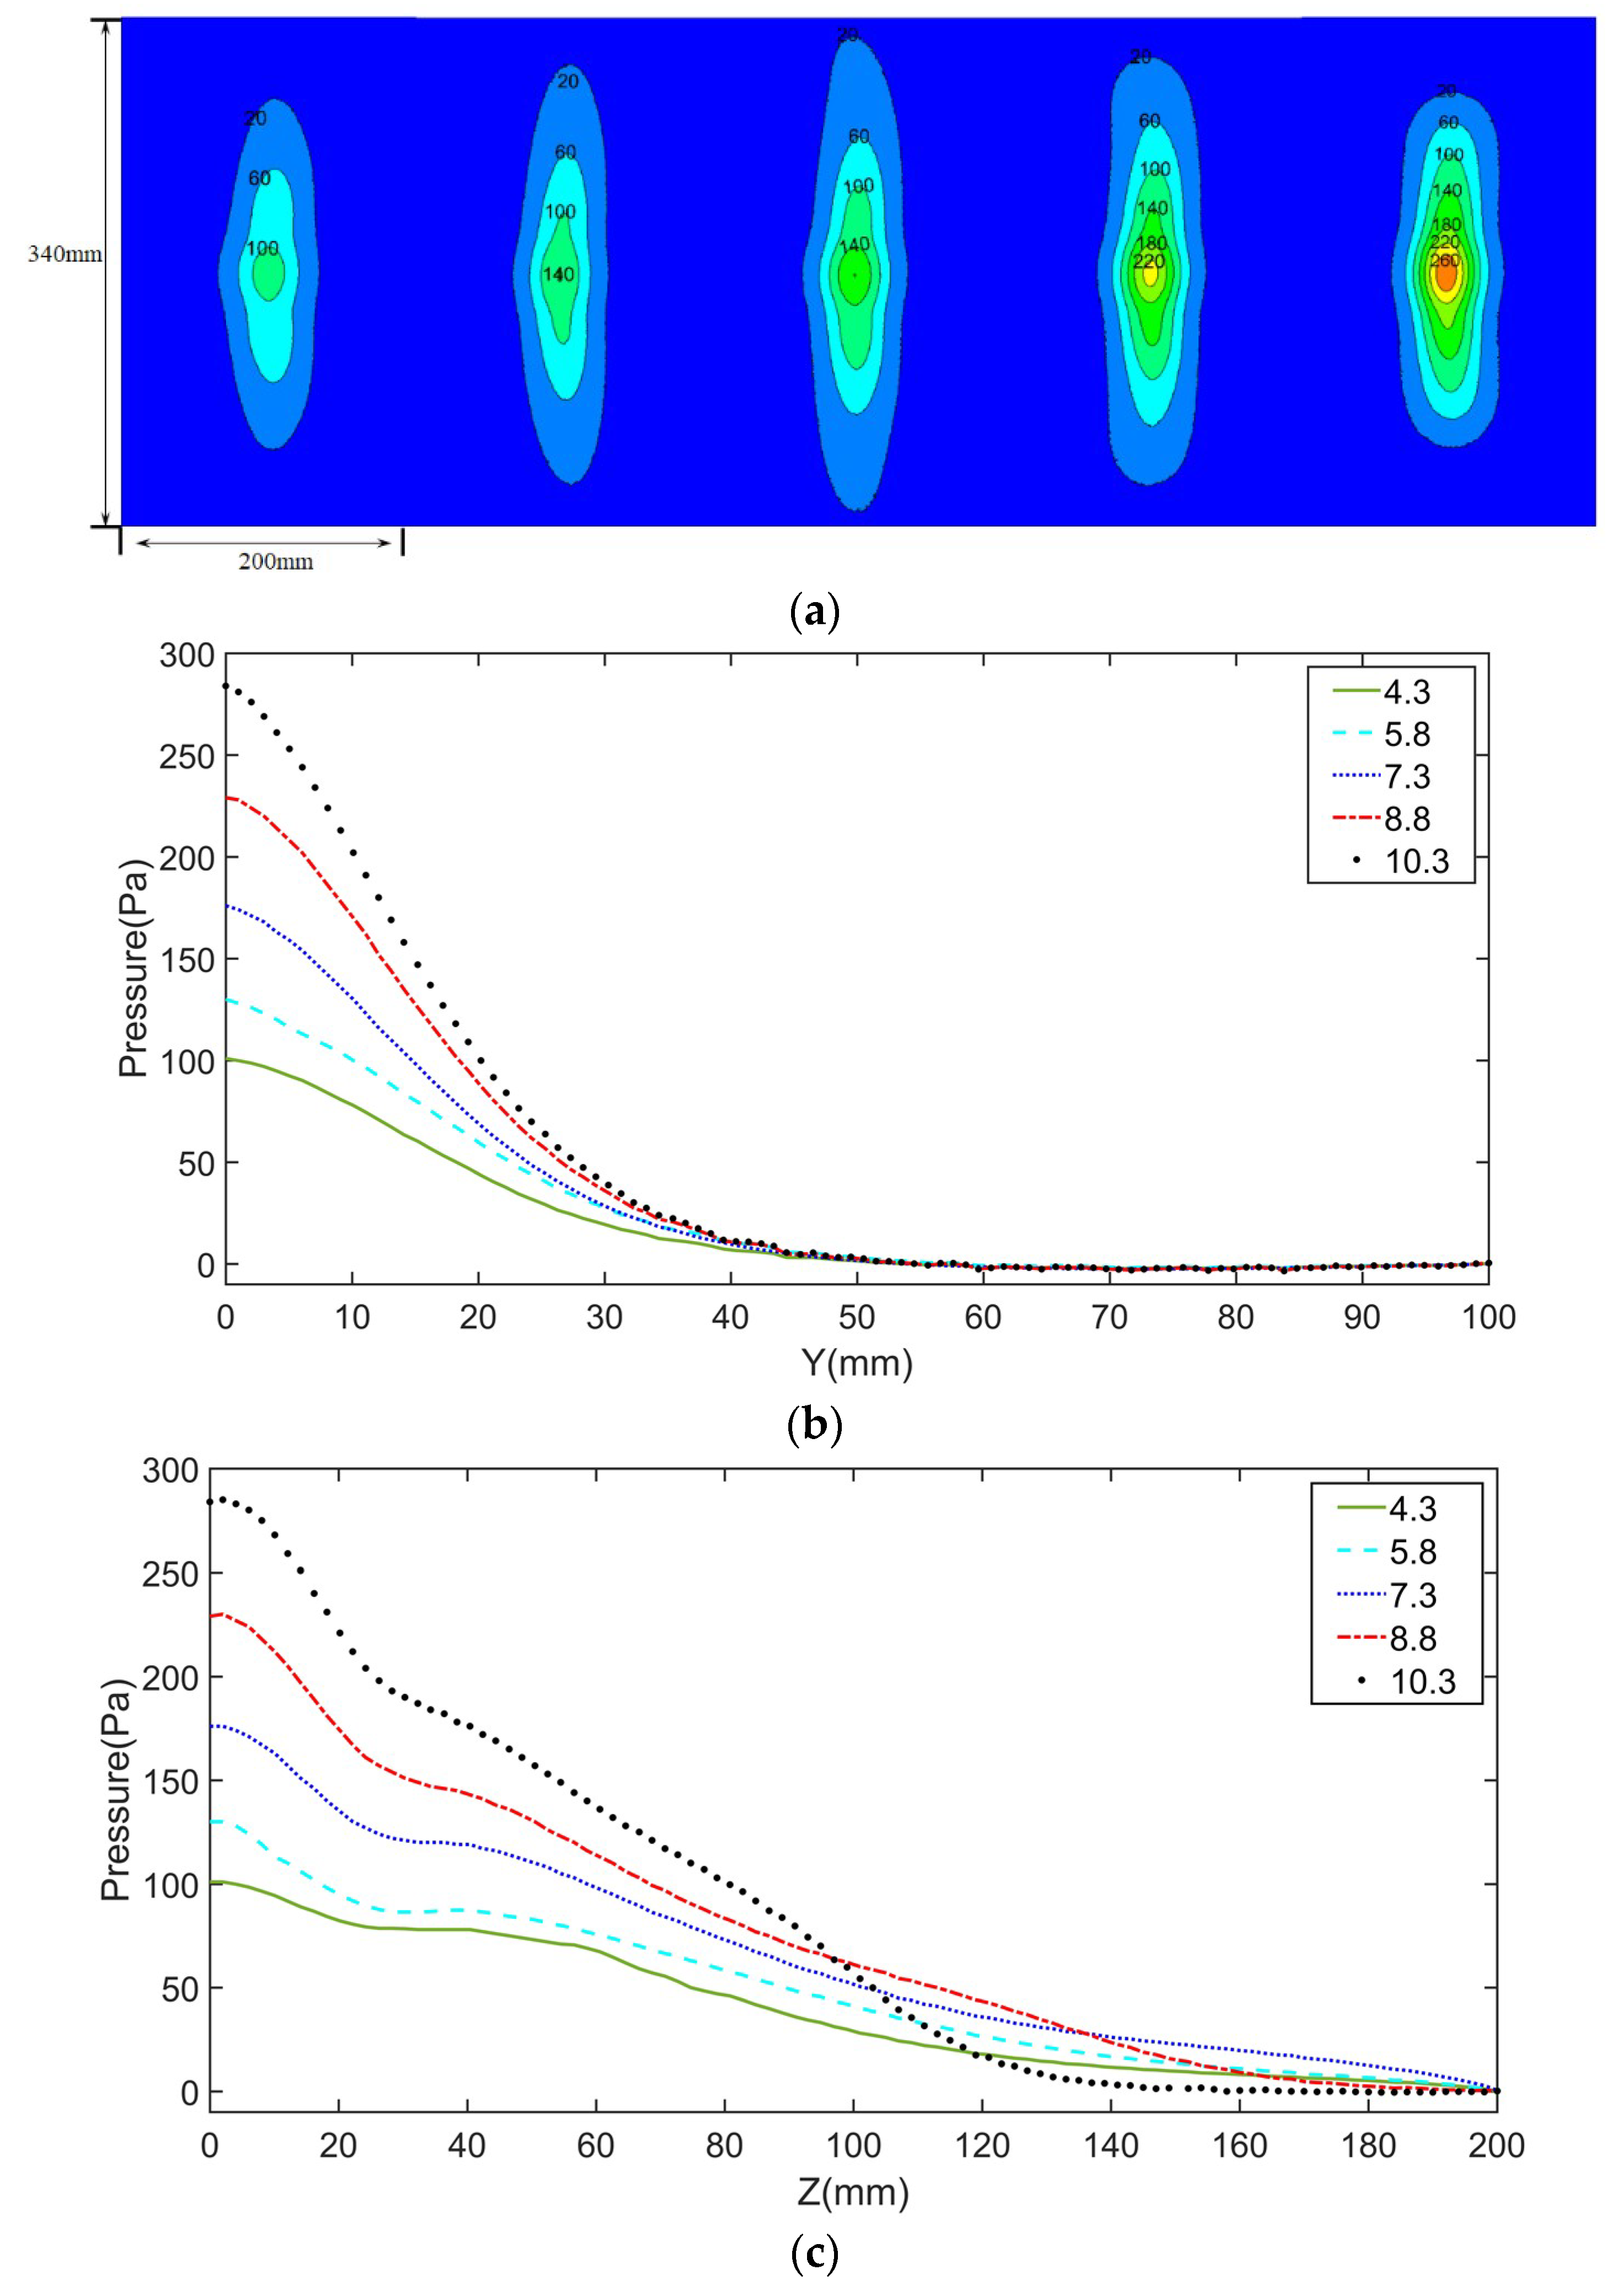
3.2.2. Target Surface
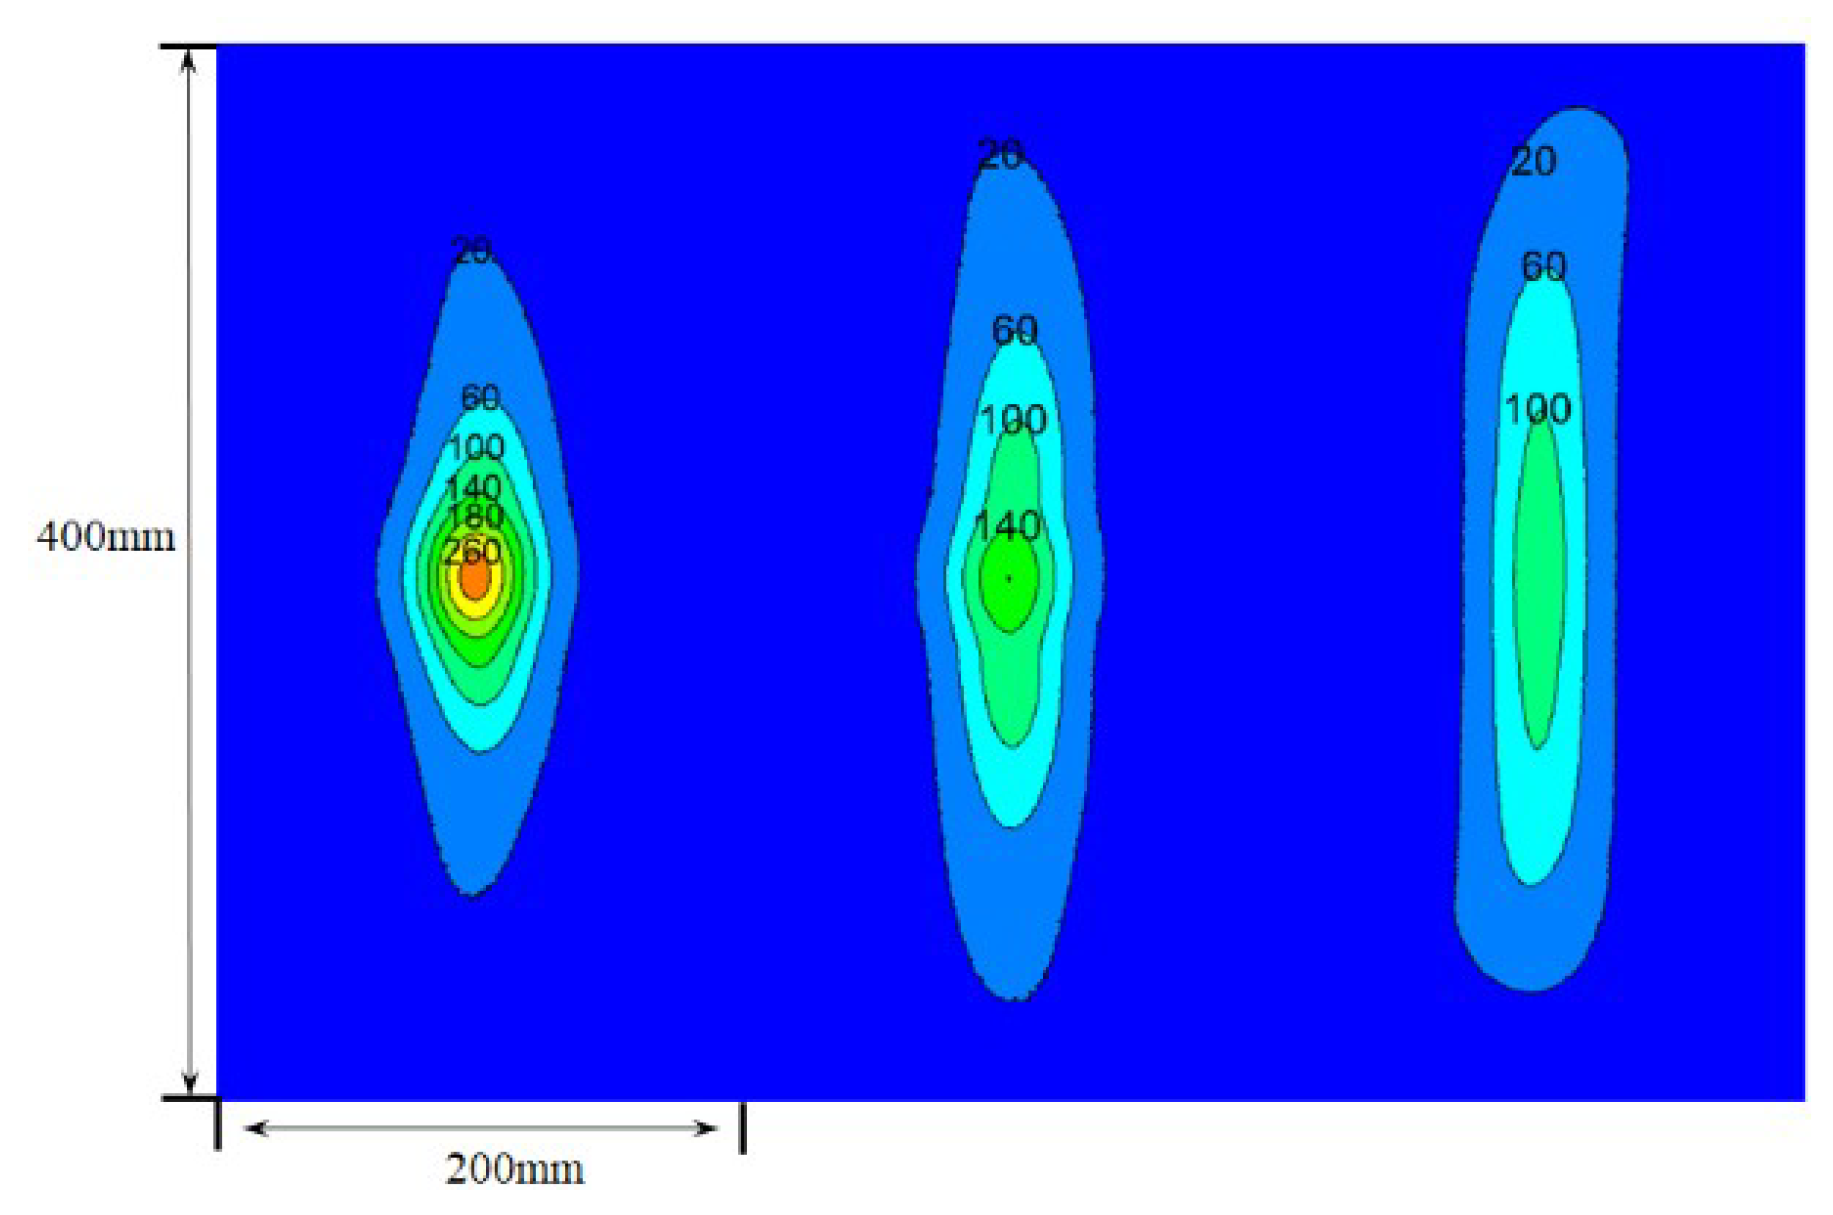
Figure 1 indicates the pressure distribution on the target surface in different Δ. From Figure 11a, the pressure areas with the pressure values greater than 20 Pa on the target surface can be seen. We can see that, for cases with large or small Δ, the extension distance of the pressure region in the z-axis (long axis) direction was relatively small, but the width of the region in the y-axis (short axis) direction was basically the same. Figure 11b,c show that the pressure at the center of the target surface increased from 100 to 280 Pa, when Δ increased from 4.3 to 10.3. The reason for this phenomenon is that when Δ was small, the impingement of the airflows from the two sets of opposite shaping air holes became harder, and the energy dissipation was larger. The greater the pressure was in the central area of the target surface, the easier it was to cause overspray. In the y-axis direction of the target surface, the larger the Δ was, the steeper the pressure distribution curve was. When y = 40 mm, the pressure at different Δ decreased to nearly the same value. When y > 50 mm, the pressure was basically stable and no longer dropped. In the z-axis direction, with increasing Δ, the pressure in the high-pressure area increased gradually, but when z = 100 mm, the pressure value suddenly decreased and rapidly dropped to 0 for the largest Δ. When Δ = 10.3, the high pressure near the central position of the target surface was especially obvious. The same phenomenon occurred at the position of z = 140 mm during Δ = 8.8. The reason for this phenomenon may be that, with increasing Δ, the velocity of the airflow from shaping air holes had a larger component value in the x direction, and the airflow from the annular air hole also strengthened it. Both of them made aerodynamic force more concentrated on the center of the target surface. They also led to that the farther away from the center of the target surface, the greater the air pressure dropped. Based on the above results, it can be concluded that, with the increase of Δ, the high-pressure area of the target surface became more concentrated, and the phenomenon of overspray occurred much more easily in the spraying process. However, if Δ was too small, the maximum pressure on the target surface was low and the pressure areas on the target surface were smaller, due to the large dissipation of energy at the intersection.
3.3. Simulation Results of Gas-Liquid Phase
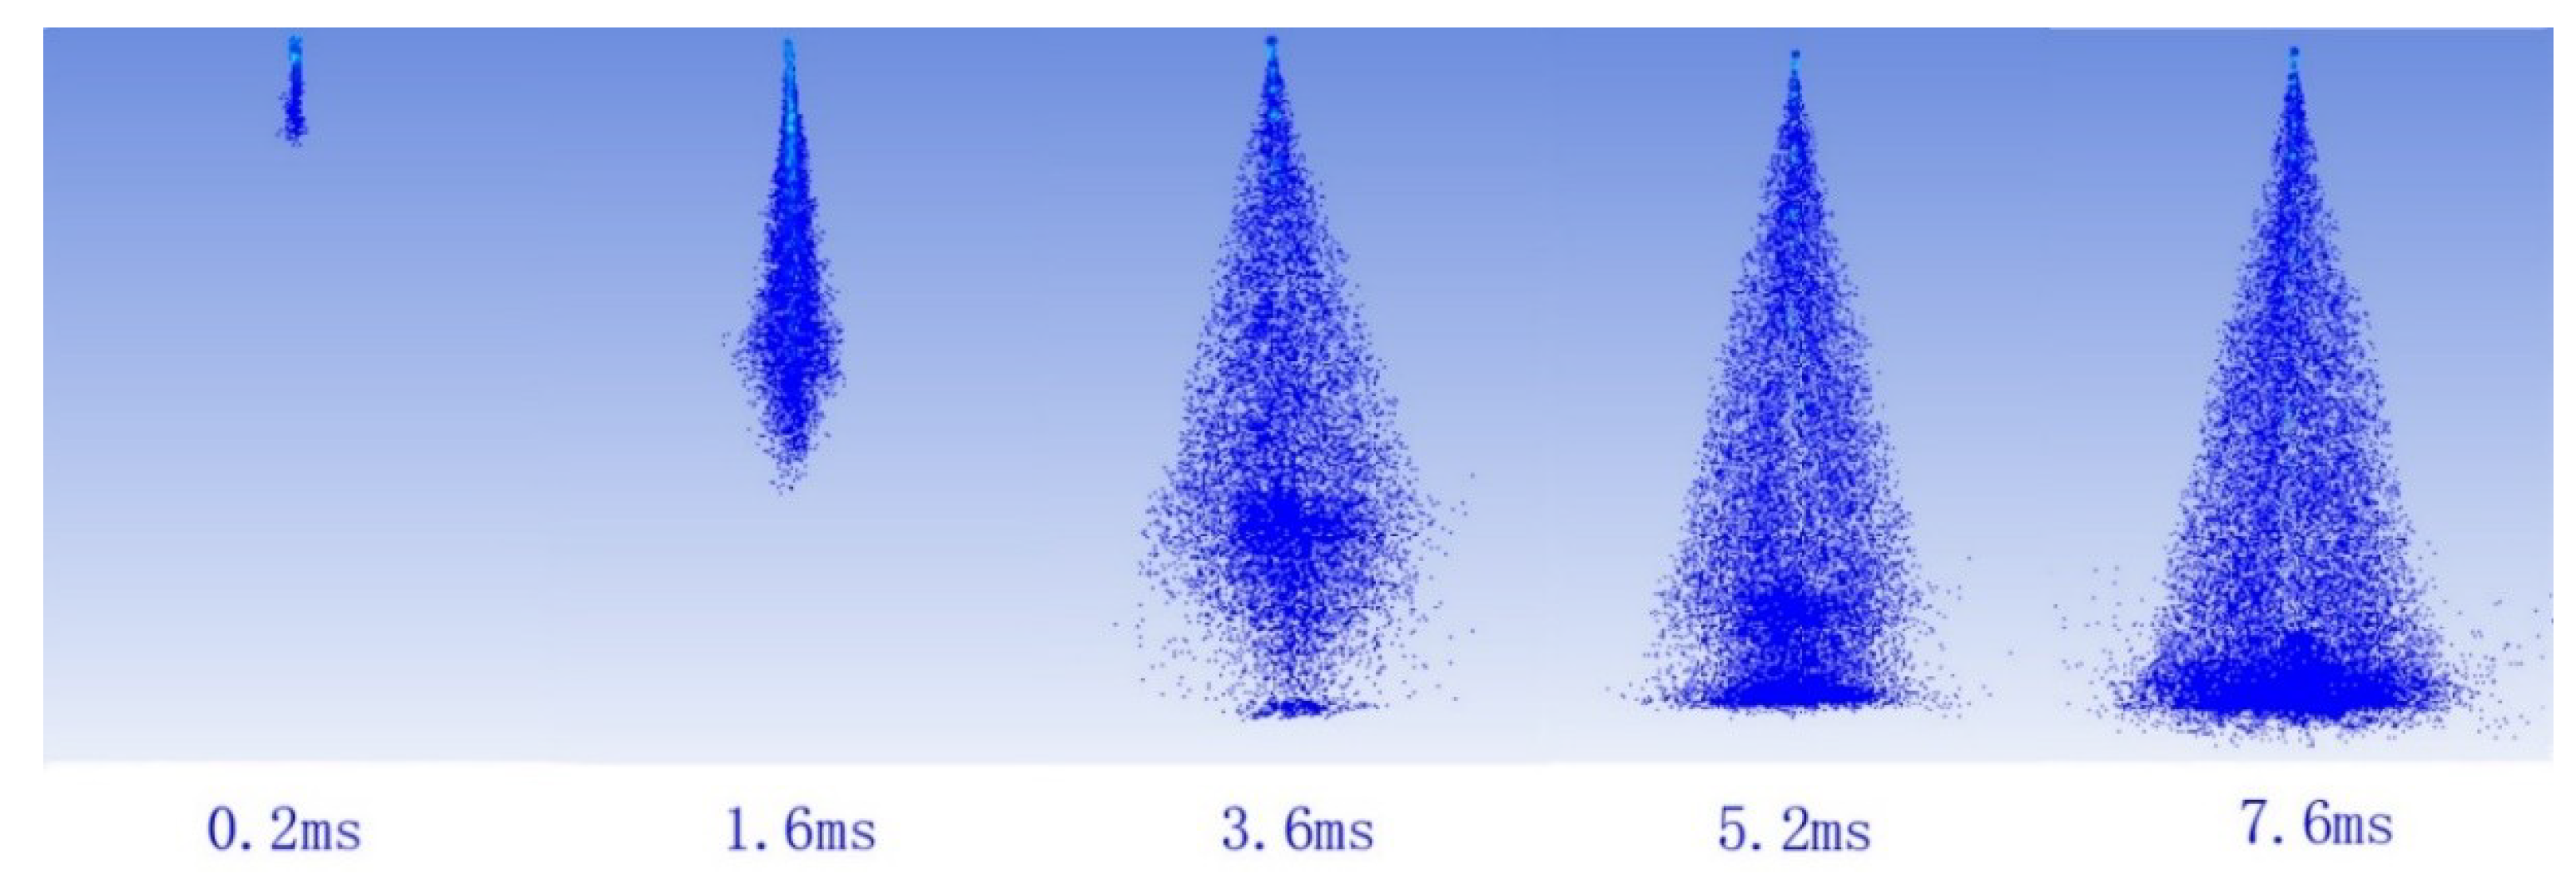
Figure 12 indicates the development of spray outside the nozzle when Δ = 4.3. After 3.6 ms, the partcles began contacting the target surface. After 7.6 ms, the spraying pattern of the particles on the target surface was basically formed.
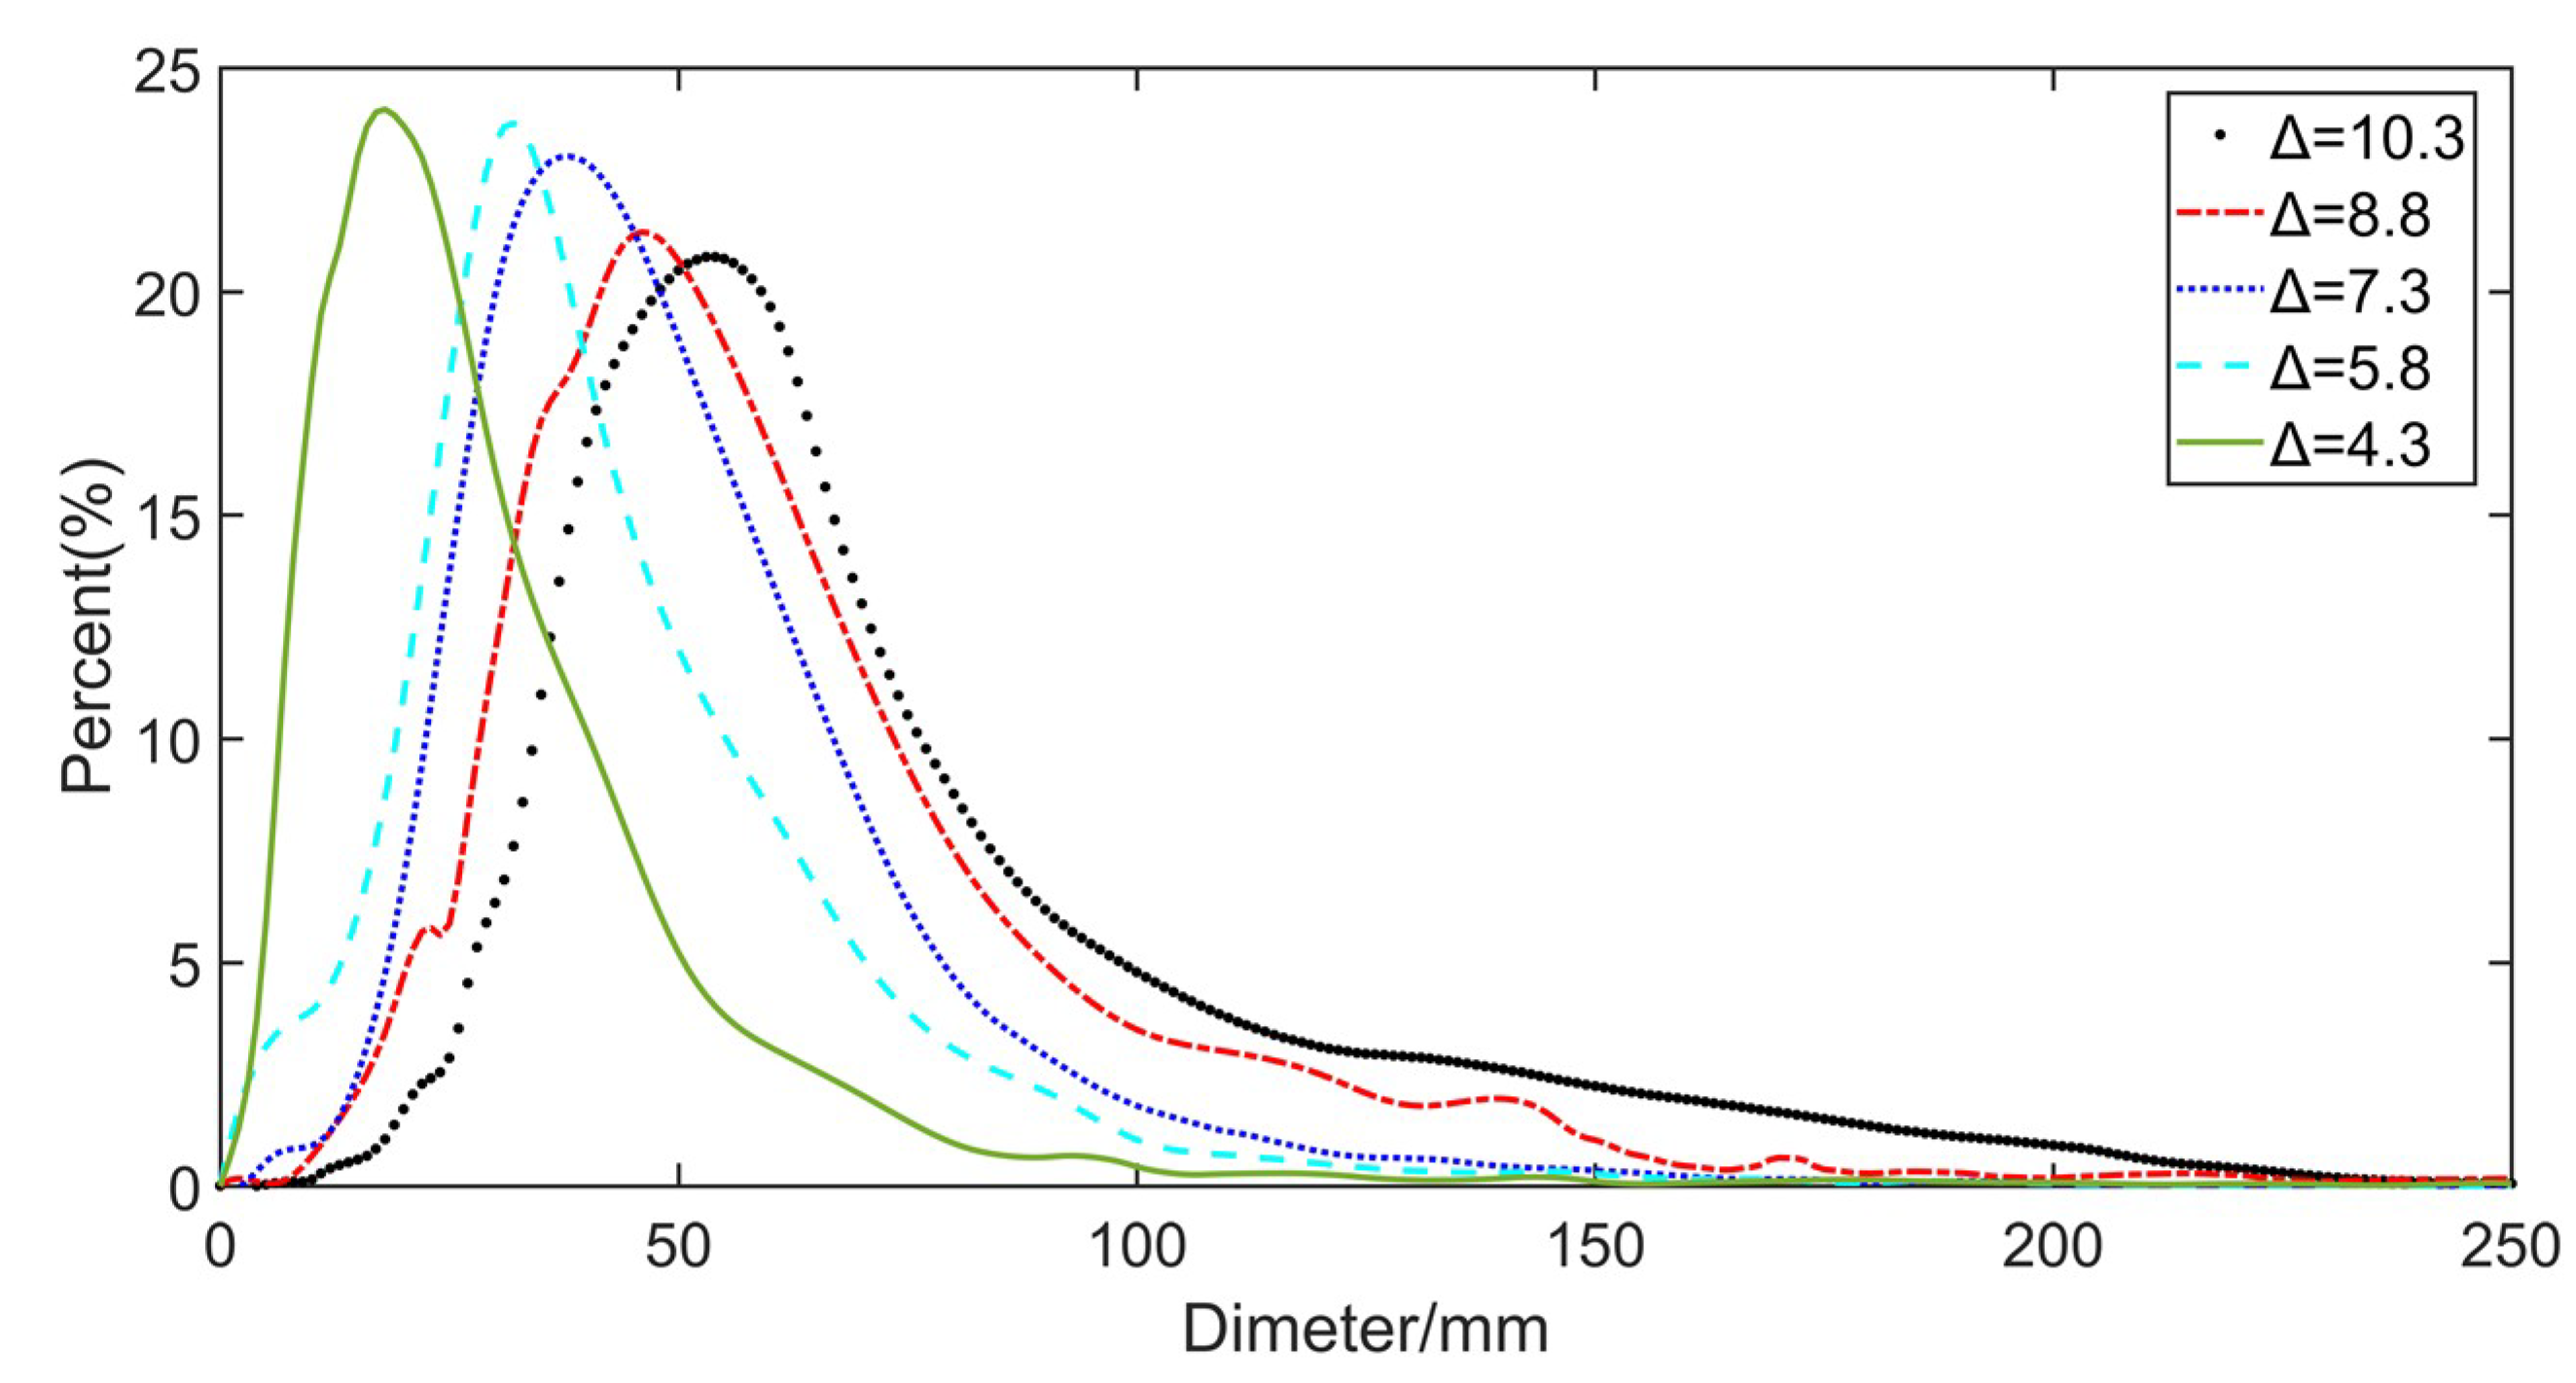
The droplet size distribution on the target surface under different Δ seen in Figure 13 shows that it was distributed from 0 to 250 μm, but mainly in the range of 0 to 100 μm. The average size of the particles increased as Δ increased. According to Figure 11, the case with smaller Δ had a greater impingement of the airflow from shaping air holes, and the shearing effect of the droplets became larger, resulting in smaller droplet size.
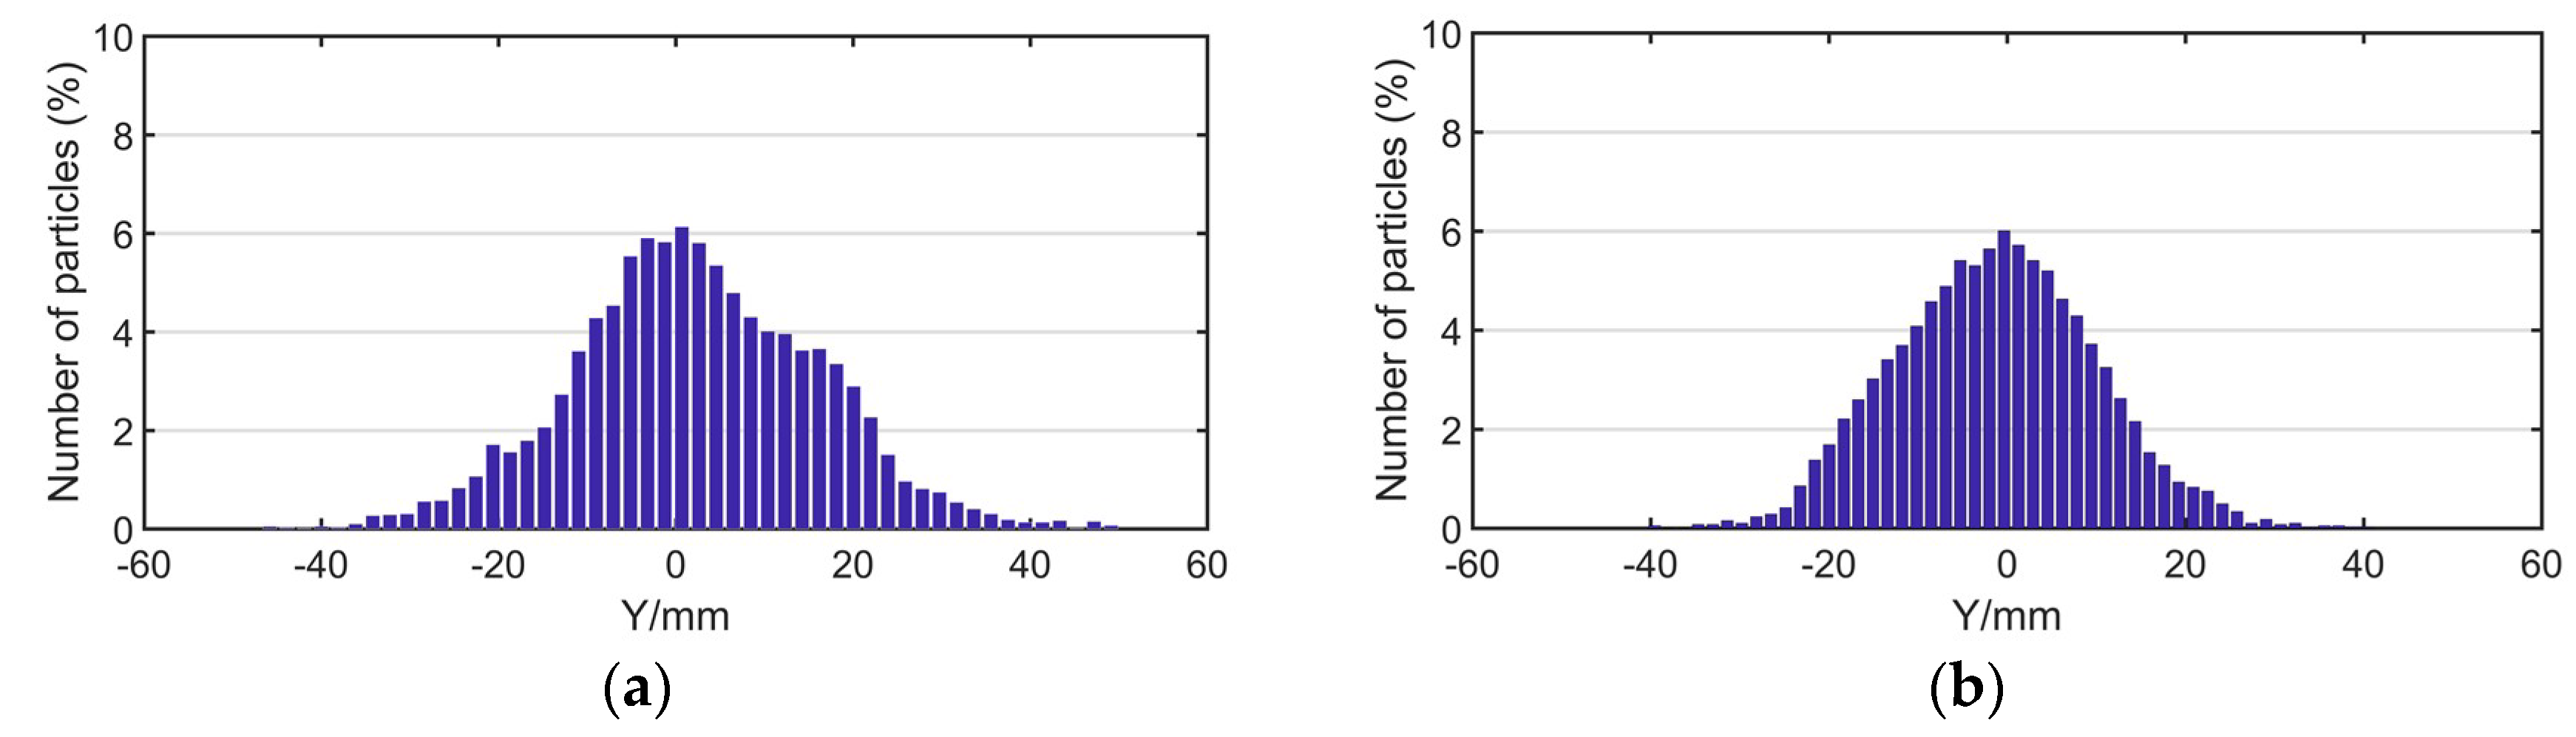
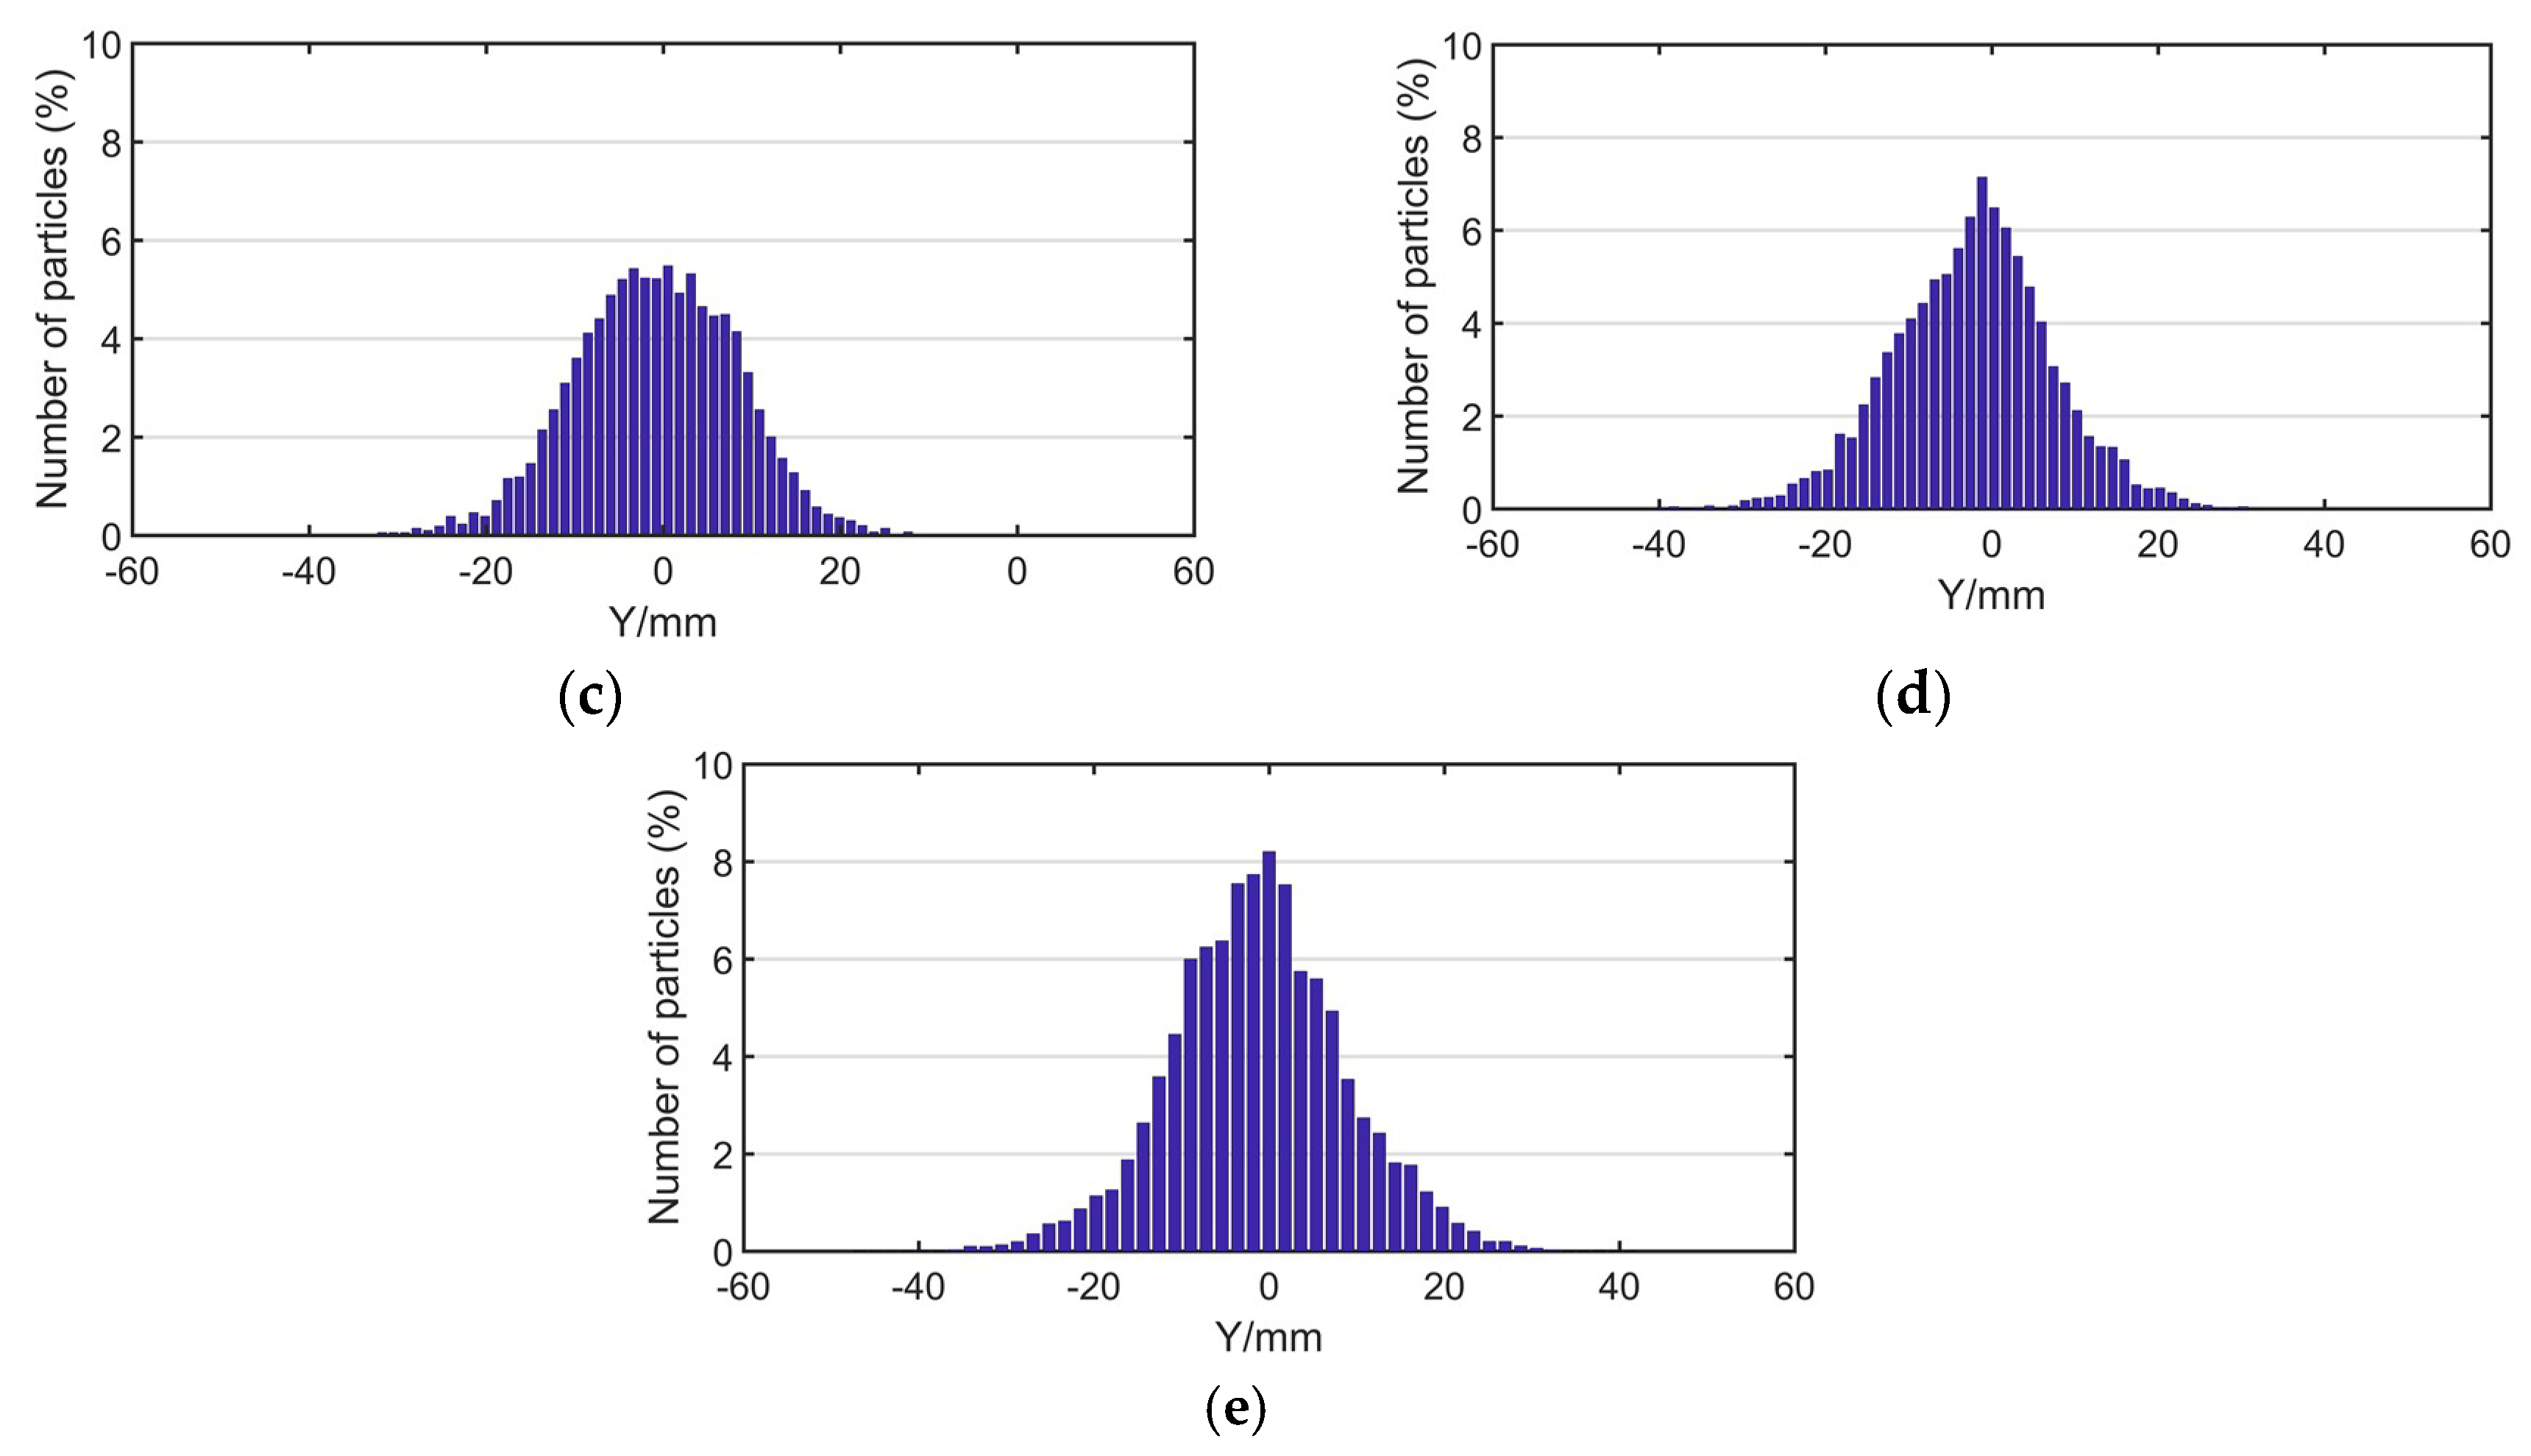
Figure 14 shows the number distribution of particles along the y-axis on the target surface. According to the Figure 14, the distribution range of particles in the y-axis direction was approximately −40 to 40 mm. Obviously, when Δ was larger, the distribution of particles was more concentrated at the center of the target surface. When Δ = 10.3, the proportion of particles at the center was about 8%, and it decreased rapidly on both sides, which means that the characteristic of overspray was obvious. When Δ was small, the distribution of particles was more uniform.
3.4. The Pressure of Shaping Air Holes
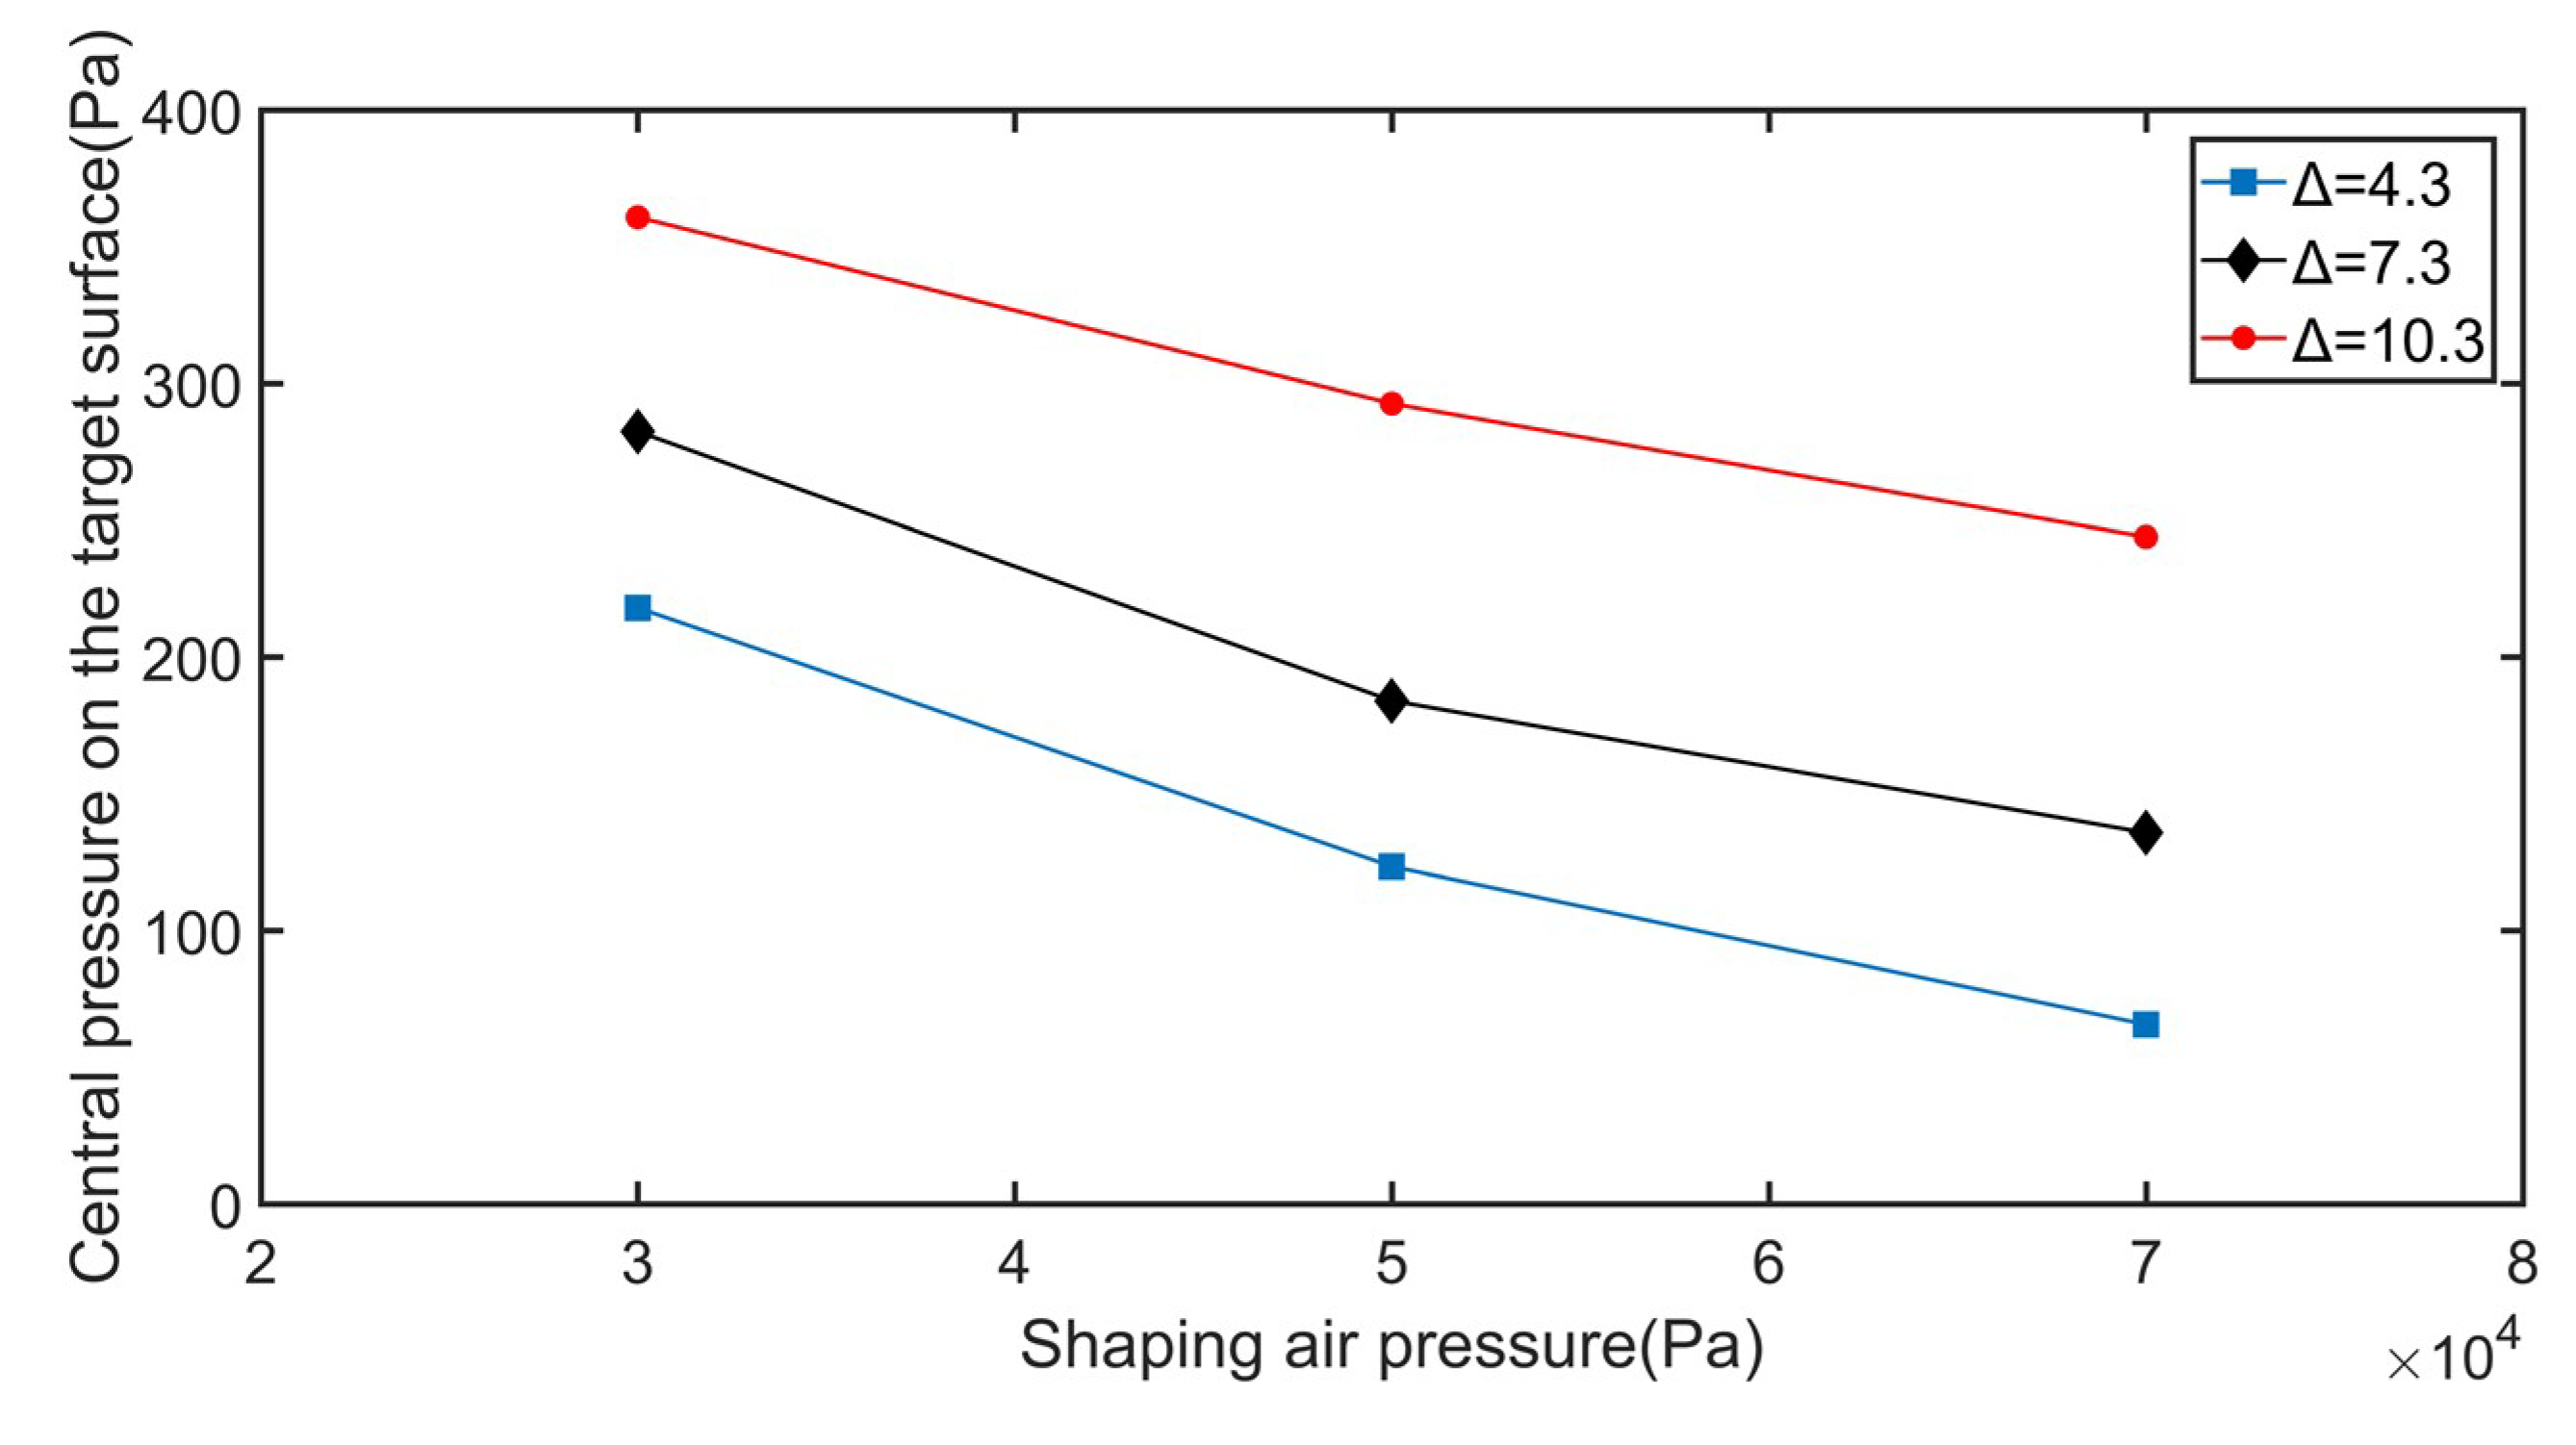
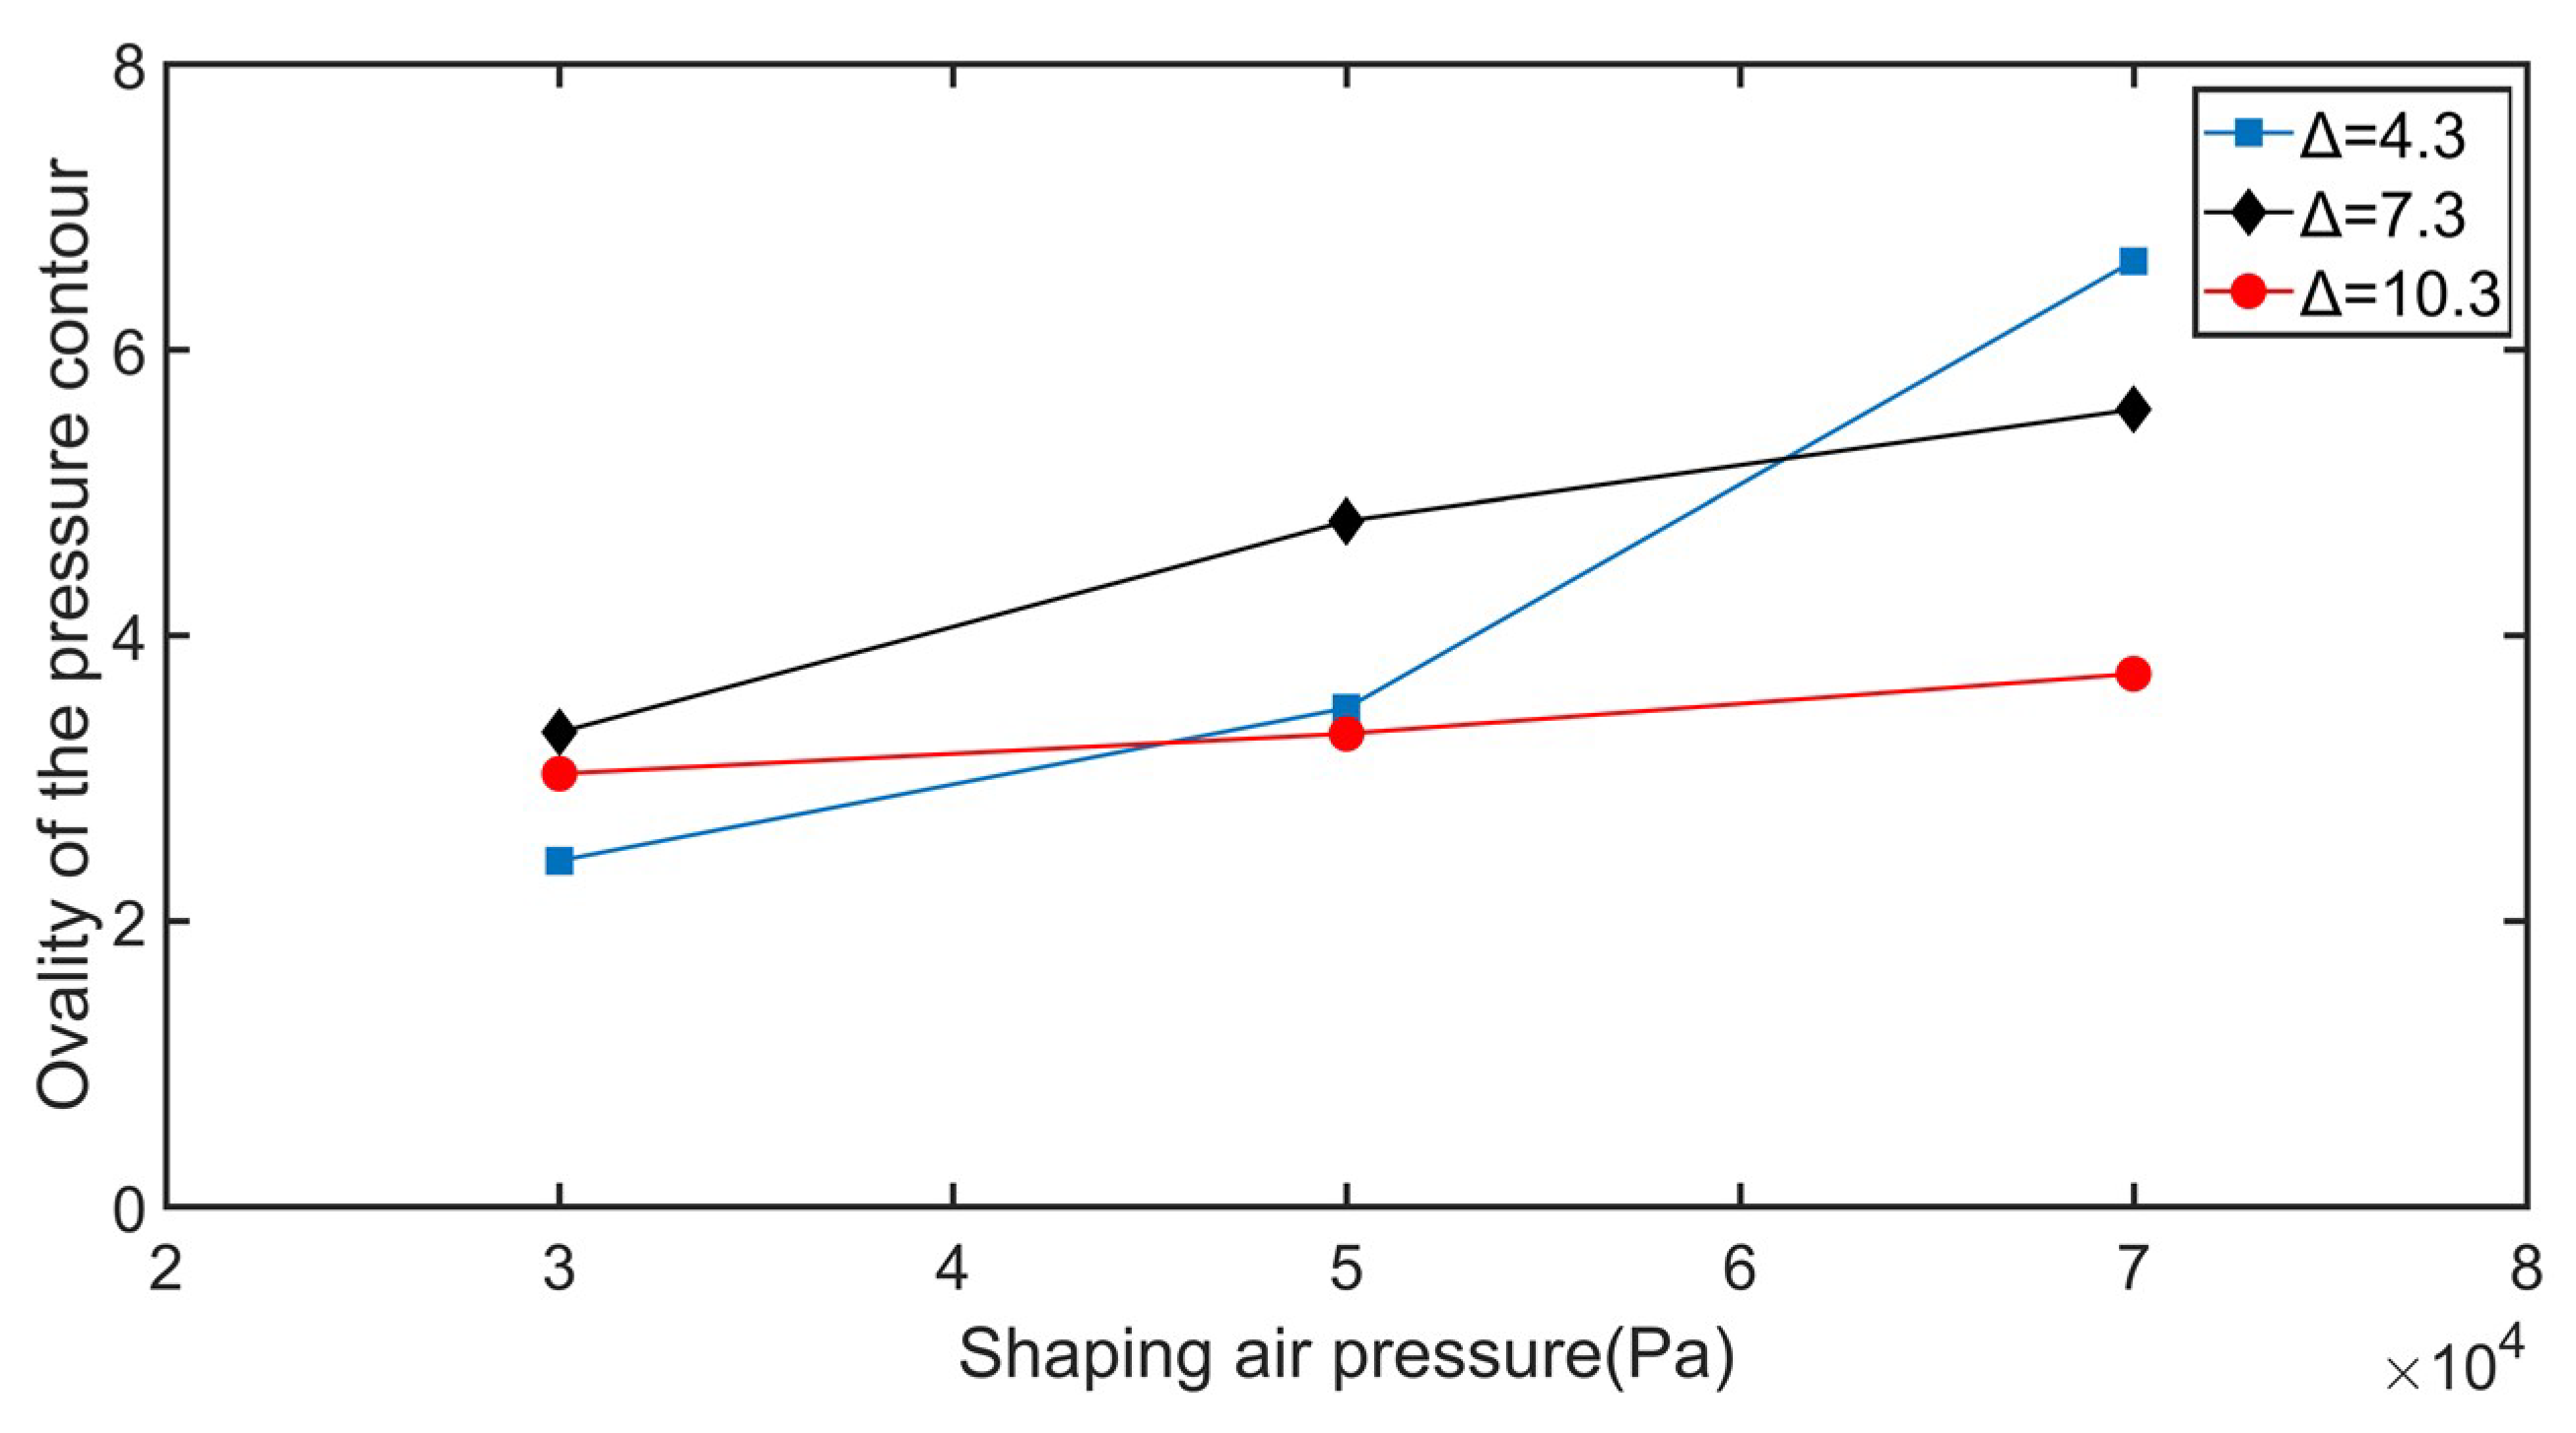
In the spraying process, the influence of shaping air holes on the flow field is relevant not only to the position of the intersection but also to the shaping air pressure. Comparing Figure 11 and Figure 14, it can be found that the pressure pattern of the target surface could adequately reflect the distribution characteristics of discrete phase particles on the target surface. Under the condition of Δ = 7.3, the influence of shaping air holes on overspray was further investigated by varying the shaping air pressure.
From Figure 15, it can be seen that, upon increasing shaping air pressure, the pressure area with a pressure value greater than 20 Pa lengthened in the z-axis (long axis) direction, but the width of this area decreased significantly in the y-axis (short axis) direction, meaning that the shaping air pressure had a direct effect on the ovality (the ratio of the long axis to the short axis of the elliptical pressure region with pressure greater than 20 Pa) of the spraying contour. When the shaping air pressure was 30,000 Pa, aerodynamic force from the annular air hole played an important role in the spraying process, which resulted in a large pressure on the target surface, along with a more concentrated distribution of high pressure, and the shape of the spraying contour tended to be circular with a smaller ovality. With the shaping air pressure increasing to 70,000 Pa, the pressure distribution on the target surface became more uniform, its shape became narrow and long, and the ovality was larger.
Furthermore, the positions of the intersection changed with the variation of shaping air pressure. According to Figure 16, when the intersection was fixed, the central pressure of the target surface decreased with increasing shaping air pressure; when shaping air pressure was fixed, the increase in Δ made the central pressure of the target surface increase, making it much easier to cause overspray. Figure 17 shows that, upon increasing shaping air pressure, the ovality increased. However, when the Δ was small, the ovality was more susceptible to the shaping air pressure. From the above, we can find that the coating quality was better and the overspray was suppressed when the shaping air pressure was large and Δ was small.
4. Conclusions
In order to analyze the influence of shaping air holes on spray characteristics, numerical simulations based on the DPM model and the TAB model were investigated. Several cases with different intersections and pressures of shaping air holes were simulated. The experiment was designed to verify the numerical model. According to the results, the following conclusions were drawn:
- The nozzle that had the largest distance between intersection and paint hole shows the strongest overspray characteristics. In the case that Δ = 10.3, the high-pressure area and droplet distribution were more concentrated on the target surface, and droplet diameter was large. Therefore, the nozzle that had small Δ could achieve better atomization characteristics. However, if Δ was too small, 4.3 for example, the maximum pressure on the target surface was low due to the large dissipation of energy at the intersection. The result of this was a spraying pattern with fuzzy edges.
- Upon increasing shaping air pressure, the spraying pattern on the target surface became narrow and the maximum pressure on the target surface was smaller. However, ovality was more easily affected in nozzle spraying with small Δ.
- When the above two factors were combined for the spray-coating process, small Δ with large shaping air pressure could reduce overspray. In the case that the nozzle had large Δ but small shaping air pressure, such as Δ = 10.3 and 30,000 Pa, the atomization characteristics were poor because central pressure and ovality were 360.83 Pa and 3.3, respectively, which means a round and concentrated spraying pattern.
Author Contributions
L.Q. designed the study. W.L. performed simulations, analyzed the data, and wrote the draft. S.S. solved some code problems and operated part of the experiments. X.Z. edited the paper and operated part of the experiments.
Funding
This work was supported by the National Natural Science Foundation (11872352 and 11632016), and the Zhejiang Provincial Natural Science Foundation (LY17A020008).
Conflicts of Interest
The authors declare no conflicts of interest.
References
- Ye, Q.; Domnick, J.; Khalifa, E. Simulation of the spray coating process using a pneumatic atomizer. In Proceedings of the ILASS-Europe, Zaragoza, Spain, 9–11 September 2002. [Google Scholar]
- Schäfer, W.; Rosenkranz, S.; Brinckmann, F.; Tropea, C. Analysis of pneumatic atomizer spray profiles. Particuology 2016, 29, 80–85. [Google Scholar] [CrossRef]
- Ye, Q.; Pulli, K. Numerical and experimental investigation on the spray coating process using a pneumatic atomizer: Influences of operating conditions and target geometries. Coatings 2017, 7, 13. [Google Scholar] [CrossRef]
- Qian, L.; Song, S.; Li, X. A new spray approach to produce uniform ultrafine coatings. J. Nanotechnol. 2018, 2018, 8978541. [Google Scholar] [CrossRef]
- Ye, Q.; Domnick, J. Analysis of droplet impingement of different atomizers used in spray coating processes. J. Coat. Technol. Res. 2017, 14, 467–476. [Google Scholar] [CrossRef]
- Fogliati, M.; Fontana, D.; Garbero, M.; Vanni, M.; Baldi, G.; Dondè, R. CFD simulation of paint deposition in an air spray process. J. Coat. Technol. Res. 2006, 3, 117–125. [Google Scholar] [CrossRef]
- Liu, B.Y.H.; Kwok, K.C.; Liu, B.Y.H. How atomization affects transfer efficiency. Ind. Finish. May 1992, 28–32. [Google Scholar]
- Lee, I.; Kim, D.; Koo, J. Liquid jet breakup structure and transfer efficiency of a two-stage air-blast injector. Atomization Spray. 2012, 22, 561–579. [Google Scholar] [CrossRef]
- Qian, L.; Lin, J.; Xiong, H. Simulation of droplet-gas flow in the effervescent atomization spray with an impinging plate. Chin. J. Chem. Eng. 2009, 17, 8–19. [Google Scholar] [CrossRef]
- Hicks, P.G.; Senser, D.W. Simulation of paint transfer in an air spray process. J. Fluids Eng. 1995, 117, 713. [Google Scholar] [CrossRef]
- Mlkvik, M.; Stähle, P.; Schuchmann, H.P.; Gaukel, V.; Jedelsky, J.; Jicha, M. Twin-fluid atomization of viscous liquids: The effect of atomizer construction on breakup process, spray stability and droplet size. Int. J. Multiphase Flow 2015, 77, 19–31. [Google Scholar] [CrossRef] [Green Version]
- Ashgriz, N. Handbook of Atomization and Sprays: Theory and Applications; Springer: New York, NY, USA, 2011; ISBN 978-1-4419-7264-4. [Google Scholar]
- Chen, S.K.; Lefebvre, A.H. Spray Cone Angles of Effervescent Atomizers. Atomization Spray. 1994, 4, 291–301. [Google Scholar] [CrossRef]
- Jedelský, J.; Jícha, M. Spray characteristics and liquid distribution of multi-hole effervescent atomisers for industrial burners. Appl. Therm. Eng. 2016, 96, 286–296. [Google Scholar] [CrossRef] [Green Version]
Figure 1.
Pneumatic atomizer geometry. (A is the intersection of the shaping air holes, Δ is the distance between the intersection and the paint hole).
Figure 1.
Pneumatic atomizer geometry. (A is the intersection of the shaping air holes, Δ is the distance between the intersection and the paint hole).

Figure 2.
Mesh of the computational domain.

Figure 3.
External flow field of the nozzle.

Figure 4.
Gas velocity along the x-axis with different computational cells in the whole domain.

Figure 5.
Experimental set-up and particle size measurement.

Figure 6.
The measurement process of droplet size distribution.

Figure 7.
Droplet size distributions on the plane (x = 150 mm): (a) simulation; (b) experiment; (c) comparison of simulation results and experimental data.
Figure 7.
Droplet size distributions on the plane (x = 150 mm): (a) simulation; (b) experiment; (c) comparison of simulation results and experimental data.

Figure 8.
Spray cone angle of the atomization pattern in the flow field (Δ = 7.3): (a) experiment; (b) simulation.
Figure 8.
Spray cone angle of the atomization pattern in the flow field (Δ = 7.3): (a) experiment; (b) simulation.

Figure 9.
Pressure contour of the gas phase (Pa) (from left to right, Δ goes up): (a) xy plane; (b) xz plane.
Figure 9.
Pressure contour of the gas phase (Pa) (from left to right, Δ goes up): (a) xy plane; (b) xz plane.


Figure 10.
Gas velocity along the x-axis with different Δ when the gas phase developed completely.

Figure 11.
Pressure distribution on the target surface under different Δ: (a) pressure contour (Pa) (from left to right, Δ goes up); (b) pressure distribution curve along the y-axis; (c) pressure distribution curve along the z-axis.
Figure 11.
Pressure distribution on the target surface under different Δ: (a) pressure contour (Pa) (from left to right, Δ goes up); (b) pressure distribution curve along the y-axis; (c) pressure distribution curve along the z-axis.

Figure 12.
Development of spray outside the nozzle (Δ = 4.3).

Figure 13.
Droplet size distribution on the target surface under different Δ.

Figure 14.
Under different Δ, the number distribution of particles along the y-axis on the target surface: (a) Δ = 4.3; (b) Δ = 5.8; (c) Δ = 7.3; (d) Δ = 8.8; (e) Δ = 10.3.
Figure 14.
Under different Δ, the number distribution of particles along the y-axis on the target surface: (a) Δ = 4.3; (b) Δ = 5.8; (c) Δ = 7.3; (d) Δ = 8.8; (e) Δ = 10.3.


Figure 15.
Pressure contour of the target surface at different shaping air pressures, when Δ = 7.3 (Pa) (the pressures from left to right were 30,000, 50,000, and 70,000 Pa).
Figure 15.
Pressure contour of the target surface at different shaping air pressures, when Δ = 7.3 (Pa) (the pressures from left to right were 30,000, 50,000, and 70,000 Pa).

Figure 16.
Pressure at the center of the target surface.

Figure 17.
Ovality of the spraying contour on the target surface.


Table 1.
The properties of the water and gas.
| Materials | Density (kg/m3) | Surface Tension (mN/m) | Viscosity (Pa·s) | Temperature (°C) |
|---|---|---|---|---|
| Water | 998.2 | 73.5 | 0.89 × 10⁻³ | 20 ± 2 |
| Air | 1.185 | – | 1.83 × 10⁻⁵ | 20 ± 2 |
Table 2.
Experimental parameters.
| Liquid flow rate | 316 mL/min |
| Annual air flow rate | 90.5 L/min |
| Assisting air flow rate | 31.8 L/min |
| Shaping air flow rate | 71.2 L/min |
Table 3.
Different cases and their corresponding Δ.
| Case Number | 1 | 2 | 3 | 4 | 5 |
|---|---|---|---|---|---|
| Δ | 4.3 | 5.8 | 7.3 | 8.8 | 10.3 |
© 2019 by the authors. Licensee MDPI, Basel, Switzerland. This article is an open access article distributed under the terms and conditions of the Creative Commons Attribution (CC BY) license (http://creativecommons.org/licenses/by/4.0/).
Share and Cite
MDPI and ACS Style
Li, W.; Qian, L.; Song, S.; Zhong, X. Numerical Study on the Influence of Shaping Air Holes on Atomization Performance in Pneumatic Atomizers. Coatings 2019, 9, 410. https://0-doi-org.brum.beds.ac.uk/10.3390/coatings9070410
AMA Style
Li W, Qian L, Song S, Zhong X. Numerical Study on the Influence of Shaping Air Holes on Atomization Performance in Pneumatic Atomizers. Coatings. 2019; 9(7):410. https://0-doi-org.brum.beds.ac.uk/10.3390/coatings9070410
Chicago/Turabian StyleLi, Wentao, Lijuan Qian, Shaobo Song, and Xiaokai Zhong. 2019. "Numerical Study on the Influence of Shaping Air Holes on Atomization Performance in Pneumatic Atomizers" Coatings 9, no. 7: 410. https://0-doi-org.brum.beds.ac.uk/10.3390/coatings9070410
Note that from the first issue of 2016, this journal uses article numbers instead of page numbers. See further details here.