
Interfacial Tension Sensor for Low Dosage Surfactant Detection

 , and
, and 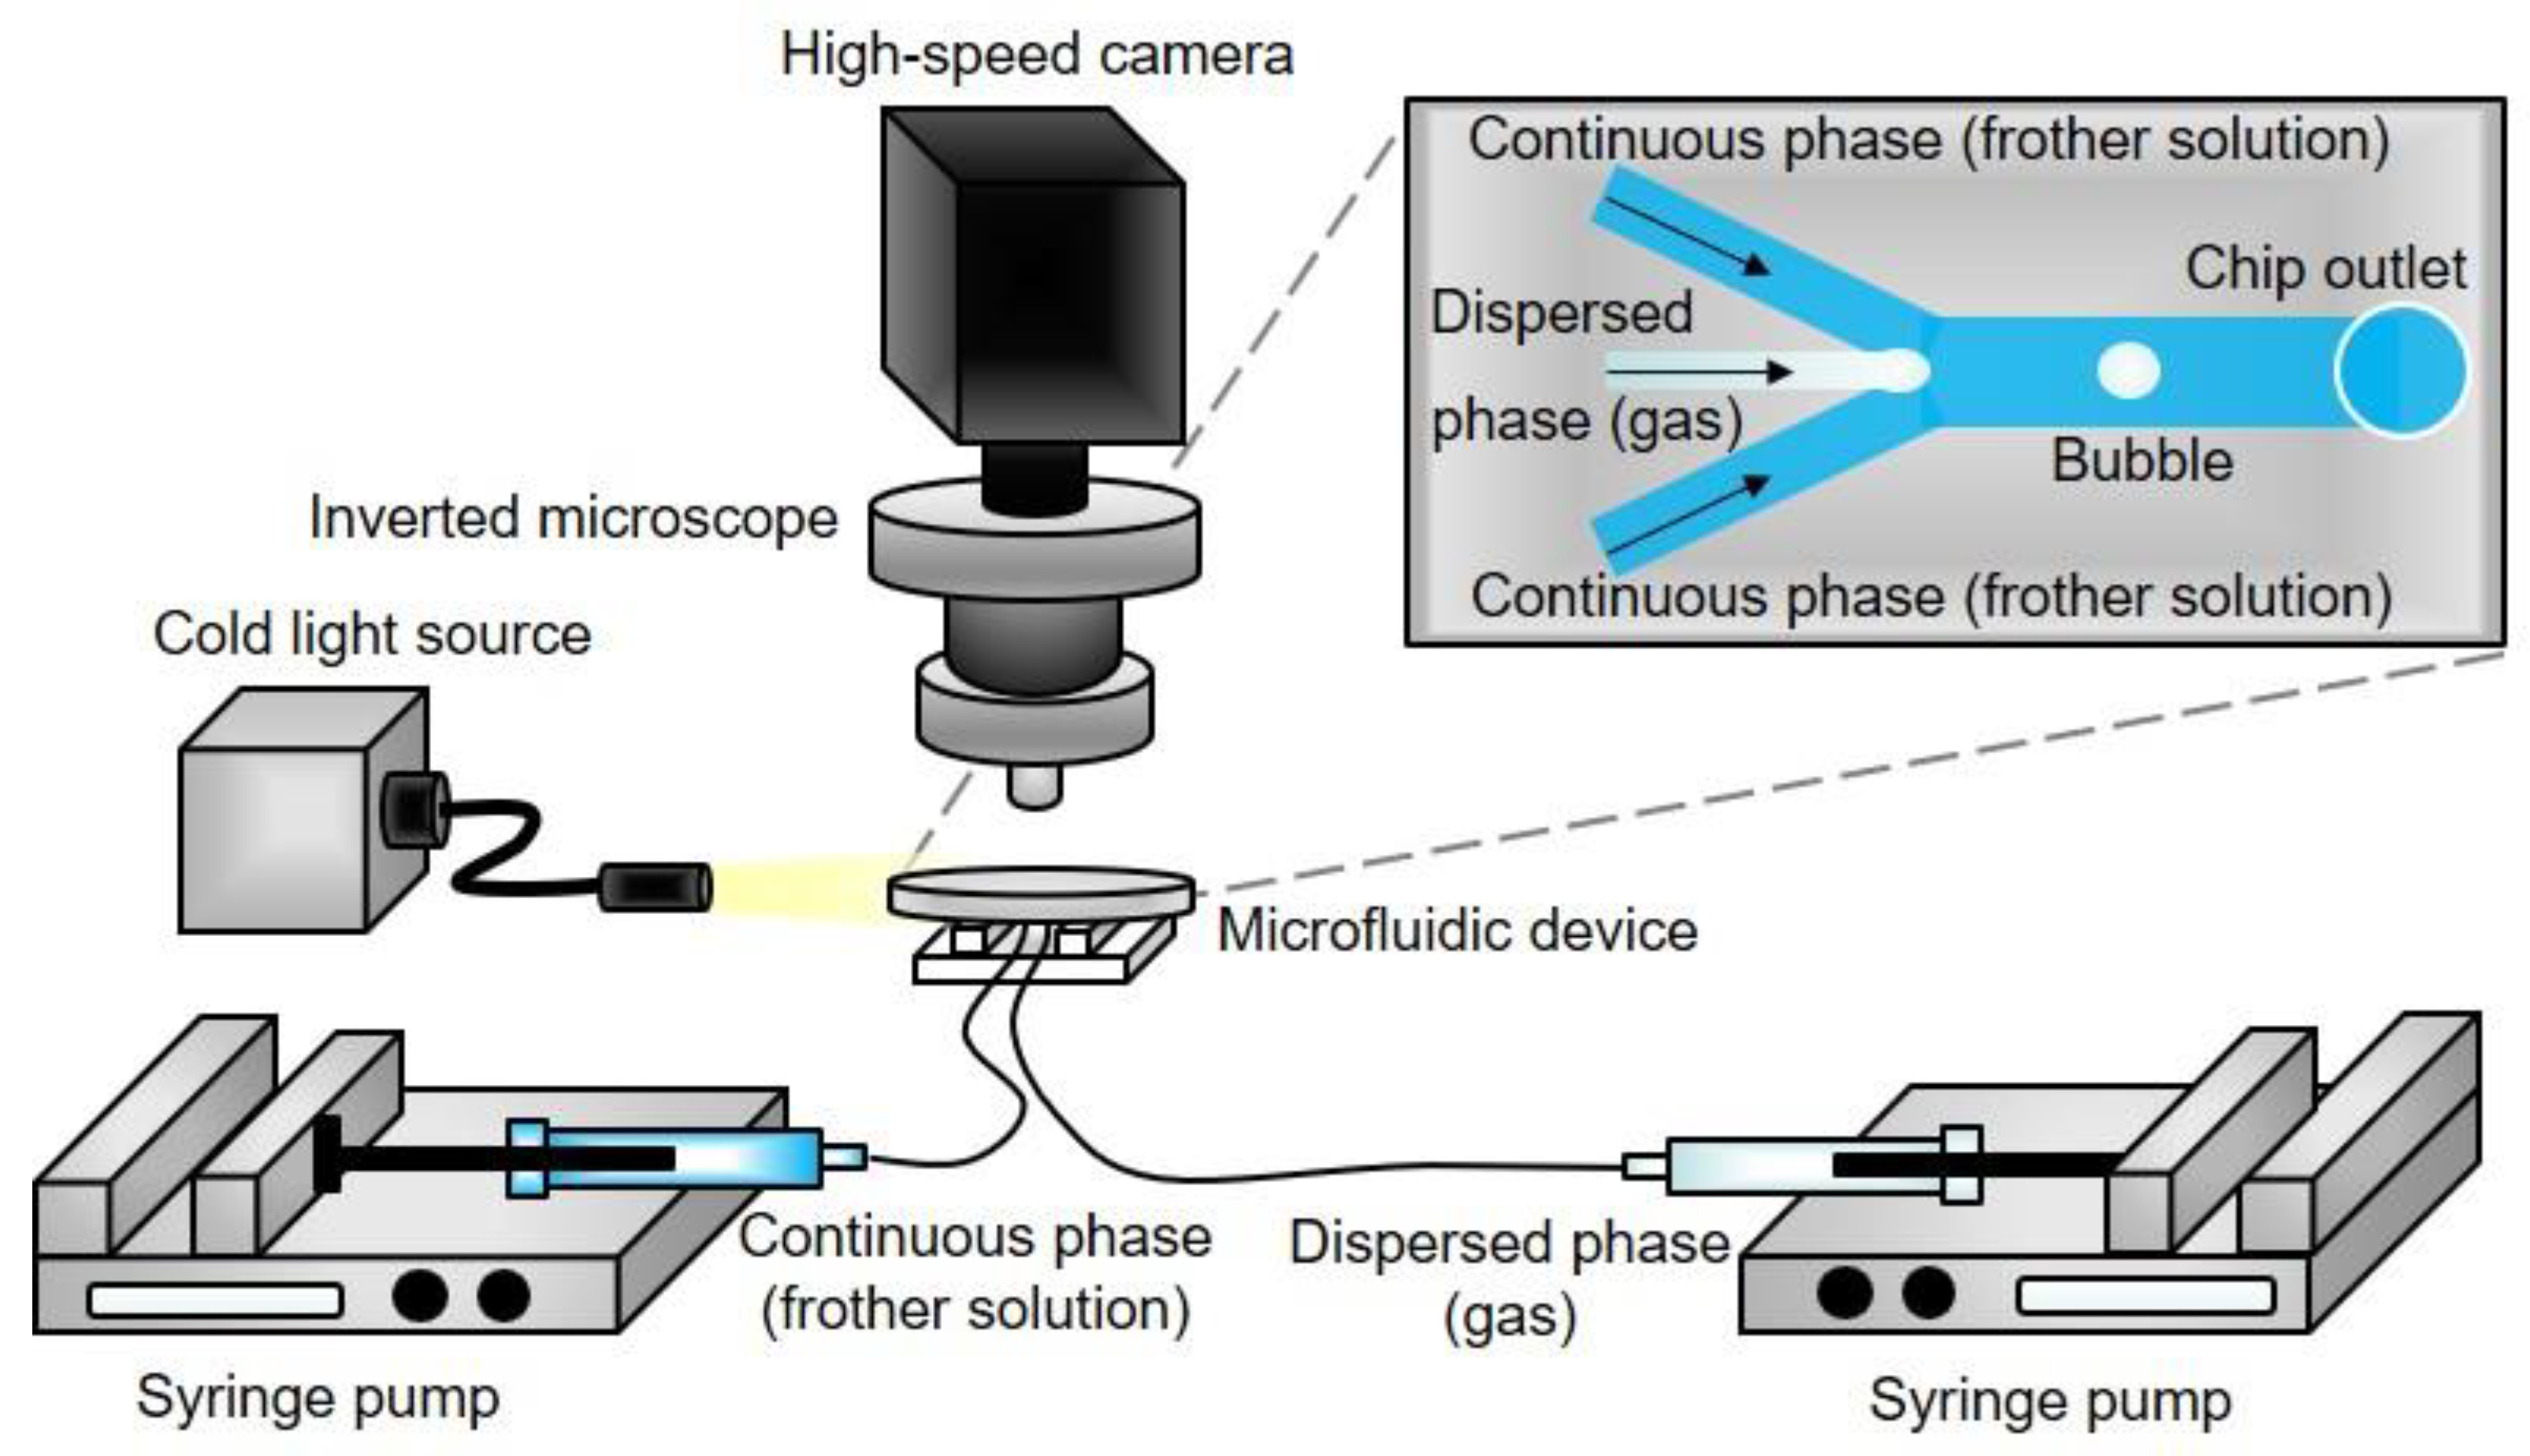
Abstract
:1. Introduction
2. Materials and Methods
2.1. Materials
2.2. Methods
3. Results and Discussion
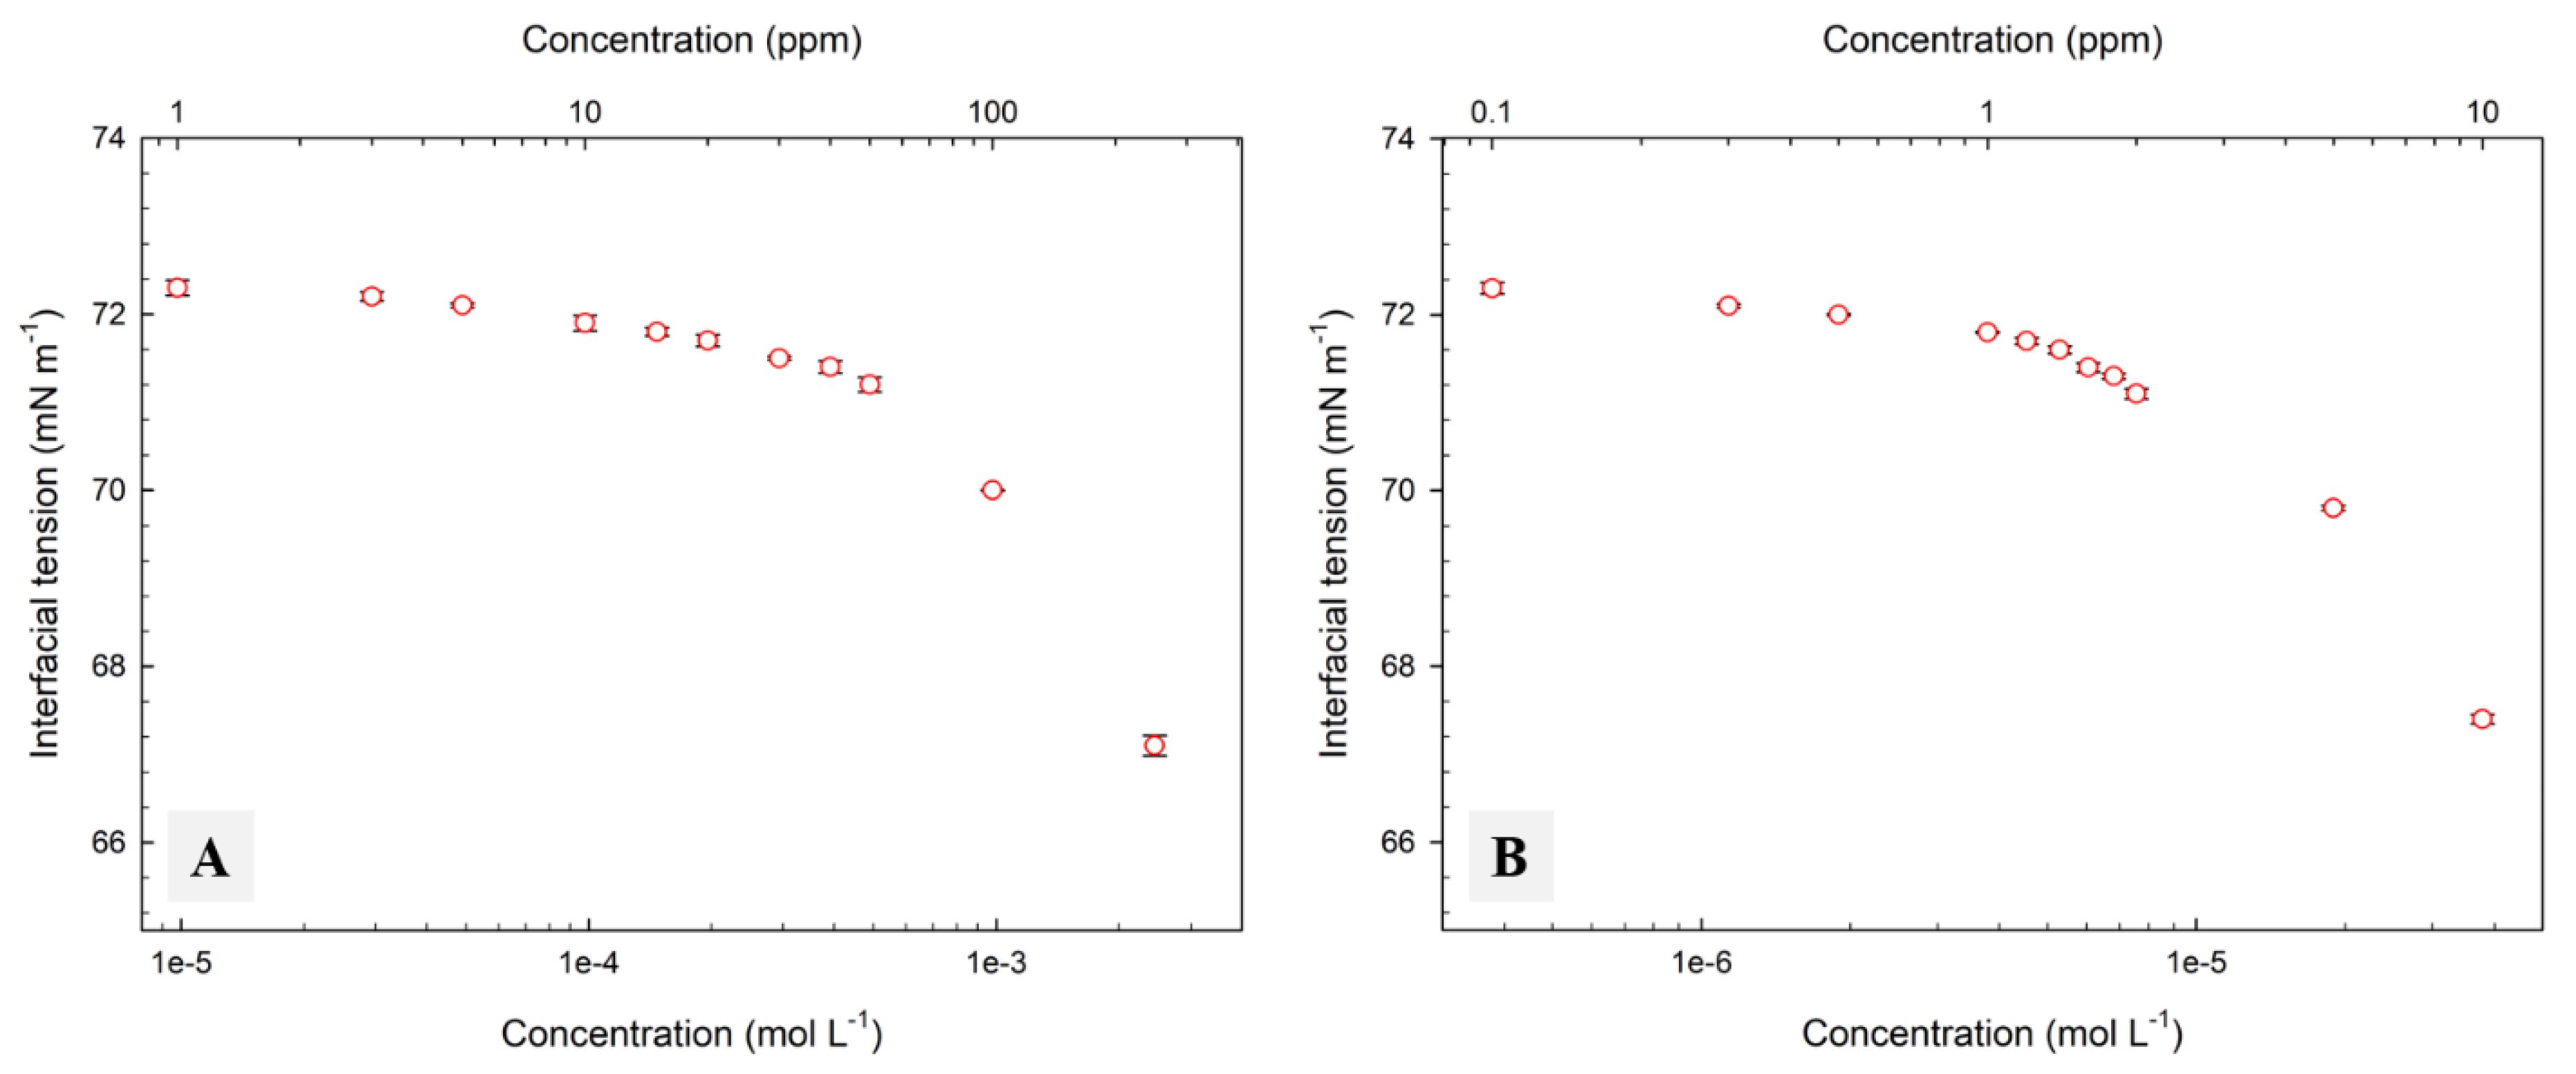
3.1. Interfacial Tension Isotherms
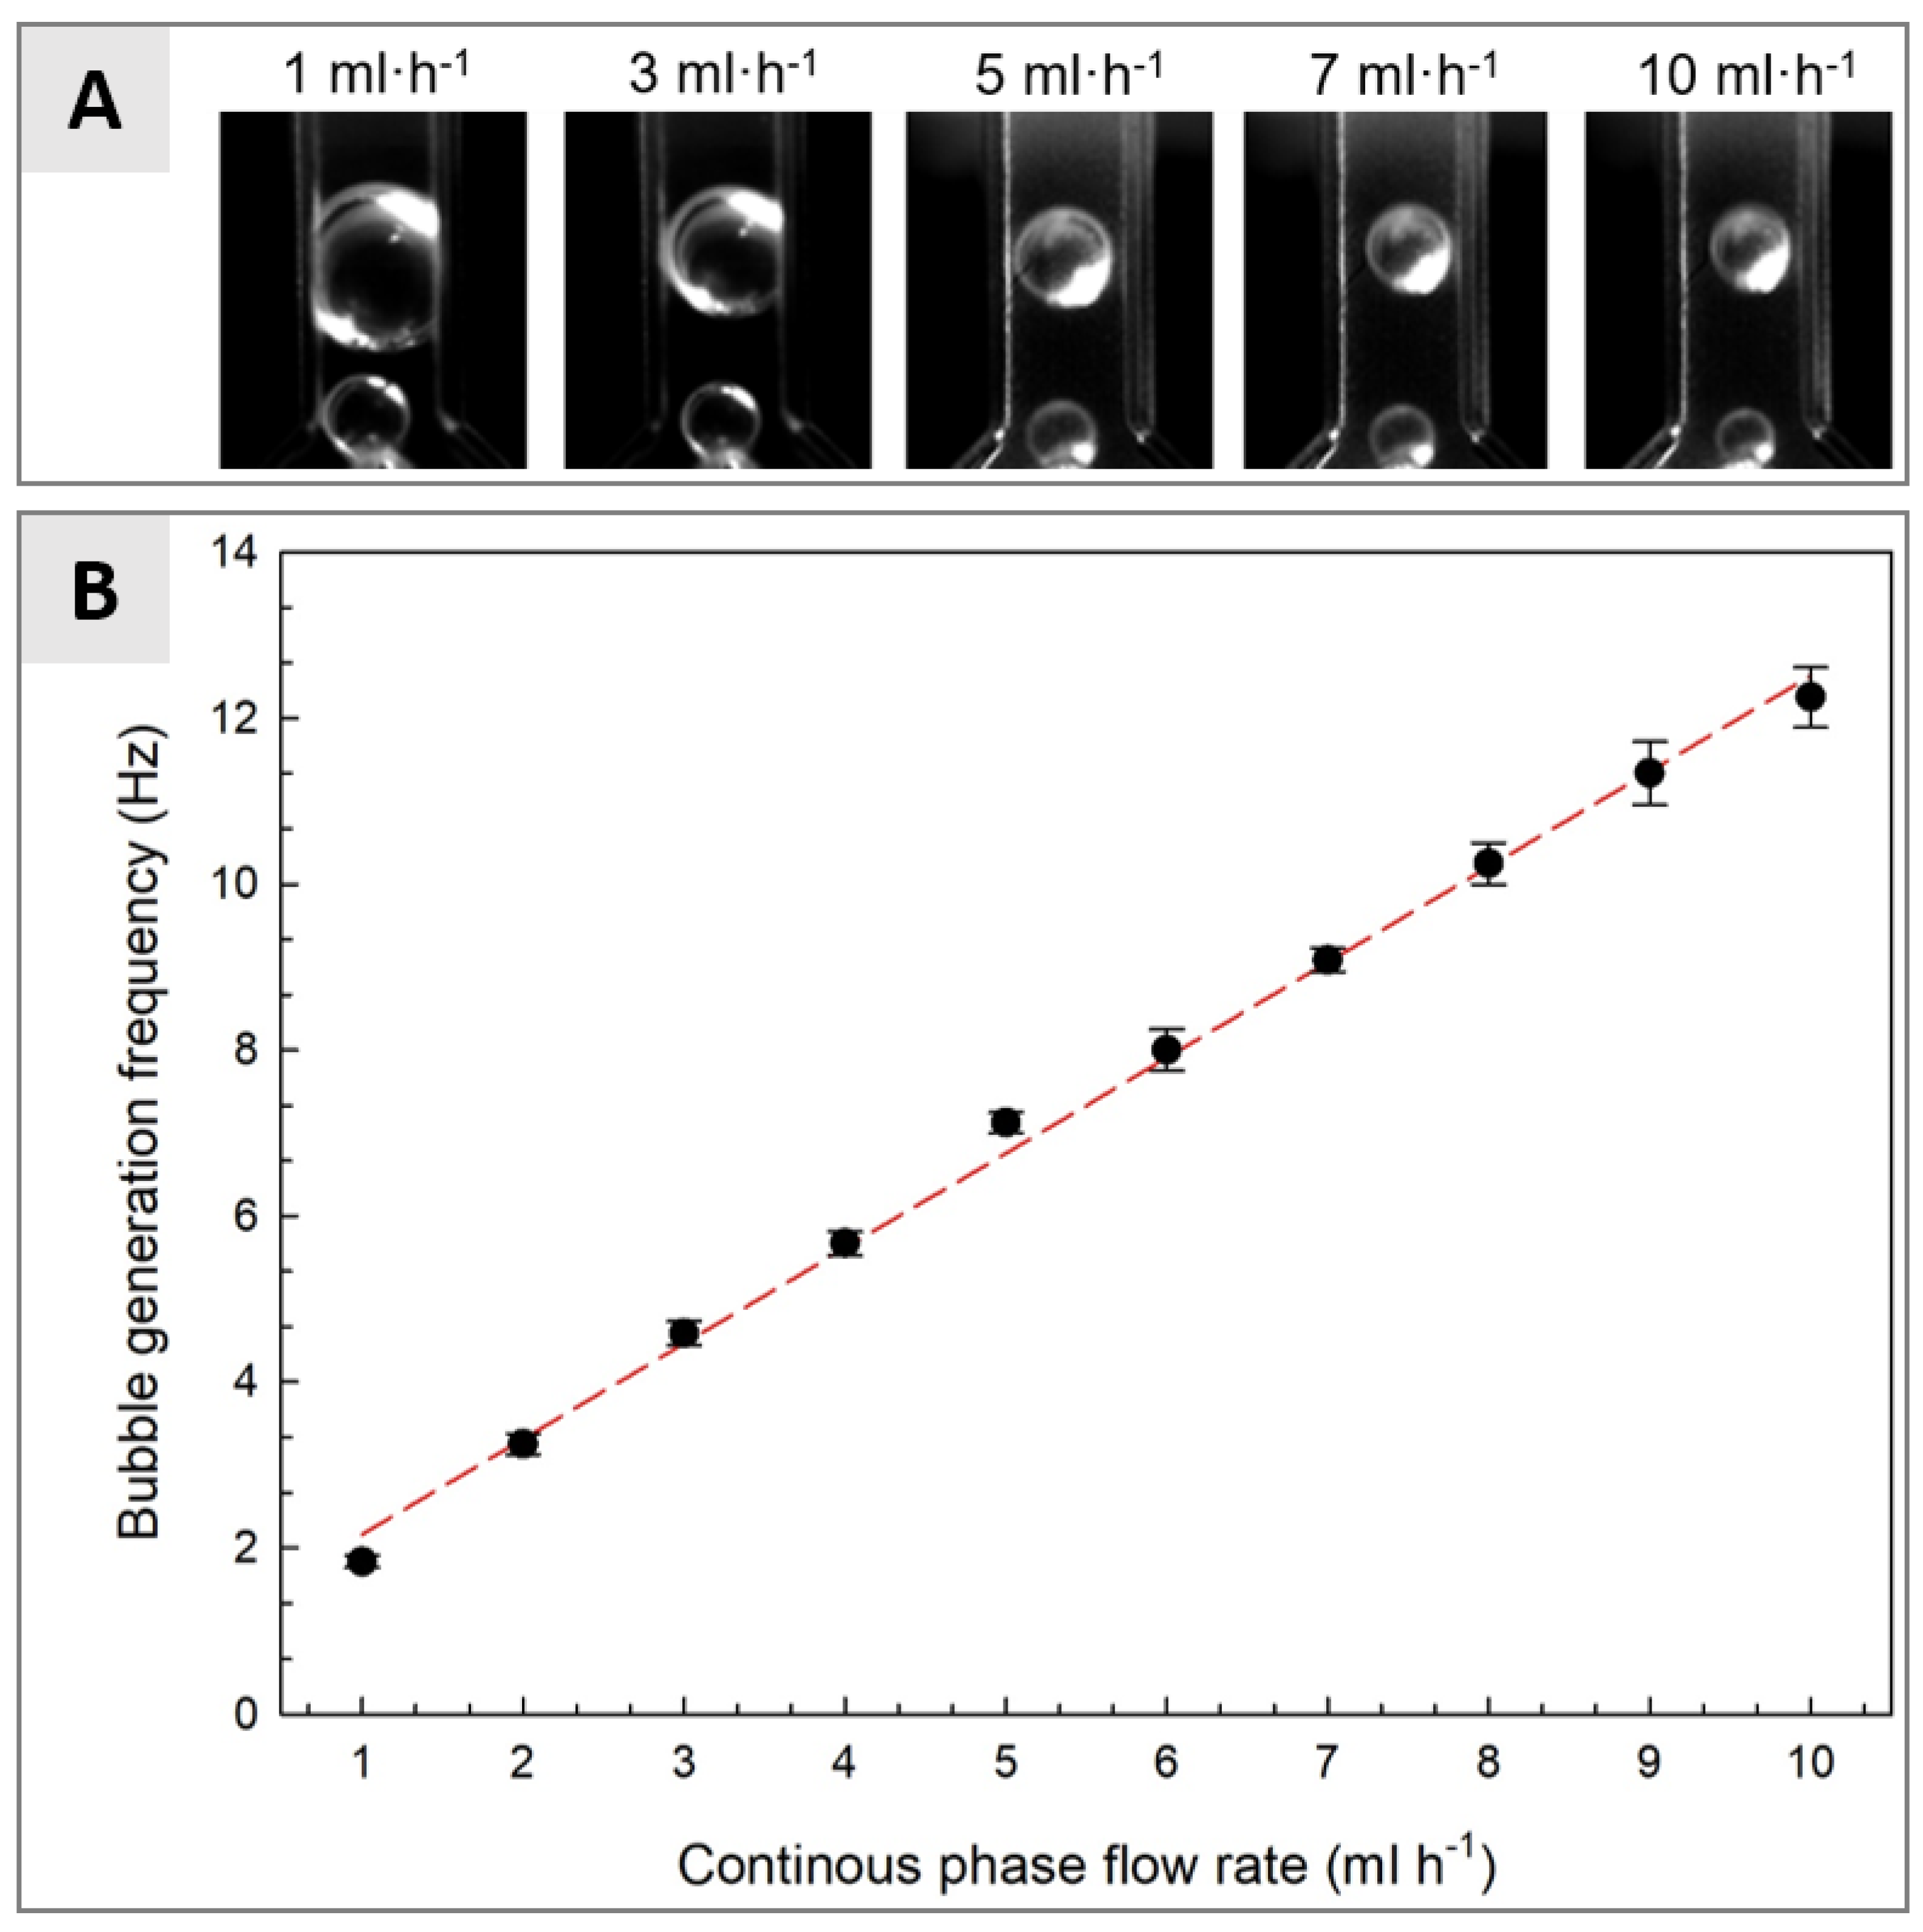
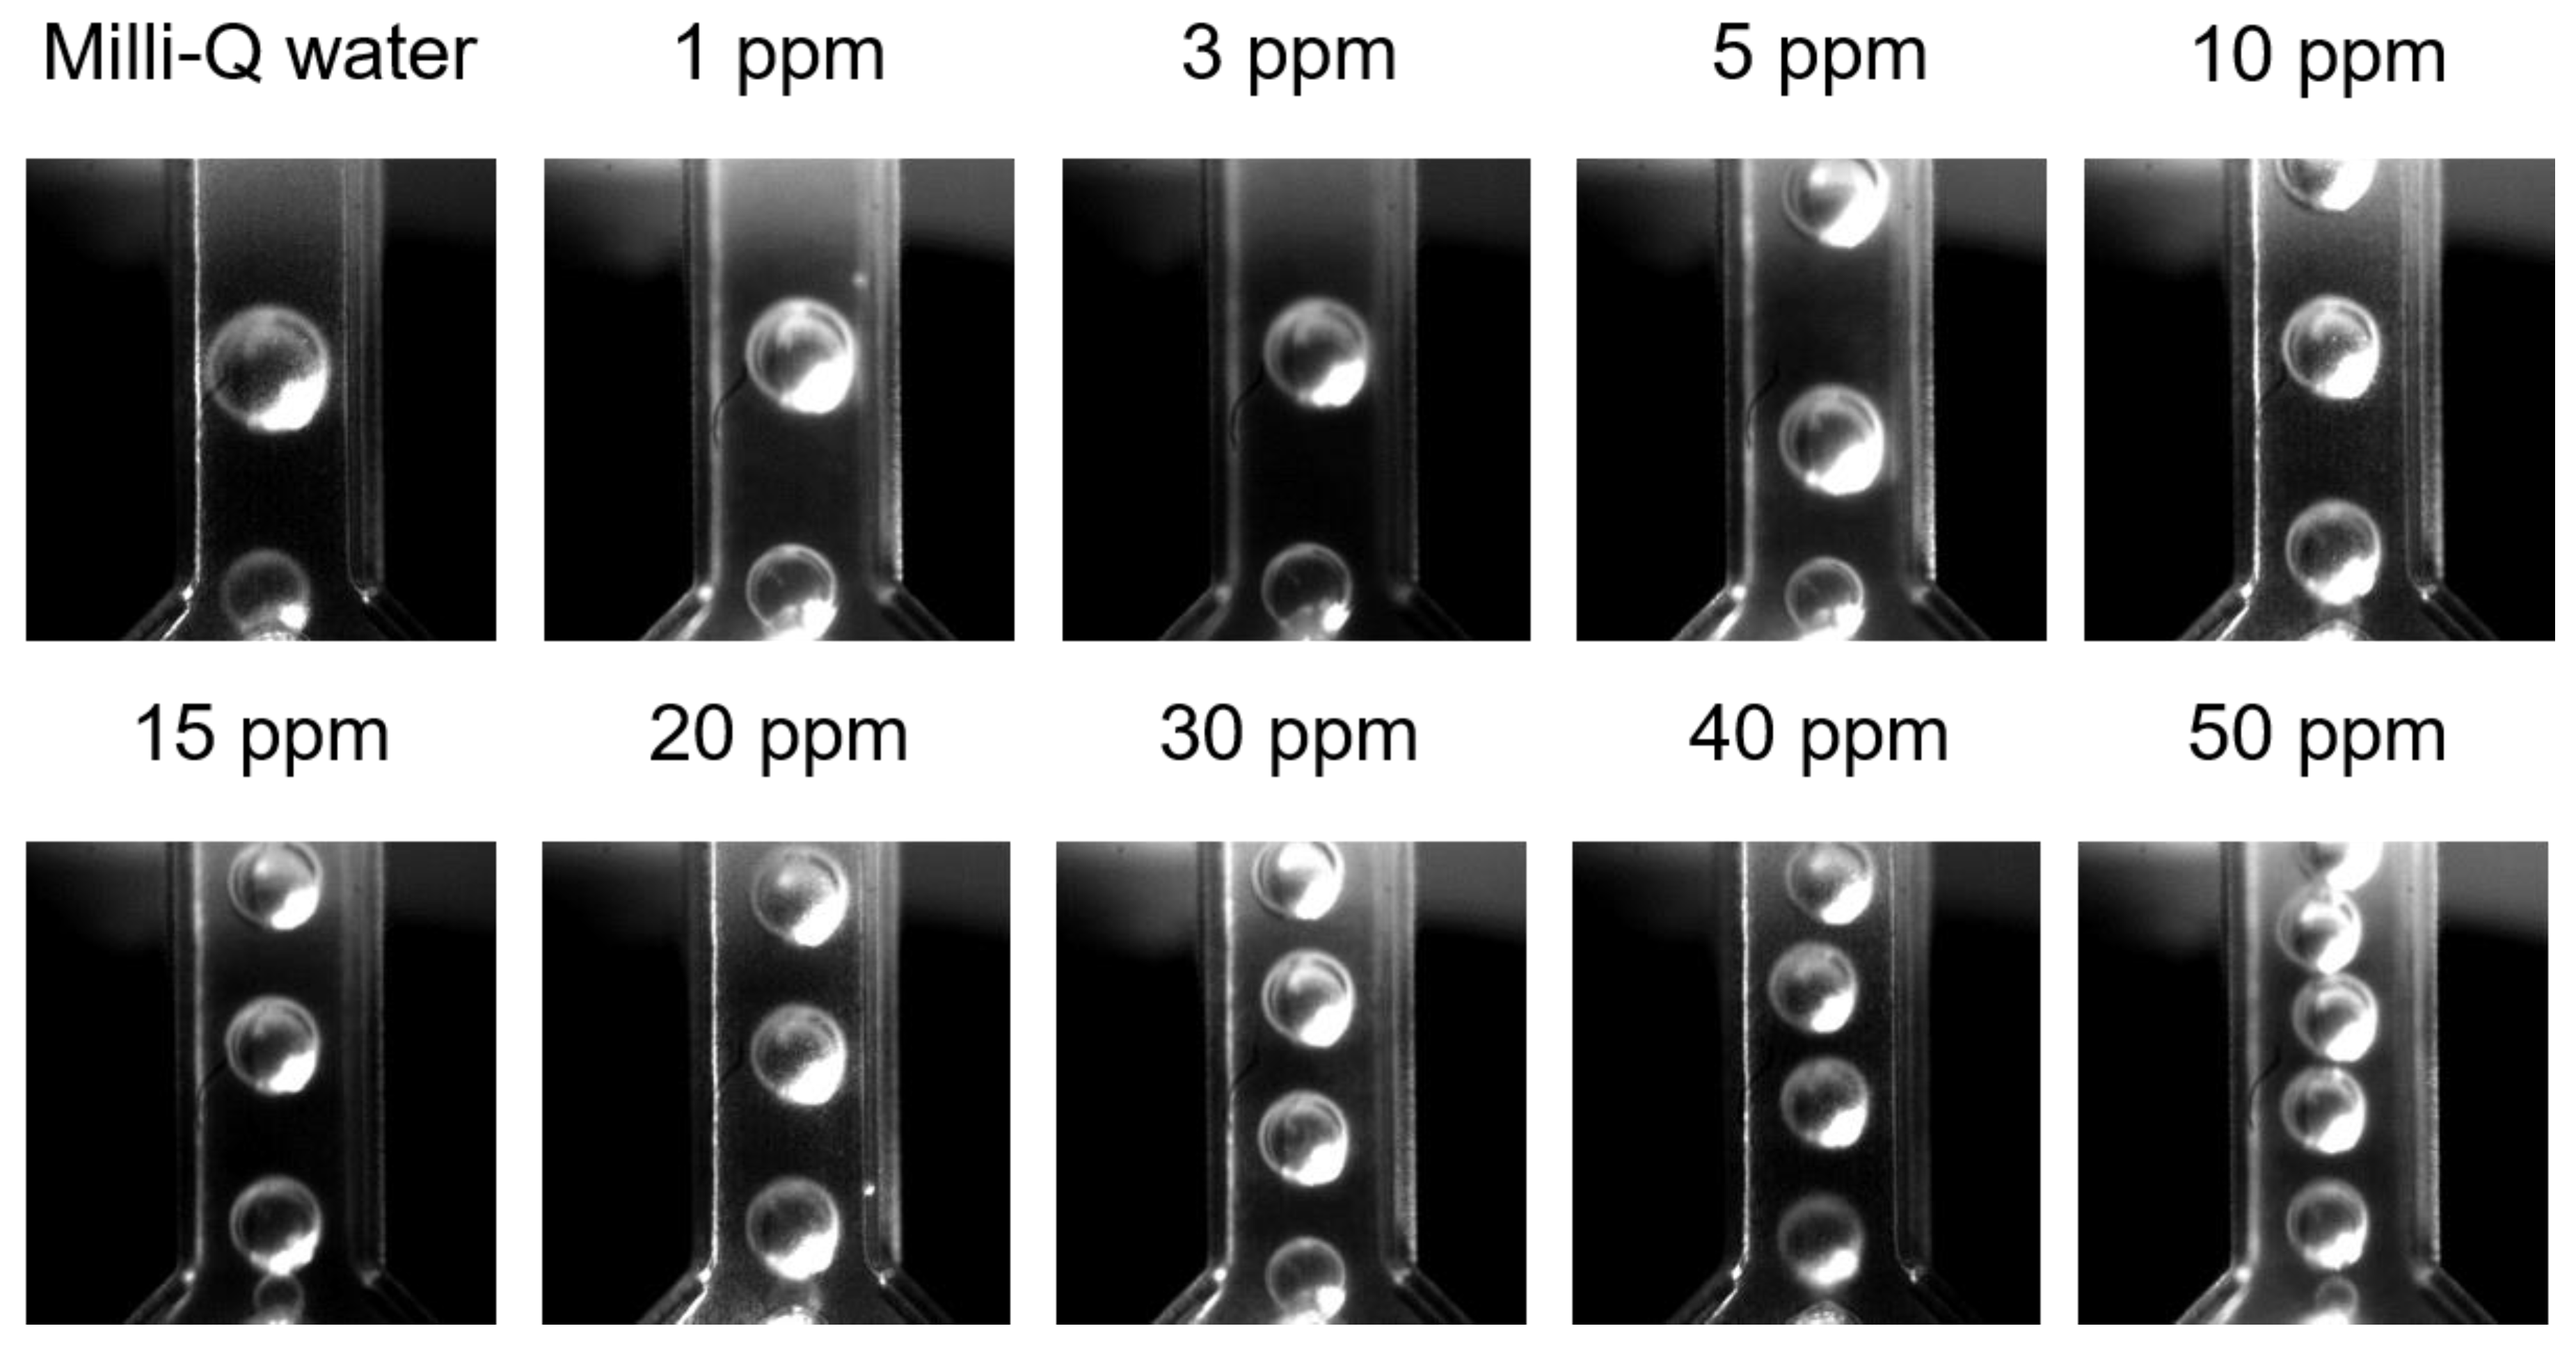
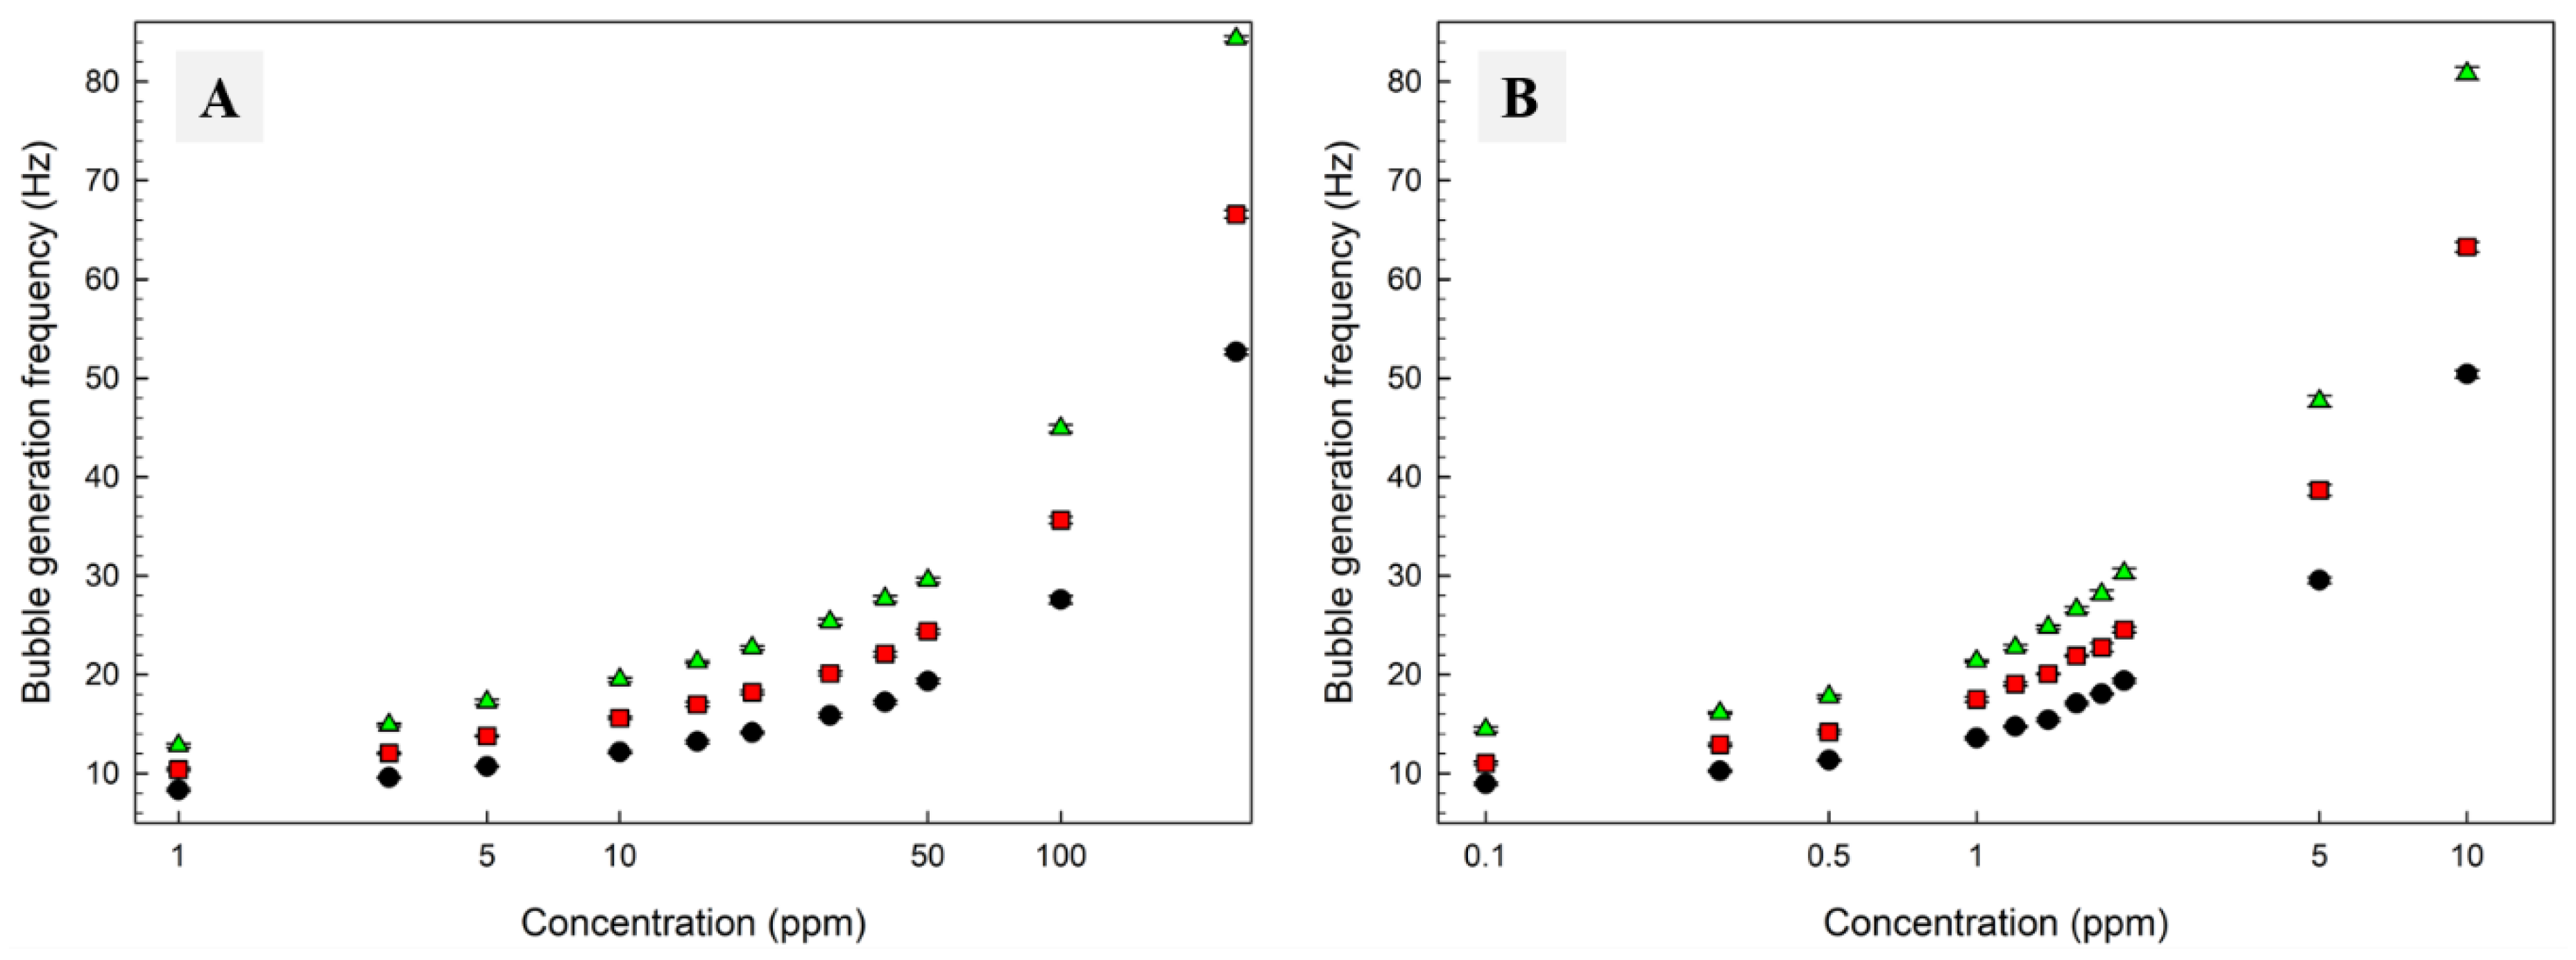
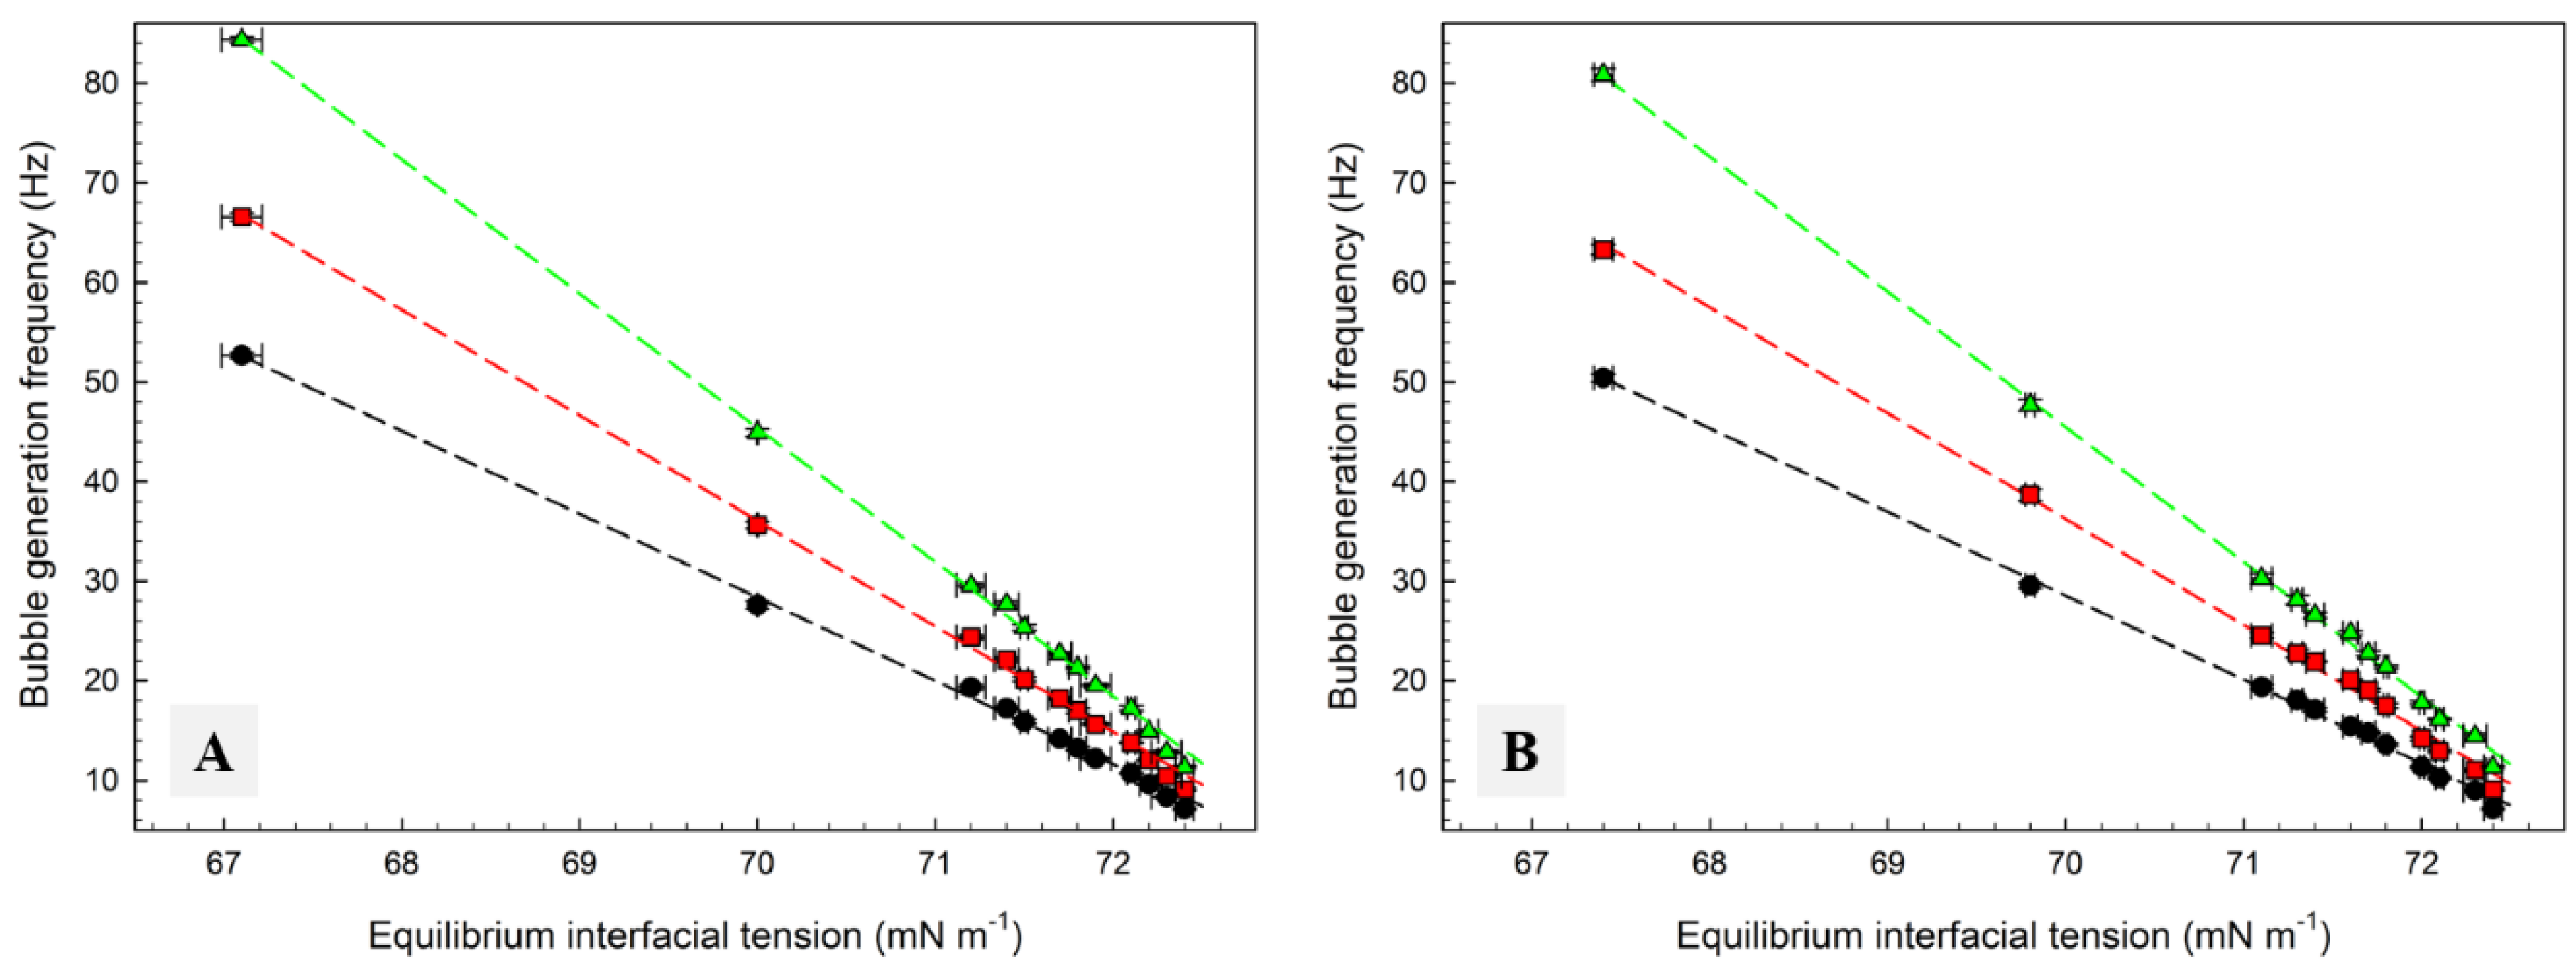
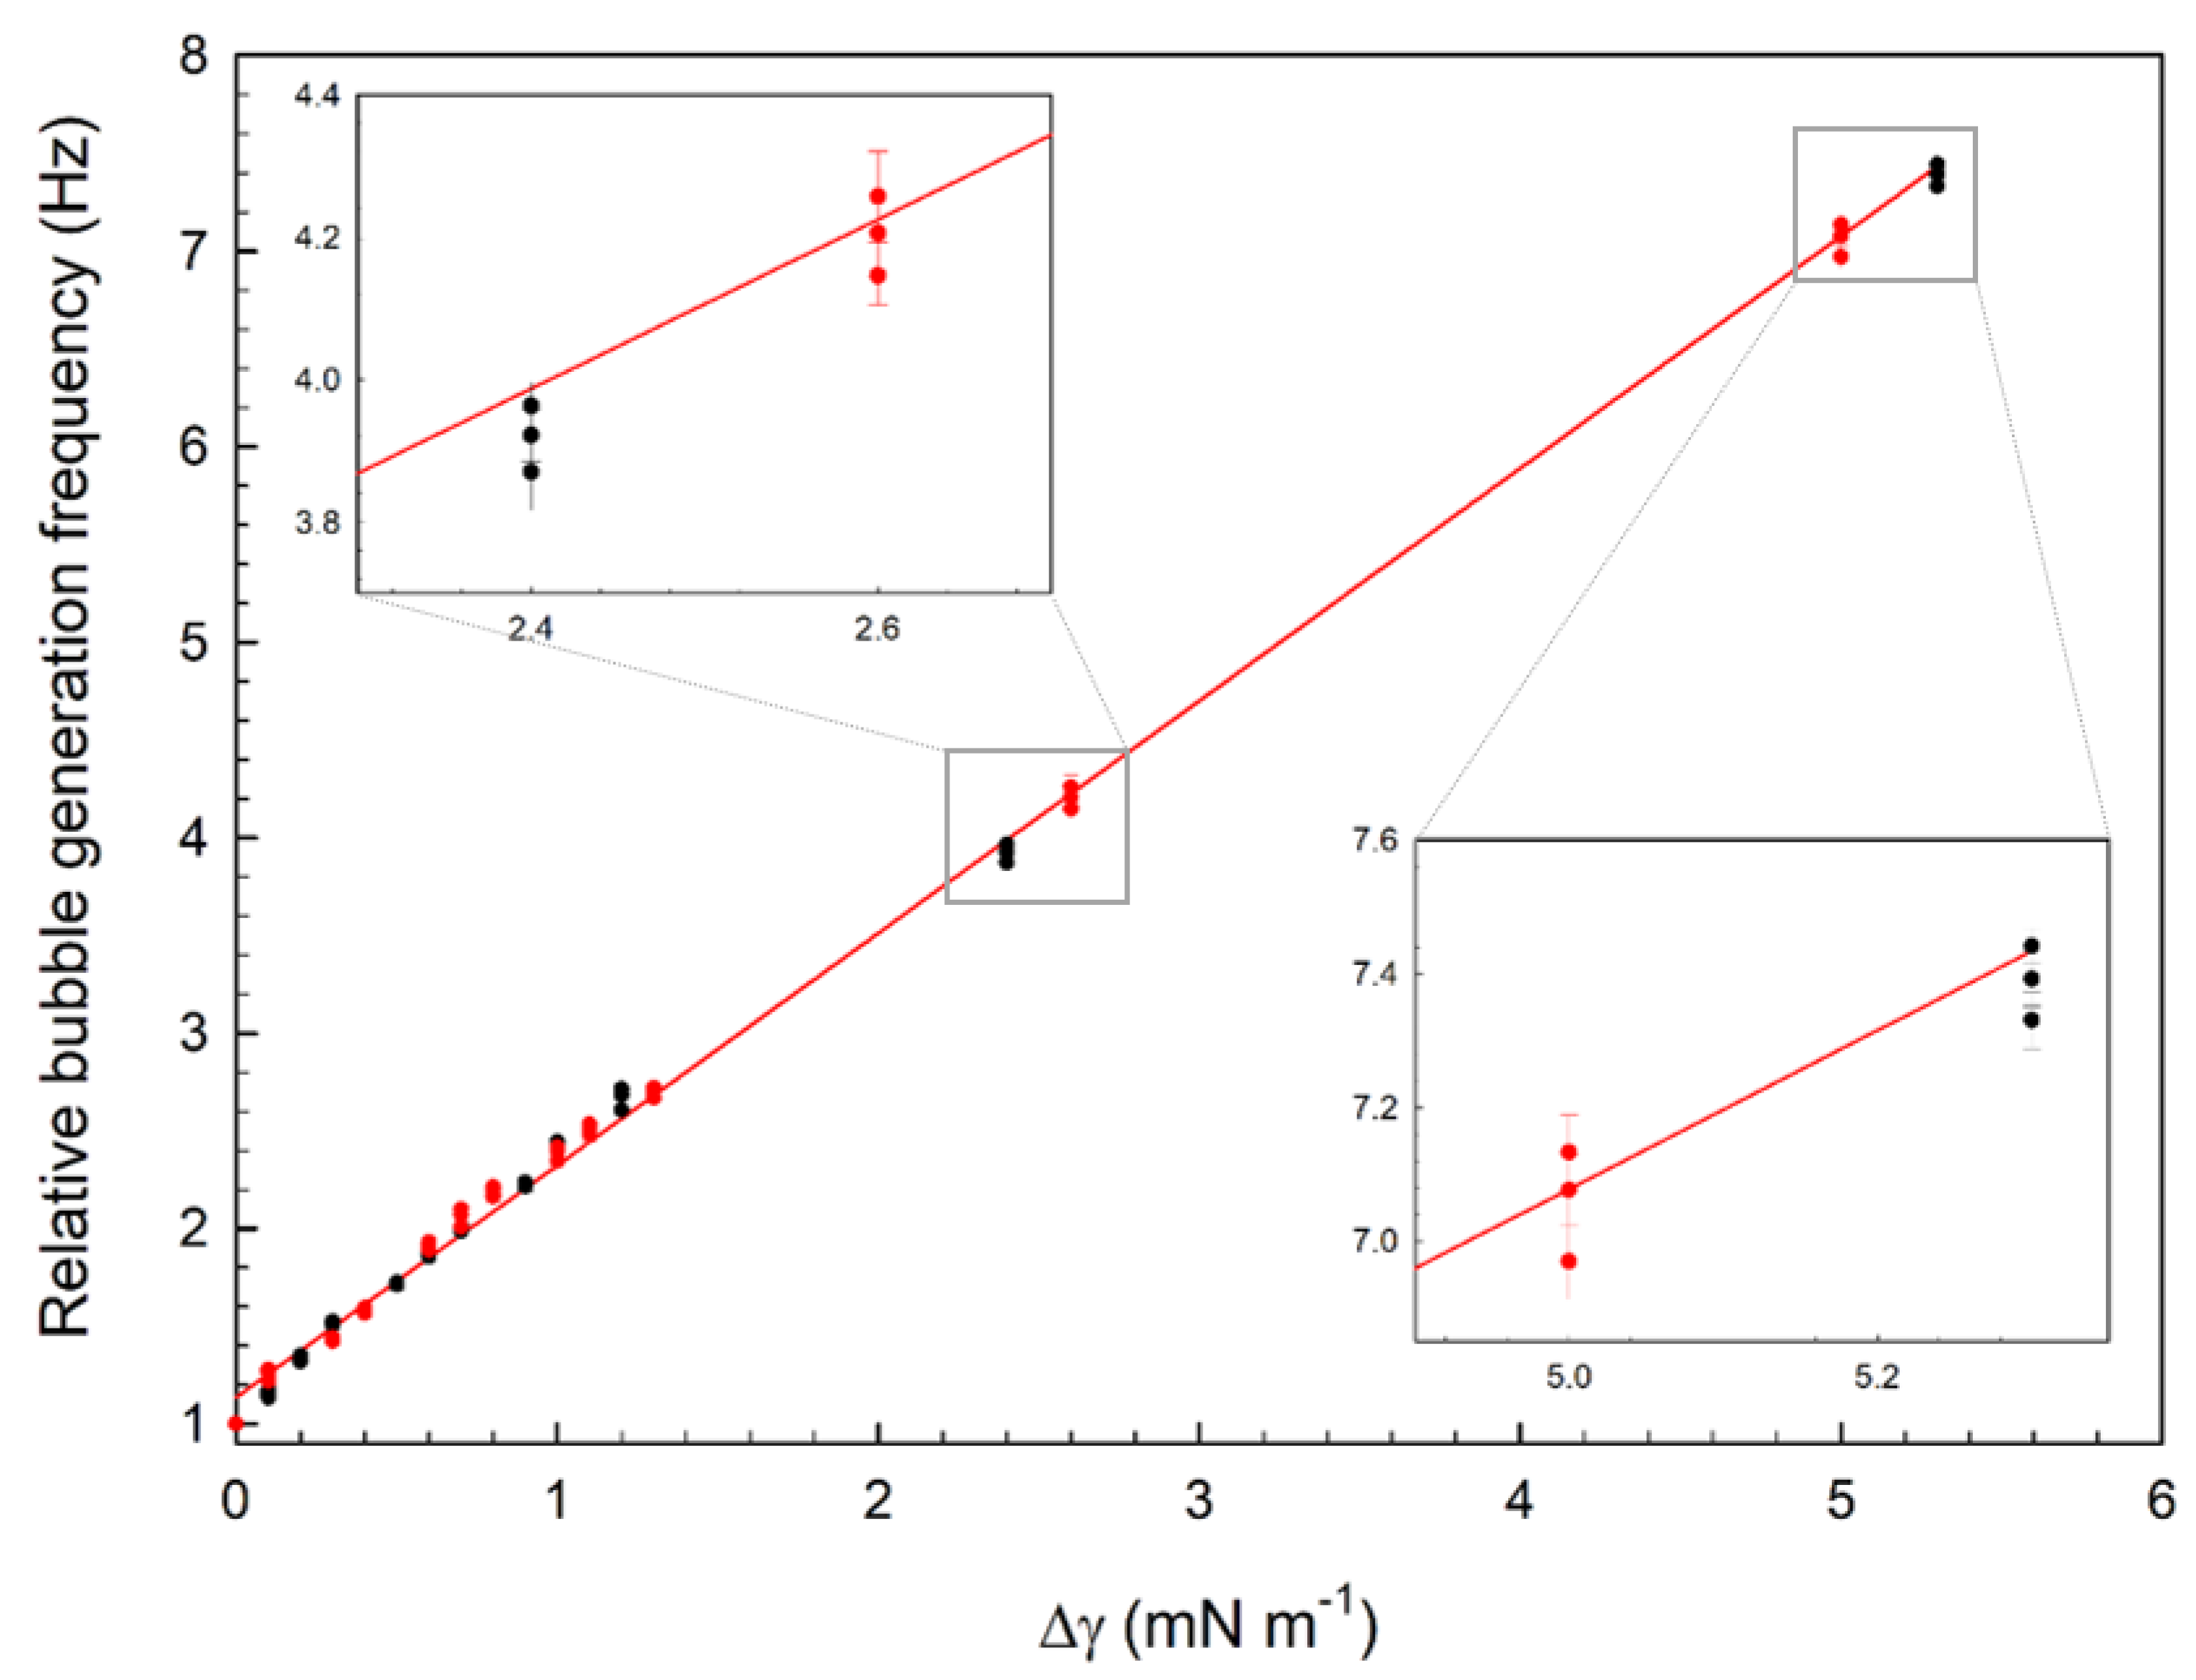
3.2. Microfluidic Determination of Interfacial Tension
4. Conclusions
Author Contributions
Funding
Institutional Review Board Statement
Data Availability Statement
Acknowledgments
Conflicts of Interest
References
- Malysa, K.; Zawala, J.; Krzan, M.; Krasowska, M. Bubbles rising in solutions; local and terminal velocities, shape variations and collisions with free surface. In Bubble and Drop Interfaces; Brill: Boston, MA, USA, 2011; pp. 251–300. [Google Scholar]
- Liu, B.; Manica, R.; Xu, Z.; Liu, Q. The boundary condition at the air-liquid interface and its effect on film drainage between colliding bubbles. Curr. Opin. Colloid Interface Sci. 2020. [Google Scholar] [CrossRef]
- Krasowska, M.; Malysa, K.; Beattie, D.A. Recent advances in studies of bubble-solid interactions and wetting film stability. Curr. Opin. Colloid Interface Sci. 2019, 44, 48–58. [Google Scholar] [CrossRef]
- Liu, B.; Manica, R.; Liu, Q.; Klaseboer, E.; Xu, Z.; Xie, G. Coalescence of bubbles with mobile interfaces in water. Phys. Rev. Lett. 2019, 122, 194501. [Google Scholar] [CrossRef] [PubMed]
- Pawliszak, P.; Ulaganathan, V.; Bradshaw-Hajek, B.H.; Manica, R.; Beattie, D.A.; Krasowska, M. Mobile or immobile? Rise velocity of air bubbles in high-purity water. J. Phys. Chem. C 2019, 123, 15131–15138. [Google Scholar] [CrossRef]
- Carnie, S.L.; Del Castillo, L.; Horn, R.G. Mobile surface charge can immobilize the air/water interface. Langmuir 2019, 35, 16043–16052. [Google Scholar] [CrossRef] [PubMed]
- Vakarelski, I.U.; Lee, J.; Dagastine, R.R.; Chan, D.Y.; Stevens, G.W.; Grieser, F. Bubble colloidal AFM probes formed from ultrasonically generated bubbles. Langmuir 2008, 24, 603–605. [Google Scholar] [CrossRef] [PubMed]
- Zawala, J.; Niecikowska, A. “Bubble-on-demand” generator with precise adsorption time control. Rev. Sci. Instrum. 2017, 88, 095106. [Google Scholar] [CrossRef] [PubMed]
- Malysa, K.; Krasowska, M.; Krzan, M. Influence of surface active substances on bubble motion and collision with various interfaces. Adv. Colloid Interface Sci. 2005, 114, 205–225. [Google Scholar] [CrossRef]
- Vakarelski, I.U.; Yang, F.; Thoroddsen, S.T. Free-rising bubbles bounce stronger from mobile than immobile water-air interfaces. Langmuir 2020, 36, 5908–5918. [Google Scholar] [CrossRef] [PubMed]
- Wills, B.A.; Finch, J.A. Chapter 12—Froth Flotation. In Wills’ Mineral Processing Technology (Eighth Edition); Wills, B.A., Finch, J.A., Eds.; Butterworth-Heinemann: Boston, MA, USA, 2016; pp. 265–380. [Google Scholar]
- Pawliszak, P.; Zawala, J.; Ulaganathan, V.; Ferri, J.K.; Beattie, D.A.; Krasowska, M. Interfacial characterisation for flotation: 2. Air-water interface. Curr. Opin. Colloid Interface Sci. 2018, 37, 115–127. [Google Scholar] [CrossRef]
- Krasowska, M.; Zawala, J.; Bradshaw-Hajek, B.H.; Ferri, J.K.; Beattie, D.A. Interfacial characterisation for flotation: 1. Solid-liquid interface. Curr. Opin. Colloid Interface Sci. 2018, 37, 61–73. [Google Scholar] [CrossRef]
- Pearse, M. An overview of the use of chemical reagents in mineral processing. Miner. Eng. 2005, 18, 139–149. [Google Scholar] [CrossRef]
- Gupta, A.K.; Banerjee, P.; Mishra, A. Effect of frothers on foamability, foam stability, and bubble size. Coal Prep. 2007, 27, 107–125. [Google Scholar] [CrossRef]
- Gupta, A.K.; Banerjee, P.; Mishra, A.; Satish, P. Effect of alcohol and polyglycol ether frothers on foam stability, bubble size and coal flotation. Int. J. Miner. Process. 2007, 82, 126–137. [Google Scholar] [CrossRef]
- Harvey, P.; Nguyen, A.; Jameson, G.; Evans, G. Influence of sodium dodecyl sulphate and Dowfroth frothers on froth stability. Miner. Eng. 2005, 18, 311–315. [Google Scholar] [CrossRef]
- Jávor, Z.; Schreithofer, N.; Heiskanen, K. Micro- and nano-scale phenomena effect on bubble size in mechanical flotation cell. Miner. Eng. 2015, 70, 109–118. [Google Scholar]
- Nguyen, A.V.; Phan, C.M.; Evans, G.M. Effect of the bubble size on the dynamic adsorption of frothers and collectors in flotation. Int. J. Miner. Process. 2006, 79, 18–26. [Google Scholar] [CrossRef]
- Qu, X.; Wang, L.; Karakashev, S.I.; Nguyen, A.V. Anomalous thickness variation of the foam films stabilized by weak non-ionic surfactants. J. Colloid Interface Sci. 2009, 337, 538–547. [Google Scholar] [CrossRef]
- Jávor, Z.; Schreithofer, N.; Heiskanen, K. Multi-scale analysis of the effect of surfactants on bubble properties. Miner. Eng. 2016, 99, 170–178. [Google Scholar]
- Le, T.N.; Phan, C.M.; Nguyen, A.V.; Ang, H.M. An unusual synergistic adsorption of MIBC and CTAB mixtures at the air-water interface. Miner. Eng. 2012, 39, 255–261. [Google Scholar] [CrossRef]
- Fong, C.; Greaves, T.L.; Healy, T.W.; Drummond, C.J. The effect of structural modifications on the solution and interfacial properties of straight and branched aliphatic alcohols: The role of hydrophobic effects. J. Colloid Interface Sci. 2015, 449, 364–372. [Google Scholar] [CrossRef] [PubMed]
- Jávor, Z.; Schreithofer, N.; Heiskanen, K. Validity of critical coalescence concentration in dynamic conditions. Int. J. Miner. Process. 2014, 127, 16–22. [Google Scholar]
- Bremond, N.; Bibette, J. Exploring emulsion science with microfluidics. Soft Matter 2012, 8, 10549–10559. [Google Scholar] [CrossRef]
- Stone, H.A.; Stroock, A.D.; Ajdari, A. Engineering flows in small devices: Microfluidics toward a lab-on-a-chip. Annu. Rev. Fluid Mech. 2004, 36, 381–411. [Google Scholar] [CrossRef] [Green Version]
- Jakiela, S.; Korczyk, P.M.; Makulska, S.; Cybulski, O.; Garstecki, P. Discontinuous transition in a laminar fluid flow: A change of flow topology inside a droplet moving in a micron-size channel. Phys. Rev. Lett. 2012, 108, 134501. [Google Scholar] [CrossRef]
- Mazutis, L.; Griffiths, A.D. Selective droplet coalescence using microfluidic systems. Lab A Chip 2012, 12, 1800–1806. [Google Scholar] [CrossRef]
- Baret, J.-C. Surfactants in droplet-based microfluidics. Lab Chip 2012, 12, 422–433. [Google Scholar] [CrossRef]
- D’Apolito, R.; Perazzo, A.; D’Antuono, M.; Preziosi, V.; Tomaiuolo, G.; Miller, R.; Guido, S. Measuring interfacial tension of emulsions in situ by microfluidics. Langmuir 2018, 34, 4991–4997. [Google Scholar]
- Xu, J.; Li, S.; Tan, J.; Wang, Y.; Luo, G. Preparation of highly monodisperse droplet in a T-junction microfluidic device. AIChE J. 2006, 52, 3005–3010. [Google Scholar] [CrossRef]
- Nunes, J.; Tsai, S.; Wan, J.; Stone, H.A. Dripping and jetting in microfluidic multiphase flows applied to particle and fibre synthesis. J. Phys. D Appl. Phys. 2013, 46, 114002. [Google Scholar] [CrossRef]
- Anna, S.L.; Bontoux, N.; Stone, H.A. Formation of dispersions using “flow focusing” in microchannels. Appl. Phys. Lett. 2003, 82, 364–366. [Google Scholar] [CrossRef]
- Xiong, R.; Bai, M.; Chung, J.N. Formation of bubbles in a simple co-flowing micro-channel. J. Micromech. Microeng. 2007, 17, 1002. [Google Scholar] [CrossRef]
- Zhou, H.; Yao, Y.; Chen, Q.; Li, G.; Yao, S. A facile microfluidic strategy for measuring interfacial tension. Appl. Phys. Lett. 2013, 103, 234102. [Google Scholar] [CrossRef]
- Gu, H.; Duits, M.H.G.; Mugele, F. Interfacial tension measurements with microfluidic tapered channels. Colloids Surf. A Physicochem. Eng. Asp. 2011, 389, 38–42. [Google Scholar] [CrossRef]
- Parhizkar, M.; Edirisinghe, M.; Stride, E. The effect of surfactant type and concentration on the size and stability of microbubbles produced in a capillary embedded T-junction device. RSC Adv. 2015, 5, 10751–10762. [Google Scholar] [CrossRef]
- Lee, D.; Fang, C.; Ravan, A.S.; Fuller, G.G.; Shen, A.Q. Temperature controlled tensiometry using droplet microfluidics. Lab A Chip 2017, 17, 717–726. [Google Scholar] [CrossRef] [PubMed]
- Xu, J.H.; Dong, P.F.; Zhao, H.; Tostado, C.P.; Luo, G.S. The Dynamic Effects of Surfactants on Droplet Formation in Coaxial Microfluidic Devices. Langmuir 2012, 28, 9250–9258. [Google Scholar] [CrossRef]
- Nguyen, N.-T.; Lassemono, S.; Chollet, F.A. Optical detection for droplet size control in microfluidic droplet-based analysis systems. Sens. Actuators B: Chem. 2006, 117, 431–436. [Google Scholar] [CrossRef]
- Schneider, C.A.; Rasband, W.S.; Eliceiri, K.W. NIH Image to ImageJ: 25 years of image analysis. Nat. Methods 2012, 9, 671–675. [Google Scholar] [CrossRef]
- Le, T.N.; Phan, C.M.; Ang, H.M. Influence of hydrophobic tail on the adsorption of isomeric alcohols at air/water interface. Asia-Pac. J. Chem. Eng. 2012, 7, 250–255. [Google Scholar] [CrossRef]
- Fainerman, V.B.; Miller, R. Dynamic Surface Tension Measurements in the Sub-millisecond Range. J. Colloid Interface Sci. 1995, 175, 118–121. [Google Scholar] [CrossRef]
- Finch, J.A.; Zhang, W. Frother function–structure relationship: Dependence of CCC95 on HLB and the H-ratio. Miner. Eng. 2014, 61, 1–8. [Google Scholar] [CrossRef]
- Utada, A.S.; Fernandez-Nieves, A.; Stone, H.A.; Weitz, D.A. Dripping to Jetting Transitions in Coflowing Liquid Streams. Phys. Rev. Lett. 2007, 99, 094502. [Google Scholar] [CrossRef] [PubMed]
- van Hoeve, W.; Dollet, B.; Gordillo, J.M.; Versluis, M.; van Wijngaarden, L.; Lohse, D. Bubble size prediction in co-flowing streams. EPL (Europhys. Lett.) 2011, 94, 64001. [Google Scholar] [CrossRef]
- Zhang, J.M.; Li, E.Q.; Thoroddsen, S.T. A co-flow-focusing monodisperse microbubble generator. J. Micromech. Microeng. 2014, 24, 035008. [Google Scholar] [CrossRef]
- Nguyen, N.-T.; Lassemono, S.; Chollet, F.; Yang, C. Microfluidic sensor for dynamic surface tension measurement. IEE Proc. Nanobiotechnol. 2006, 153, 102–106. [Google Scholar] [CrossRef]
- Nguyen, N.; Lassemono, S.; Chollet, F.A.; Yang, C. Interfacial Tension Measurement With an Optofluidic Sensor. IEEE Sens. J. 2007, 7, 692–697. [Google Scholar] [CrossRef] [Green Version]


Publisher’s Note: MDPI stays neutral with regard to jurisdictional claims in published maps and institutional affiliations. |
© 2021 by the authors. Licensee MDPI, Basel, Switzerland. This article is an open access article distributed under the terms and conditions of the Creative Commons Attribution (CC BY) license (http://creativecommons.org/licenses/by/4.0/).
Share and Cite
Pawliszak, P.; Bradshaw-Hajek, B.H.; Greet, C.; Skinner, W.; Beattie, D.A.; Krasowska, M. Interfacial Tension Sensor for Low Dosage Surfactant Detection. Colloids Interfaces 2021, 5, 9. https://0-doi-org.brum.beds.ac.uk/10.3390/colloids5010009
Pawliszak P, Bradshaw-Hajek BH, Greet C, Skinner W, Beattie DA, Krasowska M. Interfacial Tension Sensor for Low Dosage Surfactant Detection. Colloids and Interfaces. 2021; 5(1):9. https://0-doi-org.brum.beds.ac.uk/10.3390/colloids5010009
Chicago/Turabian StylePawliszak, Piotr, Bronwyn H. Bradshaw-Hajek, Christopher Greet, William Skinner, David A. Beattie, and Marta Krasowska. 2021. "Interfacial Tension Sensor for Low Dosage Surfactant Detection" Colloids and Interfaces 5, no. 1: 9. https://0-doi-org.brum.beds.ac.uk/10.3390/colloids5010009