1. Introduction
Surfactants are applied almost everywhere in our life. Many technologies are even specifically based on the action of surface-active molecules. Surfactants are generally well studied, and the properties of their adsorption layers are quantitatively determined (see, for example, [
1,
2,
3]). As the first and essential properties required to compare surfactants with each other and to find the optimum surfactant for a certain application, the adsorption isotherm and equation of state are used. In many cases, the analysis of available experimental data (such as dynamic and equilibrium surface tensions, adsorption, and limiting dilational viscoelasticity) is made on the basis of the classical adsorption models of Langmuir [
4] or Frumkin [
5]. However, these most frequently applied models do not always provide a satisfactory description of the measured results.
More than 25 years ago, the first idea of the so-called reorientation model was published, based on the principle of Braun–Le Chatelier as proposed by Joos for interfaces [
6]. In its initial version [
7], the model proposes that surfactant molecules can adsorb in two states, occupying a maximum or minimum molar area at the interface. At an empty interface or at relatively low coverage, more adsorbed molecules possess maximum molar area. As a simple picture, one can assume that these molecules lay flat at the interface. The minimum molar area is, however, occupied by molecules in a tightly packed adsorption layer. Here, we can simplify this situation by assuming that the adsorbed surfactant molecules are oriented perpendicular to the interface. Between the two extreme cases of either an empty or a fully packed interfacial layer, the adsorbed molecules coexist in the two considered adsorption states. According to the principle of Braun–Le Chatelier, with increasing surface coverage, the number of molecules in the state of minimum molar area increases at the expense of those molecules requiring the maximum molar area. After its formulation, many other authors used and discussed the idea of orientation changes of surfactant molecules at liquid interfaces [
8,
9,
10]. In particular, for surfactants with a poly (ethylenoxide) headgroup, the reorientation model was successfully applied for the analysis of experimental surface tension data [
11,
12].
The state-of-the-art of the reorientation model was summarised and systematically applied to various adsorption data for surfactants of the type C
mEO
n, i.e., of poly (oxyethylene) alkyl ether, at the water/air interface in [
13,
14]. The authors have shown that the reorientation model describes the adsorption behaviour very well for all those surfactants, which have a rather large head group and only weak molecular interactions between the adsorbed molecules. In contrast, the Frumkin adsorption model [
5] much better describes adsorption layers comprised of surfactant molecules with strong mutual interaction.
For many applications, good knowledge on the dynamic interfacial properties is required. The adsorption model, which describes best the equilibrium adsorption layer state, strongly influenced the analysis of such data. First discussions of the impact of the reorientation model on dynamic interfacial tension data were made in [
7]. A later performed broad discussion of possible orientation mechanisms was presented in [
15]. In addition to dynamic interfacial tension data, the interfacial dilational visco-elasticity of adsorbed surfactants also requires an appropriate equation of state to adequately describe the experimental data [
16,
17,
18].
Although the two-state reorientation model describes the adsorption layers of C
nEO
m best, the most recent systematic work on C
10EO
5, C
10EO
8, C
12EO
5, C
12EO
8, C
14EO
4, and C
14EO
8 adsorbed at the water/air interface demonstrated that there are still some open questions [
19]. While the main goal was to describe all measured dependencies (dynamic and equilibrium surface tensions and dilational surface visco-elasticity as functions of the surfactant bulk concentration) with the same set of values for the model parameters, it turned out that the adsorption kinetics required the assumption of a diffusion coefficient that decreases with time. Moreover, the visco-elastic dilational surface behaviour was only described qualitatively. These shortcomings may potentially be overcome by allowing for the existence of more than only two extreme adsorption states.
Indeed, the ethylene oxide chain is rather flexible and can allow a large variety of conformations of the C
nEO
m molecules at the interface. For example, Gilányi et al. [
20] studied poly (oxyethylene) glycols/oxides (PEG or PEO) of different molecular weight and they showed that these nominally hydrophilic polymers adsorb at the water/air interface, i.e., the EO chain is not completely hydrophilic. For short EO chains, the measured surface tension is strongly concentration-dependent, while with increasing molecular weight, the respective surface tension changes of about 10 mN/m are reached at very low concentrations and then remain almost constant. Lee at al. showed, by molecular dynamics simulations on poly (oxyethlene) glycols (PEG) and oxides (PEO), that the persistence length of the EO chain is about 0.37 nm, confirming the extreme flexibility of this chain [
21]; we studied this phenomenon experimentally in [
22]. Similar studies were performed in [
23], but mainly with the application to water/alkane interfaces. In a recent work, the authors of [
24] combined different simulation platforms, i.e., molecular dynamics and a molecular-thermodynamic theory, and provided a clear picture about the possible conformations of C
nEO
m molecules in the bulk and at the water/air interface. The simulated surface tension isotherms for C
10EO
4 and C
12EO
6 agree very well with experimental data taken from an earlier work [
25].
The aim of the present work is to extend the classical reorientation model from s = 2 to a larger number of adsorption states. This refined adsorption model, discussed here up to s = 10, will be applied for the analysis of the surface tension isotherms for C14EO4 and C14EO8 as well as the surface dilational visco-elasticity at an oscillation frequency of 0.1 Hz, all measured by bubble profile analysis tensiometry.
2. Theoretical Model
We consider here amphiphilic molecules with a hydrophilic part presented by a flexible chain comprising several segments. Owing to its flexibility, the hydrophilic chain can adopt different conformations in aqueous solutions. It is assumed here that the chain segments are not completely hydrophilic, but weakly amphiphilic, i.e., they can adsorb and desorb, while the whole molecule remains adsorbed at the interface. Thus, the molecules can be adsorbed in different states, occupying different areas at the interface. There is, obviously, a spectrum of conformational states of the hydrophilic chains, which are realized with different probabilities. It should be also obvious that adsorbed states with a larger molar area are more probable at a smaller surface coverage, when there is sufficient free space at the interface. With increasing surface coverage, some segments should desorb, increasing the number of molecules occupying smaller areas at the interface. Complex interactions of the surfactant molecules with each other and the water molecules produce significant difficulties in predicting the available configurations of the flexible hydrophilic chains within the adsorption layer. Molecular dynamics (MD) simulations of adsorbed C
nEO
m molecules at the air/water interface are the subject of future work. Here, we restrict ourselves to simplified analytical models, which could be applied to analyse the experimental data on dynamic and equilibrium surface tensions, adsorption, and dilational viscoelasticity. In what follows, these models are referred to as the multistate models and represent a further development of the two-state reorientation models discussed earlier [
18,
26].
These models assume s possible adsorbed states with minimum molar area ω
1 and maximum molar area ω
s. It is assumed that molar areas in each state except the s-th depend on the coverage of the adsorbed layer θ (and thus also on the surface pressure Π), which implies the dependence on the adsorbate concentration c. For the state with minimum molar area, the respective dependence takes the following form [
18]:
Here, ω
10 is the minimum molar area at infinite dilution (Π = 0), ε is the intrinsic compressibility coefficient, and the surface pressure Π is the difference between the surface tension of the pure solvent γ
0 and that of the solution γ. The molar area of the j-th state (1 ≤ j ≤ s) is related to that of the 1-st state and the s-th state as follows:
It is seen that, in this model, the molar area increment, i.e., the difference between the areas of two neighbouring states, does not depend on j:
thus
The assumption of constant increment simplifies the model greatly, reducing the number of the required model parameters while still preserving the most significant features of the system behaviour. The average molar area ω is determined via the total coverage θ, partial adsorption in j-th state Γ
j, and total adsorption Γ:
The equation of state of the adsorbed layer and the adsorption isotherm equation for the first model considered here (hereinafter referred to as Model R) are similar to those proposed in [
26]:
where
a is the Frumkin interaction parameter and b
j is the adsorption equilibrium coefficient (parameter) for the surfactant molecules in the j-th state, R is the gas constant, and T is absolute temperature. For the second model considered here (referred to as Model R0), the equations of state and adsorption isotherm equation are similar to those considered in [
18]:
It is seen that the equations for the two models differ from each other, depending on ω
1 or ω
10 in the equation of state, and ω or ω
10 in the adsorption isotherm equation. From the thermodynamic point of view, these changes correspond to a small shift of the dividing surface [
27].
Note that Equations (8) and (10) are in fact sets of s equations, which should be solved simultaneously with the corresponding Equations of state (7) or (9) to obtain the dependence of model variables on the surfactant concentration. To deal with this complication, an approach was proposed in our publication [
28] that assumes the dependence between the molar areas and the adsorption equilibrium coefficients:
where α is an adjustable empirical model parameter. The dependence (11) implies that the adsorption equilibrium parameters depend on the concentration via the dependence of ω
1, see Equation (1). The relation (11) makes it possible to express all s partial adsorption equilibrium parameters via the single one, which is chosen to be b
1, which, in what follows for the sake of brevity, is denoted by b. Then, Equations (1)–(4) and (11) could be solved simultaneously with Equations (7)–(10) to calculate the total adsorption value Γ. This procedure can also be applied to other surfactants that can be described by a multi-state adsorption model.
For small-amplitude surface area oscillations with a frequency f, the surface dilational visco-elasticity modulus can be measured as a ratio of the amplitudes of surface pressure and relative surface area oscillations |E|=|∆Π|/|∆
lnA|. For a diffusion-limited relaxation mechanism, it can be calculated according to the Lucassen van den Tempel (LvT) equation [
29]:
where
is the limiting elasticity,
is a frequency dependent parameter with the angular frequency
,
is the characteristic frequency of diffusion relaxation, and D is the diffusion coefficient of surfactant molecules in the solution. The concentration-dependent parameters in Equation (12), E
0(c) and ϖ
D(c), should be calculated using the set of equations presented above with the same model parameters.
The solution of model equations is explained in the
Supplementary Material; the solution procedure was implemented as separate modules for the two models defined above into the computer program IsoPlotM, employed for the calculations discussed below.
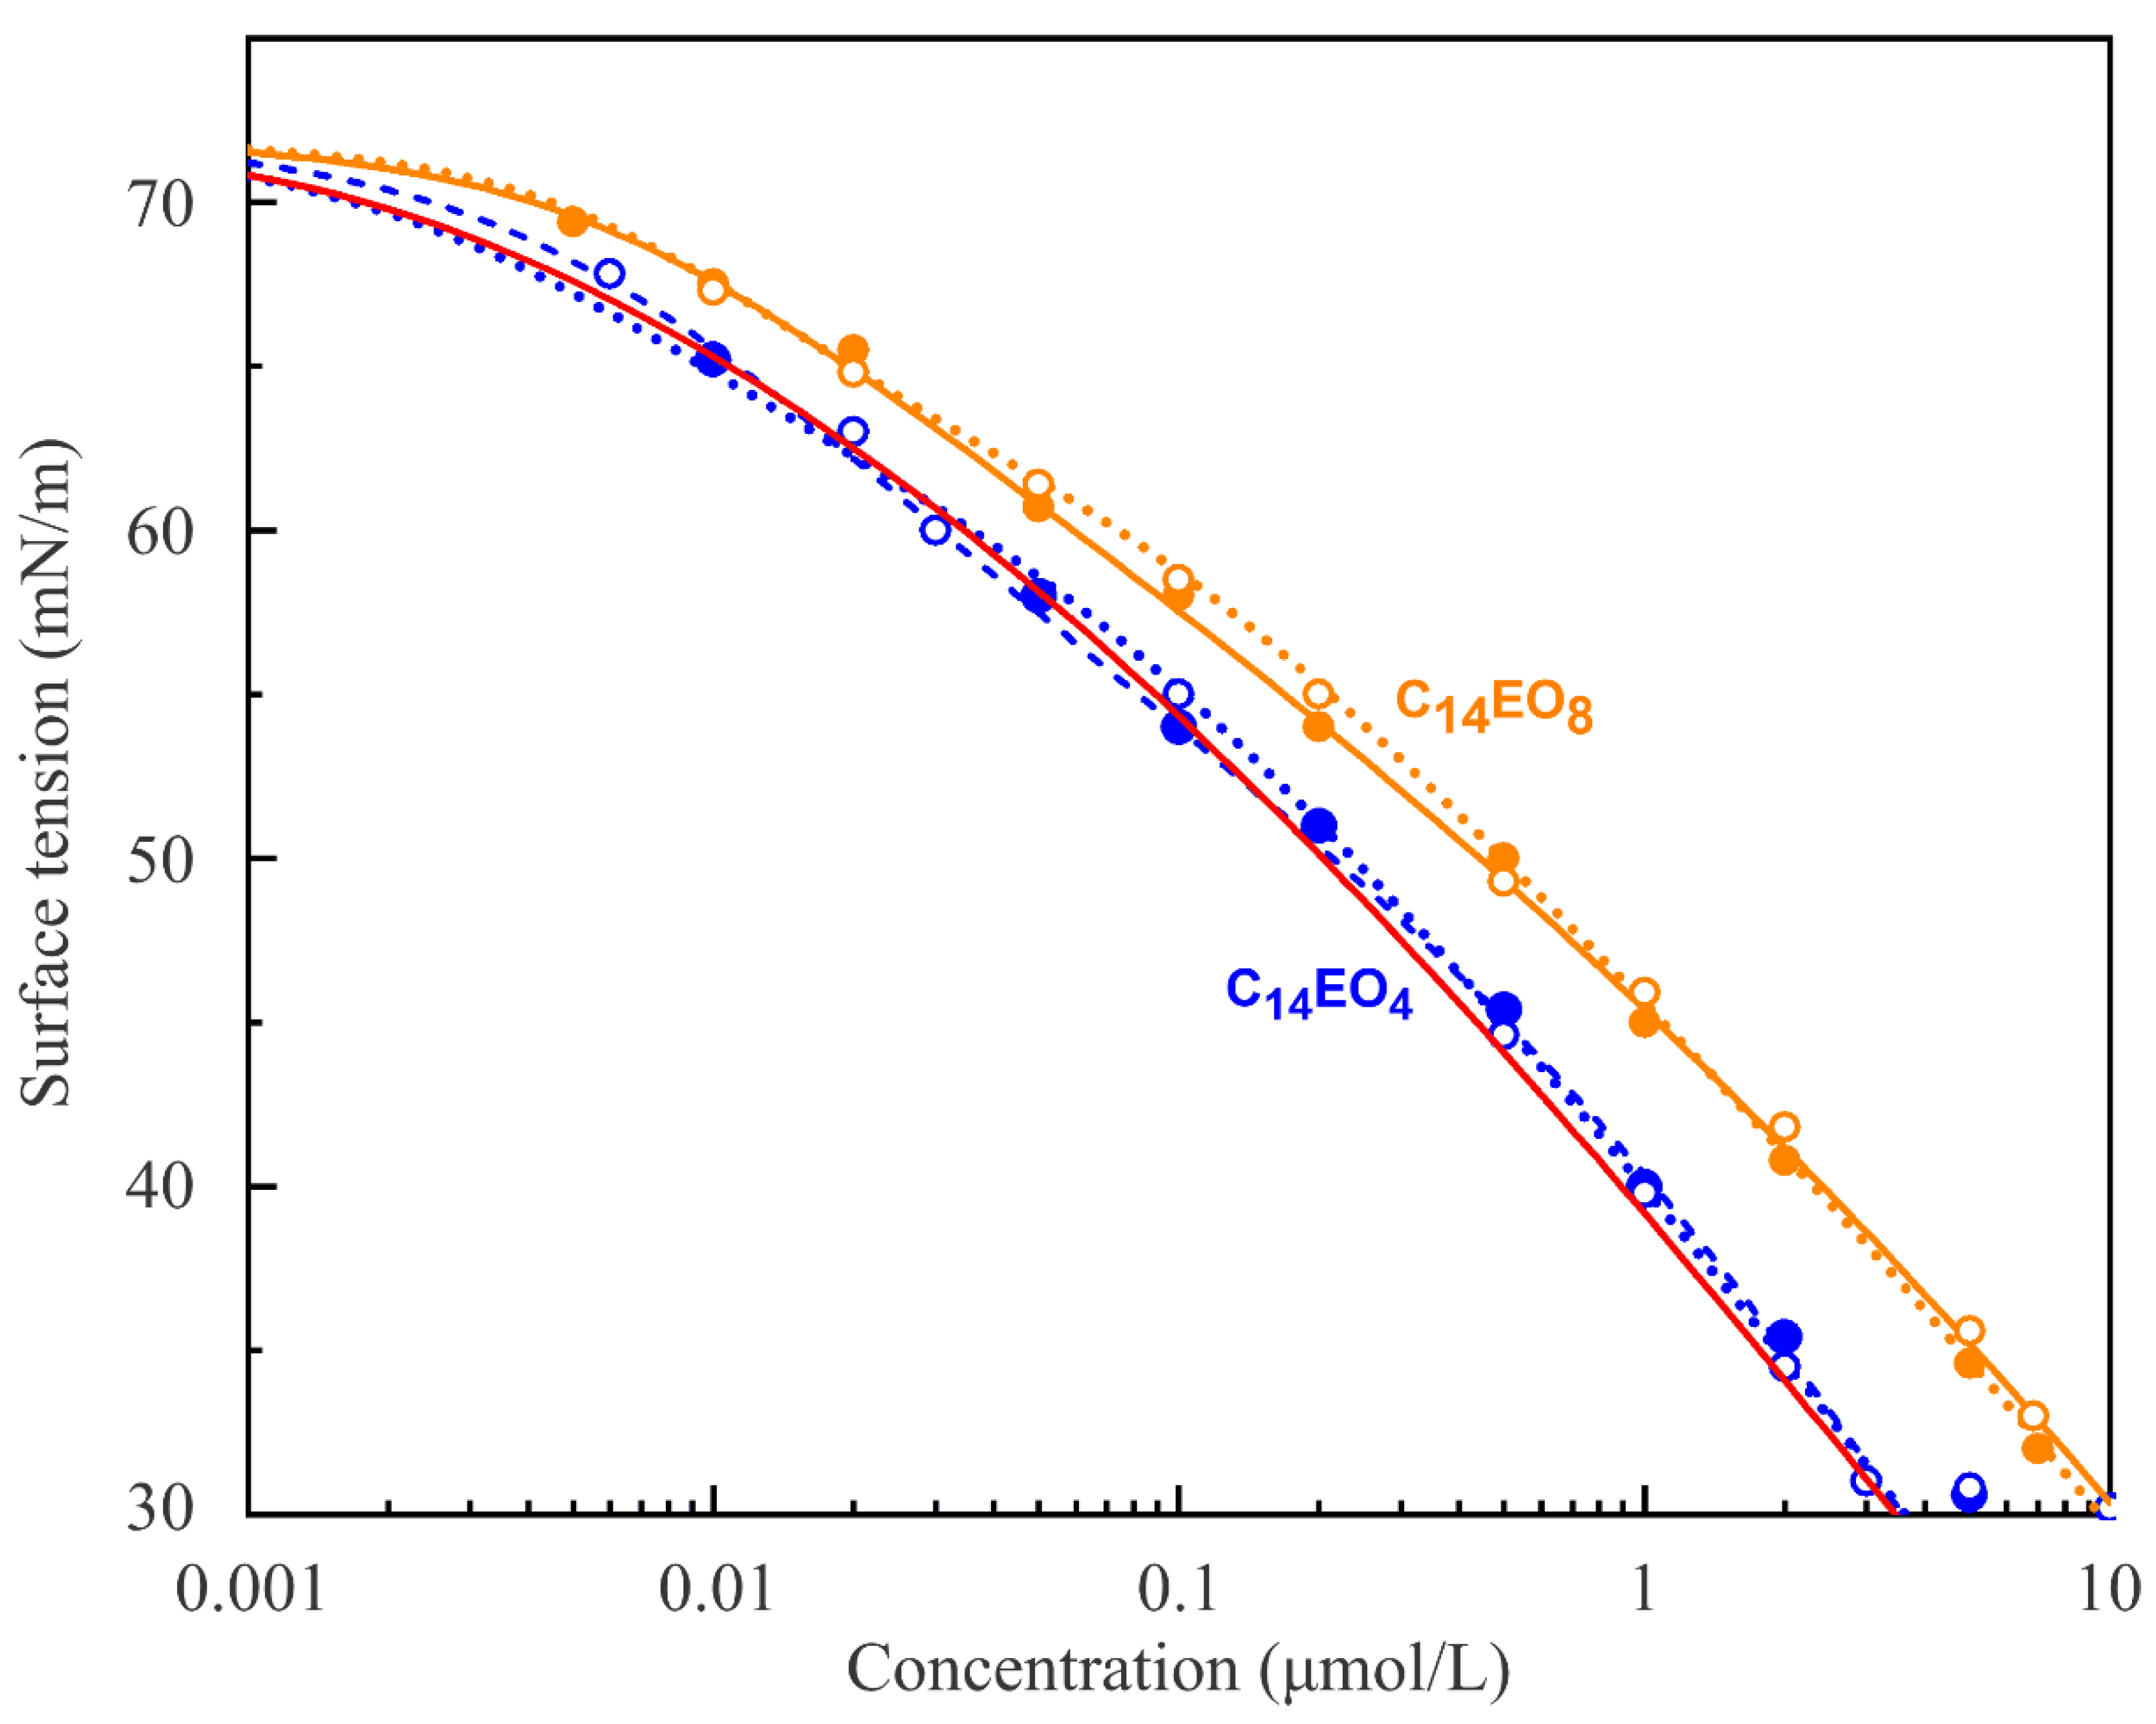
4. Results and Discussion
Figure 1 shows the experimental surface tension isotherms for C
14EO
4 and C
14EO
8 surfactant solutions, measured by the bubble shape method (two series of experiments for each), and the respective theoretical isotherms, calculated using the above equations for Model R with the parameters sets presented in
Table 1 and
Table 2. It was found that the isotherm for C
14EO
4 is well described by the multistate Model R with, e.g., 2, 3, and 5 states, while the isotherm for C
14EO
8 could be satisfactorily fit by the same model with, e.g., 2, 3, 5, and 10 states. The curves for s = 3 obtained for C
14EO
4 and the curves for s = 3 and 5 obtained for C
14EO
8 are almost indistinguishable from those shown in
Figure 1. It is seen from
Table 1 and
Table 2 that only the surface activity b
1 and the minimum molar area ω
10 vary with the number of states. Note, some of the parameter values summarised in
Table 1 and
Table 2 for s = 2 deviate from those given in [
19], where these values have been optimised for the reorientation model s = 2 with regard to the dynamic surface tensions. Quite expectedly, fitting of C
14EO
4 experimental isotherm using the multistate Model R0 with s = 5 (red solid line) also leads to a good agreement with experimental dependencies of surface tension on the surfactant concentration. Leaping ahead, however, it should be noted that the optimisation of the Model R0 parameters with respect to the very sensitive dilational visco-elasticity isotherm at a fixed oscillation frequency leads to less good agreement with the experimental rheologic data; therefore, in what follows, we concentrate on the results calculated using the multistate adsorption Model R. In this connection, it is worth mentioning that other values of s are also physically reasonable, but owing to the large time required for these simulations, we report here only about results for natural numbers. Thus, the best agreement of the model with the experimental data has not been performed such that we searched for an optimum value for s.
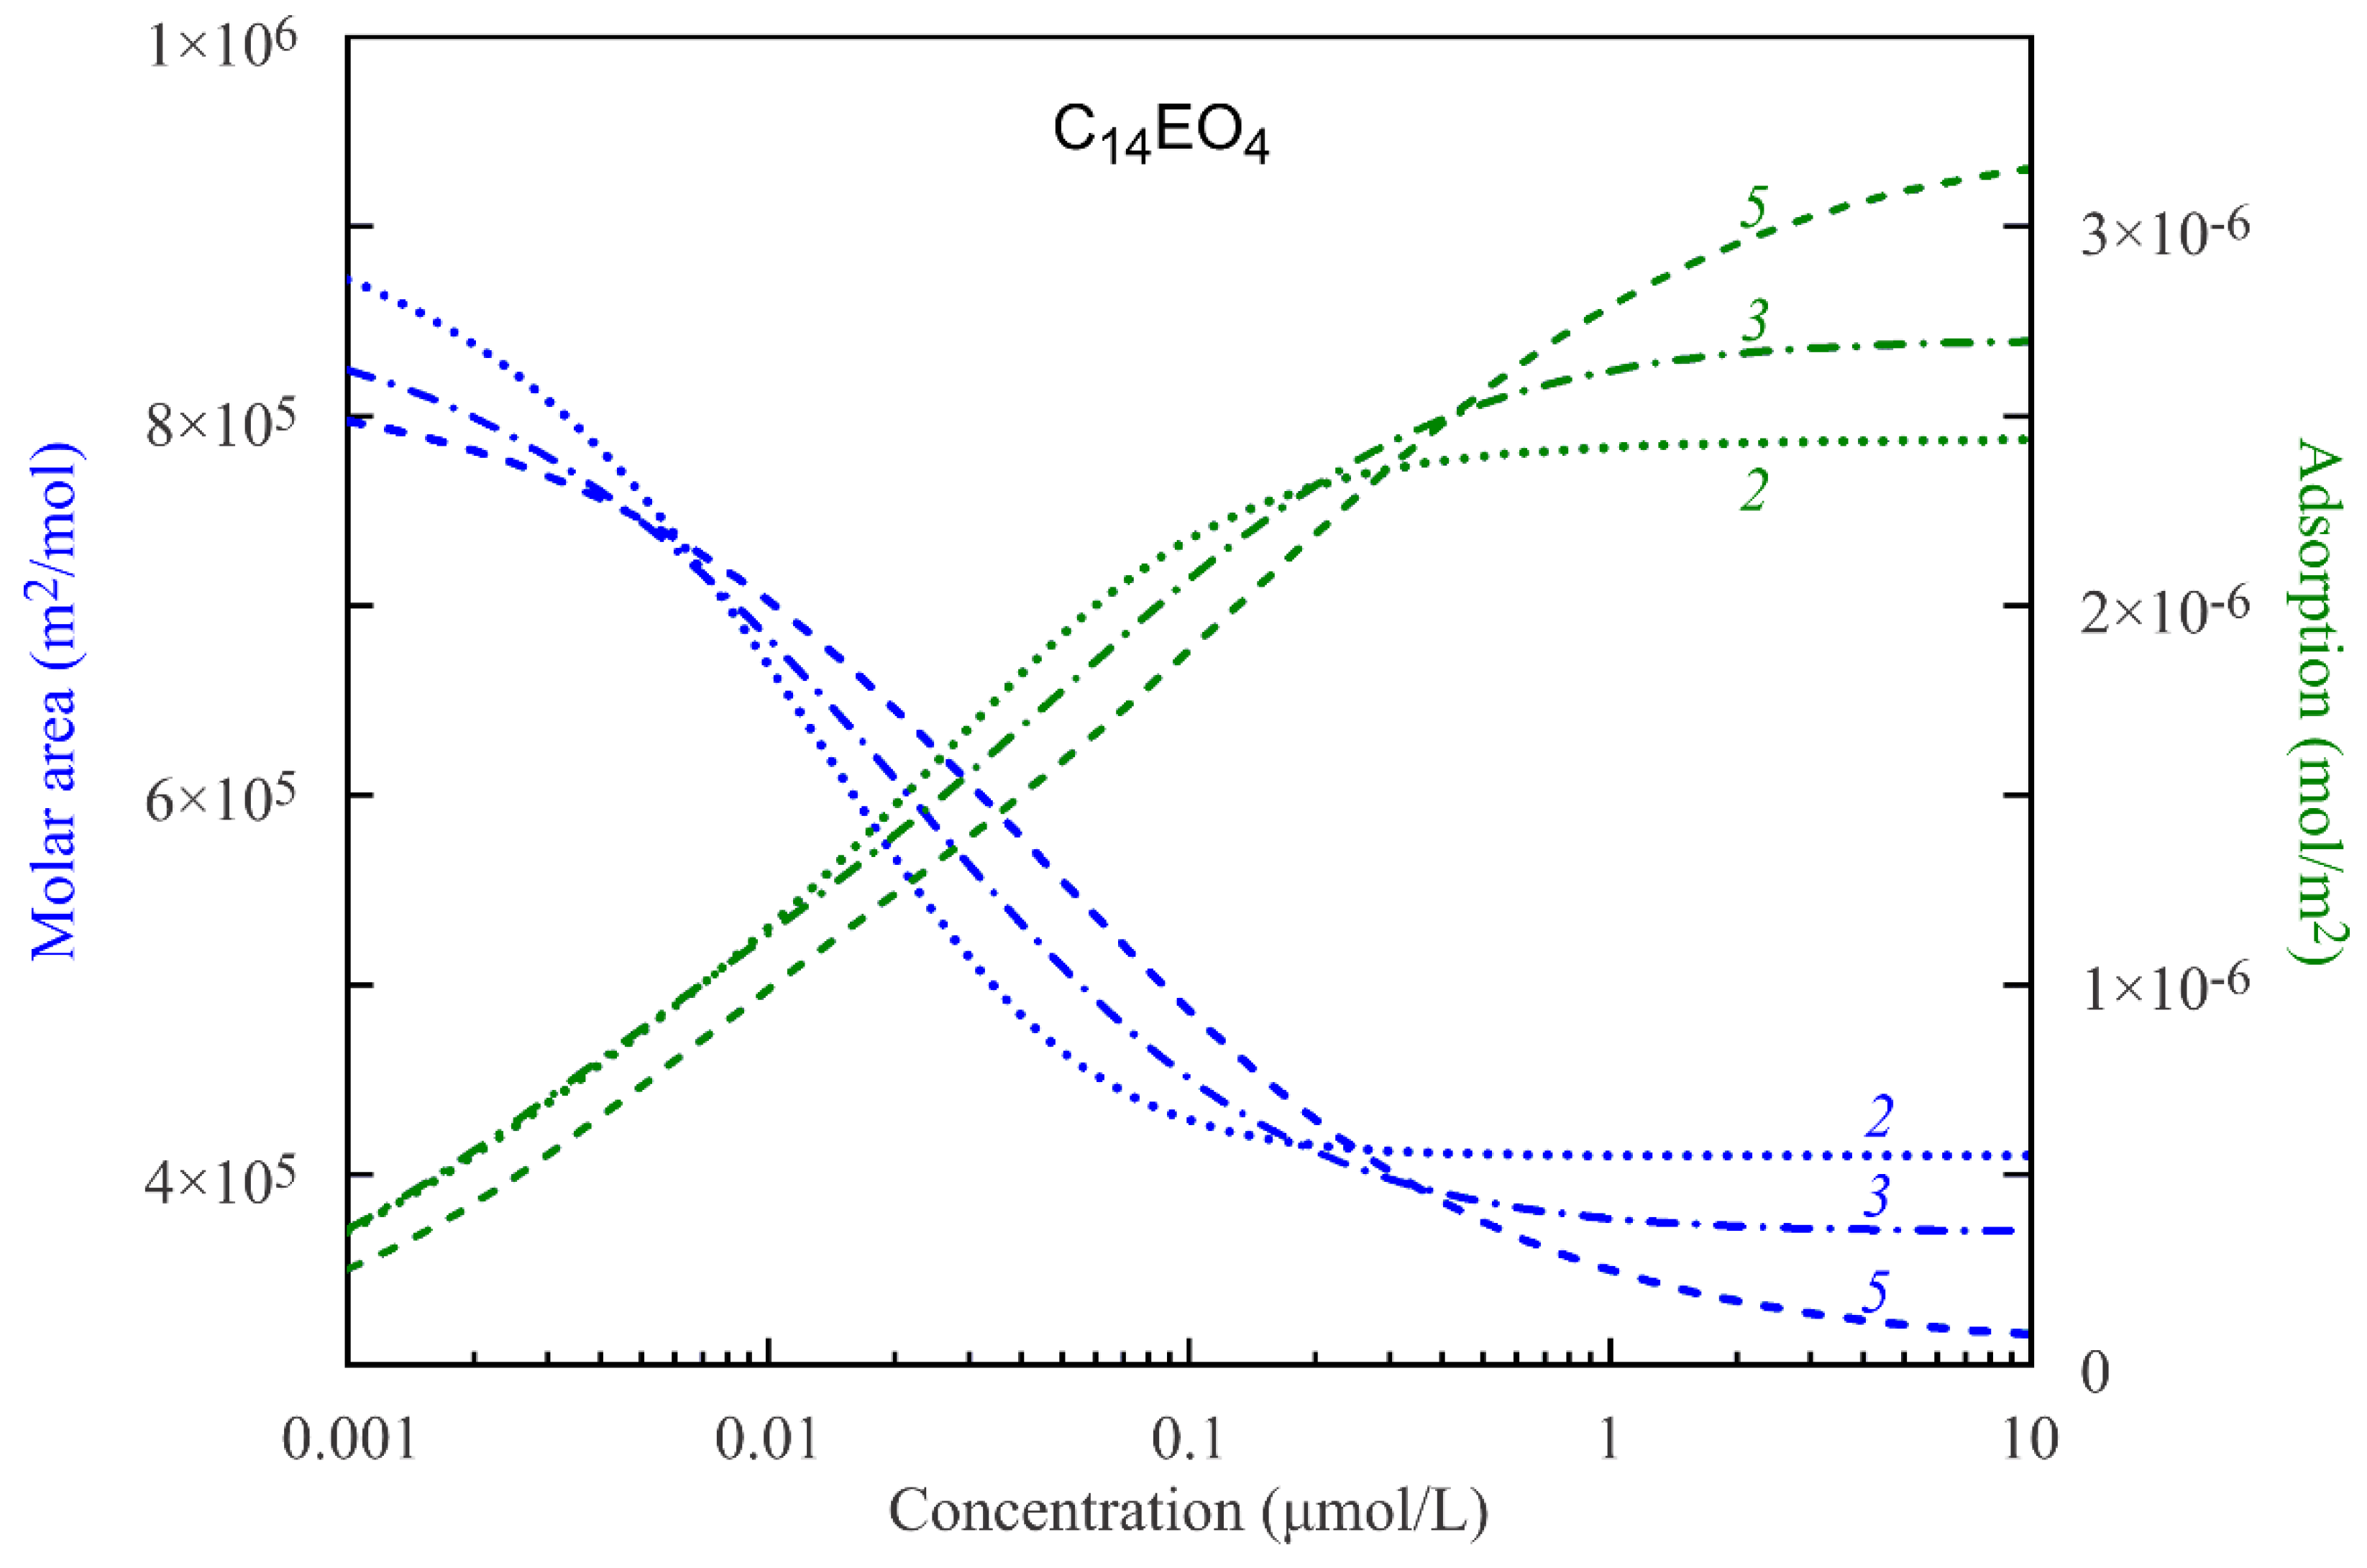
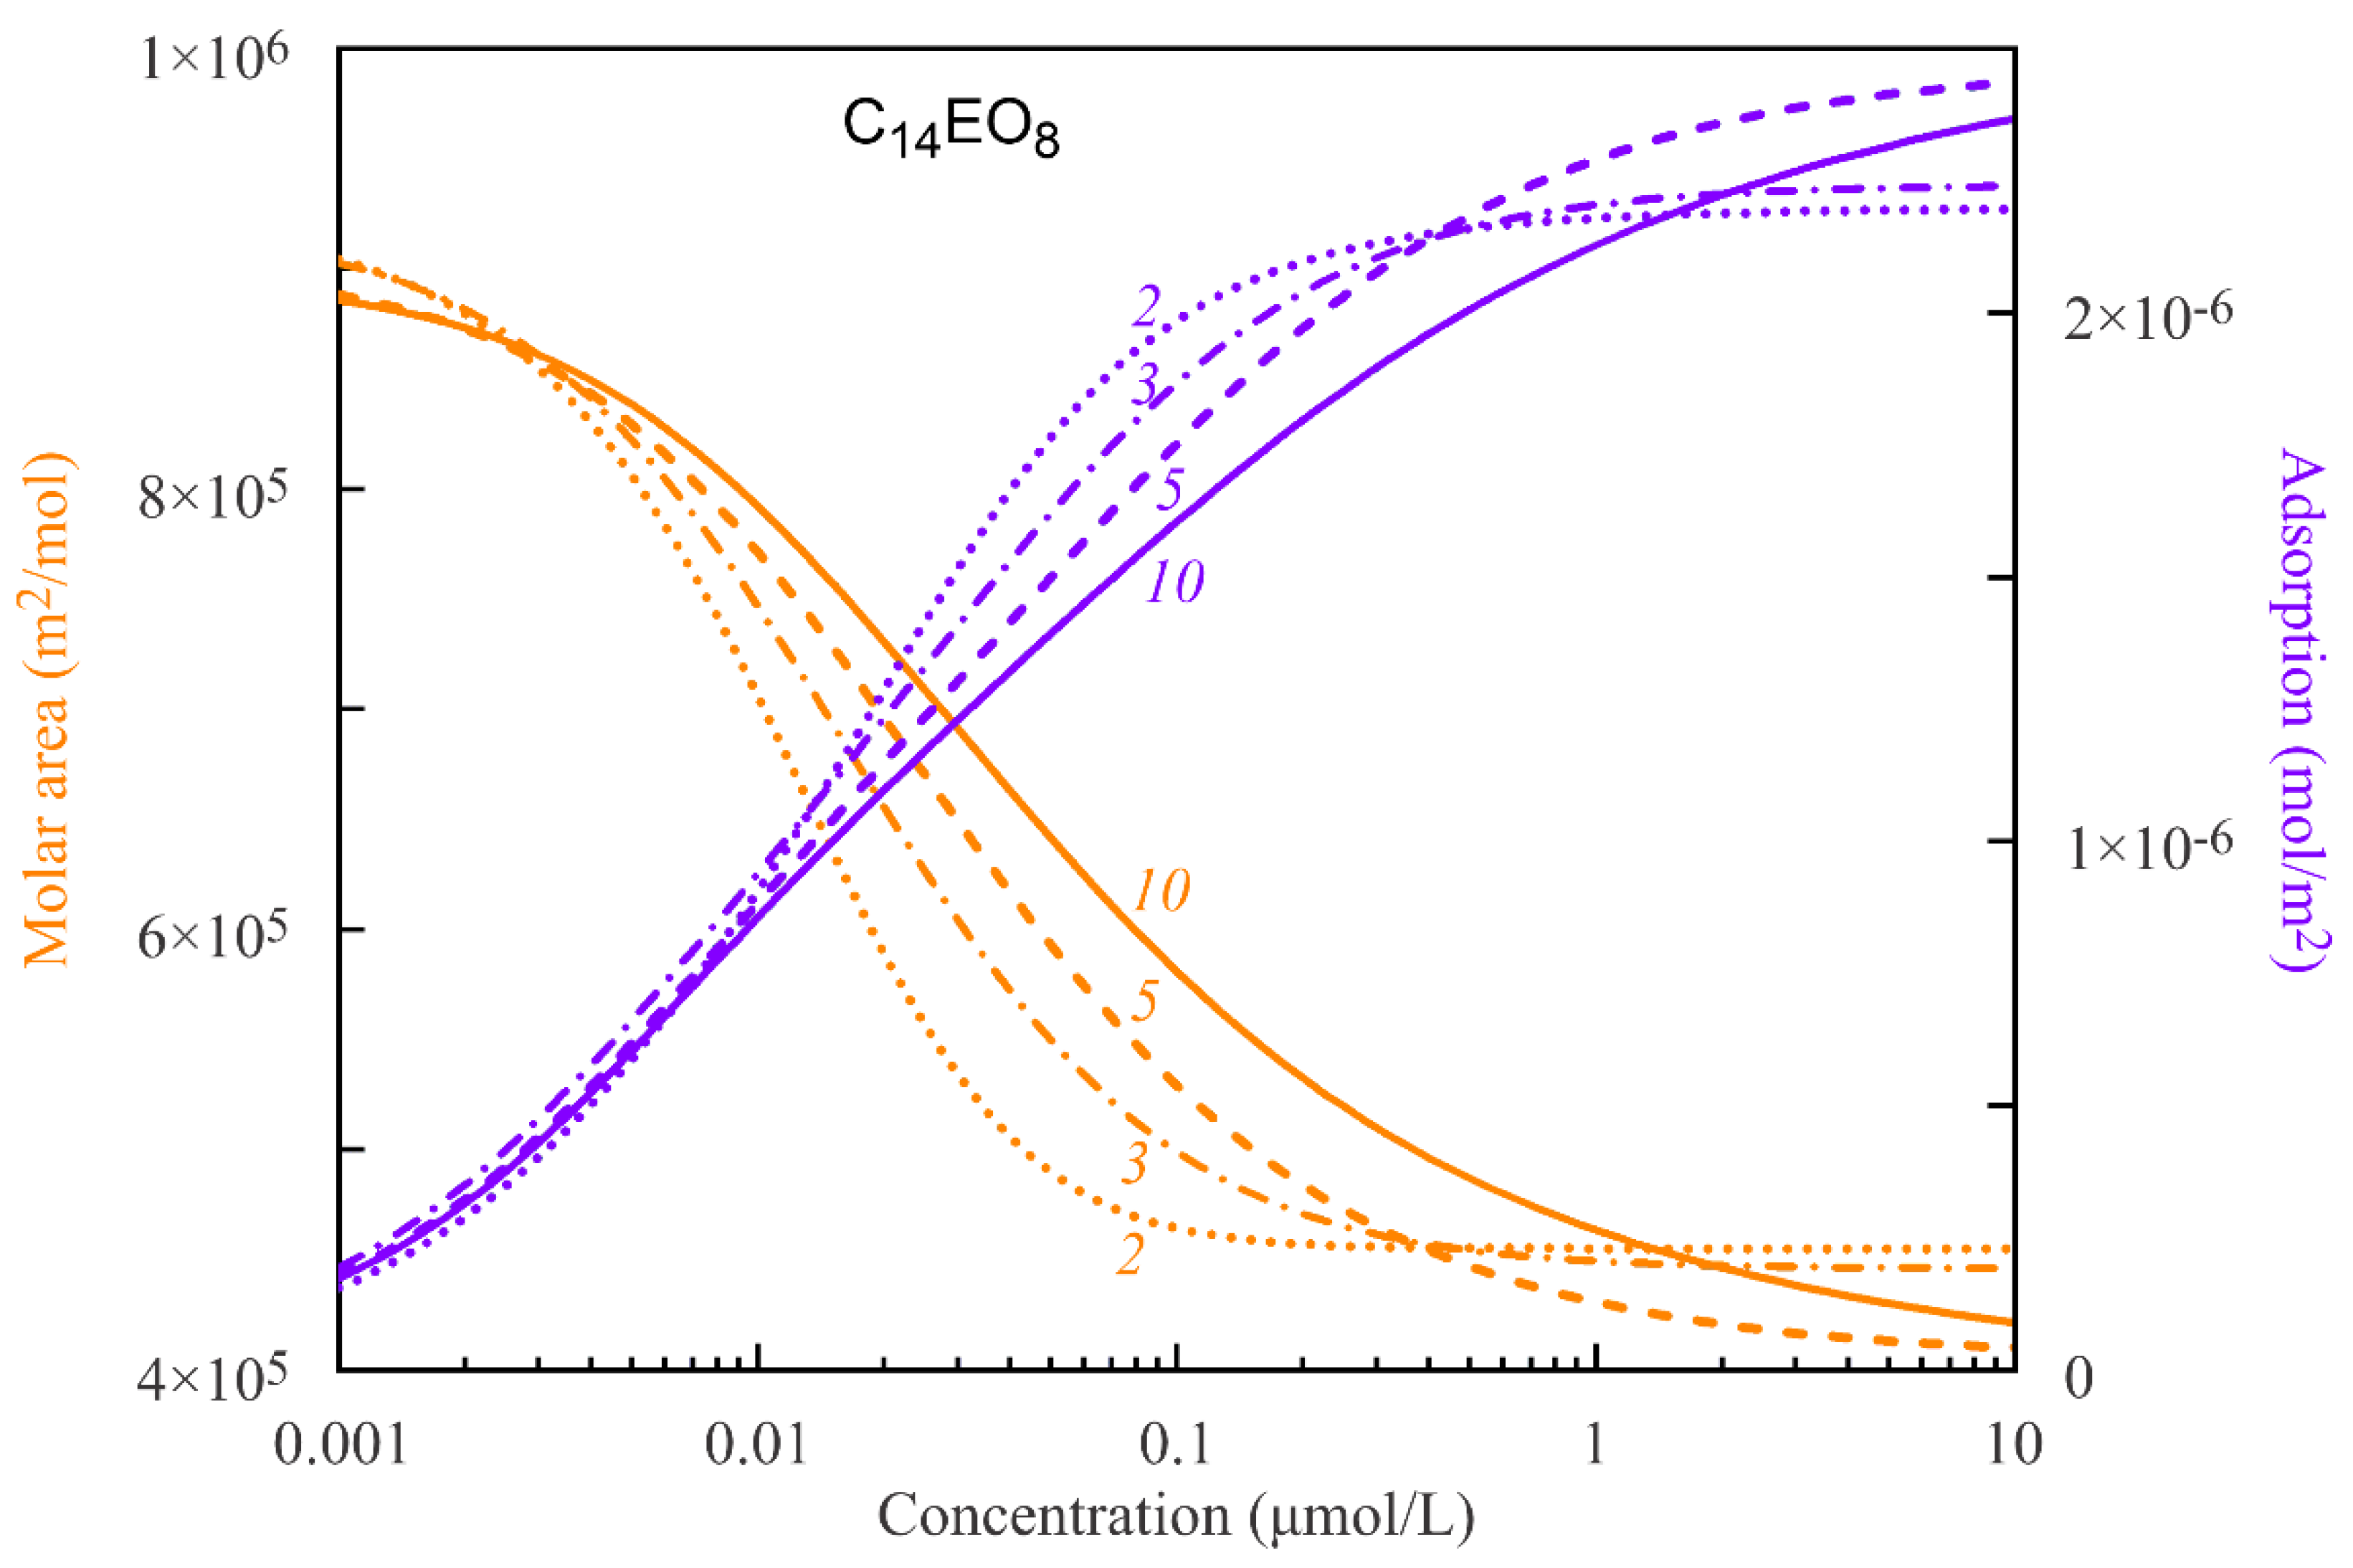
In
Figure 2 and
Figure 3, the average molar areas and total adsorptions for the C
14EO
4 and C
14EO
8 surfactant solutions are shown as functions of the solution bulk concentrations. The curves are calculated according to the proposed model with the parameters sets presented in
Table 1 and
Table 2, assuming various numbers of states. The data presented in
Figure 2 and
Figure 3 show a gradual decrease of the average molar areas ω down to the values close to the minimum molar area ω
10 with increasing total adsorption Γ. The decrease of the average molar areas is a consequence of transformation of the adsorbed molecules from the states with larger areas to the states with smaller areas. This transformation is steeper for the molecules with only two states and becomes smoother with the increasing number of states.
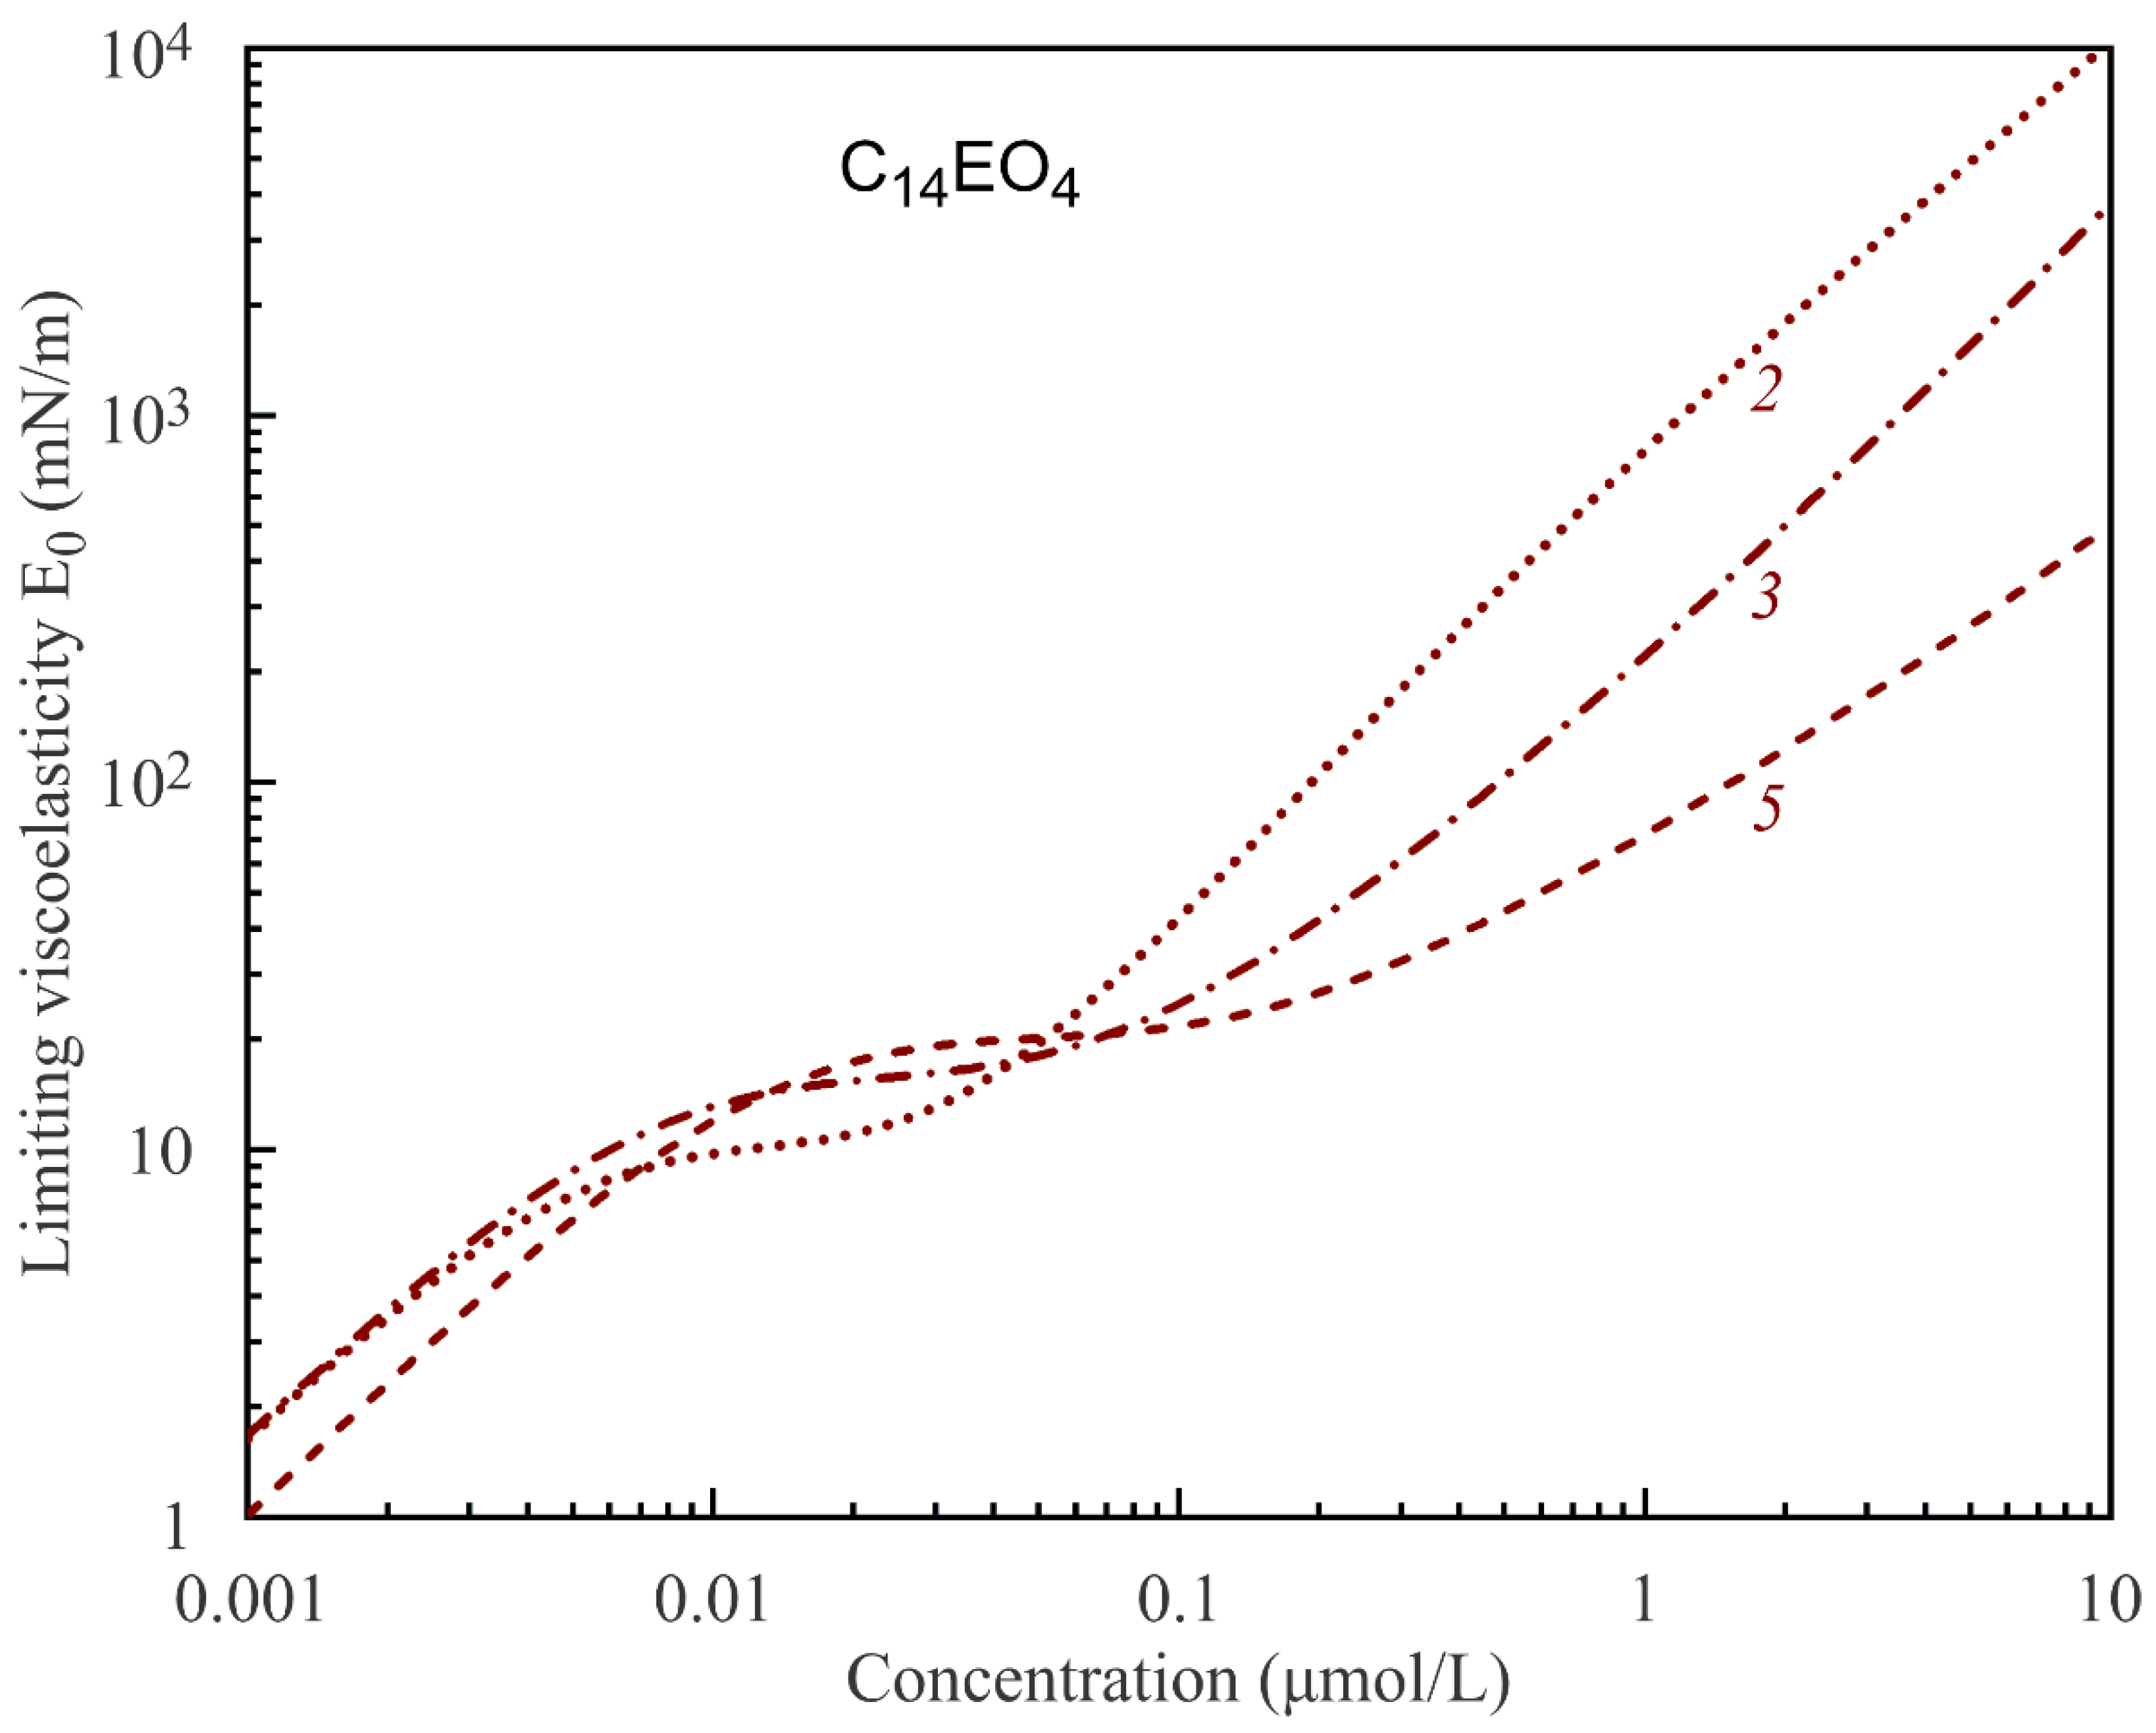
It is seen from the data in
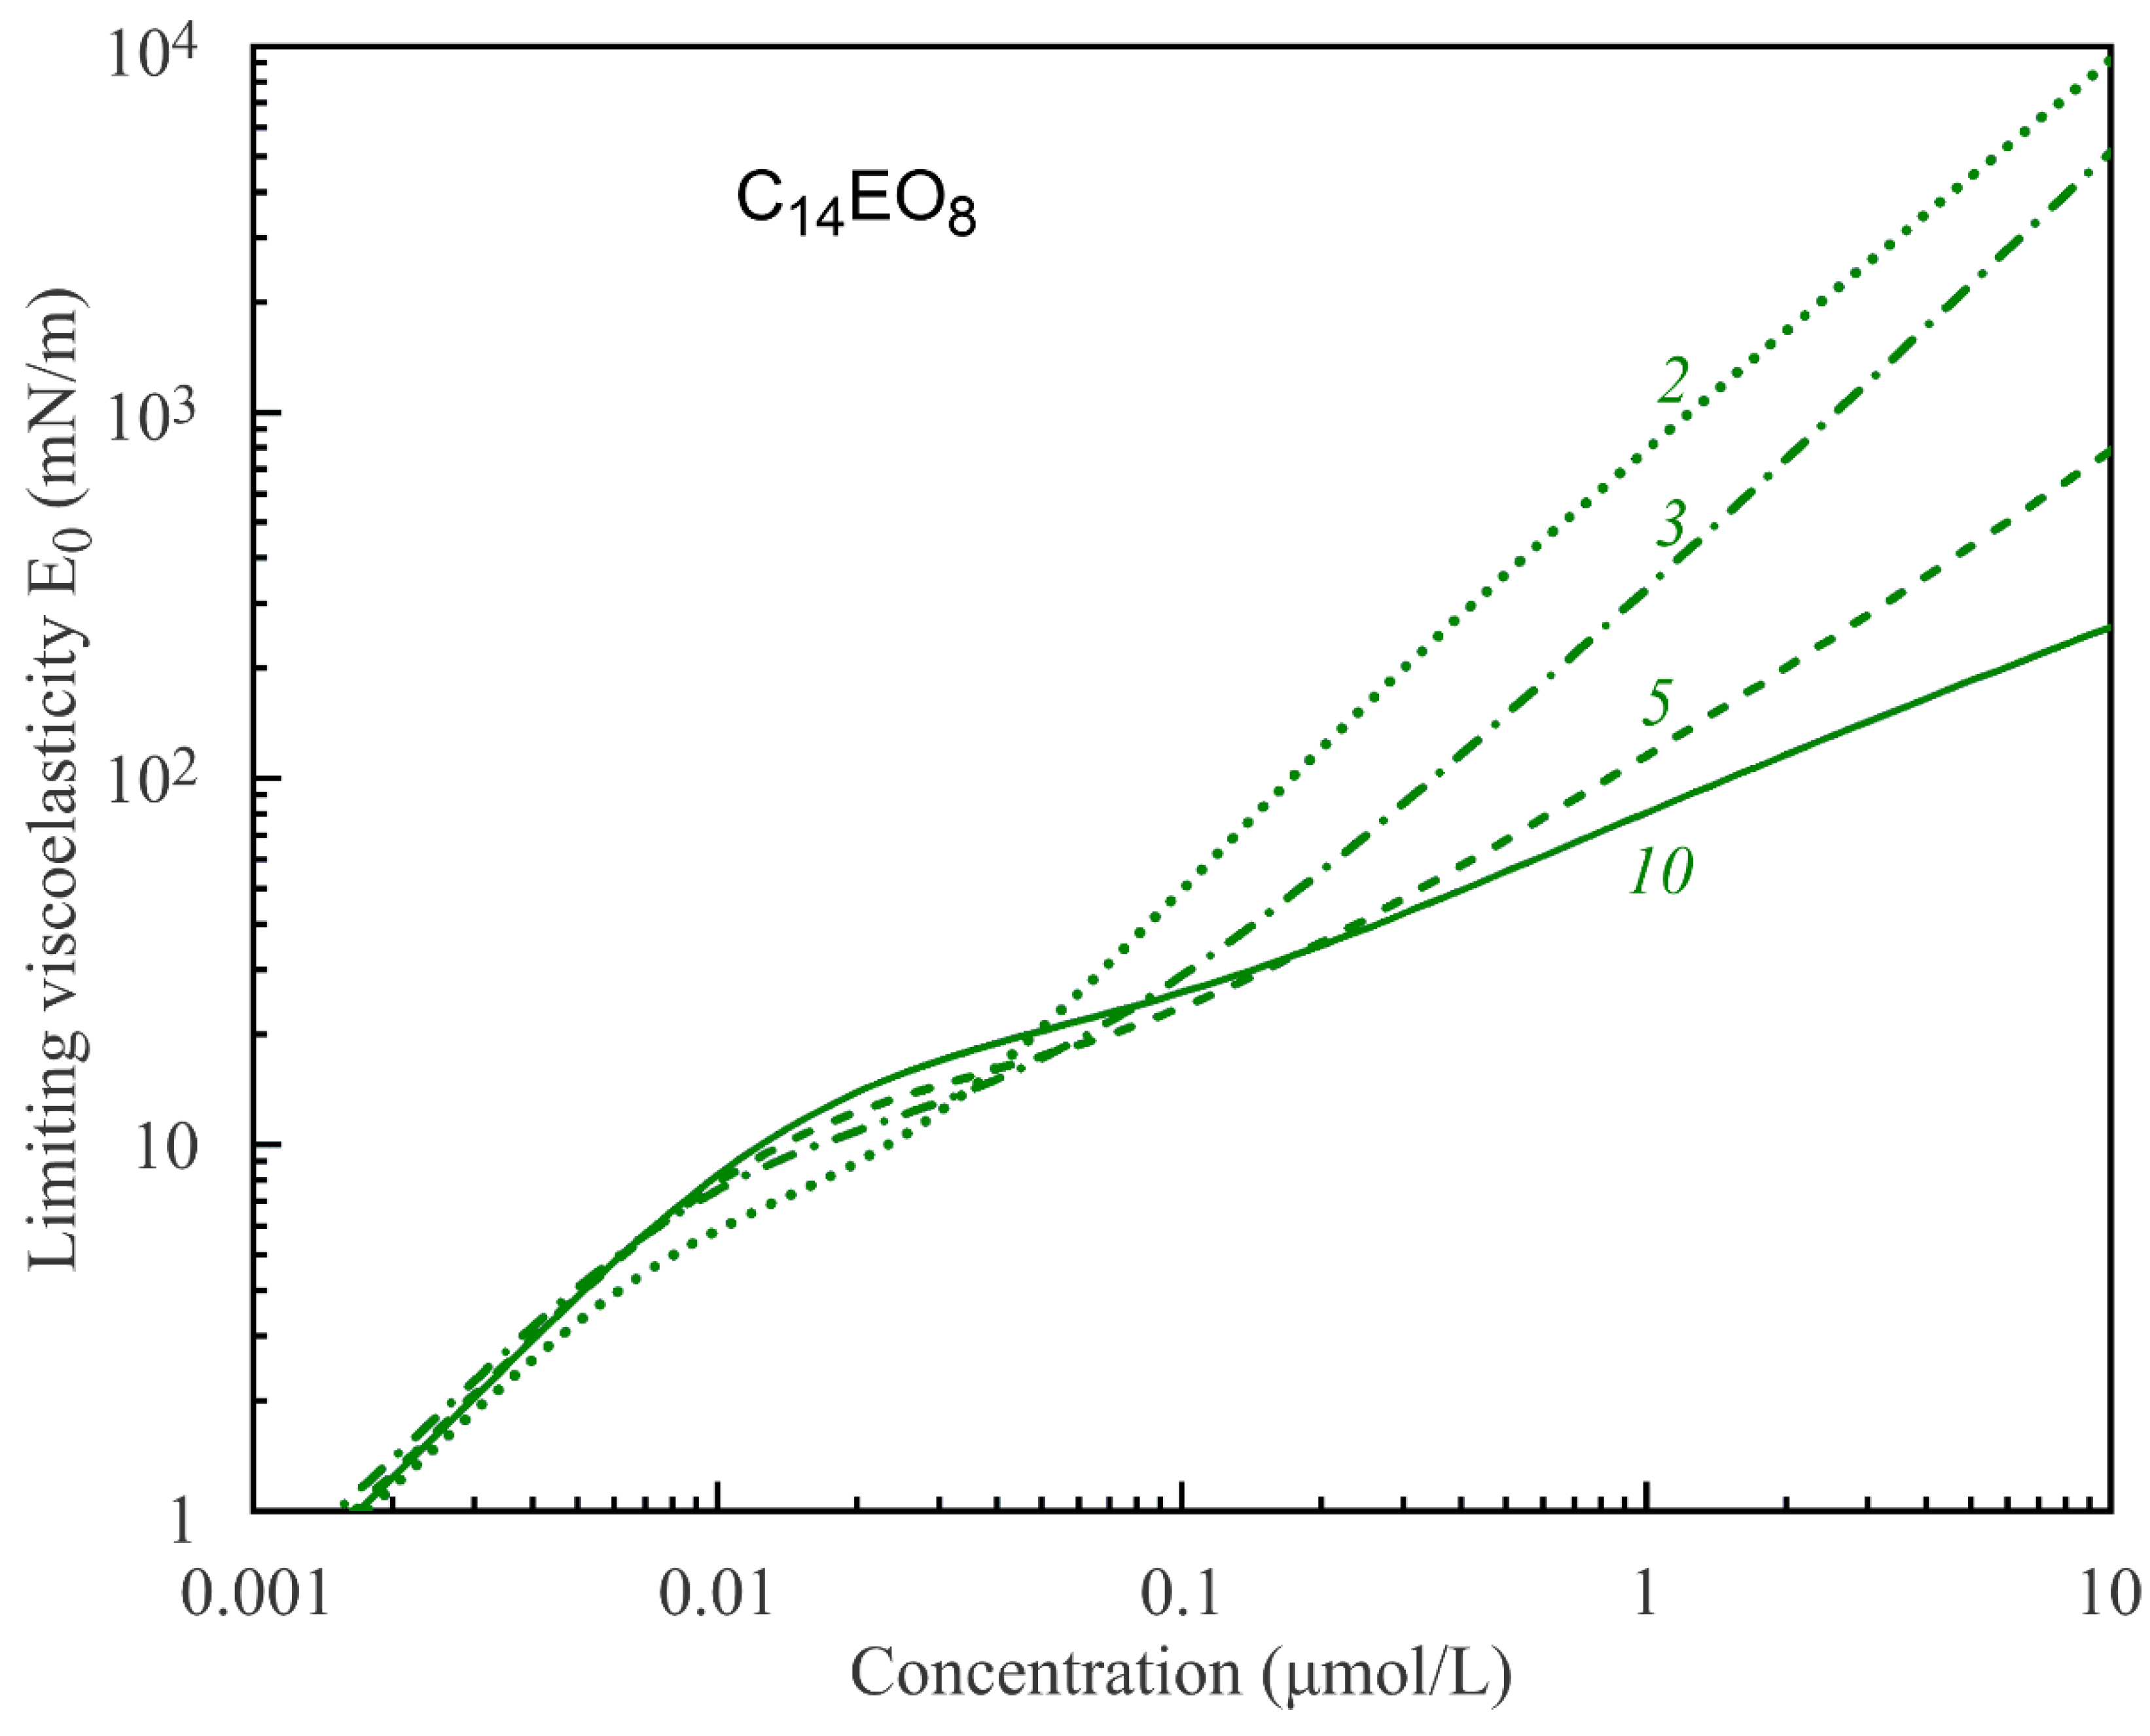
Figure 1 that the surface tension (and surface pressure) is not sensitive to the number of states of adsorbed molecules. In contrast, the total adsorption varies with the number of states. As a consequence, the limiting elasticity E
0, which is given by the derivative of the surface pressure on logarithm of the total adsorption, also varies with the number of molecular states. This is seen from the calculations results illustrated by
Figure 4 and
Figure 5. Thus, the limiting elasticity E
0 (and all other rheological characteristics of the adsorption layer) is more sensitive to the molecular structure and states than the surface tension (or surface pressure), in agreement with the literature data. In [
30], it was concluded that the rheological characteristics of surfaces and films are much more sensitive to the state and interaction of molecules in the adsorption layer than the equilibrium surface tension.
The results presented in
Figure 4 and
Figure 5 show that, for high solution concentrations, the limiting elasticity predicted by the multistate Model R increases up to unrealistically high values of several hundreds and even thousand mN/m. With an increasing number of molecular states, the limiting elasticity at high concentrations essentially decreases and becomes more realistic. Thus, the models with larger numbers of states are more adequate in the description of surface rheological characteristics of such specific molecules like in the case of C
nEO
m surfactants. At high concentrations, the surface rheological characteristics are also very sensitive to the value of the intrinsic compressibility coefficient ε, which determines the minimum molar area according to Equation (1). However, this effect was already analysed in a number of publications (see, e.g., [
31]) and is not considered here.
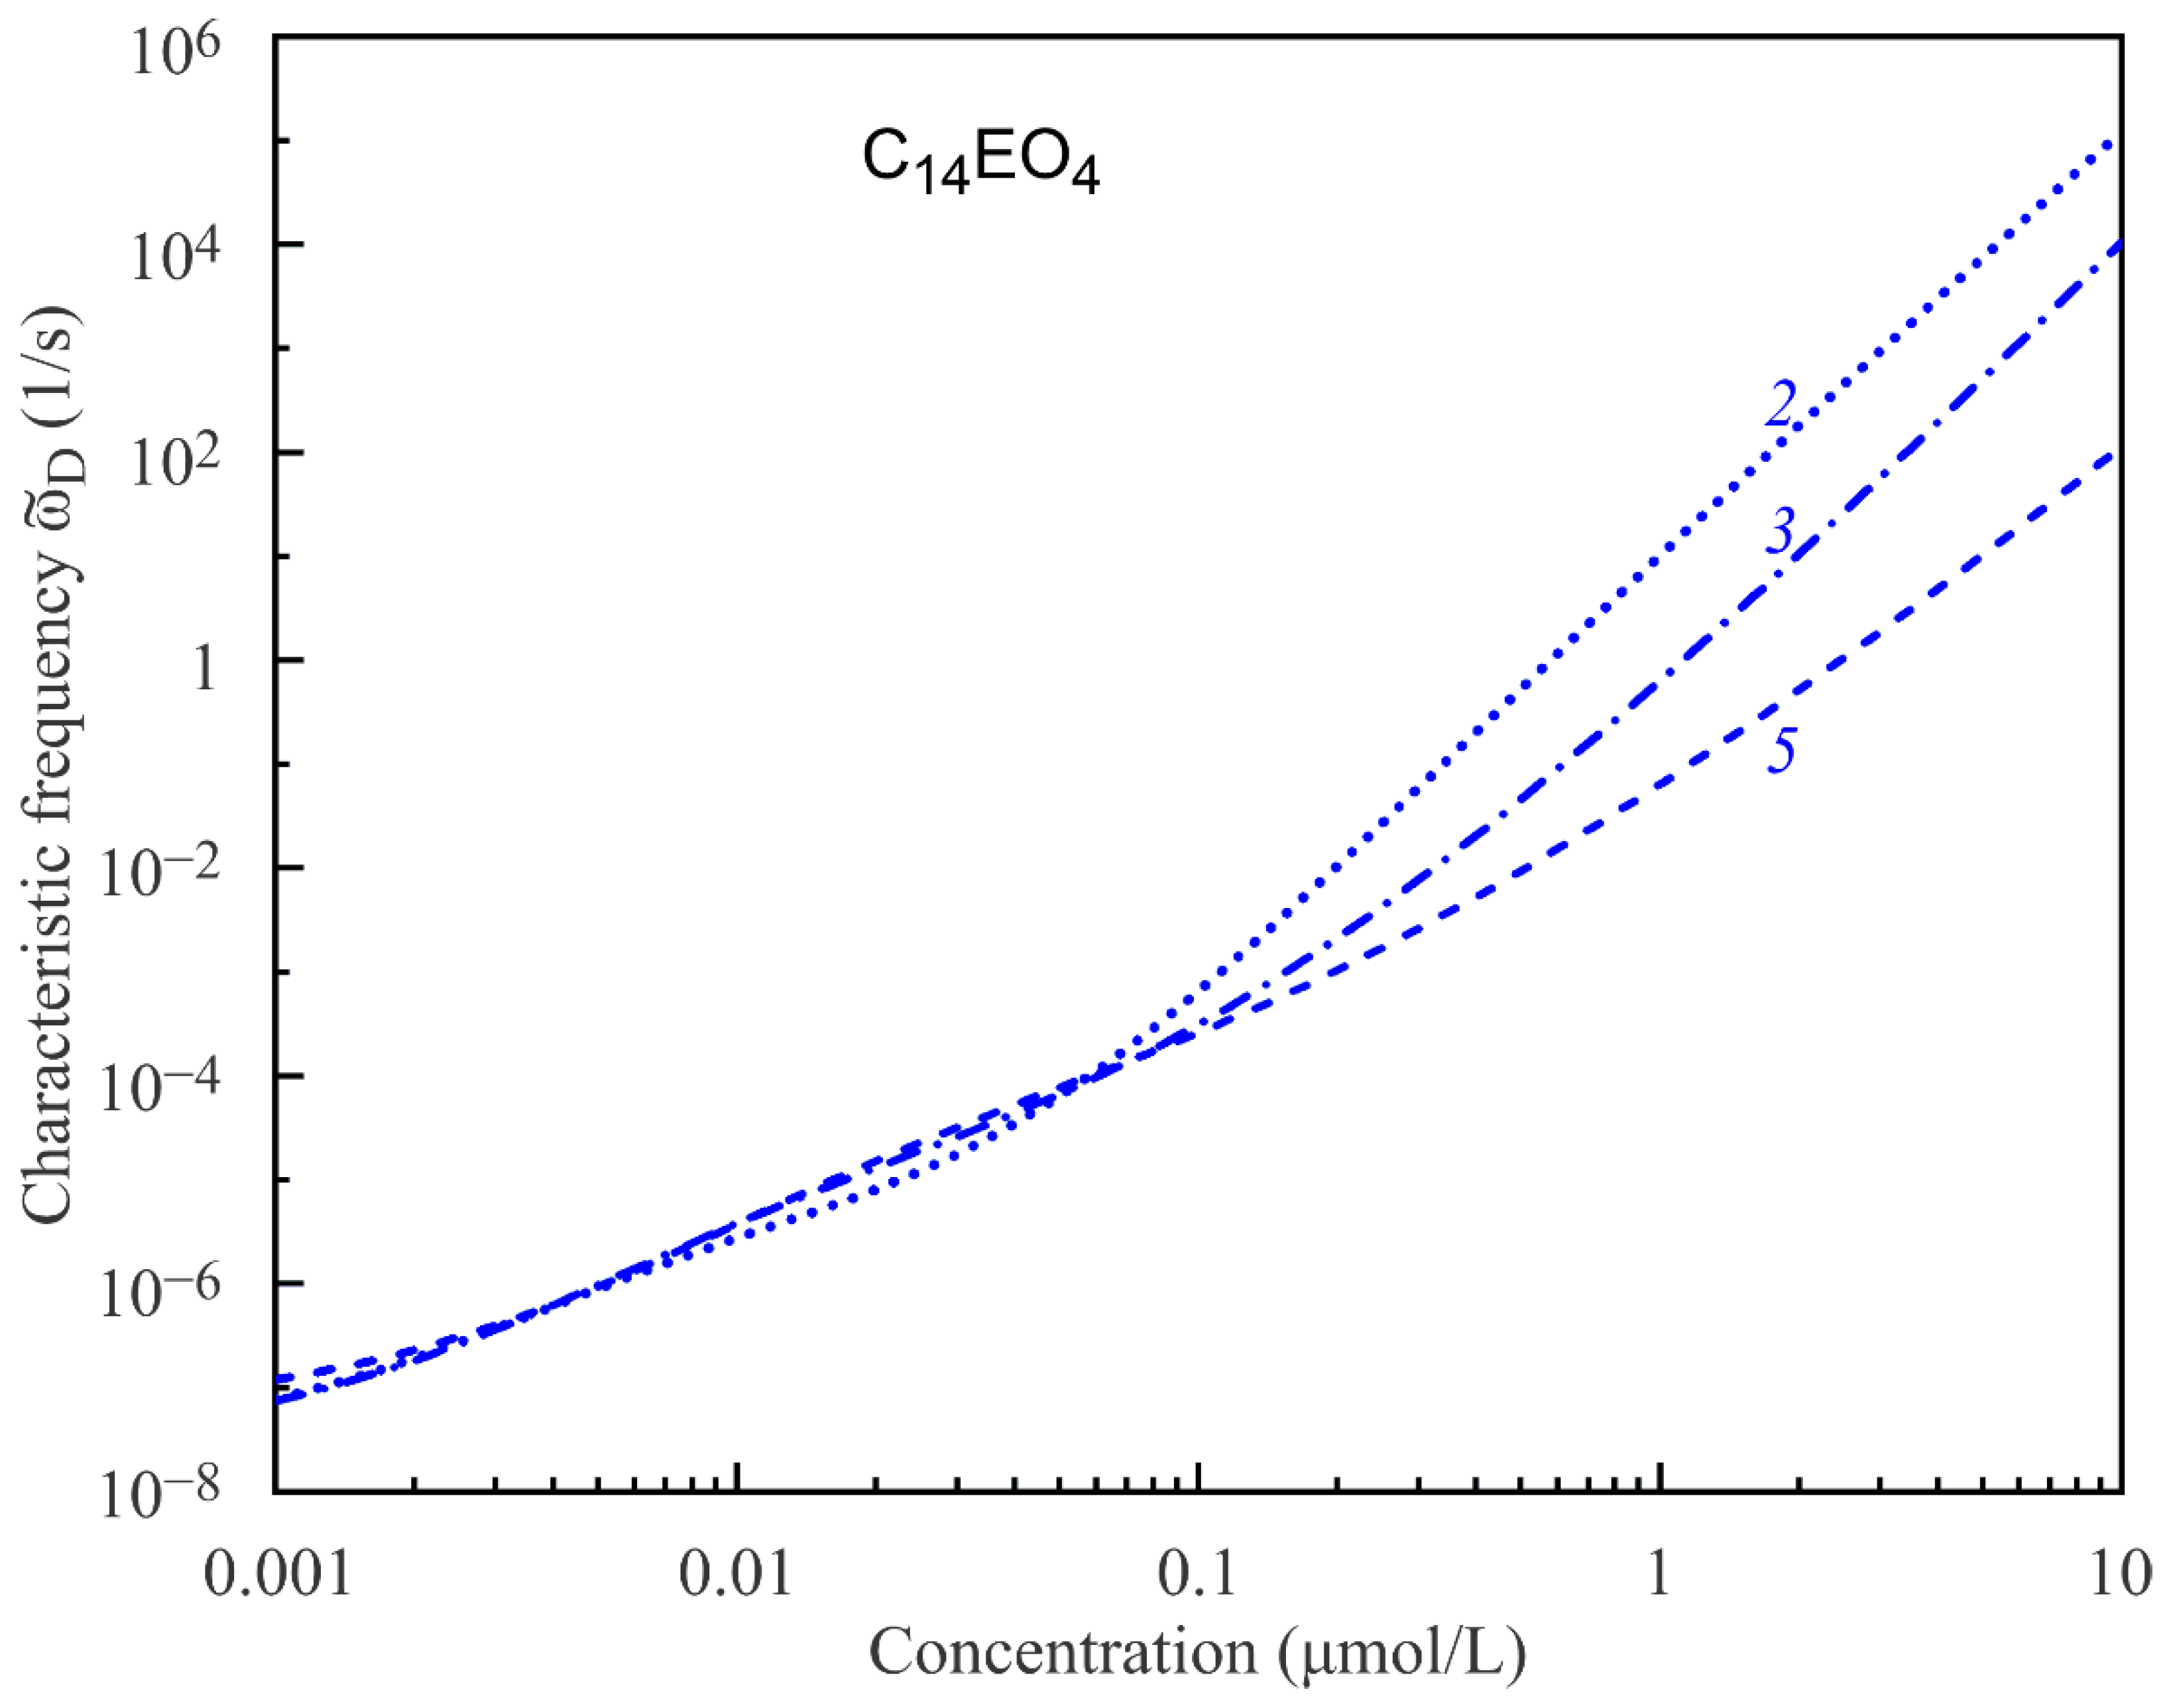
Another parameter determining the surface dilational visco-elasticity modulus |E| is the characteristic frequency of diffusion relaxations
, cf. Equation (12). Similarly to the limiting elasticity E
0(c), ϖ
D(c) is also a concentration-dependent parameter that can be calculated using the same model equations, if the diffusion coefficient is known.
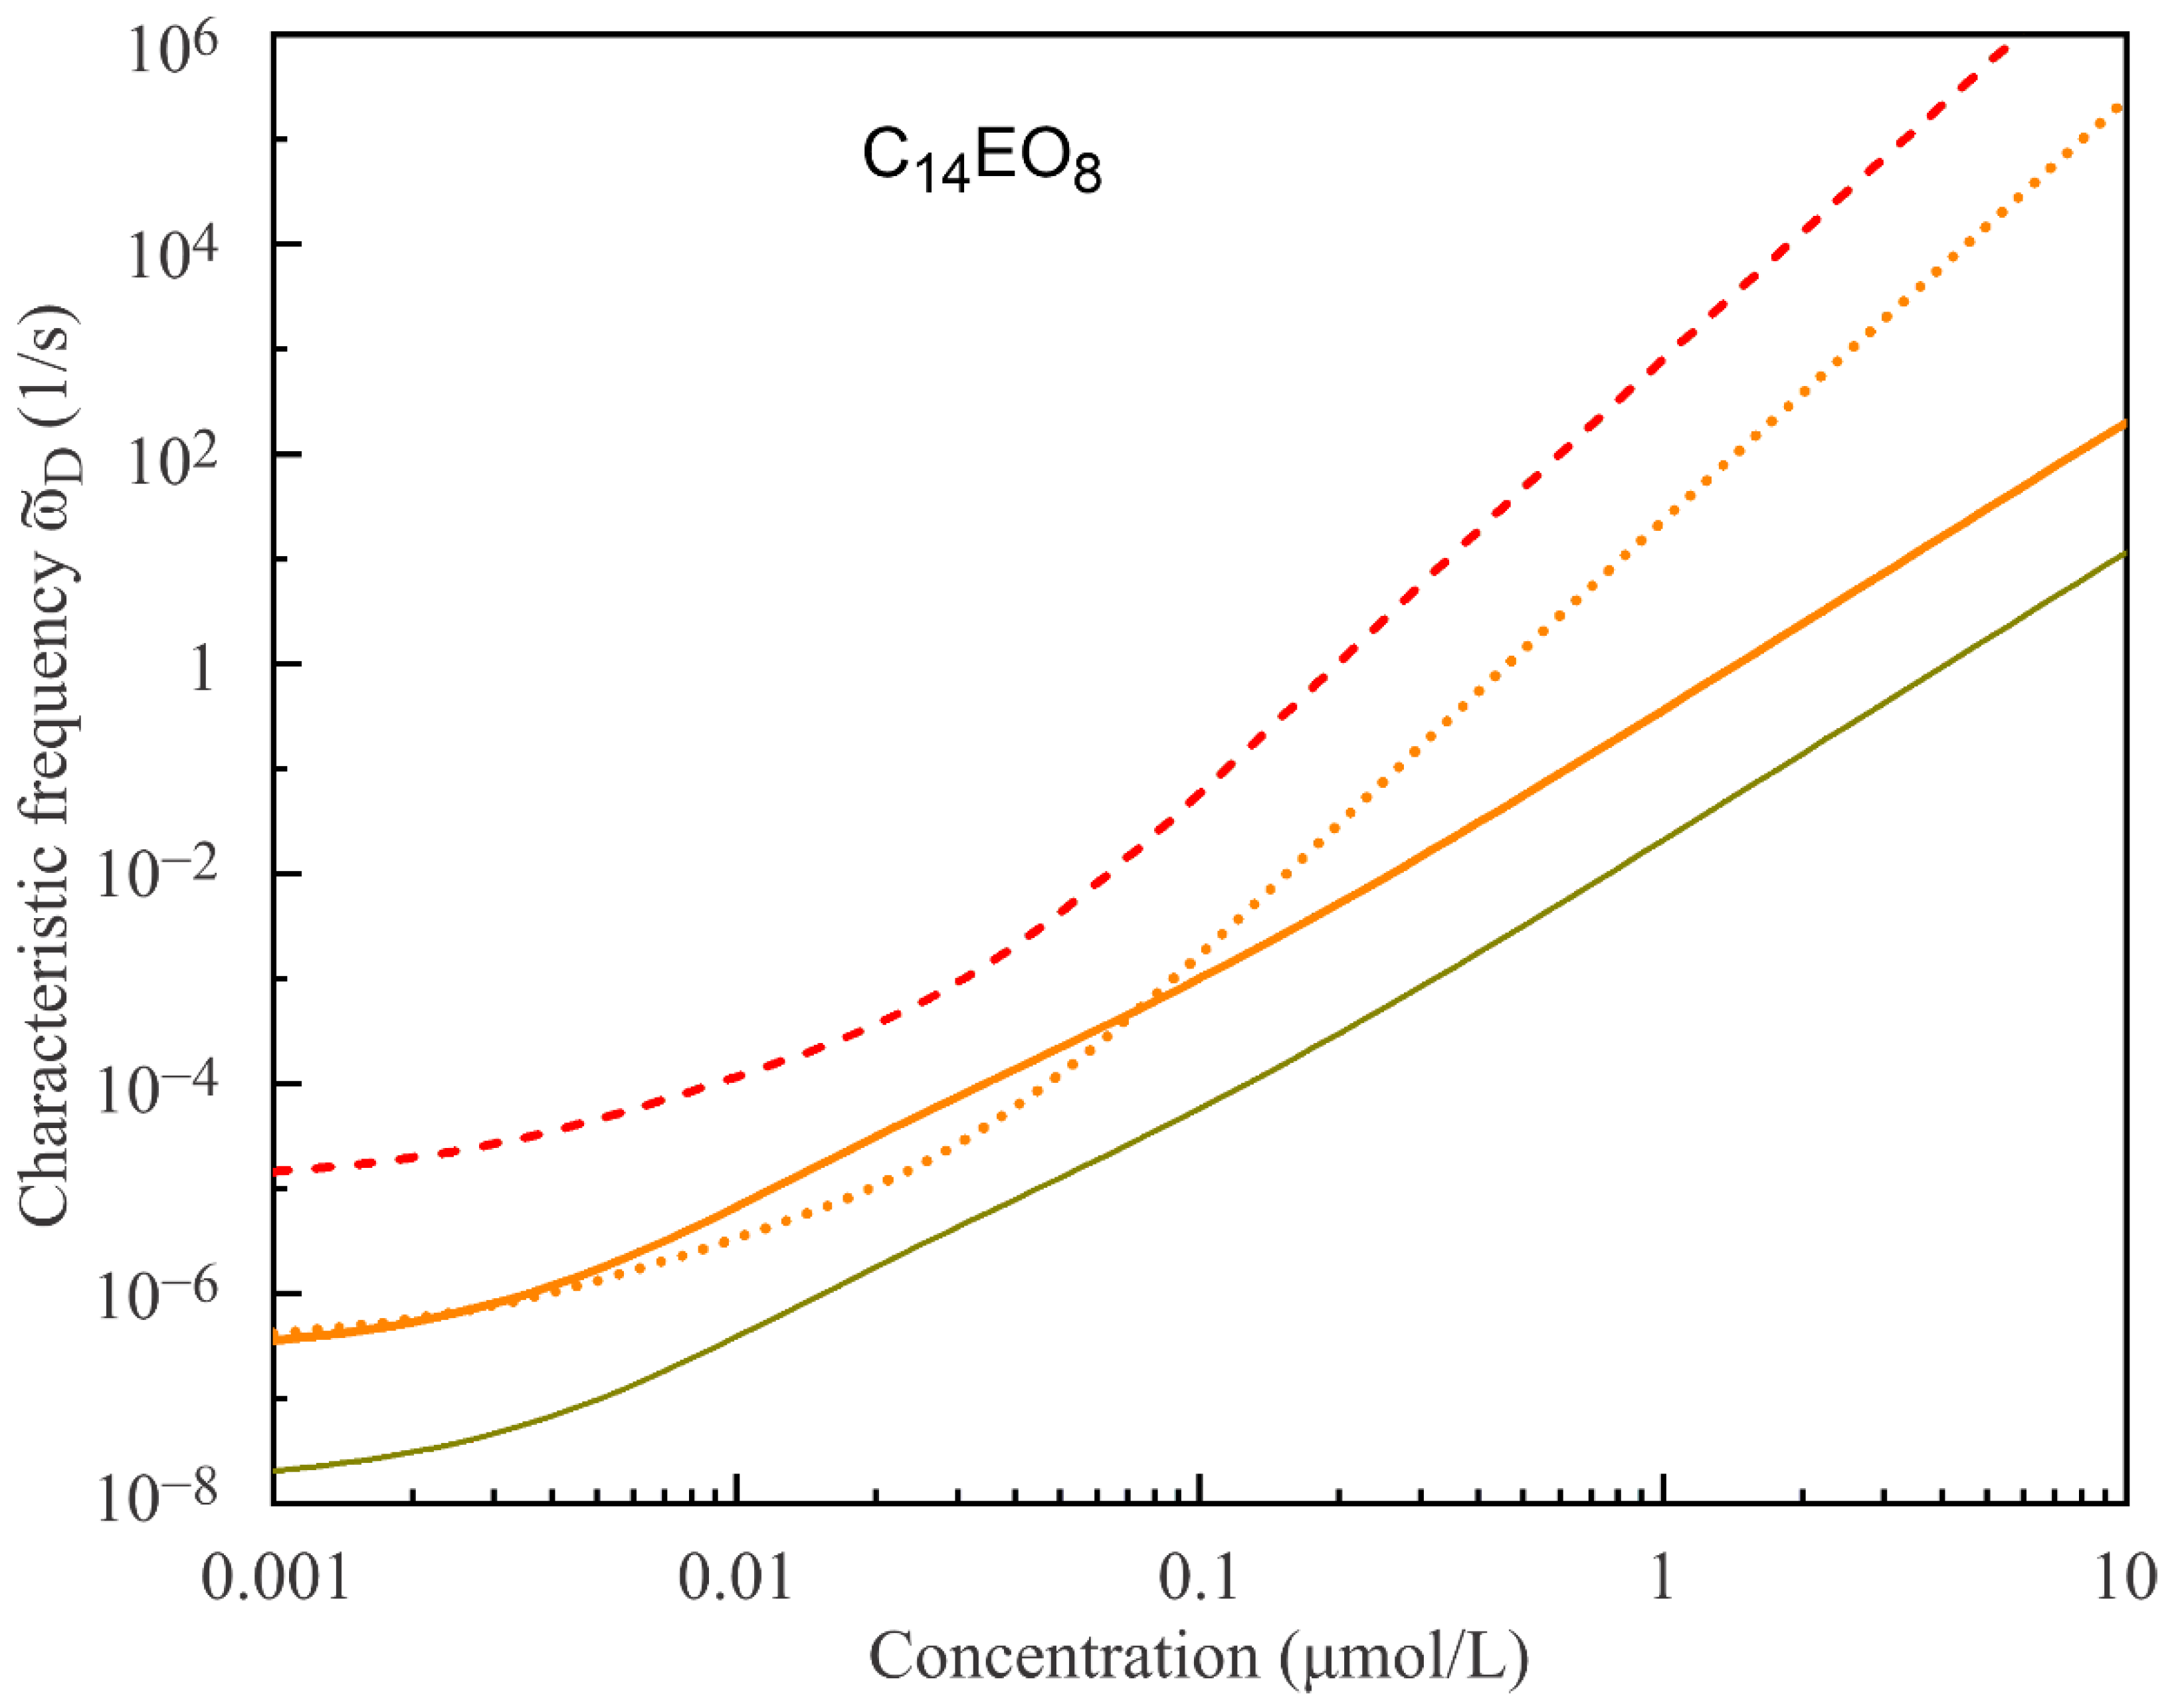
Figure 6 and
Figure 7 show the characteristic frequencies ϖ
D(c) calculated for C
14EO
4 and C
14EO
8 surfactant solutions using the same model parameters as listed in
Table 1 and
Table 2 and diffusion coefficients 5·10
−9 m
2/s and 8.7·10
−9 m
2/s, respectively. It is seen that the characteristic frequencies strongly increase with the surfactant concentration, in line with the decreasing derivatives dΓ/dc. However, a more important observation is that the model obviously predicts strongly overestimated ϖ
D values at higher concentrations. Such overestimated ϖ
D values should lead to incorrect values of the visco-elasticity modulus |E|, as will be seen below. With an increasing number of states, the model predicts more realistic ϖ
D values, similarly to what we have seen above for the limiting elasticity E
0. Note that the Frumkin model, although describing the equilibrium data quite well, also does not describe the visco-elasticity dependencies properly.
Figure 7 also illustrates the dependence of the characteristic frequency on the diffusion coefficient: for the same model parameters, the increase of D results in the increase of ϖ
D value and vice versa.
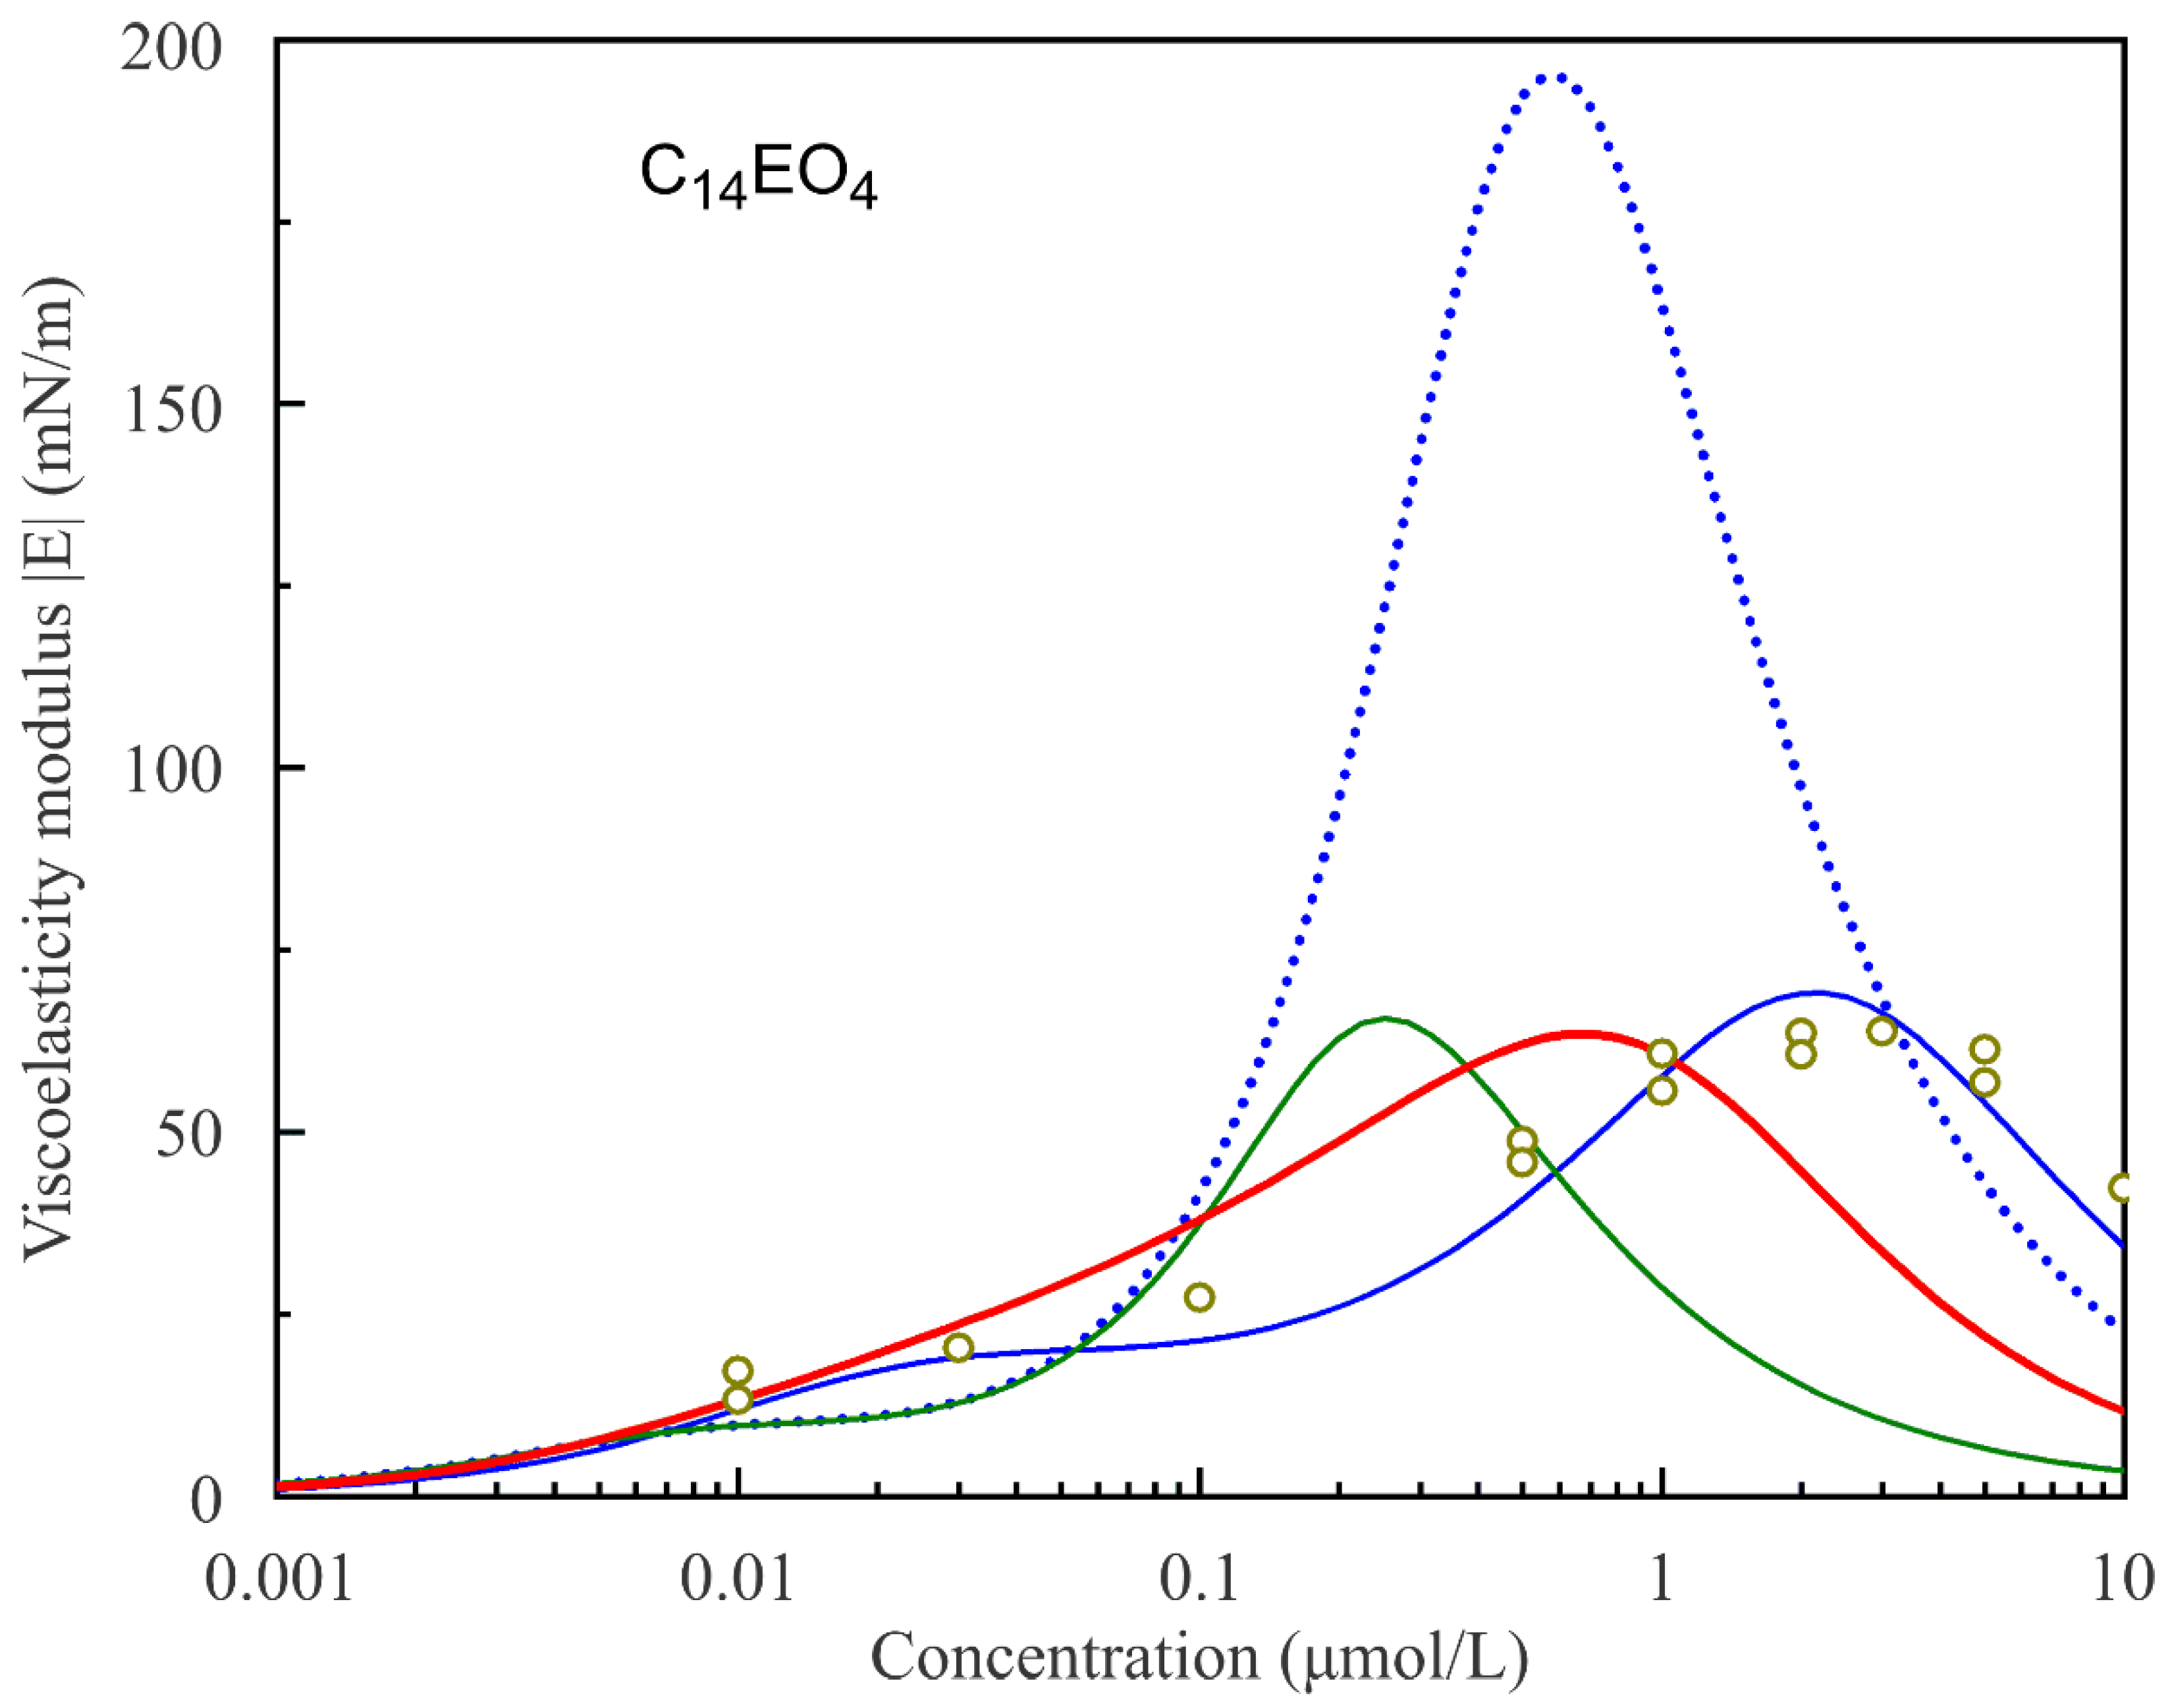
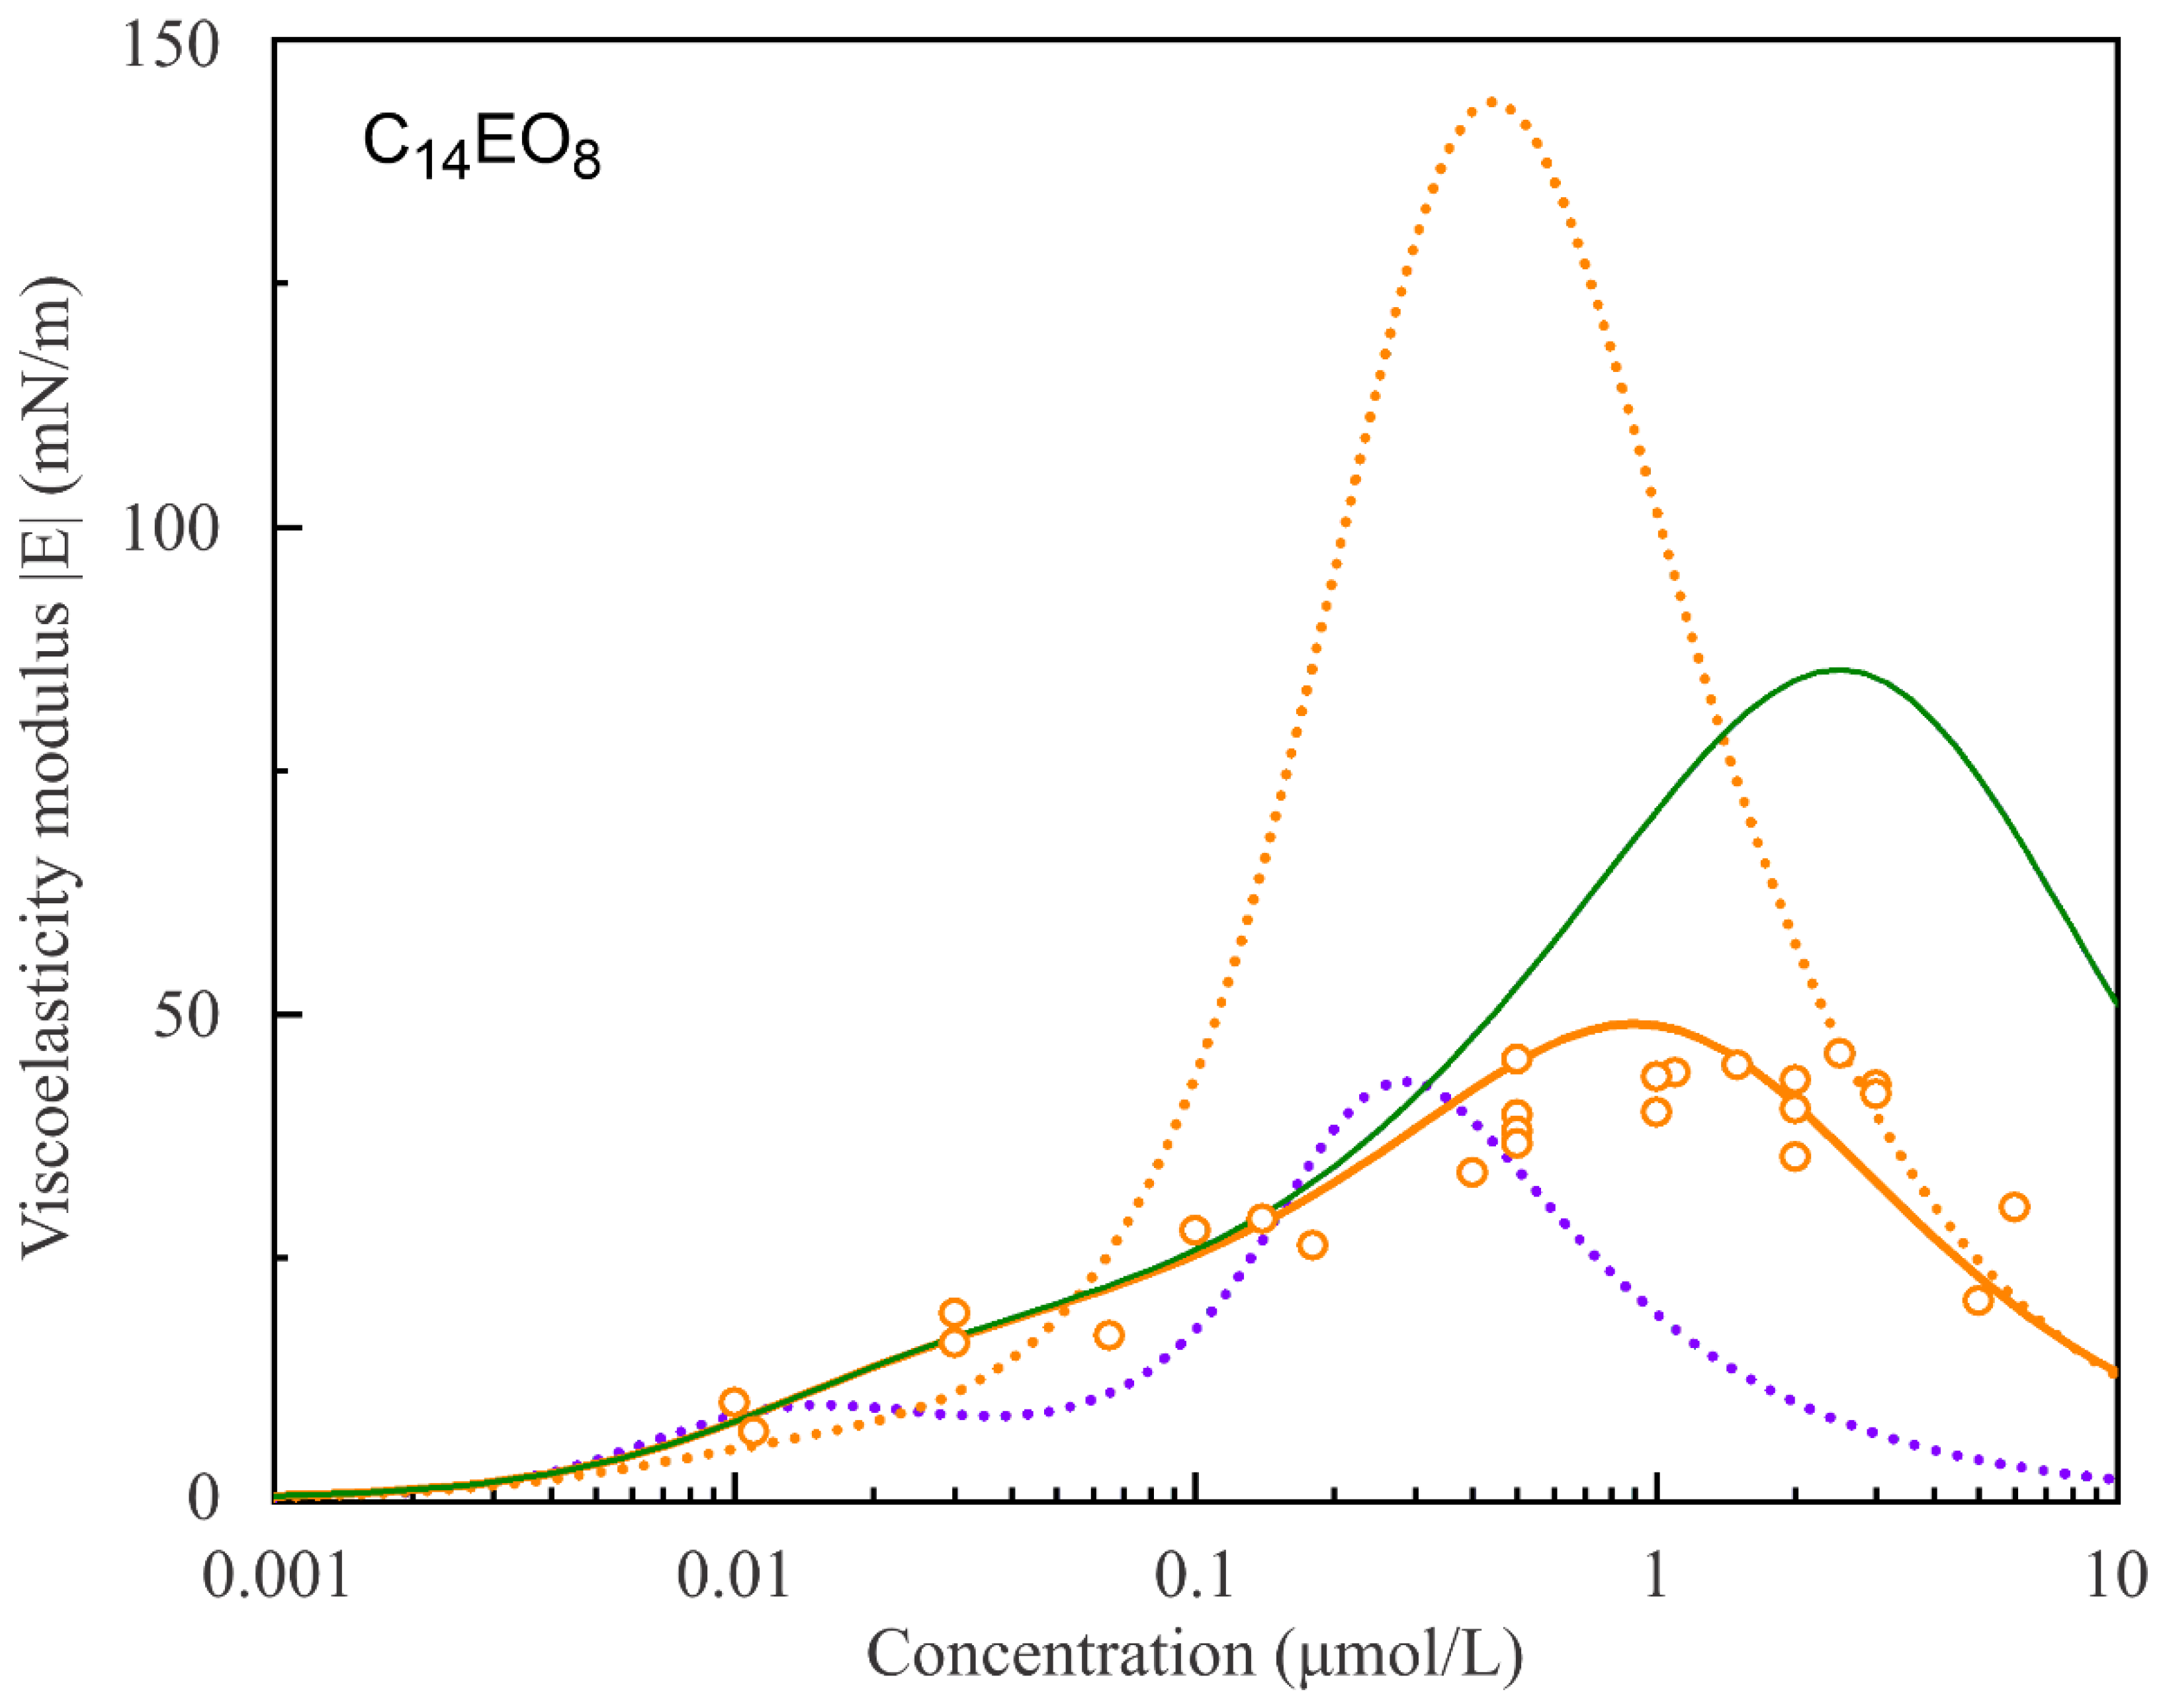
Figure 8 and
Figure 9 show the experimental values of the surface dilational visco-elasticity modulus |E| for C
14EO
4 and C
14EO
8 surfactant solutions as functions of solution concentrations measured at a fixed frequency of 0.1 Hz. The respective theoretical curves are calculated according to the reorientation model assuming various number of states. It is seen that the two-state model cannot reproduce the experimental values for both surfactants. In contrast, the model with a larger number of states (s = 5 for C
14EO
4 and s = 10 for C
14EO
8) predicts the values of the visco-elasticity modulus rather well within the experimental error.
The experimental data in
Figure 8 and
Figure 9 are described better using the diffusion coefficient values D = 5.0·10
−9 m
2/s and 8.7·10
−9 m
2/s, respectively. This diffusion coefficient is several times larger than the expected value for these surfactants (3.5·10
−10 m
2/s [
32]). The higher diffusion coefficient value can be explained by the probable influence of convection in the cell around the bubble, which can accelerate the mass exchange between the bubble surface and bulk solution.
The green solid line in
Figure 8 illustrates the attempt to fit the experimental data using the Model R with s = 2 and the parameters listed in
Table 1. It is seen that the curve with the value of the diffusion coefficient D = 1.5·10
−7 m
2/s selected so as to match the maximum experimental value of the dilational visco-elasticity modulus |E| corresponds to much lower surfactant concentration. Moreover, the red solid line in
Figure 8 corresponds to the calculations performed using the Model R0 with the same parameters that correspond to the red solid line in
Figure 1, and the diffusion coefficient value D = 2.3·10
−8 m
2/s is selected so as to match the experimental maximum value. It is seen that, while Model R0 is capable of yielding the satisfactory coincidence with the experimental values of surface tension, its agreement with the experimental rheologic characteristics of the monolayer is rather poor.
The green solid line in
Figure 9 was calculated for s = 10 with D = 5·10
−10 m
2/s. It is seen that the agreement with the experiment is significantly worse than that of the solid orange curve optimised with D = 8.7·10
−9 m
2/s, but the trend remains the same and the theoretical curve remains rather close to the experimental data. In contrast, for s = 2, the variation of the diffusion coefficient even within a much larger range does not significantly improve the agreement with the experiment. For example, the violet dotted line in
Figure 9, calculated for s = 2 with an unrealistically high D = 2·10
−7 m
2/s, shows the approximately correct maximum value of the visco-elasticity modulus, but is shifted to a more than one order of magnitude smaller concentration. These numerical examples demonstrate once again that the visco-elasticity modulus is much more sensitive to the number of molecular states than to the diffusion coefficient, and that the reorientation models with larger numbers of states reproduce the experimental data much better regardless of the diffusion coefficient.
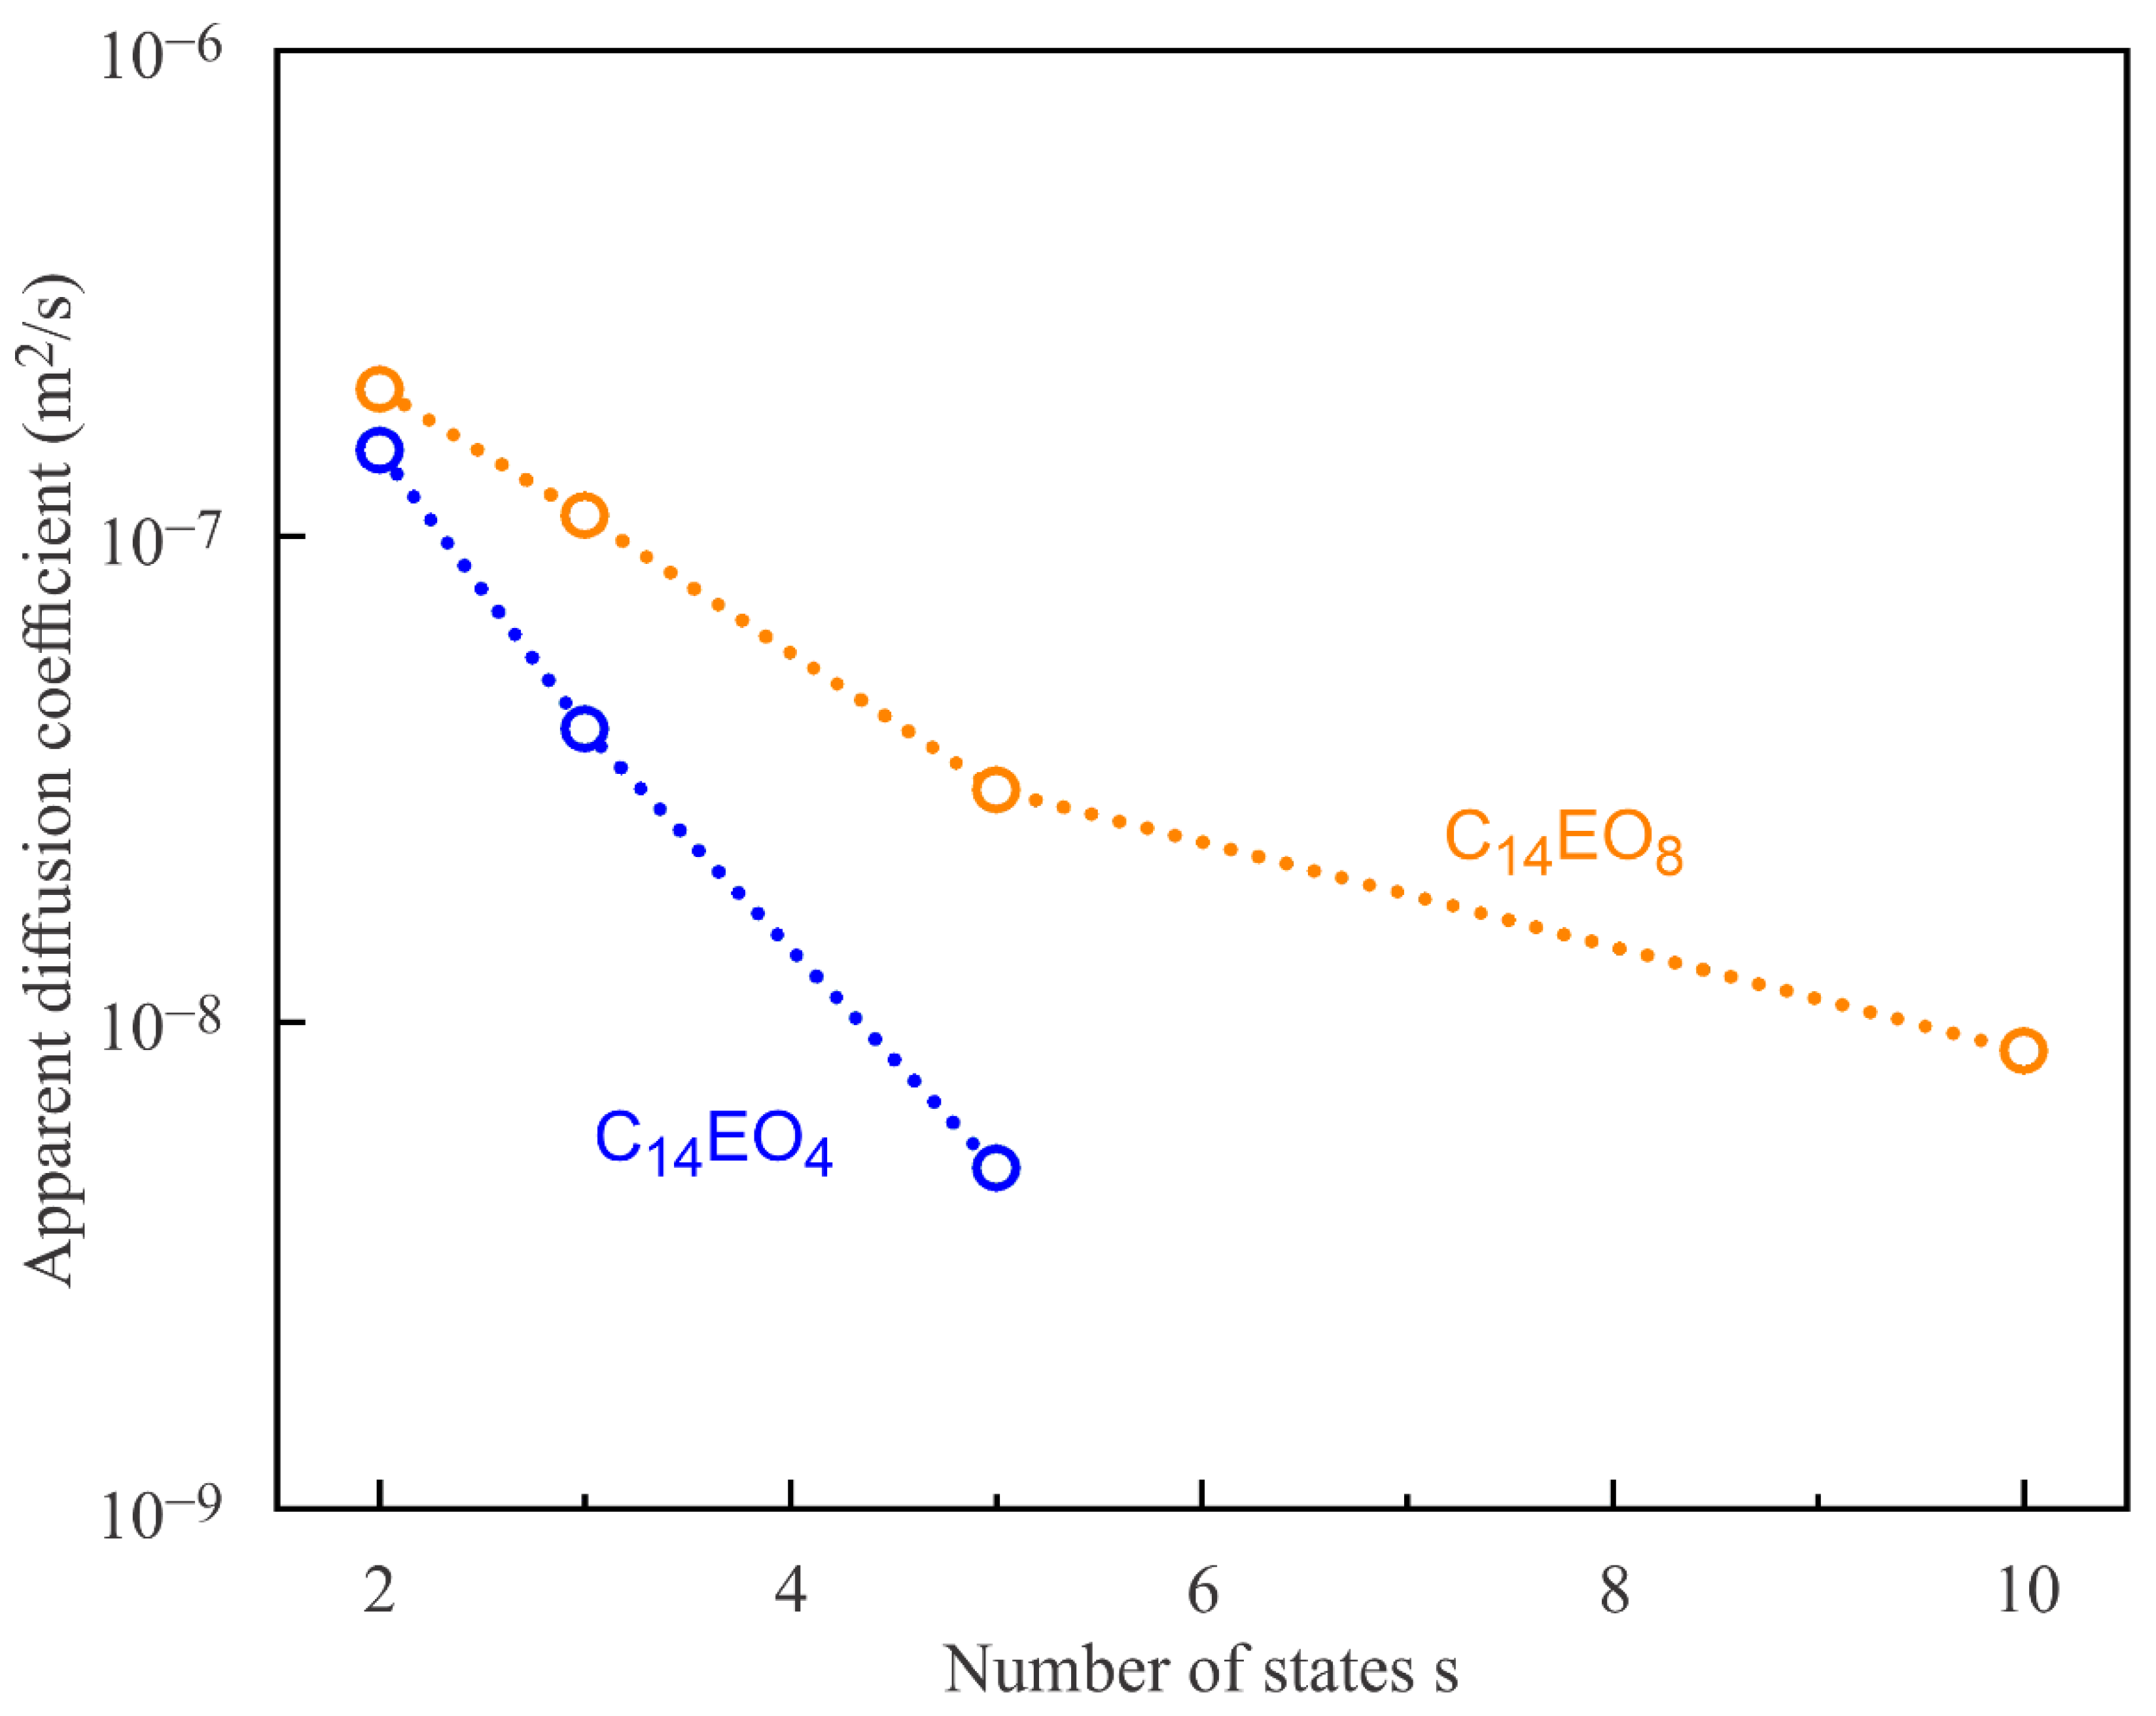
Shown in
Figure 10 are the diffusion coefficient values calculated for different s using the parameters listed in
Table 1 and
Table 2. The diffusion coefficient values were adjusted so as to match the maximum of the experimental visco-elasticity modulus values |E|, irrespective of the position of this maximum on the concentration axis, cf. the green and blue solid lines in
Figure 8, or the violet dotted line and yellow solid line in
Figure 9 and
Figure 10 clearly demonstrate the trend towards lower values of the apparent diffusion coefficient with the increasing number of adsorption states s, i.e., they change toward physically expected values common for molecules of this size. As the values of the diffusion coefficient obtained in this way are much larger than the physical values, we call them apparent. Note that the obtained large D values can be explained on the one hand by a not yet perfect adsorption model assuming a smaller number of states, and on the other hand, by an enhanced transport caused by convections within the measuring cell.
5. Conclusions
We have presented a further development of the reorientation adsorption model. The assumption that surfactant molecules can adsorb at the interface in two possible states was superior over the Langmuir and Frumkin model in particular for surfactants with a rather larger head group. However, it turned out that the interpretation of a complete set of interfacial layer properties, including the adsorption kinetic and dilational interfacial rheology, leads to shortcomings, as the results for a number of C
nEO
m surfactants recently demonstrated [
19]. While the equilibrium surface tension isotherm is rather insensitive to changes in the conformation of adsorbed molecules, in particular, the dynamic properties change with the molecular structure and the surface coverage remarkably. Additional experiments at oscillation frequencies higher and lower than 0.1 Hz will provide more accuracies into the determination of optimum model parameters.
The presented generalization of the reorientation model with two adsorption states, proposed originally in 1994 in [
7], to a model with multiple adsorption states simultaneously reproduces the surface tension isotherm of the studied aqueous C
14EO
4 and C
14EO
8 solutions virtually perfectly. However, assuming an entire spectrum of conformations adsorbing in a coexisting way at the solution/air interface also allows a very good representation of the dilational surface viscoelasticity as a function of bulk concentration. The refined multistate adsorption model allows s possible adsorption states with a constant difference between neighbouring states as given by Equation (4). Various molecular simulations have shown that the poly (ethylene oxide) chain is rather flexible so that even short EO chains can assume various conformations [
20,
24]. In the present work, we considered up to s = 10 conformations for the two studied surfactants. It was found that the assumption of more than two adsorption states improves the quality of fitting the model to the experimental data of the adsorption isotherm and, more importantly, of the viscoelasticity values. The comparison between the model and the experimental data, mainly the dilational viscoelasticity over the entire concentration range, leads to the conclusion that C
14EO
4 can assume at least 5 conformations in the adsorption layer, while the C
14EO
8 can assume at least 10 different adsorption states for an optimum structure of the adsorption layer as a function of the changing surface coverage. In fact, it is plausible to assume that the molecules with a long EO chain can assume a larger number of conformations, which would result in higher s values; the related effects are planned to be considered in further studies.
Future work should be dedicated to the analysis of more literature data with the multiple adsorption model proposed here, or to the production of more experimental data in particular on dynamic interfacial properties of surfactants of the C
nEO
m type. These surfactant molecules are most suitable for a multistate adsorption, while other types tending to a reorientation, but having a non-flexible head group, will better follow the classical reorientation model [
7].
In addition to experimental activities, the continuation of molecular dynamics simulations such as performed, for example, by Lee [
21] appears promising. Even more information can be expected from the combination of different simulation tools, as proposed by the Blankschtein team [
24]. In their approach, they combined classical molecular dynamics (MD) simulations with a molecular-thermodynamic theory.


 ,
, 


