Article

Stability of Rhodamine Lactone Cycle in Solutions: Chain–Ring Tautomerism, Acid–Base Equilibria, Interaction with Lewis Acids, and Fluorescence

by
Olena M. Obukhova
1,
Nikolay O. Mchedlov-Petrossyan
2,*,
Natalya A. Vodolazkaya
2,
Leonid D. Patsenker
3 and
Andrey O. Doroshenko
4
1
Institute for Single Crystals, National Academy of Science of Ukraine, 61001 Kharkiv, Ukraine
2
Department of Physical Chemistry, V. N. Karazin Kharkiv National University, 61022 Kharkiv, Ukraine
3
Department of Chemical Sciences, Ariel University, Ariel 40700, Israel
4
Department of Organic Chemistry, V. N. Karazin Kharkiv National University, 61022 Kharkiv, Ukraine
*
Author to whom correspondence should be addressed.
Submission received: 29 December 2021 / Revised: 9 February 2022 / Accepted: 15 February 2022 / Published: 24 February 2022

Abstract

:
The equilibrium between different tautomers that can be colored or colorless is an important feature for rhodamine dyes. Presently, this phenomenon is mostly discussed for rhodamine B. Herein, we studied the tautomerism and acid–base dissociation (HR+ ⇄ R + H+) of a set of rhodamines in organic media. Form R is an equilibrium mixture of the colored zwitterion R± and colorless lactone R0. Absorption spectra in 90 mass% aqueous acetone reflects the correlation between the dyes structure and the equilibrium constant, KT = [R0]/[R±]. Increase in the pKa value on transferring from water to organic solvents confirms the highly polar character of the R± tautomer. To reveal the role of the solvent nature, the tautomerism of an asymmetrical rhodamine, 2-(12-(diethyliminio)-2,3,5,6,7,12-hexahydro-1H-chromeno[2,3-f]pyrido[3,2,1-ij]quinolin-9-yl)benzoate, was examined in 14 media. This chain–ring tautomerism is an intramolecular acid–base reaction; the central carbon atom acts as a Lewis acid. The interaction with other Lewis acids, Li+, Ca2+, Mg2+, and La3+, results in rupture of lactone cycle. In polar solvents, lactones undergo photocleavage resulting in formation of highly fluorescent R±, whereas the blue fluorescence and abnormally high Stokes shift in low-polar media may be explained either by another photoreaction or by spiroconjugation and charge transfer in the exited state.

1. Introduction

The number of various applications of the fluorescent rhodamine dyes in different fields of science and technique is huge. The behavior of rhodamine dyes in different media, including macro-heterogeneous systems and nano-dispersed objects, is heavily dependent on the state of the zwitterion–lactone equilibrium. This article is aimed to better understand the chain–ring tautomerism in the rhodamine molecules by using dyes of different structure and various solvents.
Rhodamines belong to the mostly used organic dyes. Owing to their unique fluorescent properties, they find numerous applications in various fields of chemistry and related sciences [1,2,3]. They are used for creating pH-sensitive hydrogels [4], chemosensors for metal ions [5], as molecular thermometer for nanoparticles for optical hyperthermia [6], for creating the fluorescence images of core–shell magnetic nanoparticles used in hyperthermia therapy [7], etc.
The state of protolytic equilibrium of rhodamines containing a carboxylic group in position 2′ is of key role in their behavior in polyelectrolyte solutions [8], in silicate layers [9], in dip-coated silicate-based films [10], as well as for the control of the photocatalytic degradation of rhodamines on solid catalysts [11]. It is also of importance for using rhodamines as interfacial indicators for the liquid–liquid interface [12,13,14,15,16]. Fluorescence of rhodamines and their photophysical properties in the excited state were examined in a variety of solvents of different natures [17,18,19,20,21,22,23] and in the gas phase [24,25].
In addition, rhodamine lactame derivatives are used as indicators in surfactant micelles [26], for catalysis of dichlorodiphenyltrichloroethane (DDT) dechlorination [27], for creating a chemidosimeter for Cu(II) [28,29], and for many other purposes. Recently, a new class of highly emissive and rather unusual coupled rhodamines, aminobenzopyrano-xanthene dyes, was described in detail [30,31,32,33,34,35].
The above-cited articles are only few examples of numerous utilizations of rhodamines. Some other important applications of rhodamines, mostly in surfactant-based colloidal solutions and related systems, were discussed in our previous article on the properties of rhodamine dyes in micellar solutions [36].
Accordingly, acid–base properties and chain–ring tautomerism have been the subject of much research over the past decades. Main publications focused on these equilibria are as follows.
Ramette and Sandell [37] considered the stages of protonation of rhodamine B in aqueous media at different acidities, up to formation of triple-charged cations, as well as distribution of the neutral species R between water and benzene. In the last solvent, the molecular form exists as a lactone tautomer, R0 (Chart 1), which is colorless owing to the sp3-hybridization of the nodal carbon atom, whereas in water the zwitterions, R±, predominates. Its absorption band in the visible region is very close to that of the cation HR+. The dimerization of both zwitterion and cation was examined [37].
Some further studies on rhodamine B were conducted using spectrophotometric and fluorimetric methods in non-aqueous solvents [17,38,39,40,41,42,43,44,45]. In the case of alcohols, the absorption bands of the cationic and neutral forms are better resolved, whereas in either nonpolar or polar non-hydrogen bond donor (non-HBD) solvents the chain–ring equilibrium is almost completely shifted from R± and the colorless tautomer, R0. Hinckley et al. [42] estimated the tautomeric equilibrium constants in a series of alcohols and demonstrated a multi-parameter correlation between the logarithm of this constant and the alcohols’ properties. Thermochromism of rhodamine B in solutions was also examined [40,42,46].
Faraggi et al. [41] determined the p K a value of rhodamine B in methanol and ethanol as 7.6 and 8.7, respectively, which is substantially higher than that in water (3.22) [47]. Most of the quantitative studies of protolytic properties and tautomerism have been carried out for rhodamine B. The X-ray analysis in solid state was performed for the cationic [48] and lactonic structures [49,50].
For other rhodamines, there are also important data in the literature. So, Lopez Arbeloa et al. [51] determined the p K a value of rhodamine 19 (N,N′-diethyl-2,7-dimethylrhodamine) in ethanol. Barigelletti determined the constant of the tautomeric equilibrium or rhodamine 101, a julolidine analogue of rhodamine B, in propionitrile–butyronitrile binary solvent within a wide temperature range [52]. Watarai and associates [12,13,14] studied in detail the lactonization of octadecylrhodamine B on the water/toluene interface, including the kinetics of the lactone cleavage.
It should be noted that discoloration of rhodamines may be caused not only by the closing of the lactone cycle. In highly alkaline solution, the nucleophilic attachment of the HO ion to the central carbon atom occurs [53]. Irreversible discoloration may be caused, in addition to photobleaching, by sonication [54], electrochemical processes at electrodes [55], and gamma-irradiation [56].
Earlier we have studied the ionic equilibria of rhodamine B and several other rhodamines in aqueous [47,57] and organic [58,59,60,61] media, as well as in concentrated sulfuric acid [62]. The p K a values of rhodamine B were determined spectrophotometrically in water–salt solutions within a wide range of ionic strength [47]. Further application of chemometric methods for treatment of potentiometric titration data have demonstrated that in aqueous solutions with dye concentrations >10−2 M, not only species R2, H2R22+ and HR2+, but even R3 and HR3+ can exist [57]. Whereas in ca. 10−5 M dye solution, such aggregation processes are negligible at low ionic strength, in 4.6 M NaClO4 solution the dye completely transforms into dimer R2 at 1 × 10⁻⁵ M [57].
Such processes reduce the applicability of rhodamines as laser dyes. The driving forces of formation of dimeric and sub-colloidal particles are Van der Waals and hydrophobic interactions. In organic solvents of high and medium polarity, such complex species are usually unlikely [10,42,51,58,59,60,61].
The p K a values of the single-, double-, and triple-charged cations of rhodamine B were determined as 3.22 (thermodynamic value) [47], 0.78 (1 M KCl + HCl solutions) [47], and −7.40 (H0 scale) [62], respectively. In organic media, dimerization is strongly suppressed. In water–acetone and water–methanol [58], water–DMSO [59,60] and in neat organic solvents [61], the p K a s and tautomerization constants were determined by our group.
The ability to lactonization is obviously connected with the charge distribution in the xanthene moiety. This, in turn, depends on the structure of the chromophore, especially on the nature of 3,6-substituents. Hence, a further investigation of the influence of non-aqueous media on the state of tautomeric equilibria of rhodamines is necessary.
It is clearly of importance to explore a sufficiently wide range of compounds in order to reveal the regularities of the chain–ring tautomerism of rhodamines. Therefore, the present work was aimed to investigate a series of rhodamine dyes, of both symmetrical and asymmetrical structure. The study of tautomerism was carried out in 90 mass% aqueous acetone, entire alcohols, and several non-HBD solvents. Particular attention was paid to the asymmetric 2-(12-(diethyliminio)-2,3,5,6,7,12-hexahydro-1H-chromeno[2,3-f]pyrido[3,2,1-ij]quinolin-9-yl)benzoate. In this case, an attempt was made to explain the effect of the medium on the chain–ring equilibrium without taking into account a set of traditional solvent descriptors. In acetonitrile, a special type of lactone cleavage due to ion association was investigated. Another part of the work has been performed to shed light upon the problem of the blue fluorescence of lactones in benzene [20,21,22,37]. When studied earlier, it was explained by another type of lactone ring rupture [63].
It was assumed that this versatile study would expand the understanding of rhodamines tautomerism and rationalize their use in various fields of science.
The structural formulae of the dyes under study are depicted as zwitterions (Chart 2).
The structures are conventionally depicted as carbenium ions with the positive charge localized at the C9 atom. Of course, the real charge distribution within the xanthene moiety depends on the 3- and 6-substituents.

2. Results and Discussion

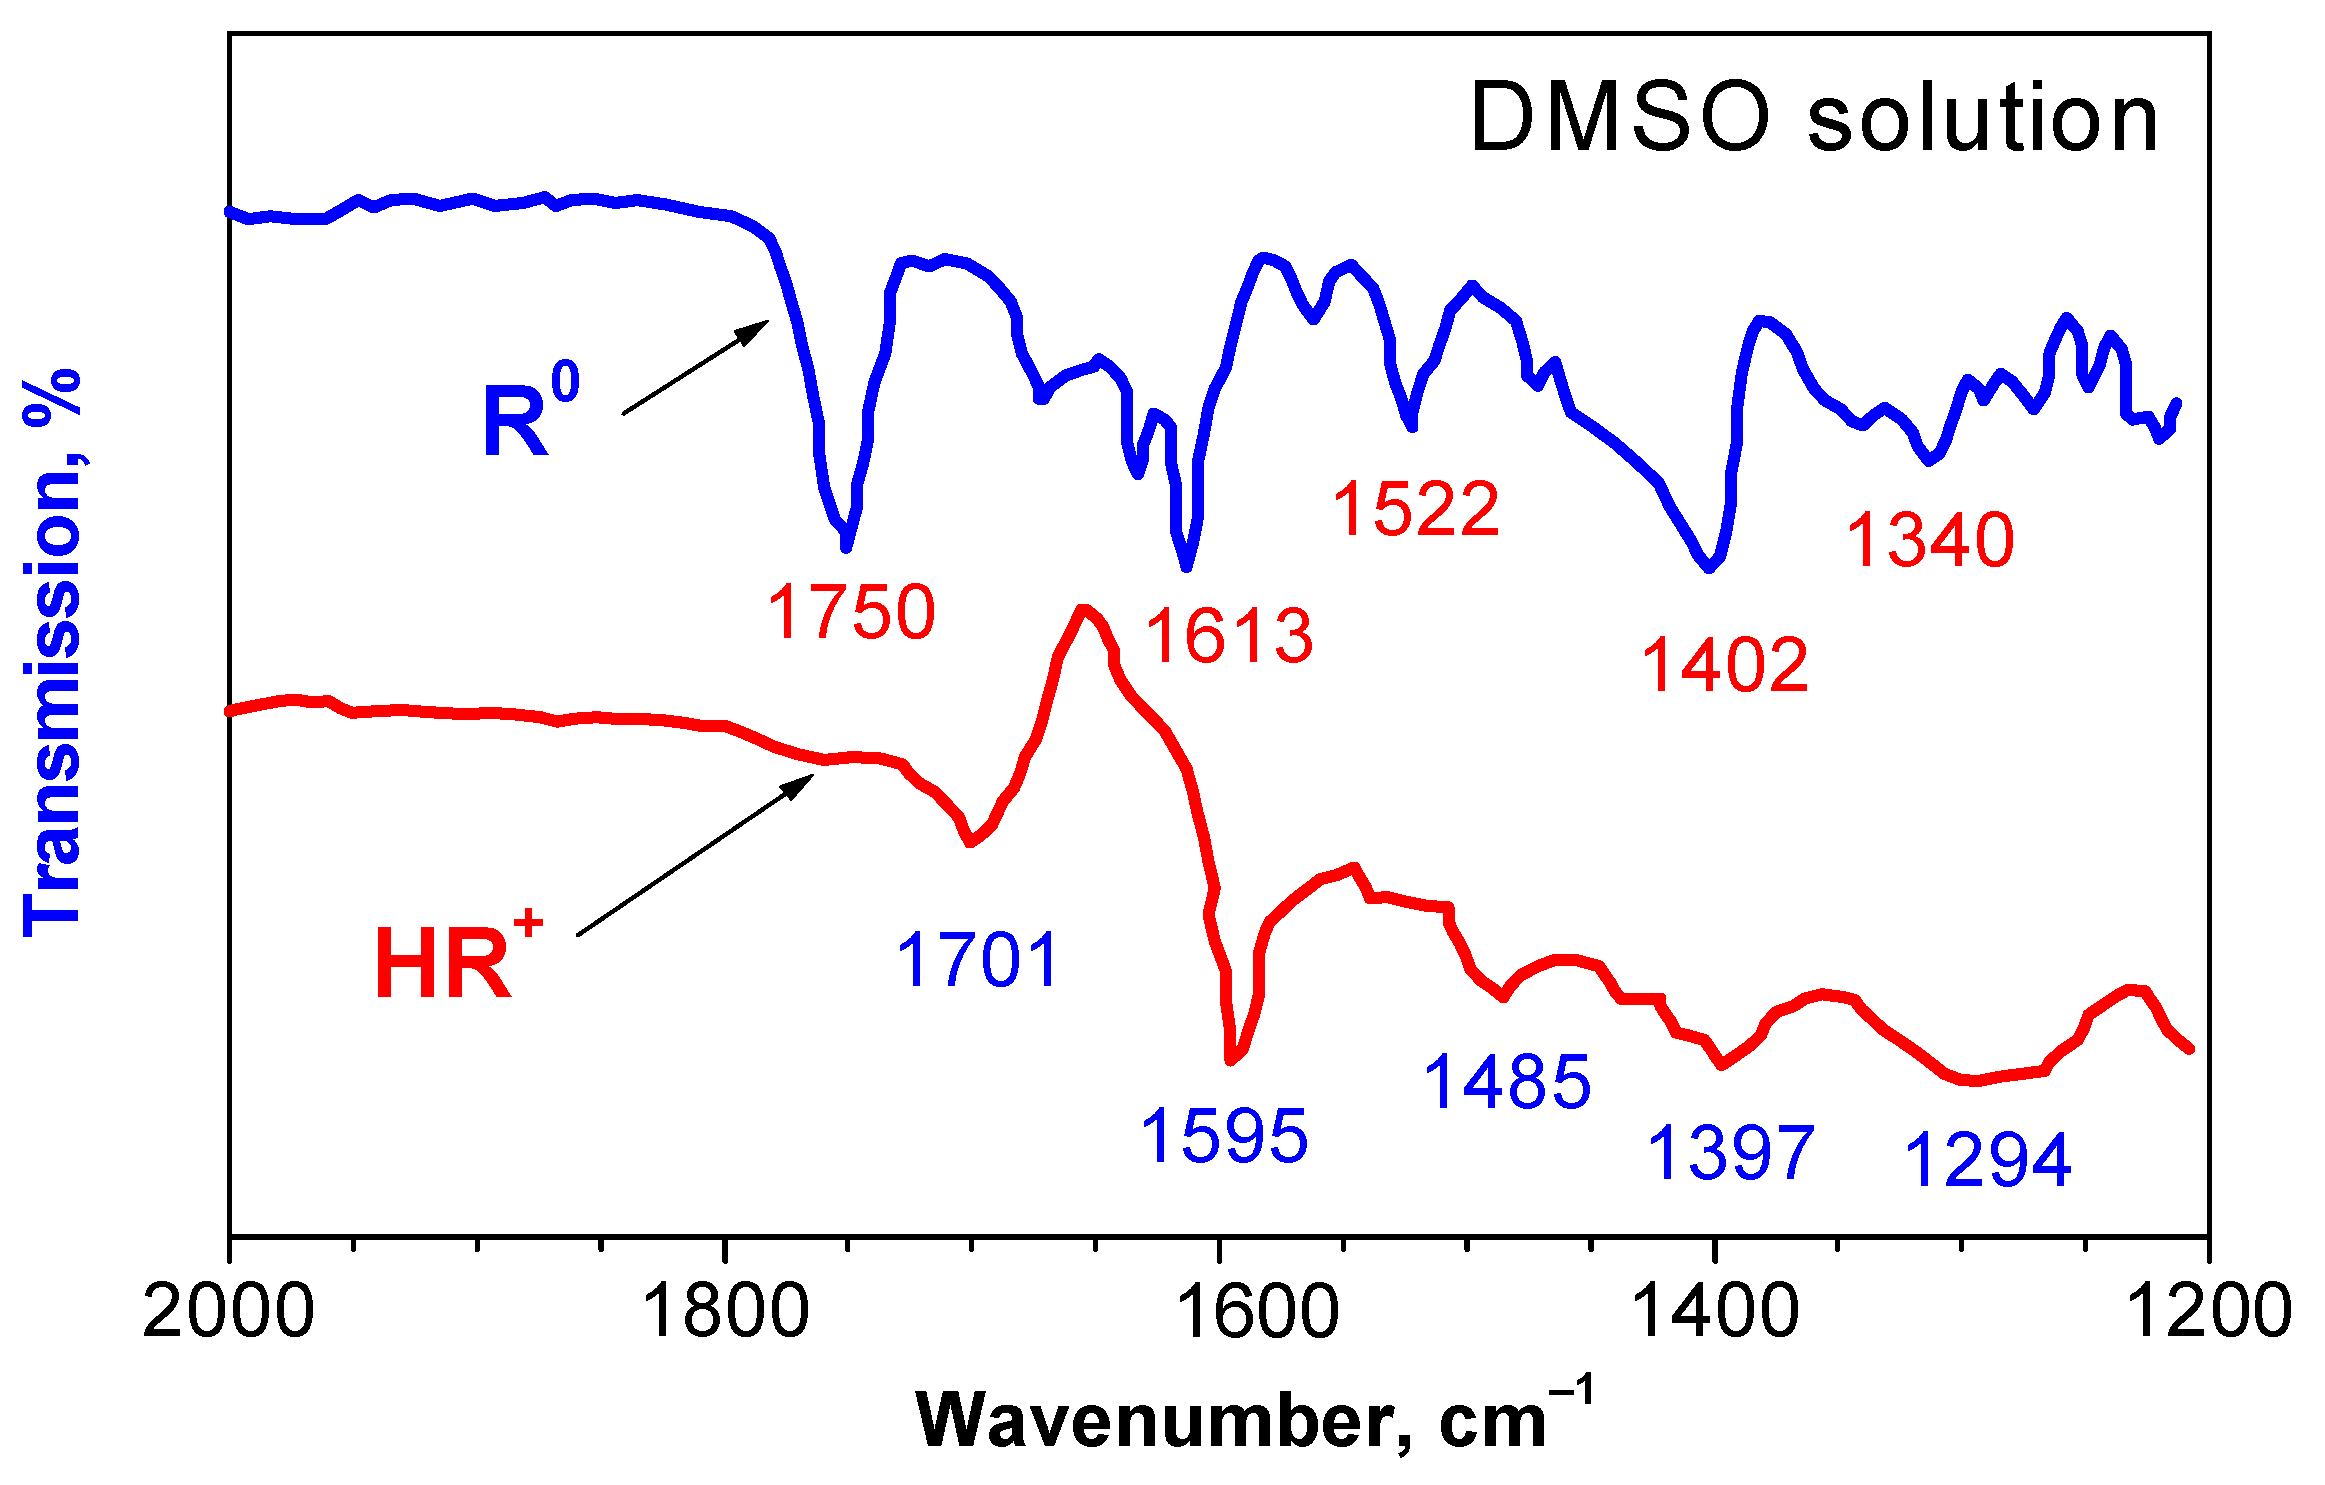
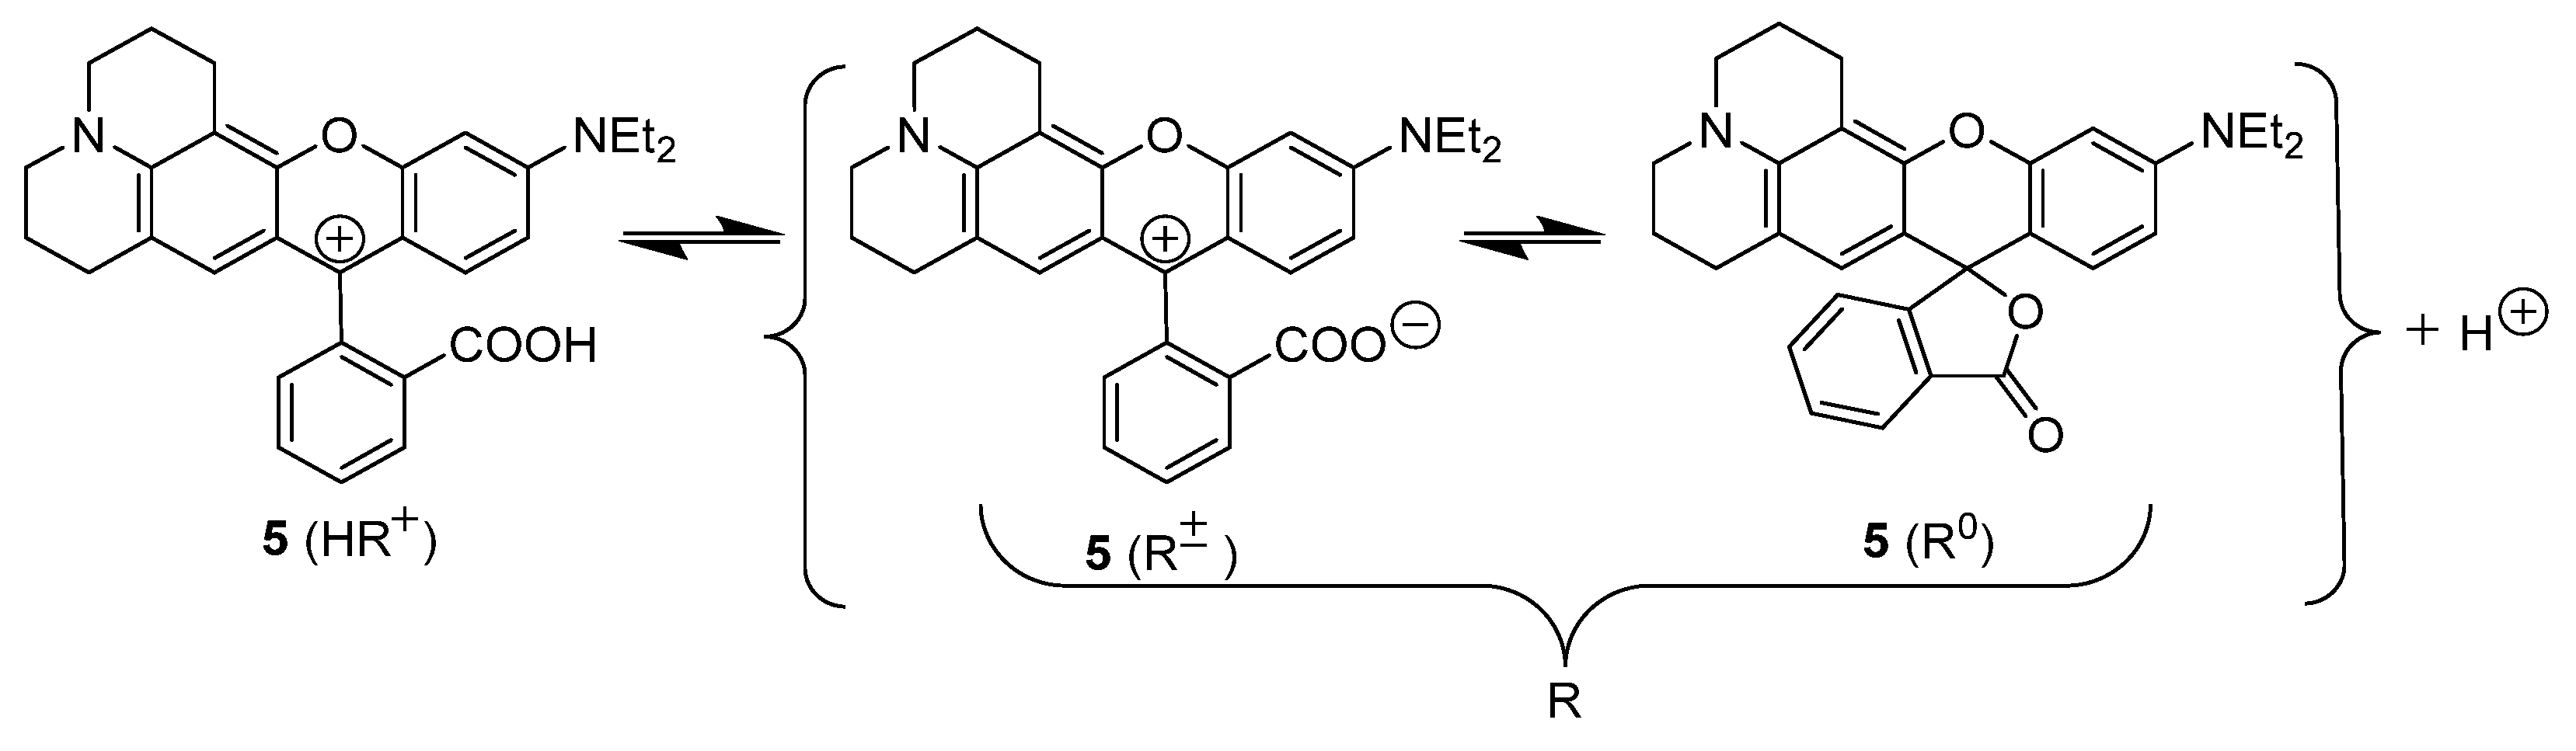
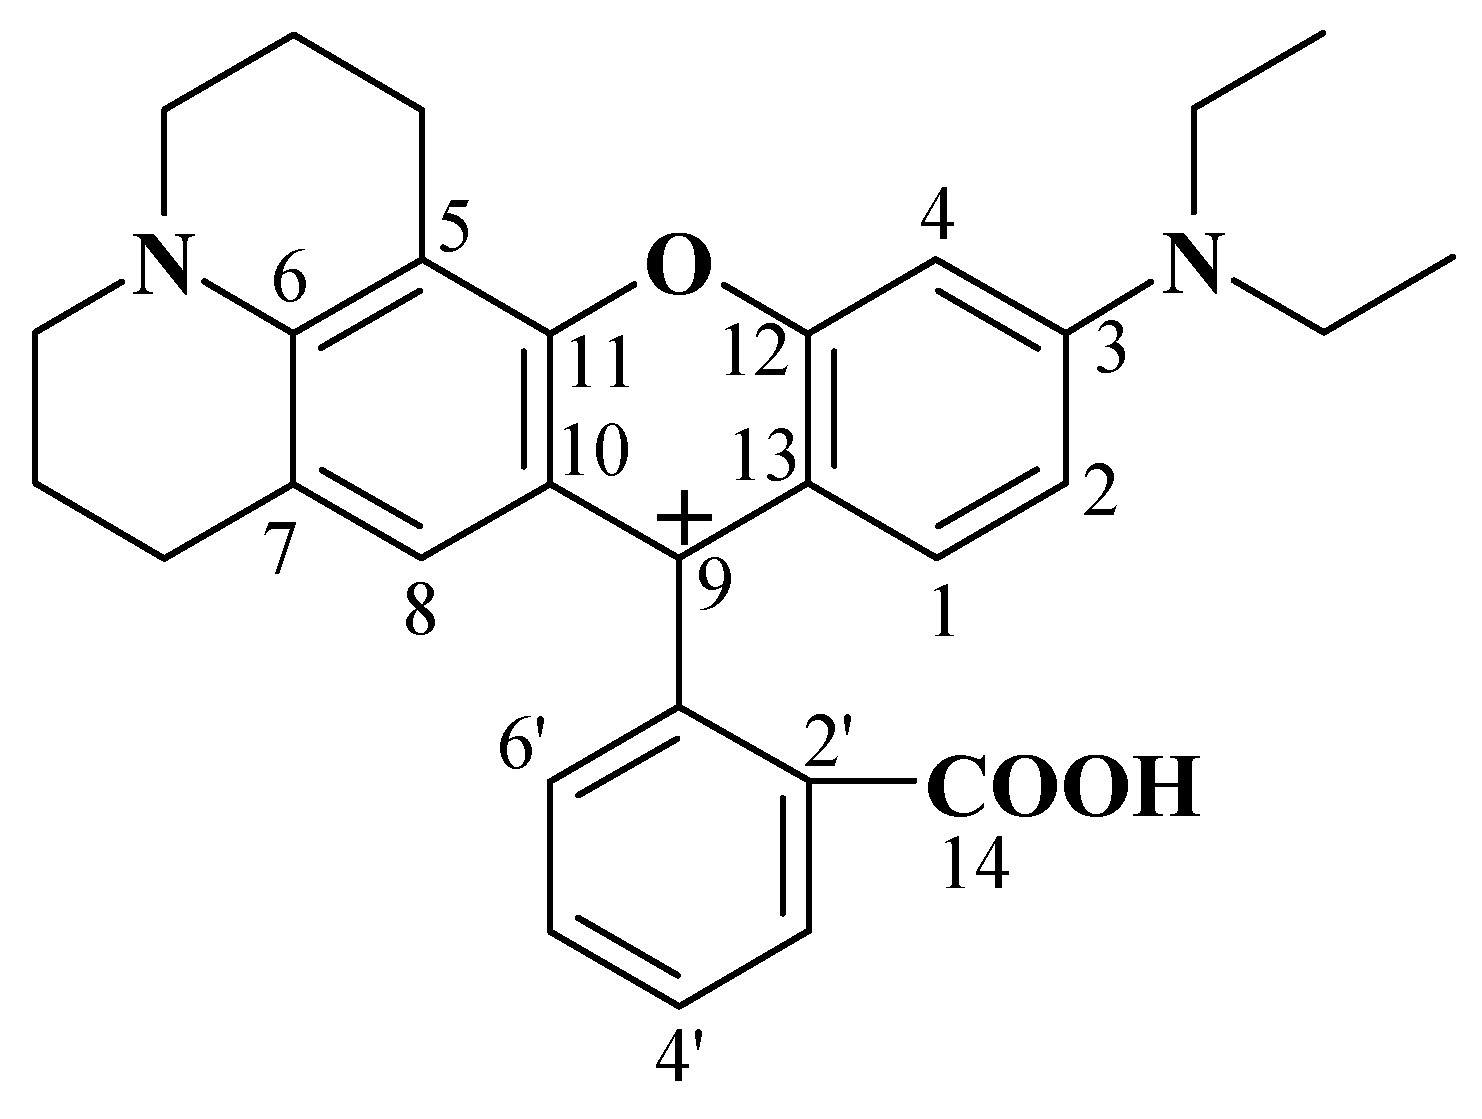
2.1. Identification of the Equilibrium Structures in Solution

By analogy with the well-studied dye rhodamine B (1), the cationic, zwitterionic, and lactonic structures are presented in Chart 3 for an asymmetrical rhodamine dye 5, which in cationic form, HR+, should be named as 2-(12-(diethyliminio)-2,3,5,6,7,12-hexahydro-1H-chromeno[2,3-f]pyrido[3,2,1-ij]quinolin-9-yl)benzoic acid.
The most valuable information about the state of the dye is provided by electronic absorption spectra. It is well known from the numerous studies on rhodamine B, that the main absorption band of the cationic form HR+ in the visible region is shifted toward the red as compared with that of its zwitterion R±, whereas the molar absorptivities of these species are approximately the same owing to the identity of the chromophoric system [37]. This was proved by the spectra of rhodamine B (1) in water, where the fraction of the lactone is negligible and the neutral form is represented by the zwitterion [37,42,47,57,61]. The bathochromic shift that occurs at protonation of the carboxylate group, COO  COOH, is caused by a slight influence of the charge of the 2′-substituent on the xanthenes moiety. Such effects were numerously observed also for hydroxyxanthene dyes [59,61]. The magnitude of this effect depends first of all on the nature of the solvent, increasing from water (2–3 nm) [37,42,57] to organic liquids [59,60,61].
On the contrary, the molar absorptivity of the neutral form drops sharply on going from water to organic solvents, especially non–HBD ones, or ‘aprotic’ solvents, such as acetone, acetonitrile, DMSO, etc. Normally, this is ascribed to the formation of the lactone R0.
Comparison of the spectra of HR+ and R forms for dye 5 in different solvents demonstrate small solvatochromic shifts of the bands. The R band is always somewhat blue–shifted as compared with that of HR+ one. The variations in the molar absorptivity value of the cation at the band maximum, E max , did not exceed several percent when going from one solvent to another. In contrast, the E max values of neutral form, R, display changes dramatically depending on the nature of the solvent, down to almost colorless solution. This reflects the mobility of the position of tautomeric equilibrium between the colored zwitterion R± and colorless lactone R0 (Chart 2). The visible spectra of compound 5 were measured in 14 different organic solvents. In Figure 1, the spectra in n-butanol, tert-butanol (2-methyl-propane-2-ol), acetonitrile, and DMSO are presented.
The neutral form of the dye, R, was dissolved in entire solvents; to obtain the form HR+ the solution was acidified with 1 drop sulfuric acid. The well documented process of dimerization of rhodamines is pronounced in water [37,47,57] but does not manifest itself in organic solvents. Our measurements showed no deviations from the Bouguer–Lambert–Beer law if the acidity is varied by HCl, alkali, or a buffer.
We additionally proved the lactone structure of the colorless species of rhodamines using infrared spectra. The absorption of dye 5 under conditions of complete predominance of the species R0 and HR+ are shown in Figure 2. A sample of dye 5 in neutral form, R, was dissolved in DMSO. Though the concentrated (0.03 M) dye solution was colored due to small fraction existing as zwitterion R±, the molar absorptivity in the visible was rather low. Additionally, an addition of equivalent KOH amount does not affect the IR spectrum.
For the cationic form, the band at 1701 cm−1 corresponds to the stretching vibration of C=O group of COOH and the bands at 1595 and 1485 cm−1 can be ascribed to the aromatics. Corresponding bands at 1700, 1590–1507, 1484, and 1366 cm−1 in DMSO and similar vibrations in the solid state (KBr pellets) were observed for rhodamine B (1) [60]. An intensive band in the region of 1750 cm−1 (Figure 2, curve 2) refers to the stretching vibrations of C=O group of the lactone, in line with the expected structure of the R0 species; for rhodamine B (1), rhodamine 19 (N,N′-diethyl-2,7-dimethylrhodamine), and rhodamine 110 (unsubstituted rhodamine), and the bands 1752, 1750, and 1749 cm−1, respectively were observed [60]. The vibrations in the regions of around 1613, 1522 cm−1 1340, and 1402–1397 cm−1 relate to the aromatics and C–Aryl bond, respectively, such as that for rhodamine B (1) [60]. Addition of one drop of concentrated sulfuric acid to the cuvette leads to disappearance of the aforementioned band around 1750 cm−1; the new band near 1701 cm−1 corresponds to the C=O stretching vibrations of the COOH group of the cation HR+, according to the literary data [64].
The formation of the lactonic tautomer in solution is also proved by the 13C NMR spectra in DMSO(d6) and CD3OD. In these experiments, dye 5 in the neutral form R was dissolved in the above solvents. The signal 173.3 ppm in methanol should be ascribed to the central carbon atom C9 in the sp2-hybridization state. This gives evidence for the R± structure. In DMSO(d6) this signal disappears and a new signal 79.16 ppm is observed, which corresponds to the same C9 atom in sp3-state, i.e., in the lactonic tautomer R0.
Signal positions in 13C NMR spectra of lactone and zwitterion of compound 5 were determined by comparison of the experimental spectra and calculated magnetic shielding in b3lyp/cc-pvdz/giao scheme. Corresponding data are presented in Table 1. Atom numbering scheme were selected analogously to our earlier publications (see Chart 4). Aliphatic carbon atoms positions are not shown. For examples of analogous correlations see http://cheshirenmr.info/index.htm (accessed on 17 February 2022).
Correlations between calculated carbon-13 nuclei magnetic shielding (DFT/GIAO) and signals positions in the experimental NMR spectra measured in DMSO-d6 (lactone) and in CH3OD (zwitterion), which were used for the signal positions identification, and scaling equations on their background are shown in Figure 3.
Data for some other rhodamines are available in the literature [60,64]. In the 13C NMR spectra of the salt HR+Cl of rhodamine B (1) in DMSO(d6) and methanol(d4), the signal 160.3 ppm is observed. For the zwitterion of rhodamine B in the same alcohol with adding NaOH it shifts toward 162.5 ppm, while in DMSO(d6) in the presence of NaOH the signal disappeared [60]. Both IR and 13C NMR spectra for several rhodamine dyes are in line with the characterization of the cationic, zwitterionic, and lactonic species of dye 5. The signals are gathered in Table 2. Ramos et al. [64] characterized a vast set of methyl, ethyl, and other alkyl esters of rhodamines B (1), 19, 101 (7), and 110 (unsubstituted) as salts with different anions: 1H and 13C NMR spectra in CDCl3 as well as infrared and visible spectra in solid state and ethanol were determined [64]. Some of the data are included in Table 2.
In this Table, the data reported by Ramos et al. for methyl and ethyl esters of the rhodamine B cation with Br, I, and ClO4 as counterions [64] are given for comparison. Previous data for the ethyl ester of rhodamine 19 [60] also agree with those by Ramos et al. [64]. However, comparison with data obtained now with compound 5 (Table 1) allows concluding that the earlier made attribution [60] of the signals C9 and C14 of the R± of 1 (Table 2) should be swapped.
As it follows from the above-mentioned proximity of the molar absorptivities of HR+ and R± in the same solvent, the difference in the intensities of the cationic and neutral forms of the dye is due to the partial transformation of the latter into a colorless lactone.
Hence, the extrathermodynamic assumption necessary for KT calculations consists of equating of E max of the zwitterion, R±, to that of the cation, HR+. Then, the absorption of the cation can be used for calculating the fraction of the zwitterion and thus for estimating the tautomeric equilibrium constant KT = [R0]/[R±]. For example, in the above four solvents (Figure 1) the KT values thus calculated are 0.19, 2.94, 48.3, and 70.7 for n-butanol, tert-butanol, acetonitrile, and DMSO, respectively. The last value agrees with the above IR and 13C NMR data in DMSO. Immediately striking is the difference in the influence of solvents on the state of the tautomeric equilibrium. Before analyzing this influence, we considered the molecular structure of rhodamines in a fixed solvent.

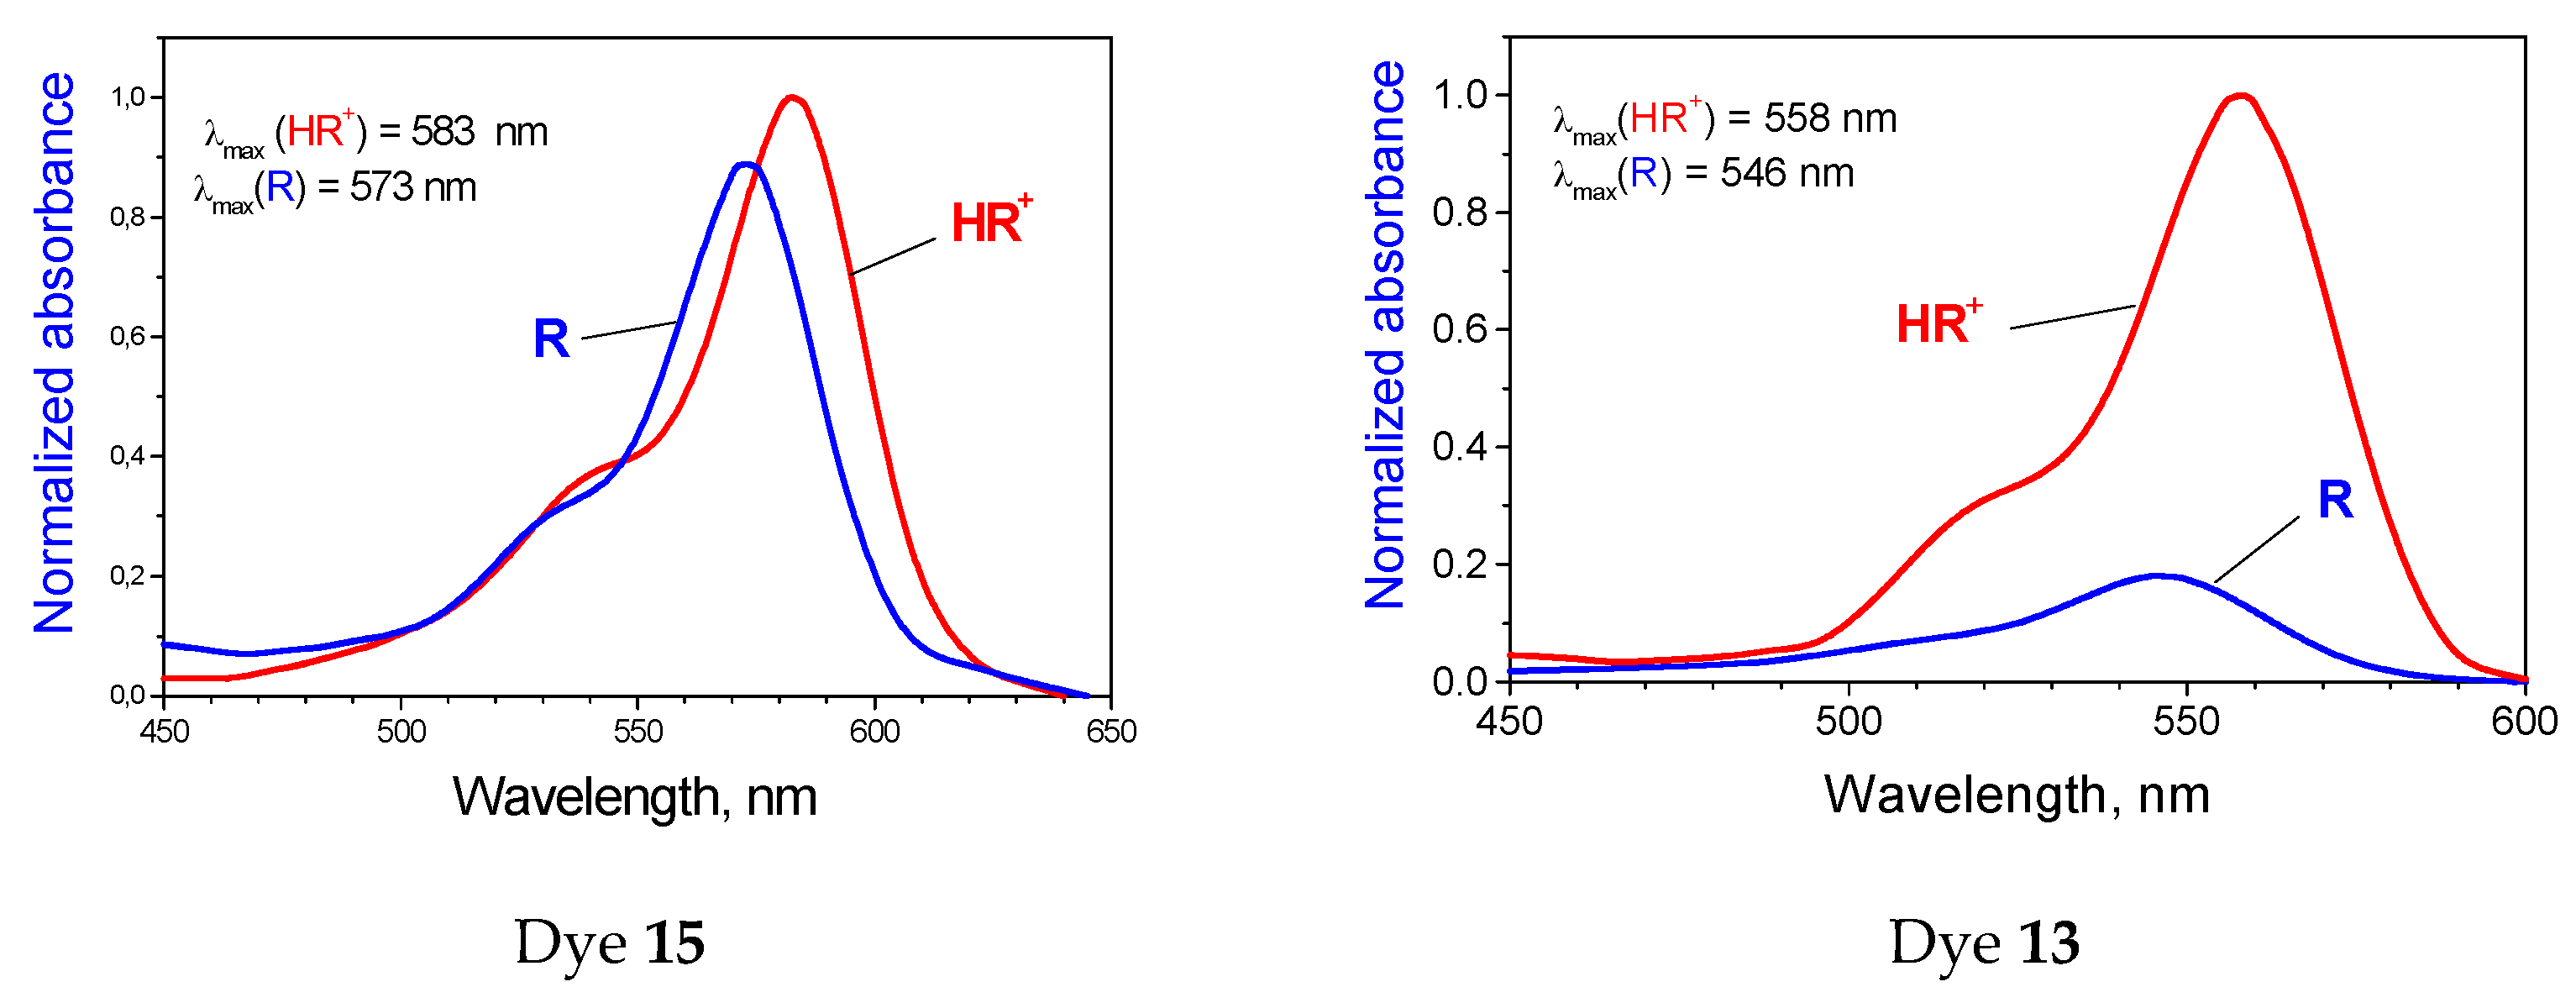
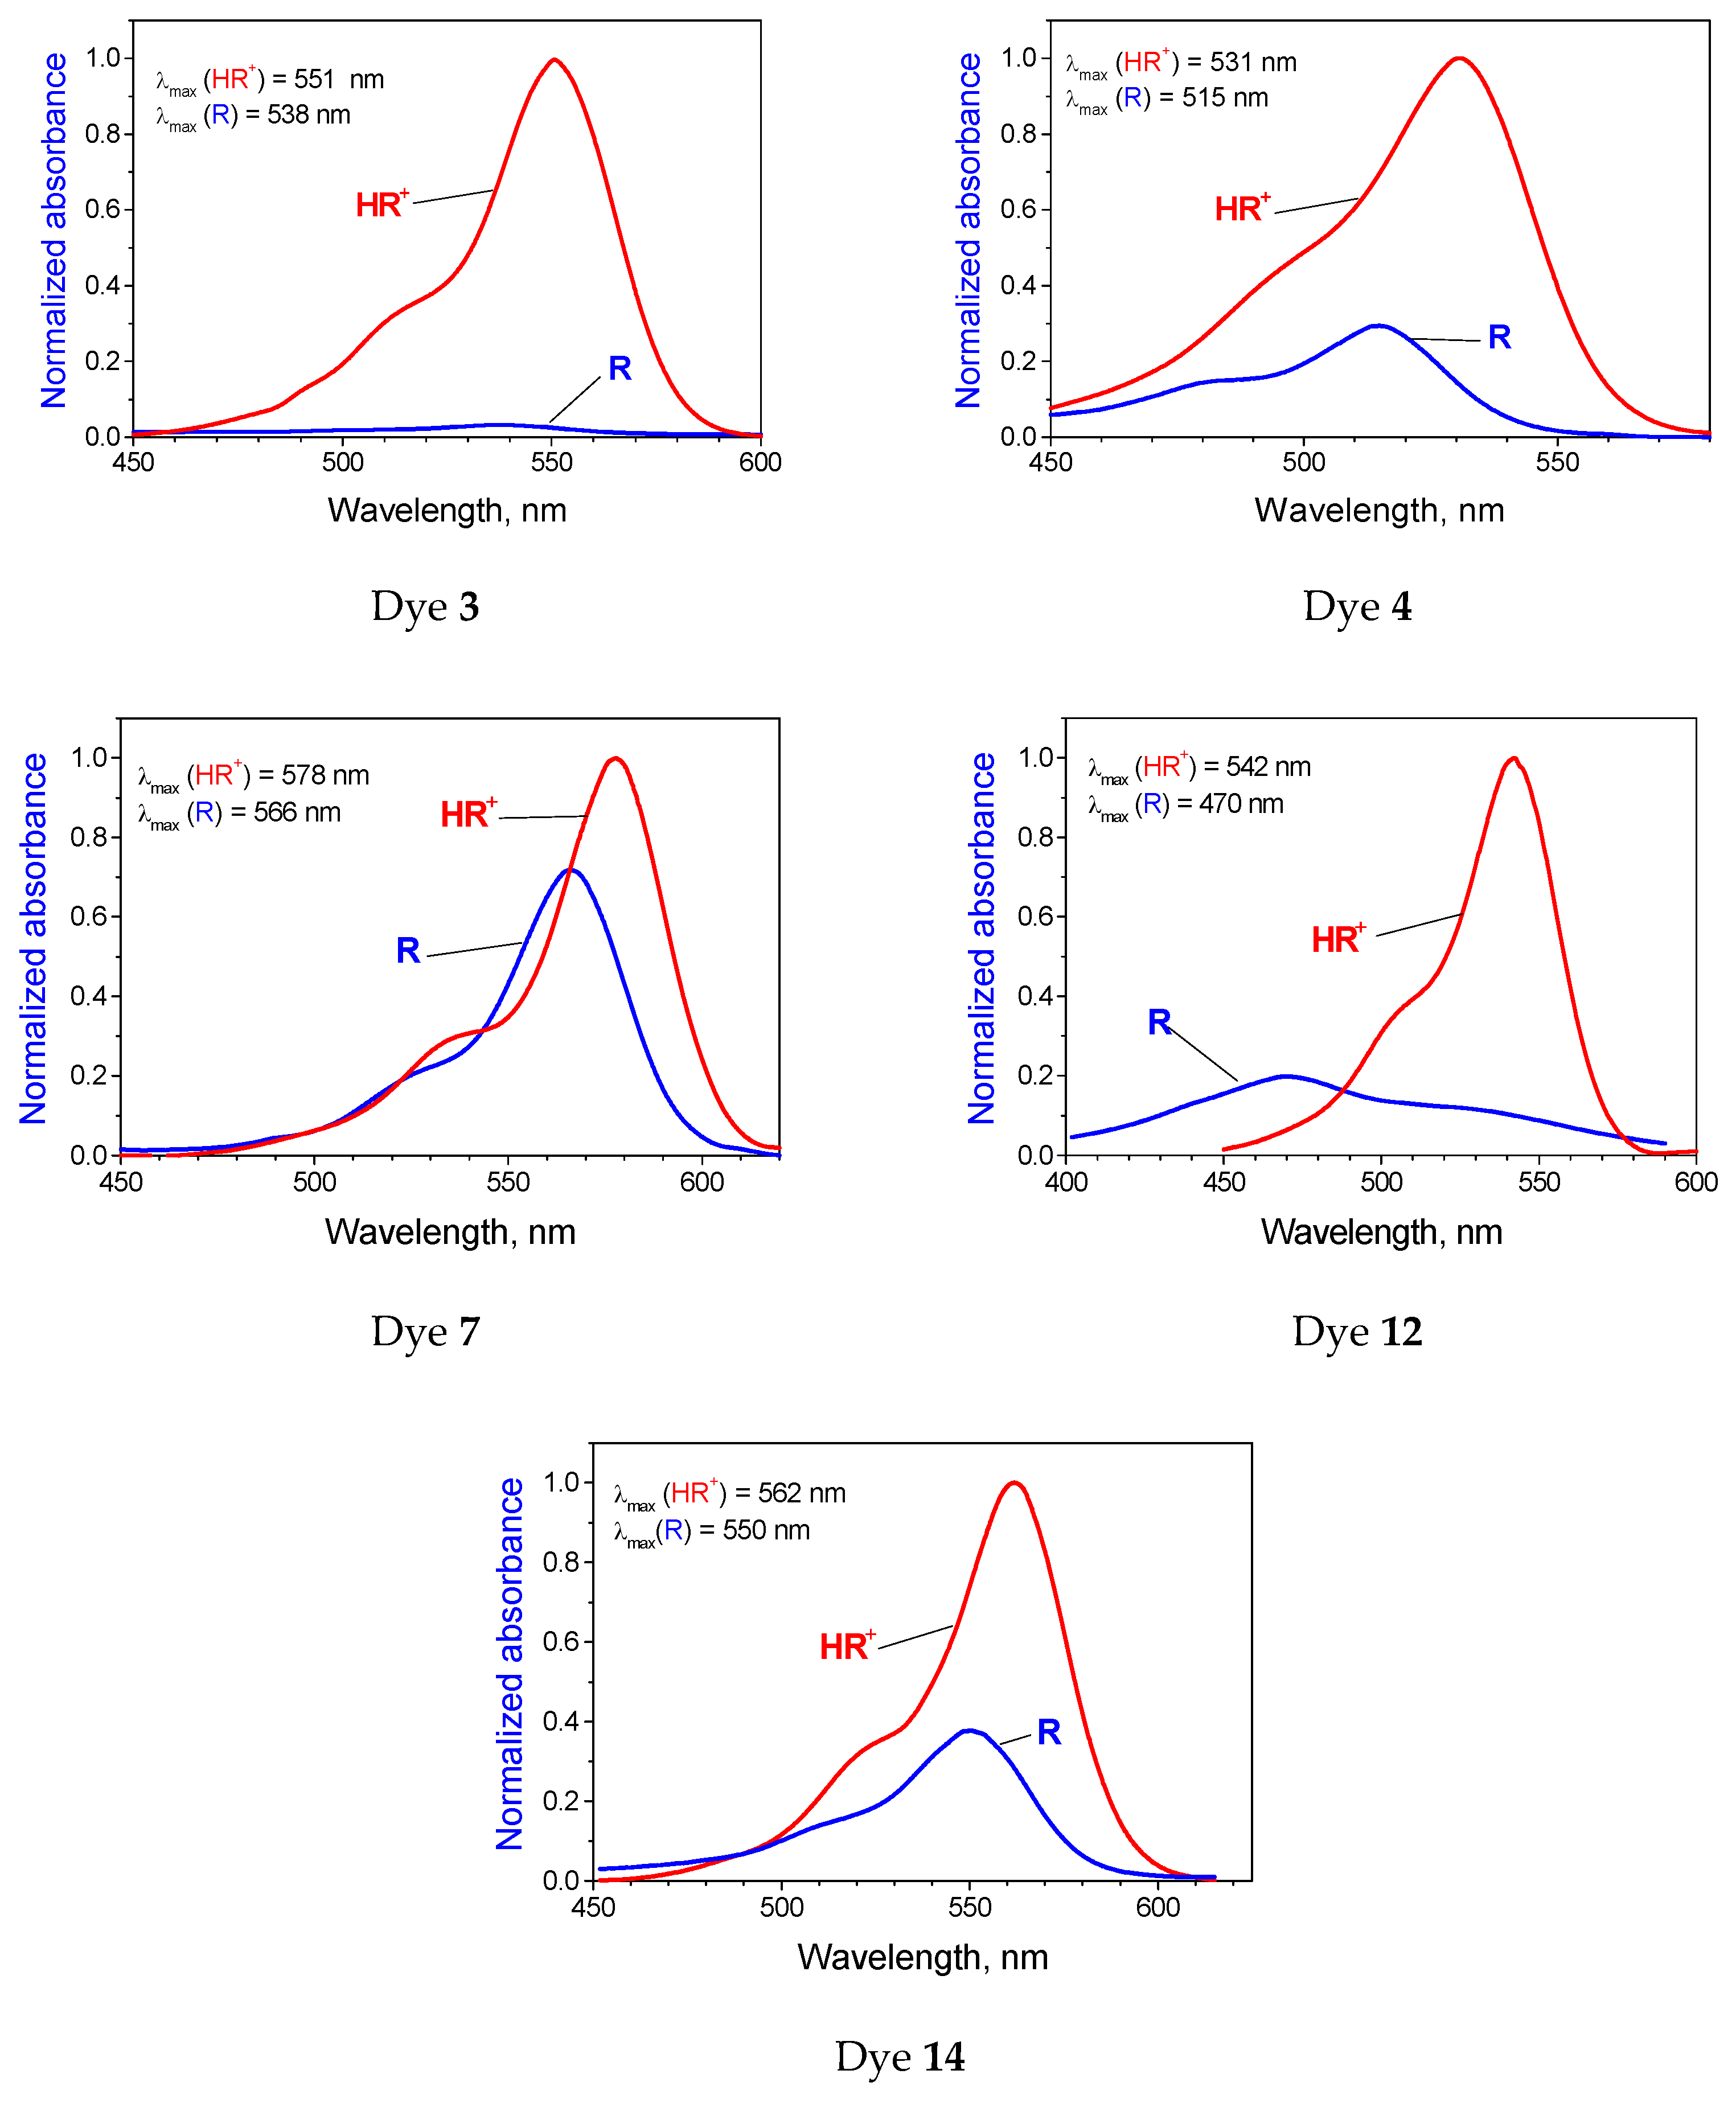
2.2. The Influence of Molecular Structure of Rhodamine Dyes on the Chain–Ring Tautomerism

In search for a liquid media suitable for comparing the ability of different rhodamines to form lactones, two problems arise. On the one hand, it must be a solvent that cause substantial equilibrium shift toward the lactone. On the other hand, the fraction of the colored zwitterion should be sufficient for quantification. A binary mixed solvent, 90 mass% aqueous acetone, was selected as such a suitable media. However, even here, for some rhodamines the KT value appeared to be too high to be determined. Additionally, we kept in mind that in some cases the morphology of the neutral form R spectrum deviates so significantly from the cationic (HR+) absorption, that there are some doubts about the possibility of KT calculation by the aforesaid manner. Spectra are shown in Figure 4, the results are summarized in Table 3.
From Table 3 one may conclude that dyes with dimethyl- and diethylamino groups exhibit expressed affinity to lactonization: KT >> 1. Replacing of one dialkylamino group by julolidine fragment substantially shifts the equilibrium toward the zwitterion, whereas the same replacement of the remaining dialkylamino group displays no additional effect. Dye 4 with one NH2 instead of dialkylamino group is also much less prone for lactonization than dyes 13. Introduction of the OH group in 1-position (compound 12) and replacing of the arene ring by the pyridine cycle (compounds 1315) additionally stabilizes the zwitterions both in case of dialkylamino- and julolidine dyes. In contrast, the enlargement of the chromophore system (compounds 8, 9), moving the amino group from 3- to 2-position (compound 10), and replacing one alkylamino (or amino) group by Cl (compound 11) results in drop of the zwitterions fraction.
In fact, the equilibrium R± ⇄ R0 is an example of an intramolecular Lewis acid–base reaction [61,65]. Therefore, the higher the positive charge at the central carbon atom in R±, the easier lactonization occurs. This allows explaining the decrease in KT on going from compounds 13 to 57. In compounds 9 and 11 the effective charge on the C9 atom is evidently more positive because of the lack of the electron donating alkylamino group in position 3. In compounds 8 and 10, the amino group is not in direct polar conjugation with the nodal carbon atom and its influence on the effective charge of the latter is less pronounced. The KT value for compound 12 reflects the influence of the hydroxy group in position 1.
Data for two rhodamine dyes, the unsubstituted rhodamine (rhodamine 110), and succinyl rhodamine, a dye with the CH2–CH2–COO instead of the phthalic acid residue, were obtained previously in this laboratory [66]. In 90 mass% acetone, the KT values are 6.0 and 62.8, respectively. Thus, rhodamine 110 behaves similarly to dye 4, while in the case of succinyl rhodamine, both the steric factor and the relatively low basicity of the COO group (compared to the benzoate moiety) favor lactonization.
The behavior of dye 4 can be explained either by the peculiarities of the interaction of the amino group with water or by the specific solvation of the carbenium center. Therefore, we performed experiments with entire (anhydrous) solvents, basic DMSO and non-basic acetonitrile. However, in the both cases, the lactonization of dye 4 is less pronounced as compared with other compounds, including dye 5.
For other dyes the phthalic acid residue is the same in the series under study, except compounds 1315. As the picolinic acid in water is weaker than benzoic (the p K a w values are 5.32 and 4.20, respectively), it may be expected that ceteris paribus the KT value for these four dyes should be higher. Note, however, that the above dissociation constants refer to water, where the acidic form of picolinic acid is present predominantly in form of a zwitterion (NH+ and COO groups). In organic media, the fraction of the last is decreasing; in 50 mass% ethanol, the p K a s are 5.44 and 5.18 [67]; in 72 mass% ethanol, the p K a s are 5.42 and 6.24 for the picolinic and benzoic acids, respectively [68]. The character of equilibrium in aqueous acetone may be similar.

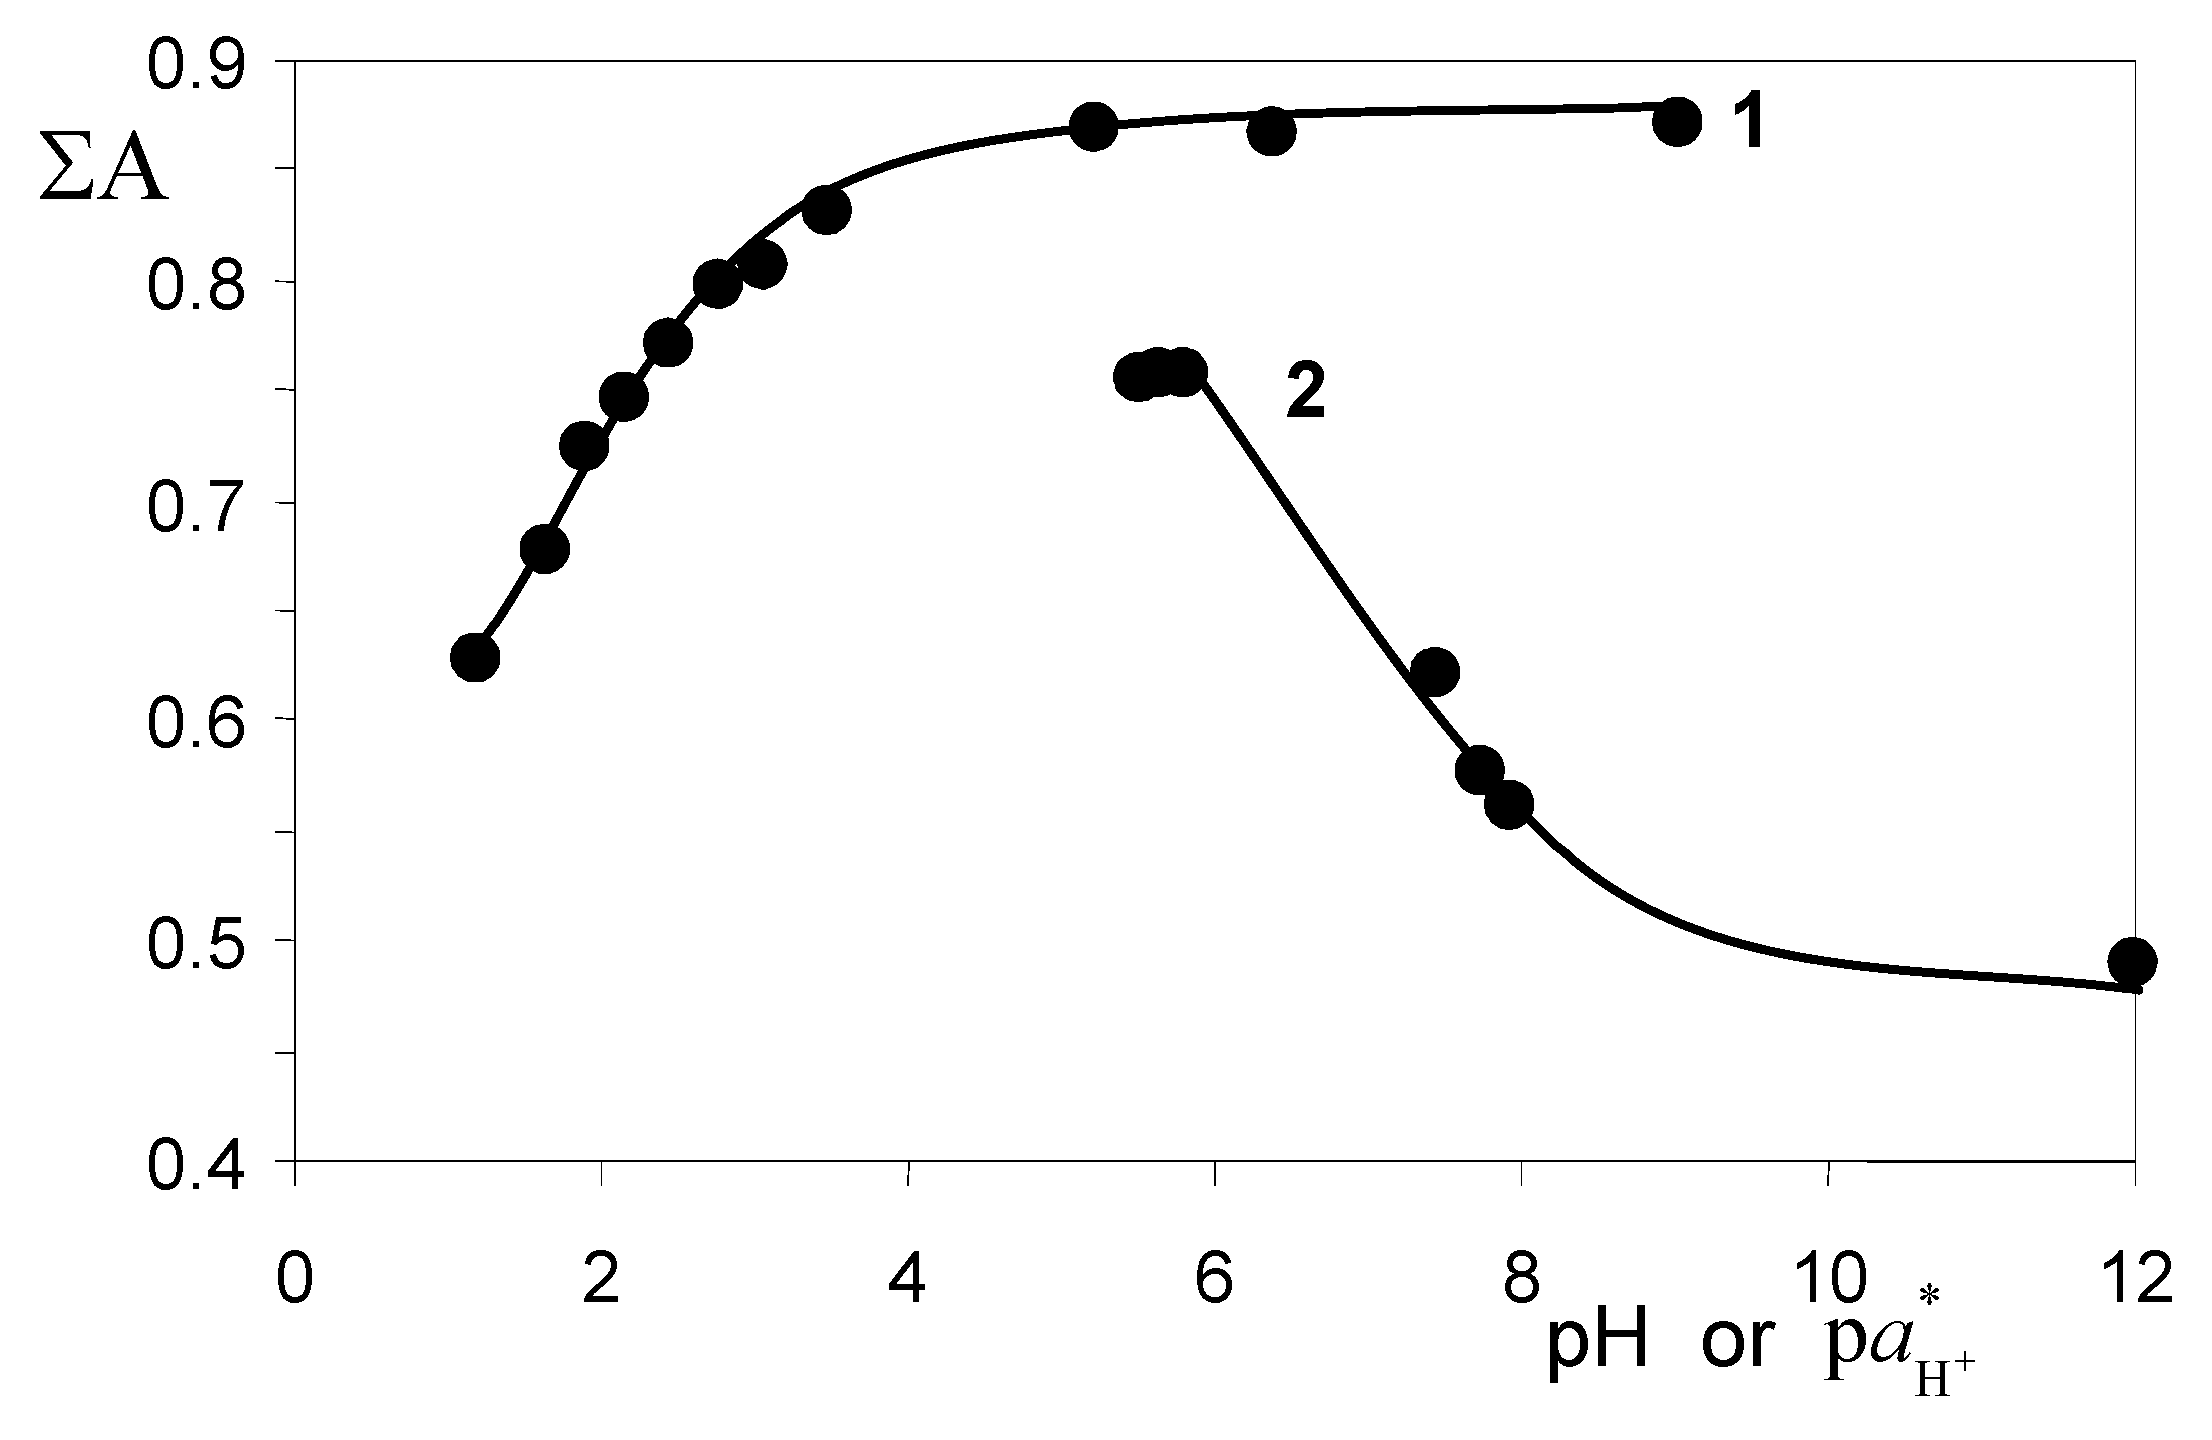
2.3. The Acidic Dissociation of the HR+ Acid and the Charge Type of the Acid/Base Couple

A better understanding of tautomerism in the rhodamine series can be gained by considering acid–base equilibrium. In aqueous solutions, the p K a values of different rhodamines are similar (Table 4). Normally, the lactone fraction is negligible and the total (experimentally available) dissociation constant in fact corresponds to the equilibrium HR+ ⇄ R± + H+. For instance, for rhodamine B (1) in water both absorption and excitation spectra of the species R± and HR+ are rather similar. The λ max a b s values are 553 nm and 557 nm, respectively, while their molar absorptivities almost coincide (108 × 103 M−1 cm−1) [47,57]. In organic solvents, the molar absorptivity of the HR+ species increases to some extent, e.g., 126 × 103 M−1 cm−1 at 557 nm in acetone with 1.7 mass% H2O [66,69] or 120 × 103 M−1 cm−1 at 552 nm [41], whereas that of the neutral form strongly decreases. According to Hinckley et al. [42], molar absorptivities of R of rhodamine B (1) in acetone, acetonitrile, N,N-dimethylformamide, and DMSO are below 0.5 × 10³ M−1 cm−1, owing to the lactone ring closure.
In the present work, the p K a values of dye 5 in water and 90 mass% acetone were determined spectrophotometrically (Figure 5). In water, HCl or acetate, phosphate, and borate buffer solutions were used for creating different pHs; the ionic strength of 0.05 M was maintained by NaCl additions. The pH values in aqueous solutions were determined with a glass electrode in a cell with liquid junction. In 90 mass% acetone, HCl, salicylate, and benzoate buffer solutions were used at ionic strength of 0.002 M; the p a H + values of the buffer mixtures were calculated using the p K a values of the salicylic and benzoic acids, 7.22 and 9.75, respectively.
The p K a values of dye 5 are 3.18 ± 0.14 in water and 7.43 ± 0.03 in 90% acetone; the thermodynamic values are 3.10 and 7.31, respectively.
Our previous study revealed that in aqueous micellar solutions of sodium n-dodecylsulfate the lactonic tautomer is not typical for these dyes [36]. Additionally, the so-called apparent values, p K a app , of dyes 111 vary within the narrow range from 5.07 to 5.53. The increase in these values compared with those in water may be explained at least by the negative electrical charge of the Stern layer of micelles where the dyes are embedded in.
The increase in the p K a values on going from water to organic solvents (Table 4) on the first glance seems unusual. For cationic acids in alcohols, DMSO, and water–organic mixed solvents, the p K a values usually either decrease or increase but slightly [70,71].
Table 4. The p K a values of some rhodamine cations, HR+ a.
SolventRhodamine B (1)Rhodamine 19 (N,N′-Diethyl-2,7-Dimethylrhodamine)Rhodamine 5
Water3.2 b; 3.22 c; 3.22 d;
3.41 e; 3.46 f; 3.36 g
3.15 h; 3.26 i3.10
Methanol7.6 j; 7.4 k
Ethanol8.7 j; 8.7 k9.4 h
N,N-Dimethylformamide6.5 k
N-Methyl pyrrolidine-2-one5.55 l
91.3 mass% DMSO5.60 k
Acetone + 5 mol% DMSO7.50 m7.90 m
90 mass% Acetone6.47 k7.31
a Thermodynamic values, determined by the spectrophotometric method at 25 °C or ambient temperature, if not otherwise specified; the values for dye 5 determined in this work. b From ref. [37]. c From refs. [47,57]. d Determined by using the partition between water and heptane at ionic strength of aqueous phase 0.3 (Na2SO4); the partition constant of R species: K D = 3.60 (in the system water/toluene: K D = 670): [12]. e  p K a = 3.41 ± 0.02 at I = 0.30 M KCl [47]. f 3.46 ± 0.02 (KNO3 background) [47]. g The partition study in water/n-hexane system at I = 0.1 M (KCl) resulted in values p K a = 3.36 and K D = 1.69 [66]. h [51]. i [61,72]. j [41]. k [61]. l [73]. m From ref. [74]; for N,N′-dibutylrhodamine 7.63; N,N′-di-n-octadecylrhodamine 7.66.
To explain the data in Table 4, the following expression should be derived from Chart 2:
p K a = p k COOH log ( 1 + K T )
Here, p k COOH corresponds to the equilibrium HR+ ⇄ R± + H+; K T values are given in Table 4. For example, dye 1 in 90% aqueous acetone has p K a = 6.47 and p k COOH = 7.71. For dye 5, p K a = 7.31 is substantially higher, but p k COOH = 7.62 is ca. the same. In water, where p k COOH = p K a , the values differ by 0.1 unit (Table 4), and in sodium n-dodecylsulfate micelles, where the lactone fraction of the neutral form is also negligible, the p K a app s are 5.32 and 5.49 for dyes 1 and 5, respectively [36]. So, the difference between the p K a in the rhodamine series is caused mainly by the different state of the tautomeric equilibrium. Hence, the considered scheme of dissociation and tautomerism is operational. Similar estimates of p k COOH for dye 1 are made in the publications cited in Table 4.
Note, that the increase in p k COOH on going from water to organic solvents is unequivocally higher than that in p K a (Table 4). E.g., for p K a dyes 1 and 5 it is 4.5 units in 90% acetone. For rhodamine B (dye 1), the increase in p k COOH is 4.3 units in methanol, 5.5 in ethanol, 4.2 in 91.3 mass% DMSO, and 5.3 in N,N-dimethylformamide [59,61]. Such type of medium effects firmly state, that the tautomer R± can be considered as a species with two separate charges. Indeed, for an acid–base couple with charge type +/ ± the increase in p K a is typical, contrary to the case of common cationic acids with charge type +/0 [70,71].

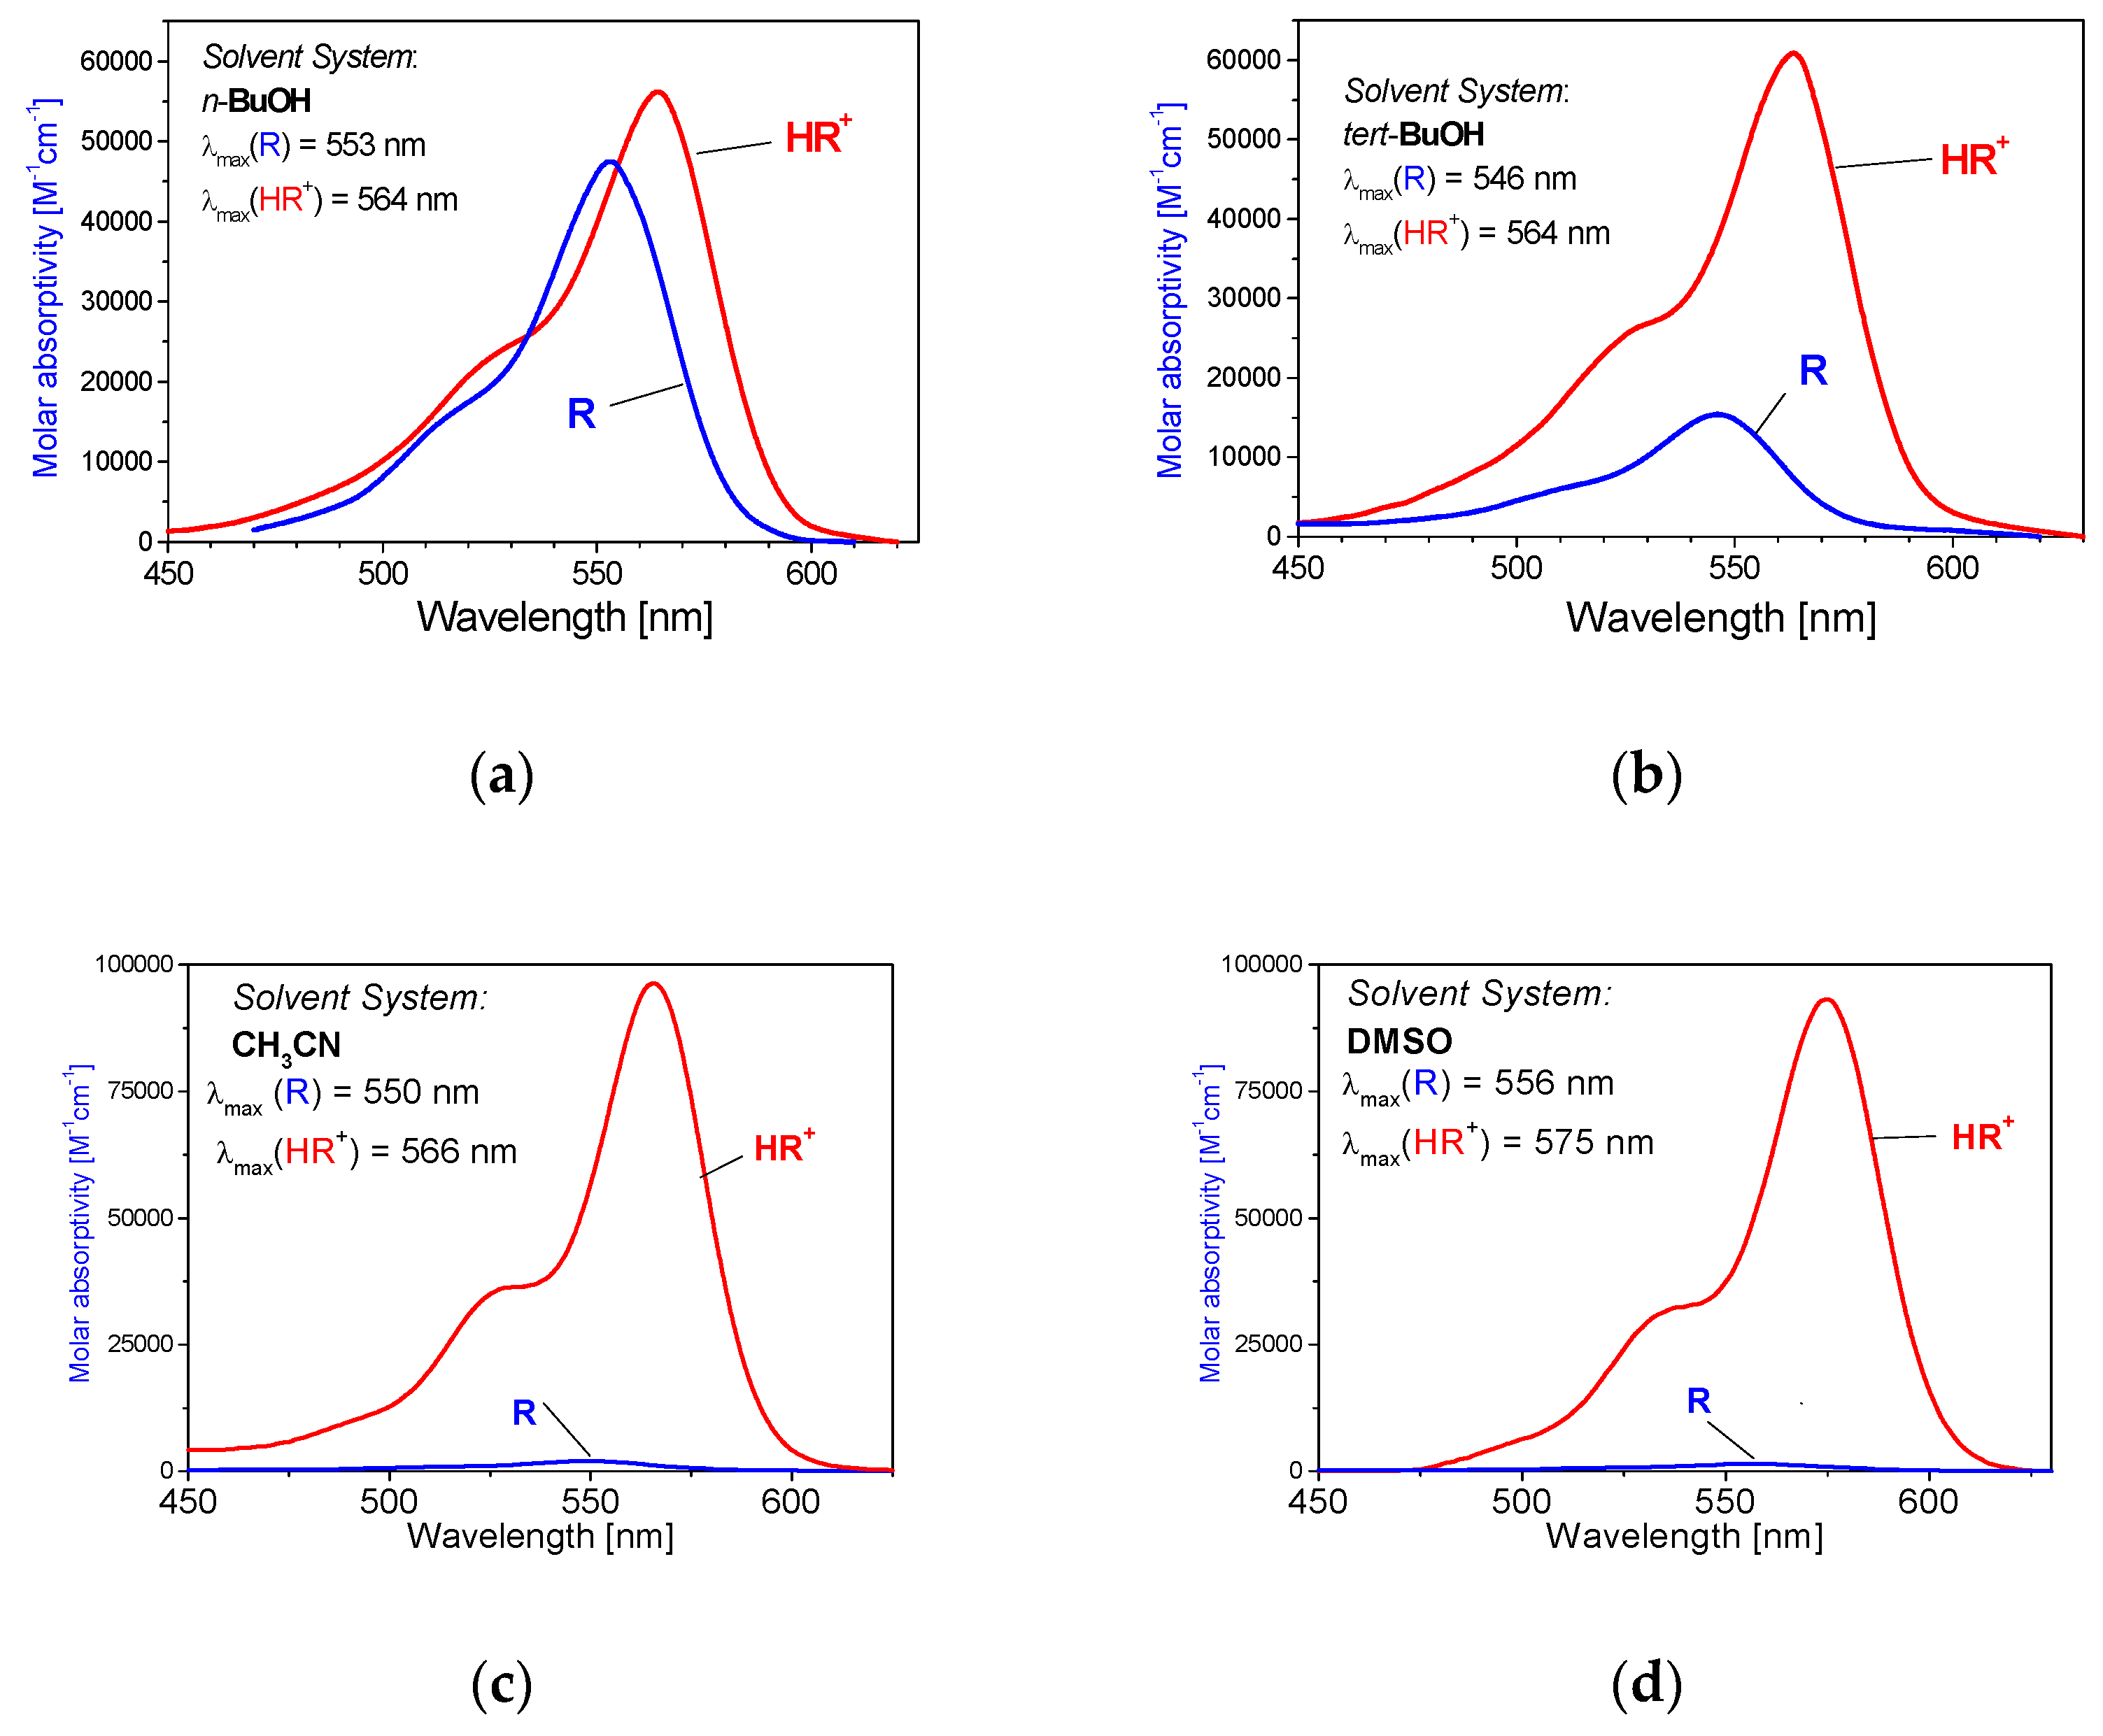
2.4. Tautomerism: Influence of the Solvent Nature

The state of tautomeric equilibrium was studied mainly for rhodamine B [40,42,46,58,59,60,61]. In spite of the relative simplicity of the estimation of the equilibrium constant between colored and colorless tautomers, some interfering factors should be taken into account. First, appropriate addition of a base (e.g., alkali) or a buffer mixture must ensure the absence of HR+ traces when determining the visible absorption spectrum of the form R, and corresponding amount of an acid should be introduced to complete transformation of the dye into the HR+ form. Second, as the estimation of the fraction of the tautomer R± of the R form is made by equating the E max value of R± to that of HR+, it seems reasonable to use both values in the same solvent, because hypo- and hyperchromic effects may take place besides the tautomerism. The latter is important first of all for determining small KT values. We followed these rules in data processing including those given in Table 2 as well as in the tables given below.
It should be noted that in unbuffered systems of low polarity, for instance, in dichloromethane [40] and 1,4-dioxane–water mixed solvents [75] both incomplete dissociation of the salt HR+Cl and acid HR+ occurs. On the other hand, traces of carbon dioxide may affect the equilibrium state.
Barra et al. [76,77] reported that rhodamine B exists in trichloromethane as zwitterions, λ max = 551 nm. However, according to our data for water–saturated trichloromethane solutions of rhodamine B, obtained by extraction from the aqueous media, KT is estimated as 90 [61,66,69]. The E max value of 1.73 × 10³ was obtained at λ max = 535 nm. Dissolution of the HR+Cl salt in water-saturated trichloromethane gives a spectrum with λ max = 550 nm and E max = 158 × 103; addition of NH3 shift the band to 535 nm, with E max = 2 × 10³. In dry CHCl3, λ max = 548–552 nm was reported for the cationic form of rhodamine B [42,78]. The IR spectra of the dye extracted into trichloromethane exhibits after solvent evaporation a band 1752 cm−1 typical for C=O stretching vibrations of the lactone [60]. The results of Barra et al. may be interfered by formation of HCl traces in pure trichloromethane (this effect is enhanced via gamma-irradiation, which is utilized for using rhodamine B in dosimeters owing to colorless-to-colored transition [79]). In the presence of erythromycin A, these authors observed lactonization of the dyes. As erythromycin is a weak base, it may be protonated by the HR+ cation of the dye, and the latter in its neutral form R readily converts into the lactone.
Several authors reported that a KT value of rhodamine B in aqueous solutions is 0.11 [40] or 0.23 [42]. It seems to be overestimated, just because using the E max value in nonaqueous media. Using the dependences of log K T in water–acetone mixtures (15.8 to 90 mass% acetone) on the reciprocal relative permittivity, ε r 1 , or the normalized Reichardt’s polarity parameter, E T N , we estimated the KT  0.01–0.005 by extrapolation to pure water [58,61,66,69]. Selected KT values are collected in Table 5.
Under cooling, an expressed shift of the equilibrium state toward the lactone for rhodamine B [40,42,46] and rhodamine 101 (dye 7) [52] is well documented.
The most detailed study of the influence of the solvent on the R± ⇄ R0 equilibrium was published by Hinckley et al. [42]. These authors managed to fit the dependence of log K T for rhodamine B in a set of twelve alcohols on the solvent properties using the relative permittivity and refractive index (in view of McRae’s approach) and number of carbon atoms bonded to the α -carbon atom. The correlation coefficient r was 0.990.
Taking into account the significant difference in the dipole moments of the two tautomeric species, R0 and R±, a distinct dependence of the log K T value vs. the reciprocal relative permittivity of the solvent may be expected. However, the last-named constant did not display a decisive role in the formation of the equilibrium state. So, the above data of Hinckley et al. for eight primary, secondary, and tertiary alcohols may be described as log K T = −2.334 + 44.4 ε r 1 , r = 0.96. Extrapolation to water results in KT = 0.017. On the other hand, our data for rhodamine B in water–acetone mixed solvents [18 to 90 mass% (CH3)2CO] also obey such kind of dependence, but with much higher slope: log K T = −3.517 + 117.4 ε r 1 , r = 0.997. This gives evidence for the crucial role of the solvent ability to be a donor of H-bond. Indeed, in non-HBD solvents, where the solvation of the COO group is poor, the R± tautomer is strongly destabilized (Table 6).
On the other hand, simultaneous utilization of several solvent descriptors may hide the real driving forces of the chain–ring tautomerism. Therefore, it is reasonable to correlate the log K T value with the Reichardt solvent polarity parameter, which reflects both H-bond acceptor ability and dielectric properties. For studying the solvent effects, dye 5 was chosen. A moderately low ability to lactonization of this dye allows determining the KT values in non-HBD solvents. General regularities, however, are similar to those for rhodamine B. The shift toward the lactone is much more pronounced in the case of entire non-HBD solvents. Additionally, Hinckley et al. reported for rhodamine B the KT values of 0.85 and 62.5 in n-butanol and tert-butanol, respectively [42], and for compound 5 the difference is also substantially: these values are 0.18 and 2.94, respectively (Table 6).
The KT values were determined as described above. To ensure the complete conversion of dye 5 into the cationic (HR+) and neutral (R) forms, 0.01 M of H2SO4 and KOH, respectively was maintained. In the last case, diethylbarbiturate buffer mixture was used (0.01 M acid + 0.005 M KOH). The results are given in Table 6; E T N is the normalized Reichardt’s polarity parameter [65,80].
Using the KT values from Table 6, we obtained the following dependence of log K T vs. E T N , which reflects both the H-donor ability and polarity of the solvent:
log K T = 5.026 9.077   E T N ;   r = 0.85 ;   n = 14
Extrapolation to pure water leads to KT = 1.2 × 10⁻⁴. It must be noted that the combined handling of the data for alcohols [42] and water–DMSO mixtures for rhodamine B (1) [59,61] also demonstrates a weak correlation (r = −0.81) [61]. Probably, some effects, while insignificant in alcohols, grow essential in non–HBD solvents and their mixtures with water.
The correlation becomes much better if only the non-HBD solvents and their mixtures with 5–10% water are used: log K T = 6.012–10.15 E T N ; r = −0.95; n = 7; extrapolation to water gives KT = 1.0 × 10⁻⁴. However, it is desirable to find a simple correlation which would be valid for both alcohols and non-HBD solvents. To this end, considering the C9 atom as an internal Lewis acid, we used to model its interaction with the COO group by the interaction of the H+ ion with the benzoate anion. Equation (3) reflects this assumption.
log K T = a + b log γ R ± γ R 0
Here, γ R ± and γ R 0 stand for transfer activity coefficients of the tautomers from water to the corresponding solvent. The above logarithmic value can be estimated as ( p K a , HBenz s p K a , HBenz w log γ H + ), where K a , HBenz s and K a , HBenz w are dissociation constants in solvent “s” and in water, respectively, γ H + is the transfer activity coefficient of the proton from water to solvent “s”.
The relevant data are taken from the literature; the γ H + values were used either evaluated using the so-called tetraphenylborate assumption [81] or determined by Chantooni and Kolthoff as transfer activity coefficient from methanol to 2-propanol [82].
log K T = a + b [ p K a , HBenz s p K a , HBenz w log γ H + ]
The influence of the solvent’s nature on the state of tautomeric equilibrium zwitterion ⇄ lactone (Equation (1)) was studied using dye 5 as a representative member of asymmetrical rhodamines series. The tautomeric equilibrium constant, KT, was determined in alcohols, DMSO, CH3CN, acetone, their mixtures with water, and in a ternary mixture benzene—ethanol—water with a mass ratio 47:47:6. The absorption spectra of cationic (HR+) and neutral (R) forms are typified in Figure 1, while the absorption maxima and molar absorptivities are given in Table 7. The complete transformation of the dye into the cationic and neutral forms was provided by the addition of appropriate amounts of sulfuric acid and either in 1,8-diazabicyclo[5.4.0]undec-7-ene (DBU) or NaOH, respectively. While the dye concentration in methanol and acidic solutions in other solvents was 1 × 10⁻⁵ M, for the basic solutions in non-HBD solvents it was increased up to (0.7–1.0) × 10−4 M. The parameters included in Equation (4) are given in Table 8.
The corresponding correlation line is presented in Figure 6. The value r = 0.96 allows us to assume that the proposed approach to modeling of the tautomeric equilibrium is not devoid of sense.
Accordingly, the extrapolation to water gives KT = 1 × 10⁻³ for dye 5. An even smaller value was obtained using two separate correlations with the E T N parameter for two types of solvents. As it was mentioned above, a value about 0.01–0.005 was estimated for rhodamine B, 1, in water. Concluding, the fraction of the lactonic tautomer is water is negligible.
Whereas the lactonization can be considered as an intramolecular acid–base interaction, the zwitterions itself is in fact an ionic pair. Moreover, it may be assumed that, depending of the solvent’s nature, we can talk about either solvent-separated (solvent-shared) or contact (intimate) pairs. The last type of interactions should be expected in non-HBD solvents, where the COO group is poor solvated [61]. Hence, in addition to chain ⇄ ring tautomerism (R± ⇄ R0) it is necessary to distinguish between two kinds of zwitterions (Chart 5).
These two types of internal ionic associates between the C9 carbenium center and the carboxylate anion can be represented as C + / / OOC and C + OOC , respectively.
In some cases, such peculiarity manifests itself in the character of absorption spectra of the dipolar tautomer R± in solvents of different nature [61]. On the other hand, different character of solvation of the carbenium center by cationophilic and cationophobic solvents can also make a contribution to the stability of R± and thus to the state of the total chain ⇄ ring equilibrium.

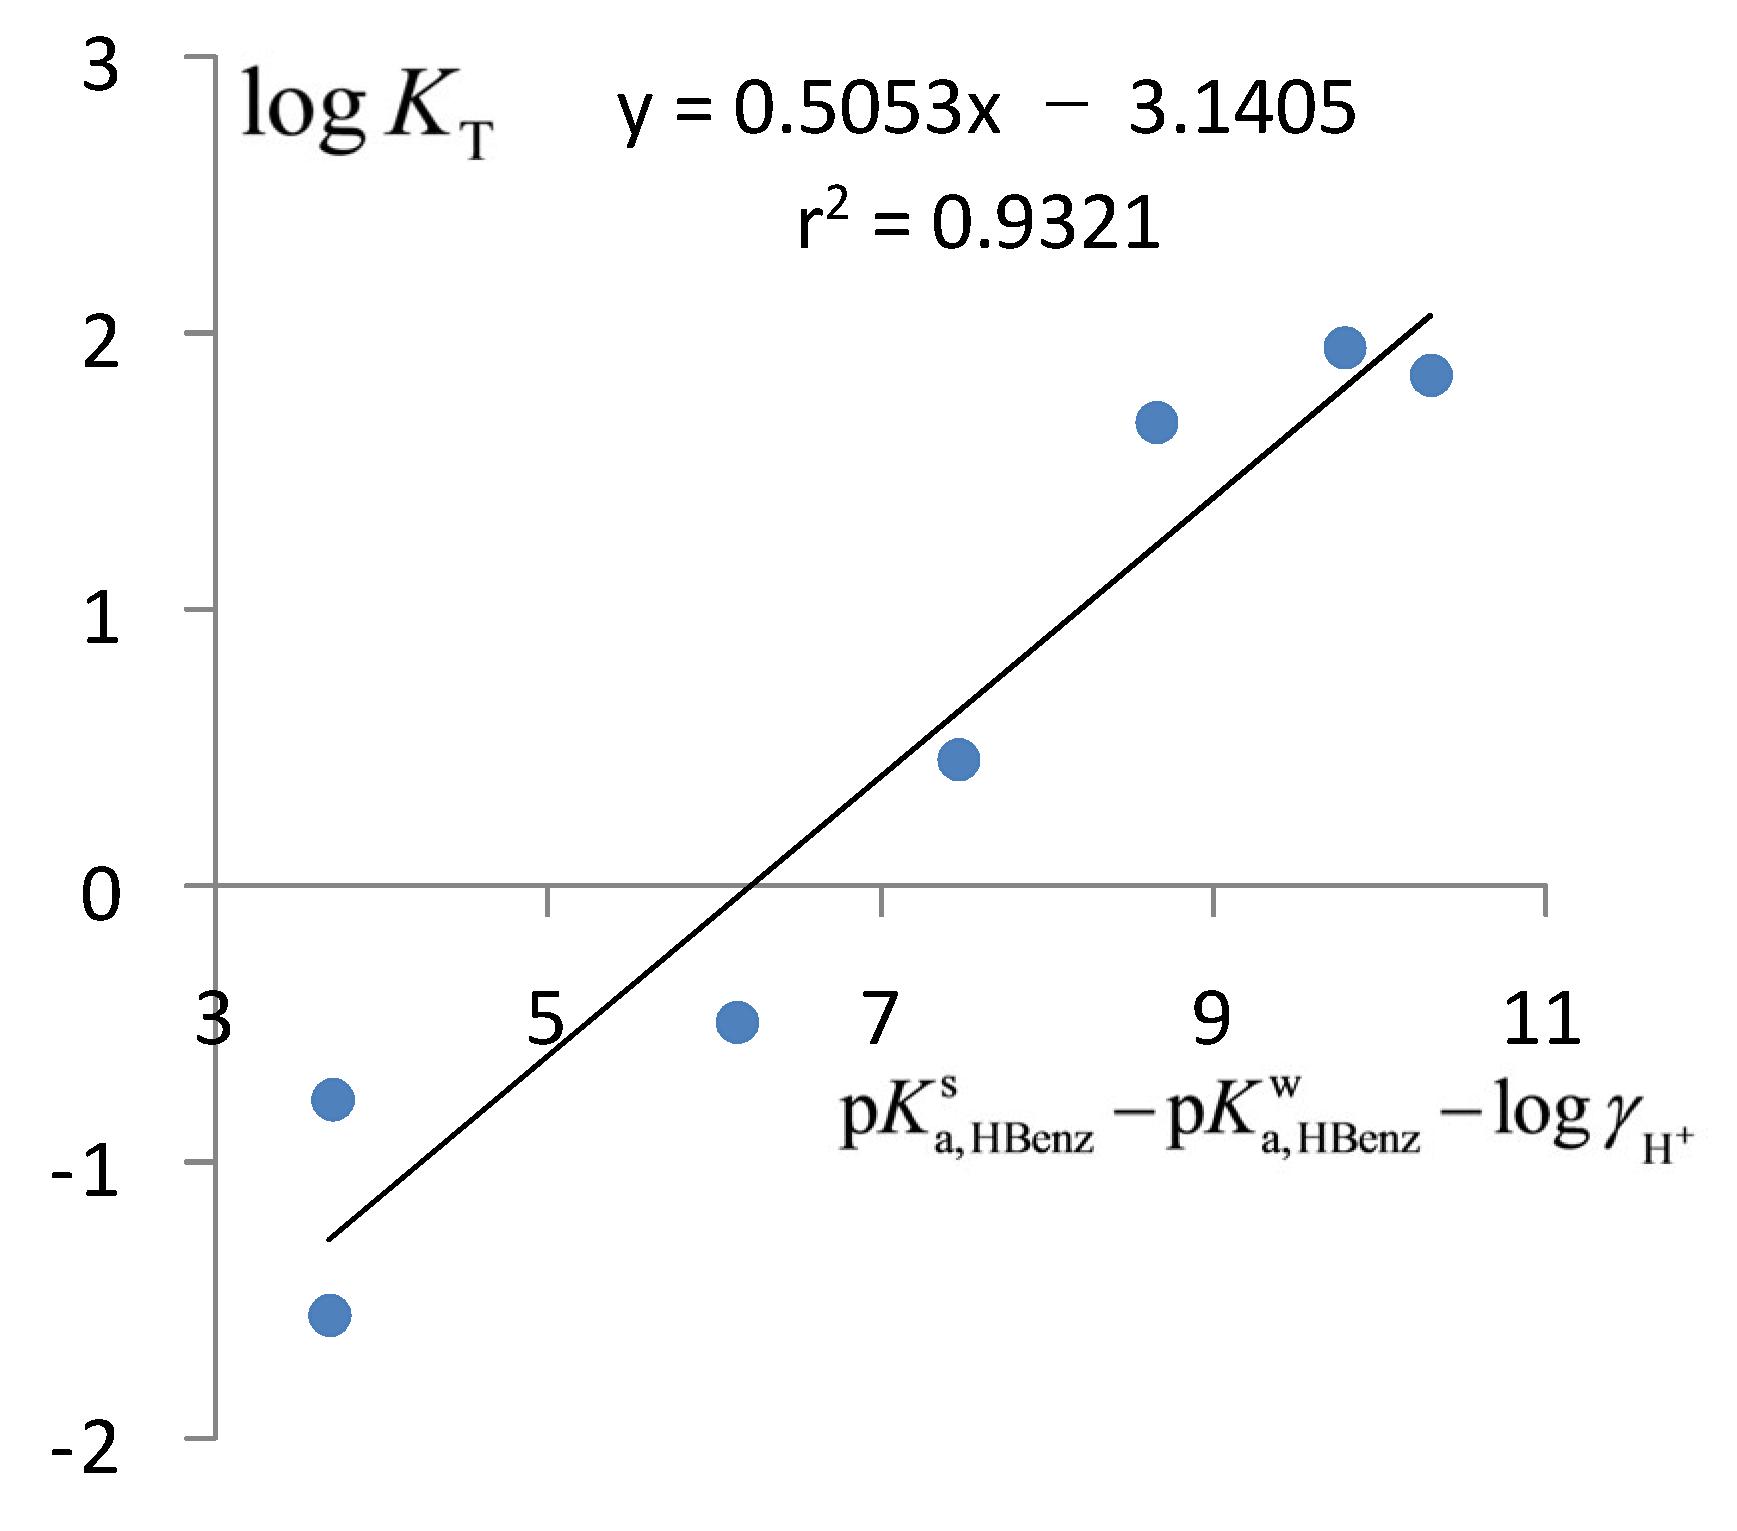
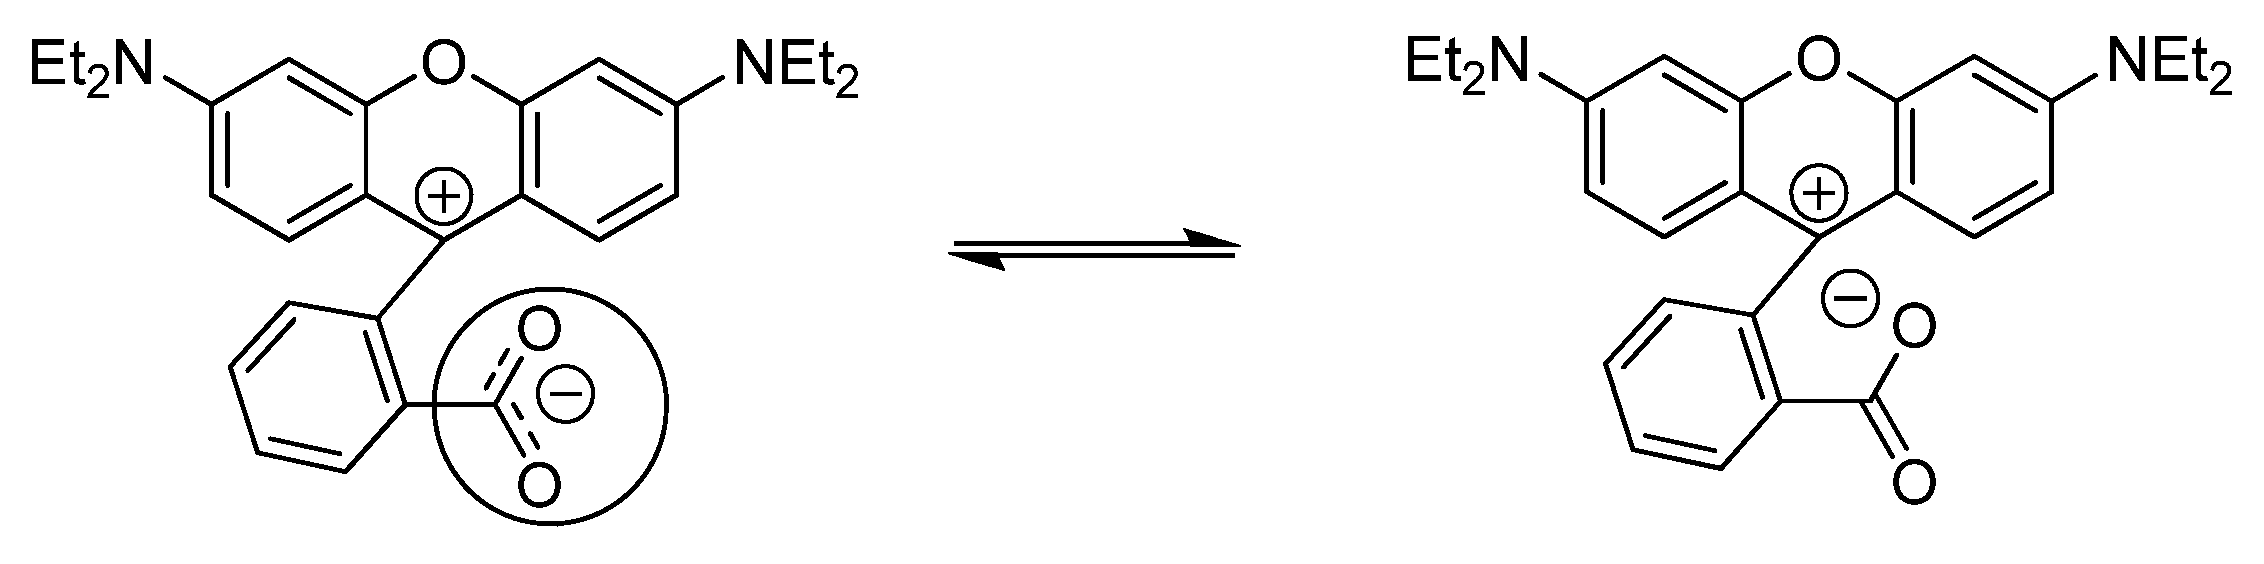
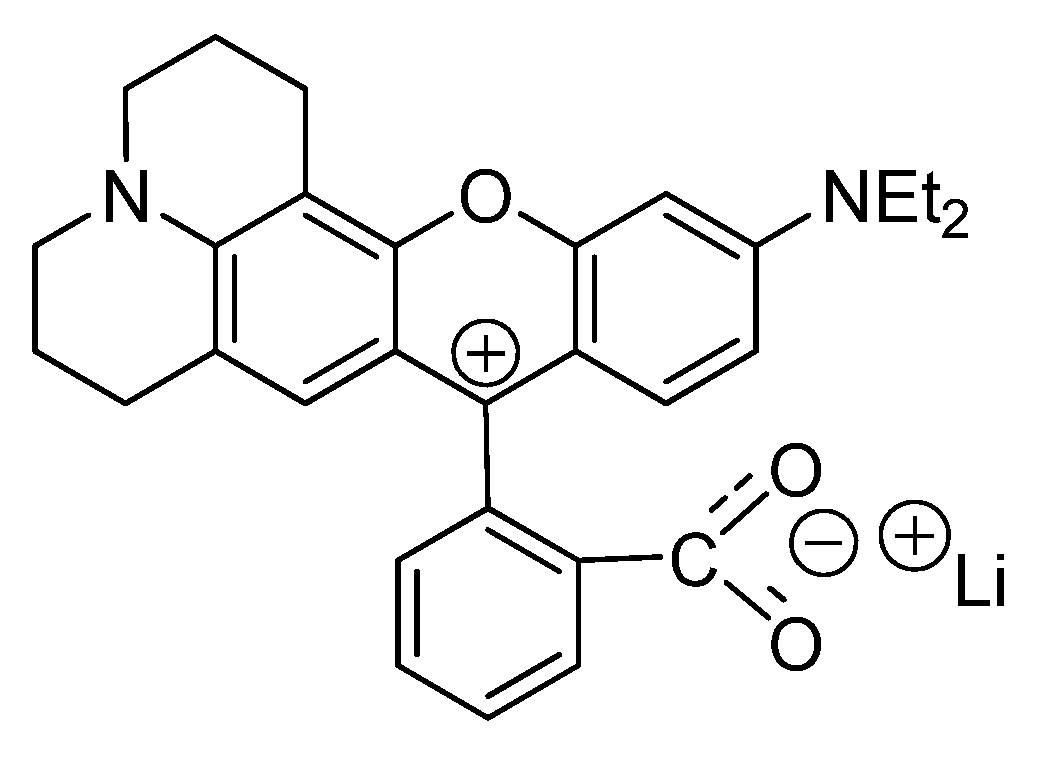
2.5. Interactions with Electrolytes

Experiments with organic solvents revealed that when the complete transformation of the dyes into the neutral form is performed using the DBU, the absorption is somewhat lower than in the case when NaOH additions was used. For example, in 0.001 M NaOH in acetonitrile and DMSO the Emax is 1.65–1.9 times higher than in corresponding DBU solutions. This should be attributed to ionic association of the Na+ ion with the carboxylate group COO of the zwitterion of the dye. In fact, the tautomeric equilibrium R0 ⇄ R± is shifted toward the right. Therefore, we examined the influence of several salts, LiClO4, Ca(ClO4)2, Mg(ClO4)2, and La(NO3)3 on the spectra of the neutral form of rhodamines. Cleavage of the lactone ring occurs to a greater or lesser extent. For example, for dye 4 in 90% aqueous acetone even 9.1 × 10⁻⁶ M La(NO3)3 cause a ≈ 12% increase in absorption, whereas in the case of dye 8, which is less inclined to the zwitterion formation (Table 3), no transformation of R0 to R± is observed even in the presence of 6.09 × 10⁻⁵ M La(NO3)3.
Most of the experiments were carried out with dye 5. The molar absorptivity of the neutral form in acetonitrile is 2.0 × 10³ M−1 cm−1 in the presence and absence of 0.02 M DBU. In contrast, addition of 0.001 M NaOH increases the absorptivity up to 3.3 × 10³ M−1 cm−1. Figure 7 shows a sharp jump in the absorption intensity after adding of 0.20 M Mg(ClO4)2·3H2O. To ensure the absence of the cationic form, HR+, 0.005 M KOH and 0.006 M 18-crown-6 were added; the complex formation of the crown ether protects the Na+ ion from the direct association with the dye. As magnesium nitrate was used as a crystal hydrate, blank experiments were made with 0.60 M water, which increased the absorption only twice as compared with curve 2.
Two systems were studied in a more detailed way: rhodamine 5 with LiClO4 and Ca(ClO4)2 in acetonitrile. The results are exemplified in Figure 8 (this is a representative set of points from a larger body of data.) It is clearly seen that the interaction is very strong, especially in the case of Ca(ClO4)2. Even at 1 × 10⁻⁴ M, this salt causes ≈70% of the conversion of rhodamine lactone to zwitterion at a dye concentration of 1 × 10⁻⁵ M (Figure 8b). Even the λ max values themselves shed some light upon the character of the interactions. In solutions of p-toluenesulfonic acid, λ max = 566 nm; this is the spectrum of the HR+ form. The λ max of the R± tautomer equals to 550 nm. Therefore, the λ max values in solutions of LiClO4 and Ca(ClO4)2 after complete transformation of the dye into the associate, 556 and 559 nm, respectively, demonstrate the intermediate character of the interaction. On the other hand, a sharp increase in the absorption intensity indicates the existence of the dye in the form of the zwitterionic tautomer in these associates (Chart 6).
Interaction with LiClO4 is somewhat weaker (Figure 8a). Here, the stoichiometry of 1:1 was assumed (Figure 9).
The association constant was calculated using Equation (5) and assuming that the concentration activity coefficients of Li+ and R± are equal.
K as = A ( A max A ) { C LiClO 4 [ R ± Li + ] }
For wavelengths around the absorption maximum, estimates lead to a value K as = ( 3 ± 1 ) × 10 3 M−1. These data are in line with the articles by Hojo, devoted to rhodamine B and related compounds [83,84]. It should be noted that the interaction of rhodamines with metal ions was a matter of research of several authors. Shakhverdov, Ergashev, and their colleagues studied photophysics of rhodamine B in ethanol in the presence of a number of rear-earth metal salts [85,86]. Ergashev showed an increase in the intensity of the absorption of rhodamine B in DMF with the addition of these salts [87]. Similar interactions in some entire and mixed solvents were also studied [88]. Synthesis of and characterization of rhodamine complexes with Mn(II), Co(II), and Cu(II) was reported by Refat et al. [89].
Concluding, the association of metal cations with the carboxylate group of rhodamines is a case of the interaction of Lewis acids with a base.

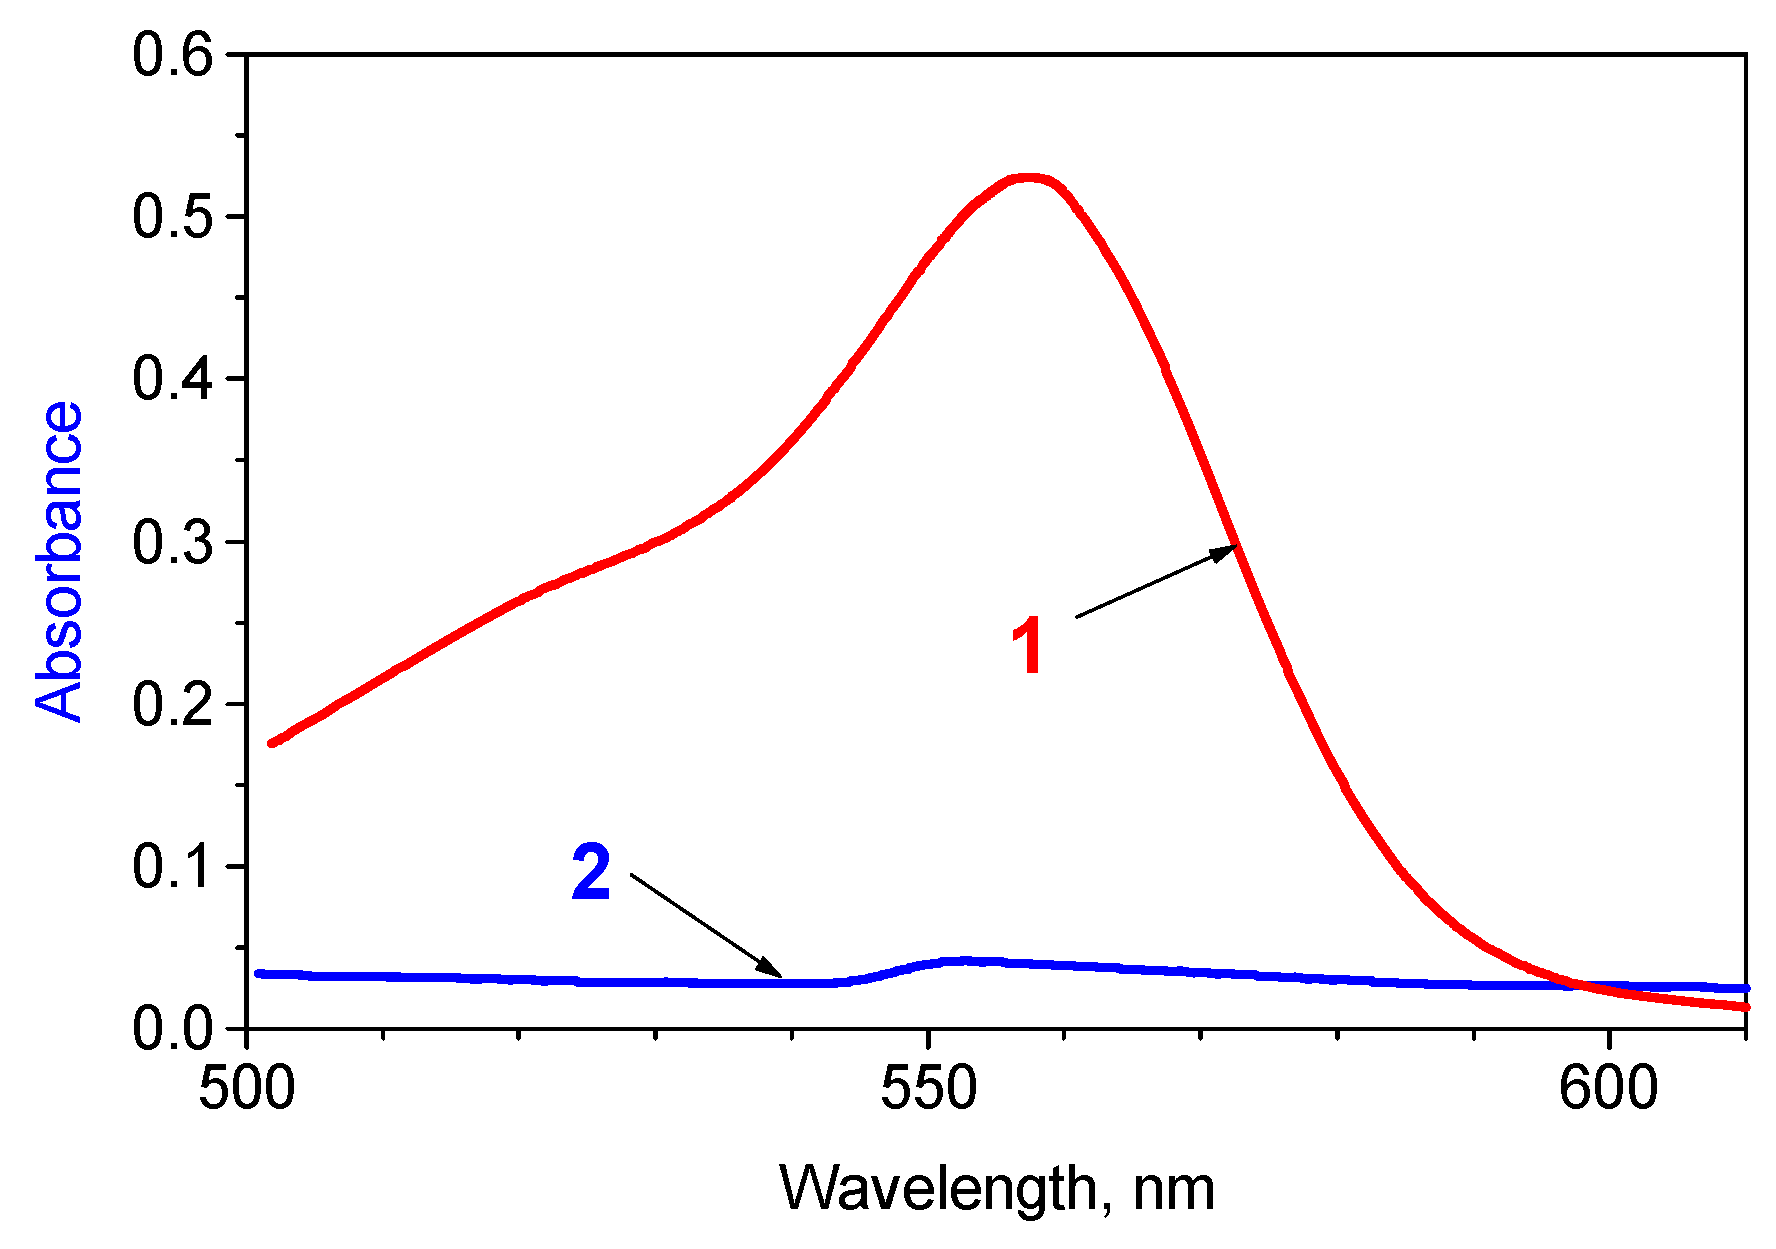
2.6. Fluorescence and Photocleavage of the Lactone Cycle

Fluorescence of rhodamines is one of the most popular and developed field. Even for the less explored asymmetric compound 5, a set of data has already been published. For instance, the fluorescence lifetimes of the cationic form HR+ of dye 5 in water, 90% aqueous acetone, acetone, methanol, and DMSO were reported to be 3.93, 4.28, 4.39, 4.31, and 4.31 ns, respectively, and the values 3.92, 4.24, and 4.18 ns were found for R± in water, 90% aqueous acetone, methanol, respectively [36].
Although a huge number of publications have been devoted to the fluorescence of rhodamines, there are some issues that still need to be discussed. They concern, first of all, the behavior of the colorless lactone. In Figure 10, emission of rhodamine 5 in anhydrous acetone is presented as an example.
The fluorescence spectrum of the cationic form with λ max em = 590 nm is quite understandable. It appears as a mirror image of the absorption spectrum (not shown in Figure 10). In contrast, the neutral form exhibits two bands. One of these bands with λ max em = 578 nm is the typical zwitterion fluorescence that can be observed in water or alcohols. This emission appears due to the photocleavage of the lactone cycle, i.e., the displacement of the tautomeric equilibrium in the excited state.
The second band with λ max em around 400 nm can be attributed to the lactone. This blue fluorescence was first reported by Ramette and Sandell, who studied a benzene extract of the colorless lactone tautomer of rhodamine B [37]. Then, several publications were devoted to the interpretation of this phenomenon [78,90,91].
The most intriguing aspect is the large Stokes shift of the lactone of rhodamine B, because the λ max abs value in various solvents is within the range of 300–330 nm, while the λ max em in the non-polar solvents, such as benzene, diethyl ether, 1,4-dioxane, and others, lies within the range of ≈450–470 nm. The abnormal Stokes shift for the rhodamine lactone [(8–11) × 103 cm−1)] needs to be clarified. For instance, it cannot be explained by the emission of the “dialkylaniline” fragment because fluorescence of N,N-dimethylaniline is characterized by a Stokes shift of 4.6 × 103 cm−1. Grigoryeva et al. [78] studied the fluorescence of rhodamine B in chloroform, DMSO, DMF, and water–dioxane mixtures. The increase in the solvent polarity results in a red shift of the emission band of the lactone. For instance, it is 460 nm in benzene and 490 nm in chloroform. In CH3CN and DMF, only the fluorescence band of R± is observed [78]. Klein and Hafner studied the fluorescence of rhodamine B (1) lactone in cyclohexane, dibutyl ether, dioxane, dichloromethane, acetonitrile, and other solvents (11 in total) [90]. They found that the charge transfer in the excited state is the origin of the large Stokes shift. A dipole moment in the excited state of 25 D was estimated, basing on the solvent induced fluorescence band shifts (within a simple Lippert–Mataga approach [92].
However, in most studies, the main attention was paid to the photocleavage of the lactone ring, which leads to the appearance of long-wavelength emission of the zwitterionic tautomer of rhodamine. The low intensive fluorescence of lactone was studied only moderately [20,93].
Karpiuk et al. [20] examined the emission of the lactone of rhodamine 101, which corresponds to compound 7 in Chart 2, in ten solvents: in butyl and ethyl ethers, methyltetrahydrofurane, dimethoxyethane, butyronitrile, and more polar media. Charge-transfer state of the lactone, formed as a result of electron-transfer formed as a result of the excited state electron density redistribution was characterized by high dipole moment. The latter was estimated of the order of 26 D. In more polar solvents, the emission was ascribed to the zwitterion R±. Similar results were published afterwards by El-Rayyes et al. [21], who performed a study of rhodamine B emission in 11 different organic solvents. In a set of works by Karpiuk et al. [94,95,96], charge transfer in the excited state of triphenylmethane lactones was discussed in detail.
From the point of the classical chromophore theory, the rhodamine B lactone molecule consists of three non-conjugated units: electron-deficient benzofuraneone and two electron-excessive N,N-dialkylamino-phenyl moieties of xanthene tricycle, connected to each other via an oxygen atom and a saturated carbon atom. The last one is a spiro-center of the lactone molecule. Benzofuranone moiety is orthogonal to the rest of the molecule [48,49,50], which could be considered an additional factor, seeming to guarantee an absence of their intramolecular interaction.
However, a similar effect was first considered in late 1960th by Simmons and Fukunaga [97]. Overlapping of two orthogonal π-systems linked by a common sp3-carbon spiro center is called spiro conjugation.
Later the theory of this phenomenon was developed by several other authors [98,99,100]. Spiroconjugated systems with combination of electron-donor and electron-acceptor subunits were considered as optical materials for non-linear optics [101,102], several of them were able to emit a charge-transfer fluorescence [103,104,105,106]. Thus, two distinct subunits of rhodamine lactones molecules, can demonstrate all the features of spiroconjugated systems, including highly solvatochromic emission, which is typical to systems with significant excited state intramolecular electron density redistribution.
Recently, spectral properties of rhodamine B were simulated by the semiempirical methods in a Franck–Condon approximation [22,107]. This approach does not permit explanation of the large Stokes shift inherent to the lactone form in the non-polar non-HBD media. We first attempted to explain this phenomenon by ab-initio calculations considering conformational changes (geometry optimization) in the excited state.
To our understanding, this was not fully correct owing to the initial experimental results of Klein [90]: even in non-polar cyclohexane rhodamine B lactone has a Stokes shift of ~7200 cm−1, which is the indication of involvement of excited state relaxational processes. In solvents of low-to-intermediate polarity this value increases up to ~12,500 cm−1 owing to the growth of solvatofluorochromic contribution.
Our calculations performed by ab-initio b3lyp/cc-PVDZ method revealed the charge-transfer character of several lowest Franck–Condon excited states of the above lactone (Table 9). The electronic excitation spans over all the aromatic subunits of the molecule. Significant electron density redistribution of ~1/2 electron charge from each of >N-Ph- towards benzofuranone moiety was revealed. This means formation of practically “full charge transfer” singlet excited states, electronic transitions to which are forbidden by overlap. Indeed, the oscillator strength of S0-S1 and S0-S2 transitions in the calculated absorption spectra were lower than 0.01.
Emission spectrum is traditionally modeled by vertical electronic transition between the lowest excited and ground states for the molecular geometry, optimized in fluorescent S1 state. The electronic excitation and charge transfer indices were applied for elucidation of the nature of electronic transitions [108,109,110]. The first of them demonstrates participation of definite atom or submolecular fragment in the electronic excitation (%), the last ones show directions and amount of electron density redistribution in parts of the elementary electric charge (“from and to” atom/fragment). Initially these indices were calculated on the individual atoms level, however it is more suitable to summarize them for definite selected groups/fragments to outline the nature of the main chromophore in the studied molecules.
Xanthene oxygen atom is not shown owing to its insignificant participation in formation of long-wavelength transitions in the electronic spectra of the rhodamine B lactone.
Our results, presented in Table 9, do not fully agree with the experimental data by Klein and Hafner [90], which is more likely due to definite underestimation of the energy of the excited states with significant charge separation by b3lyp functional. However, more probable reason is the presented by Klein positions of allowed electronic transitions with extinction of (13–15) × 103 M−1 cm−1. Experimental determination of the positions of the low-intensive bands (forbidden electronic transitions hidden under the broad intensive absorption bands) is hardly possible.
The ground state optimized molecular geometry of this lactone is practically symmetric with flat xanthene tricycle and orthogonal to it benzofuranone moiety (Figure 11). Diethylamino groups lie practically in the plane of their neighboring benzene rings and are characterized by minimal pyramidalization degree of their nitrogen atoms. Electronic excitation localization and ground-to-excited state electron density redistribution for two long-wavelength charge transfer electronic transitions demonstrate a high level of symmetry as well.
The molecular geometry of the lactone, optimized in the electronically excited state, characterizes by symmetry breaking and loosing planarity of xanthene moiety by bending around its central axis. The central pyran cycle of xanthene moiety changes its conformation to boat-like one, thus benzofuranone bicycle moves closer to xanthene oxygen atom and even forms a weak unconventional hydrogen bond of CH⋯O type (Figure 12). Its energy, roughly estimated according to Espinosa approach [111], was only 0.7 kcal/mol, thus it cannot play significant role in formation of presented here structurally relaxed conformation of rhodamine B lactone and is not an important factor of its stabilization. The discussed H-bond length is 2.99 Å, this slightly exceeds the sum of mean Vander Waals radii of hydrogen and oxygen atoms.
It is worth to note, that in spite of the charge transfer character of the electronic transitions in the absorption and emission spectra, formation of TICT-like states [115,116] with ~90° rotation of diethylamino groups was not confirmed by our quantum-chemical modeling.
The Stokes shift, calculated as the difference between theoretical electronic absorption and emission spectra (Table 9), was near 8 × 103 cm−1. Taking into account various possible inaccuracies mentioned above, this value is of the same order with the experimental one, reported by Klein [90].
Resuming our theoretical modeling, we can conclude, that the probable reason for the high Stokes shift of rhodamine B lactone in nonpolar solvents is the excited state structural relaxation process, which looks like quite rare (and sometimes not proved to the end) photophysical BUTTERFLY mechanism [117]—the excited state out-of-plane deformation of initially planar molecules, previously considered for the case of protonated polycyclic aromatic compounds and their heterocyclic analogs [118,119]. The probable driving force for structural relaxation of such type in the case of rhodamine B lactone could be the space approaching of electron donor and electron acceptor parts of the investigated molecule, which increases the overlap of their π-subsystems within the framework of the spiroconjugation model and thereby contributes to the redistribution of the electron density in the excited state between them.
The above calculations allow making some conclusions. Namely, quantum modeling of rhodamine B lactone allowed to formulate a hypothesis, that the reason for its abnormally high fluorescence Stokes shift could be a structural relaxation process leading to out-of-plane deformation of the xanthene moiety of the lactone, which results in space approaching of its electron donor and electron acceptor subunits and facilitates the intramolecular excited state charge transfer. Solvents of intermediate-to-high polarity further increase the Stokes shift up to its nearly doubling owing to the solvent relaxation around the title molecule, which substantially increases its dipole moment in fluorescent state S1.
Meanwhile, it is an alternative explanation of the rhodamine lactone emission. As early as 1989 [63], we repeated the results by Ramette and Sandell [37]. The lactone R0 of rhodamine B, 1, was extracted from water into benzene. It absorbs in the UV region, λ max ab = 315 nm and emits with λ max em = 475 [63]. The Stokes shift is 10,694 cm−1. In additions, similar results were obtained with three other dyes, rhodamines 110 (16), 19 (17), and succinyl rhodamine (18) (Chart 7):
Their absorption maxima in benzene extracts were 292, 302, and 314 nm, respectively, while the emission maxima were 400, 460, and 460 nm, respectively. Hence, the Stokes shift is within the range of 9250–11,400 cm−1. It became clear that neither a (possible) TICT configuration of the alkylamino groups, nor the role of the phthalic acid residue are important. In the present study, we have dissolved the neutral forms of rhodamines in entire benzene. All solutions demonstrate a blue fluorescence with Stokes shift of (7.5–11.2) × 103 cm−1 (Table 10), which prove the universal character of the phenomenon.
Our calculations for succinyl rhodamine 18 lactone look nearly like those above discussed for rhodamine B 1; however, several discrepancies are present. First, xanthene tricycle of the rhodamine 18 lactone is initially bent and non-planar just in the ground state, because of the non-planarity of its five-membered cyclic lactone moiety (Figure 13). The situation became more expressed in the electronically excited state, where molecular geometry of lactones of 1 and 18 has several common features.
The excited state intramolecular charge transfer is predicted by our calculations made for lactone of 1 as well. It is accompanied by symmetry breaking, which is clearly observed by planarization of one of its dimethylamino groups (from which the electron density redistributes towards the electron-acceptor ester group), while as another dialkylamino group retain its pyramidality. The calculated S1-S0 electronic transition should lie in UV range, ~357 nm. This is much higher in energy scale compared to that predicted for lactone of compound 1 (496 nm). Probably, the reason of this is the absence of π-conjugated system in the 18 electron-accepting part: 1 has an additional benzene ring in its lactone moiety, while as the lactone of 1 has only a non-conjugated ester group included into the saturated five-membered lactone cycle. Thus, the energy of its vacant molecular orbital participating in the intramolecular charge transfer should be much higher (increasing the energy of electronic transition with participation of such MO as well).
We assumed that the anomalous Stokes shift of the lactonic tautomer is related to the fluorescence of a polar molecule produced by reversible photoreaction breaking the lactone bond [63]. In addition to the above reasoning, two publications seem to be important. First, as early as 1962, Fujiki et al. [120] revealed that the carbinol 19, which is formed in alkaline aqueous solutions the cationic dye pyronine G, exhibits a fluorescence even more intensive as compared with the initial carbocation. Second, blue fluorescence was observed in benzene extracts not only of rhodamine B 1 but also of rhodamine 6G 20 [121], which is unable to lactone formation, Chart 8.
Hence, xanthene structures with sp3-hybridization of the nodal carbon atom and without the 9-arene substituent also exhibit a blue fluorescence. Therefore, a photochemical reaction in the Franck–Condon state of the lactone is assumed, which leads to formation of a highly polar structure [63]. For dye 5 the corresponding scheme is as shown below (Chart 9).
However, our quantum-chemical calculations with optimization of pyronine G carbinol molecular geometry do not confirm its long-wavelength emission (similar to rhodamine B lactone), no wonder, this molecule includes no electron-accepting group, towards which the intramolecular electron transfer could be directed. The calculated position of S1-S0 electronic transition was only 380 nm in this case.
Just this structure is guessed to be responsible for the blue fluorescence. At the same time, in our calculations we obtained definite arguments, which are consistent with hypothesis represented in the above scheme. In many cases of calculated electronically excited rhodamine’s lactones, the anomalous elongation was observed just for ester CO–O bond in the lactone cycle. For example, the length of this bond in 1 lactone ground state is 1.37 Å, while as in the electronically excited state it is ~1.49 Å.

3. Experimental

3.1. Materials

Rhodamine B was chromatographically pure; its purity was checked also by fluorescence synchronous scanning spectra. The synthesis and identification of rhodamines 212 was published previously [36]. The synthesis of dyes 1315 is described below. The organic solvents were purified and dehydrated using the accepted procedures. Hydrochloric and sulfuric acids, 5,5-diethylbarbituric acid La(NO3)3, solid NaOH and KOH were of analytical grade, the standard sodium hydroxide solution was prepared using CO2-free water and was protected from the atmosphere. Lithium and calcium perchlorates were synthesized, re-crystallized, dried, and kept protected from moisture. Magnesium perchlorate was re-crystallized and used as Mg(ClO2)2·3H2O. Salicylic acids, analytical grade, was twice re-crystallized from benzene, and 95.6% aqueous ethanol, respectively, then dried under vacuum (5 Torr) at 50–70 °C to constant mass and stored in vacuum-desiccator over CaCl2. Benzoic acid was twice sublimated. p-Toluenesulfonic acid was used as monohydrate. 1,8-Diazabicyclo[5.4.0]undec-7-ene (DBU, Aldrich, St. Louis, MO, USA) was used as received.

3.2. Synthesis of Dyes 1315

2-(6-(dimethylamino)-3-(dimethyliminio)-3H-xanthen-9-yl)-2-pyridinecarboxylate (13). 2,3-pyridinedicarboxylic anhydride (290 mg, 2 mmol) of and 550 mg (4 mmol) of m-dimethylaminophenol was melted for 2 h at 120–130 °C. After cooling, the red-violet mass was dissolved in 10 mL of concentrated hydrochloric acid, diluted with 50 mL of water and neutralized with 20% sodium hydroxide solution to pH = 6–7. Murrey precipitate was filtered off and washed with water. Yield: 500 mg (65%). Crude product was purified by column chromatography on Silica gel 60 with chloroform/methanol (10:1, v/v) as eluent. Mp 290 °C; 1H NMR (DMSO-d6, 300 MHz): δ 2.94 (s, 12H, N(CH3)2), 6.44–6.56 (m, 6H)—xanthene fragment protons, 7.70 (t, J = 6.3 Hz, 1H), 8.44 (dd, J1 = 7.8 Hz, J2 = 1.4 Hz, 1H), 8.86 (dd, J1 = 4.7 Hz, J2 = 1.4 Hz, 1H). UV-Vis (ethanol): λmax(abs) 548 nm (ε = 70,000 M−1 cm−1); λmax(fluor) 584 nm. FAB-MS (NBA) calcd. for (MH)+ [C23H22N3O3]+ m/z 388.17, found m/z 388.42.
2-(6-(diethylamino)-3-(diethylliminio)-3H-xanthen-9-yl)-2-pyridinecarboxylate (14). 2,3-pyridinedicarboxylic anhydride (290 mg, 2 mmol) and 660 mg (4 mmol) of m-diethylaminophenol was melted for 1.5 h at 110–125 °C. After cooling, the red-violet mass was dissolved in 10 mL of concentrated hydrochloric acid, diluted with 50 mL of water and neutralized with 20% sodium hydroxide solution to pH = 6–7. Murrey precipitate was filtered off and washed with water. Yield: 410 mg (43%). Crude product was twice purified by column chromatography on Silica gel 60 with methanol and methanol/acetone (1:10, v/v) as eluent. Mp 158–159.5 °C; 1H NMR (DMSO-d6, 200 MHz): δ 1.10 (t, J = 7.0 Hz, 12H, N(CH2CH3)2), 3.36 (q, J1 = 7.0 Hz, J2 = 14.0 Hz, 8H, N(CH2CH3)2), 6.06 (s, 2H), 6.37–6.52 (m, 4H)—xanthene fragment protons, 7.69 (t, 1H), 8.42 (d, J = 7.5 Hz, 1H), 8.86 (d, J = 4.6 Hz, 1H)—pyridine fragment protons. UV-Vis (ethanol): λmax(abs) 552 nm (ε = 72,500 M−1 cm−1); λmax(fluor) 585 nm. FAB-MS (NBA) calcd. for (MH)+ [C27H30N3O3]+ m/z 444.23, found m/z 444.11.
3-(2,3,6,7,12,13,16,17-octahydro-1H,5H,11H,15H-pyrido[3,2,1-ij]quinolizino[1′,9′:6,7,8]chromeno[2,3-f]quinolin-4-ium-9-yl)-2-pyridinecarboxylate (15). 2,3-pyridinedicarboxylic anhydride (150 mg, 1 mmol) of and 380 mg (2 mmol) of 8-hydroxyjulolidine was heated for an hour at 110–120 °C and an hour at 140–150 °C. After cooling red-violet mass was dissolved in 5 mL of concentrated hydrochloric acid, diluted with 50 mL of water and neutralized with 20% sodium hydroxide solution to pH = 6–7. Violet crystals were filtered off and washed with water. Yield: 400 mg (76%). Crude product was purified by column chromatography on Silica gel 60 with chloroform/methanol (10:1, v/v) as eluent. Mp > 300 °C; 1H NMR (DMSO-d6, 300 MHz): δ 1.81 (t, J = 5.2 Hz, 4H), 1.98 (t, J = 5.1 Hz, 4H), 2.92 (t, J = 2.9 Hz, 4H), 3.24–3.44 (m, 12H)—protons of the julolidine fragment, 6.26 (s, 2H), 7.62 (t, J = 6.2 Hz, 1H), 8.37 (dd, J1 = 1.4 Hz, J2 = 7.9 Hz, 1H), 8.76 (dd, J1 = 1.4 Hz, J2 = 4.6 Hz, 1H). UV-Vis (ethanol): λmax(abs) 571 nm (ε = 70,000 M−1 cm−1); λmax(fluor) 604 nm. FAB-MS (NBA) calcd. for (MH)+ [C31H30N3O3]+ m/z 492.23, found m/z 492.06.

3.3. Apparatus

UV-visible absorption spectra were measured against solvent blanks at room temperature with a Perkin-Elmer Lambda 35 UV/vis spectrophotometer (Waltham, MA, USA) and at 25 °C with Hitachi U-2000 (Hitachi, Tokyo, Japan). Absorption maxima were recorded with an accuracy of 0.5 nm. The optical path length was 1 and 5 cm. Infrared spectra were measured with a Specord IR-75 apparatus (Analytik, Jena, Germany). Fluorescence spectra were taken by a Cary Eclipse spectrofluorometer (Agilent Technologies, Santa Clara, CA, USA). NMR spectra were recorded in CD3OD and DMSO-d6 by a Mercury Varian VX-200 and Varian VNMRS-400 instruments (Varian Inc., Palo Alto, CA, USA). Determination of pH in aqueous solutions was performed at 25.0 ± 0.1 °C on a P 37-1 potentiometer and pH-121 pH -meter equipped with ESL-63-07 glass electrode (ZIP, Gomel, Belarus) and a Ag|AgCl reference electrode in a cell with liquid junction (1 M KCl). Standard buffers ( pH 1.68, 4.01, 6.86, and 9.18) were used for cell calibration.

3.4. Procedure

For the spectrophotometric determination of the tautomerization constants in 90 mass% aqueous acetone and in other water–organic mixtures, 0.02 M HCl and 0.001 M NaOH (or, in some cases, a veronal buffer mixture: 0.01 M acid + 0.005 M NaOH), s) were used for transforming the dyes in the cationic and neutral form, respectively. In non-aqueous media, alcohols, acetonitrile, N,N-dimethylformamide, and DMSO, additions of conc. H2SO4 and NaOH (for alcohols) and DBU (for non-HBD solvents) were used. In this case, the concentrations of the acid and base were normally 0.01 M. Determinations of the p K a values in water and nonaqueous solvents were made by standard procedures. Normally, the dye concentrations were about 1 × 10⁻⁵ M for measuring the absorption spectra of dye cations and p K a determinations, and around 1 × 10⁻⁶ M at emission measurements. As a rule, the concentrated stock solution of a dye was diluted ten-fold or even more, then corresponding acidic or basic components were added, and finally the flask was made up by the solvent. However, the sequence of mixing the components did not affect the results. For precise determinations of the molar absorptivities of the dyes neutral forms in the visible region, the working concentrations and optical path cells were adjusted in order to obtain the values of absorptivities in the optimal absorbance range. Therefore, in some cases the dye concentrations were enhanced up to 10−4 M. The infrared spectra were run at dye concentration of 0.03 M, while in the NMR experiments it was as high as ≈0.1 M.

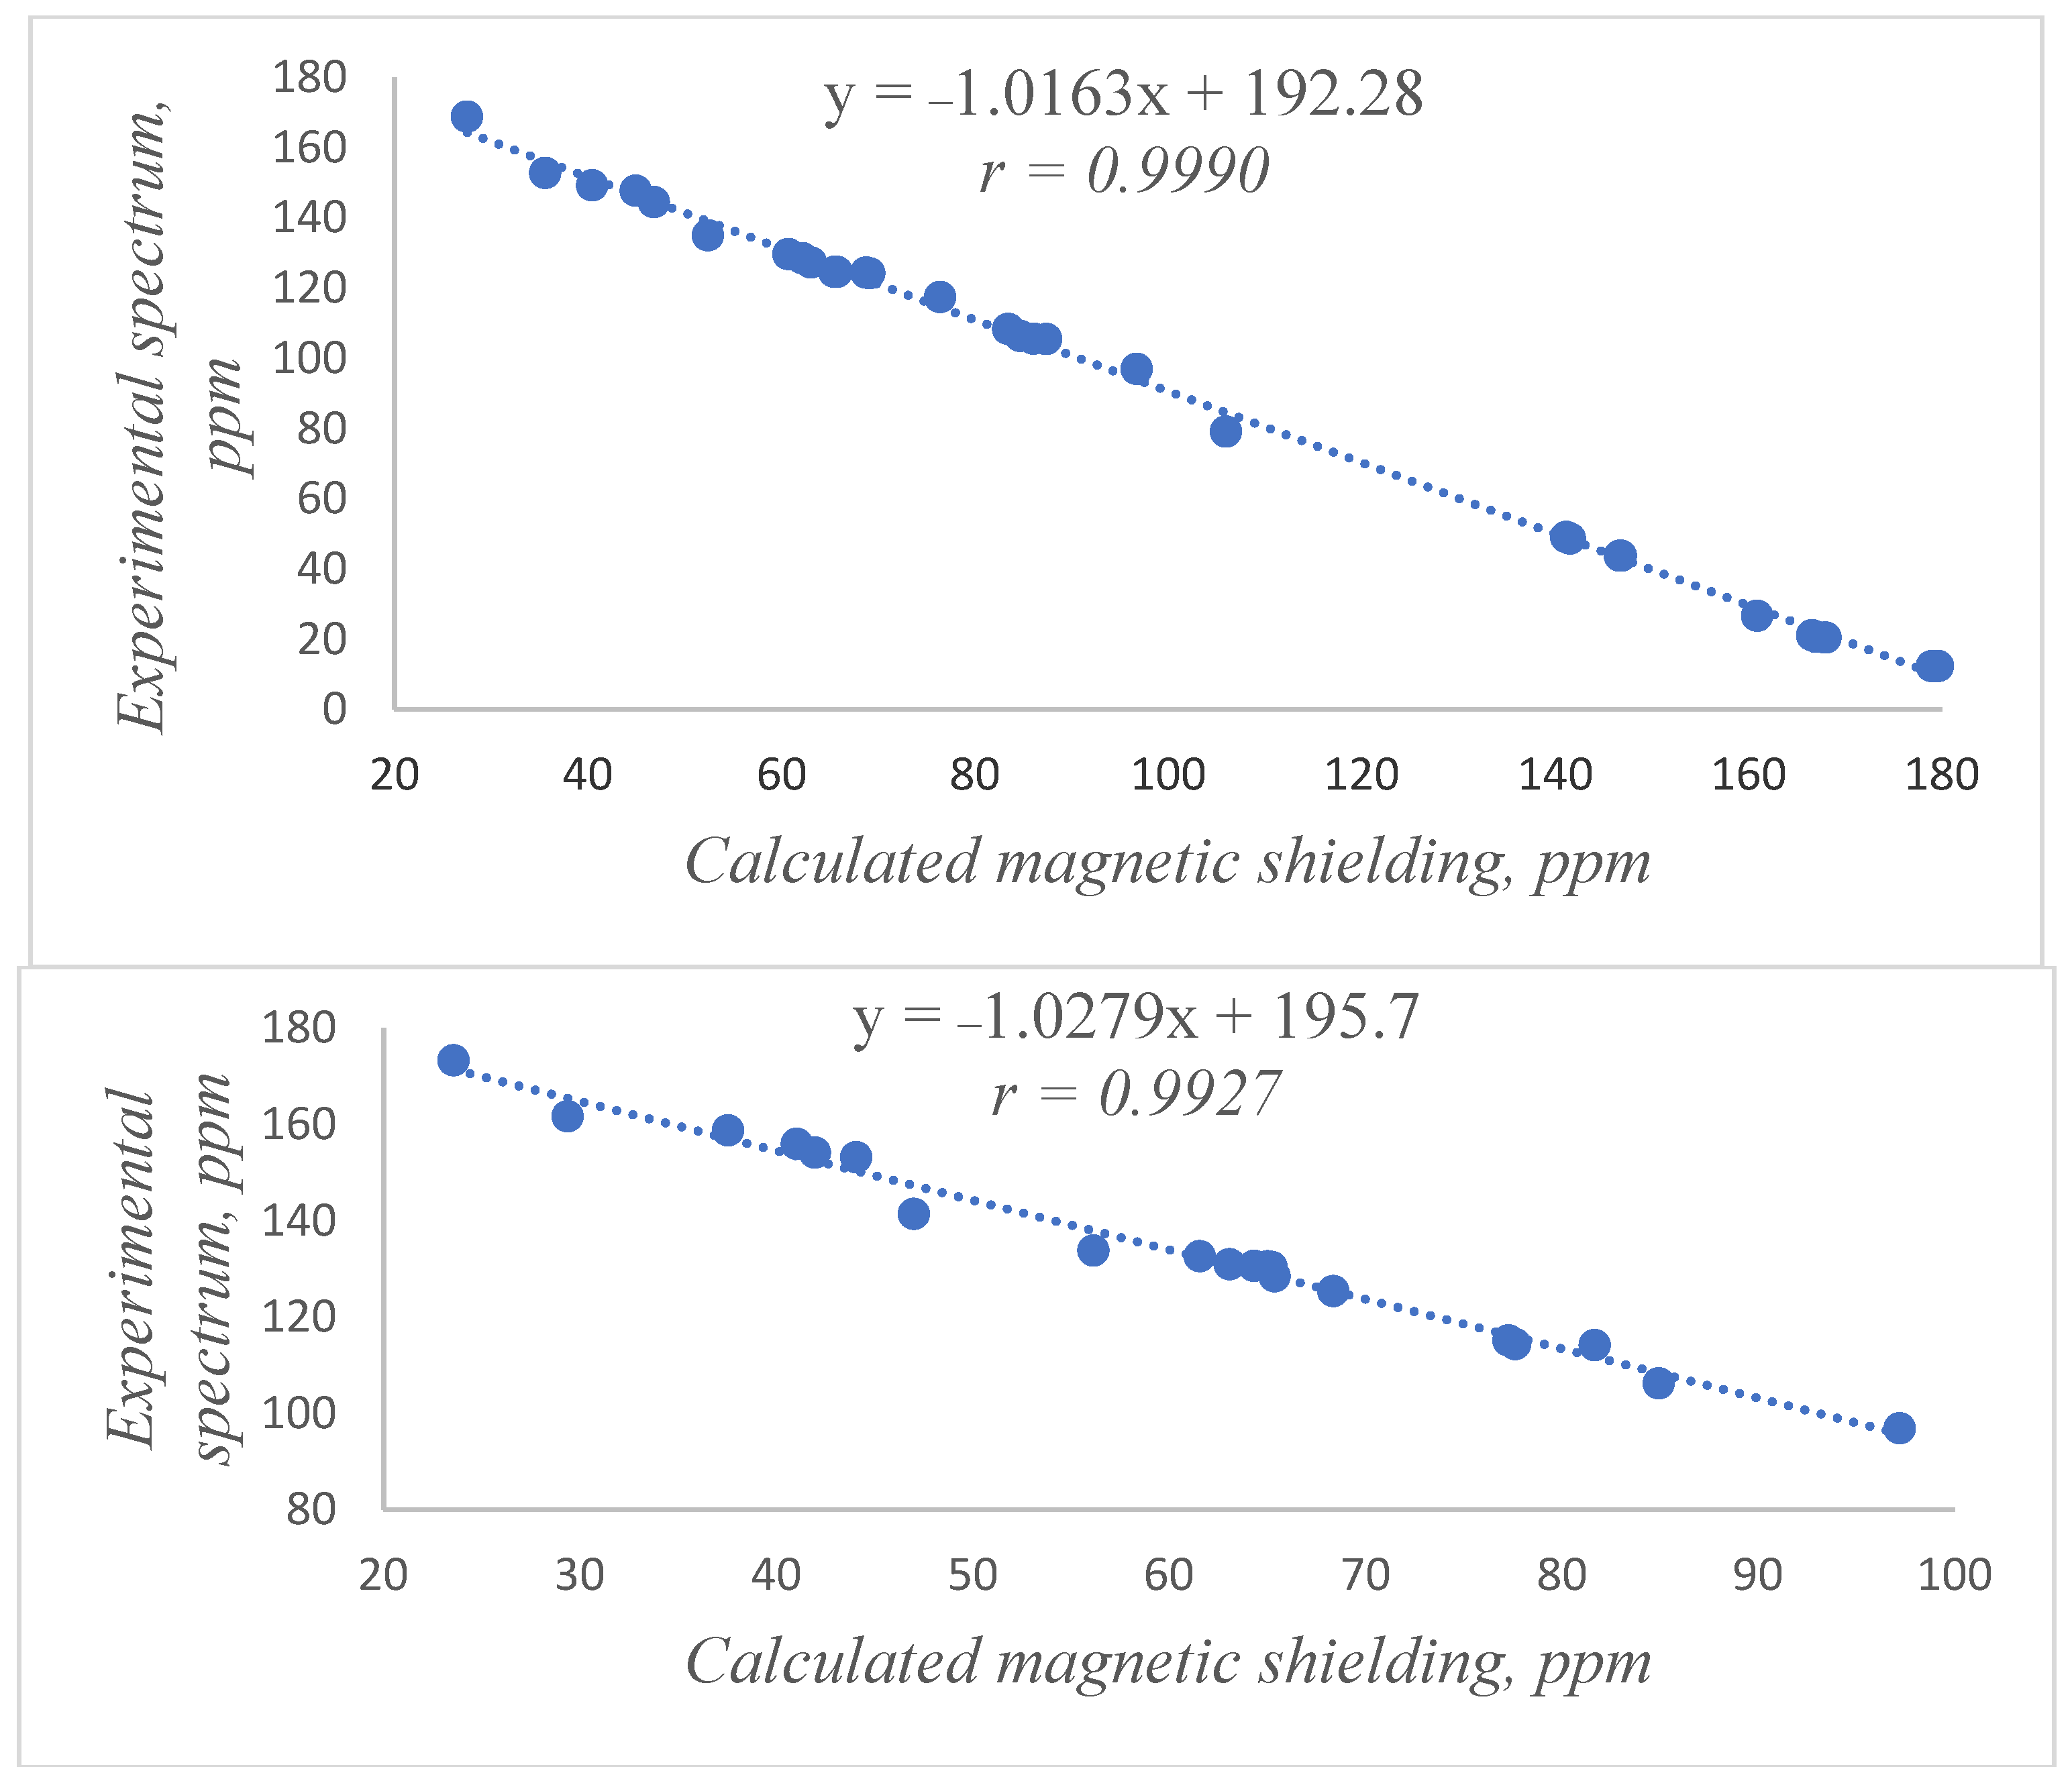
3.5. Quantum-Chemical Calculations

Quantum-chemical modeling of molecular geometry and electron density redistribution of the investigated rhodamines lactone and zwitterion forms were conducted by Gaussian-09 (Revision B.01) software [122] in DFT scheme with b3lyp [123] electron density functional and cc-PVDZ [124] basis set. Calculation of zwitterions was performed by the PCM universal solvation model [125] and relative permittivity of DMSO. NMR magnetic shielding were calculated within GIAO approach [126]. Definite elements of Bader AIM (atoms-in-molecules) theory [112,113,114] were used for rough estimation of non-covalent interactions energy in the zwitterionic form. Electronic absorption spectra were calculated with NWChem 5.1 program [127], equipped with ESSA module [109,110] for analyses of the localization of electronic transitions [108] and redistribution of electron density at electronic excitation.

4. Conclusions

Mobile equilibrium between the colored and colorless tautomers of rhodamine dyes is a kind of a more general chain–ring tautomerism. The absorption spectrum of the colored tautomer of the neutral form R (zwitterion R±) in the visible resembles that of the cation, HR+, of the same compound. A spectrophotometric study of a series of rhodamine dyes, as well as the earlier studied rhodamine B in 90% aqueous acetone clearly demonstrates the decisive role of the substituents in the xanthene part of the dye molecule on the state of the tautomeric equilibrium. The lactone/zwitterions ratio varies from 30 to (0.1–0.32). This is the first case of such a wide variation in the tautomerization constants.
The lactonic structure of the colorless tautomer R0 has been proved by using infrared spectroscopy. 13C NMR spectrum of the neutral form in DMSO(d6) support this result, while that in CD3OD give evidence of zwitterionic structure R± of the colored fraction. Consideration of the dissociation of rhodamines (HR+ ⇄ R + H+) allows shedding additional light on the structure of rhodamines. Namely, increase in the p K a values at going from water to aqueous acetone confirms the highly polar character of the R± tautomer.
Examining of the role of the solvent nature, tautomerism of the asymmetrical rhodamine 5, was examined in 14 media. Attempts were made to analyze the data using a single solvent descriptor. The logarithm of the equilibrium constant, KT = [R0]/[R±], better correlates with the normalized Reichardt’s parameter, E T N , in solvent of similar chemical nature, whereas unification of alcohols and non-hydrogen bond-donors (DMSO, DMF, etc.) with log K T within the range of (−1.55 to +1.95) leads to a poor correlation. At the same time, the chain–ring tautomerism of rhodamines is an intramolecular acid–base reaction, where the central carbon atom, C9, acts as an internal Lewis acid. Then, modeling of the closure of the lactone cycle by protonation of the COO group of the benzoate ion allows to describe the influence of seven solvents, including alcohols, acetonitrile, DMF, and DMSO, with correlation coefficient of 0.96:
log K T = 3.140 + 0.505 ( p K a , HBenz s p K a , HBenz w log γ H + )
Our proposed approach is an alternative to the traditional interpretation of the chain–ring tautomerism of rhodamines based on common solvent descriptors.
On the other hand, interaction of the carboxylate group takes place with external Lewis acids, Li+, Ca2+, Mg2+, and La3+. In solvents where the lactone R0 predominate, interaction with Mg2+ and La3+ cations results in cleavage of lactone cycle and appearance of the zwitterion R±, in line with finding of Hojo for rhodamine B and similar compounds.
In polar solvents, lactones undergo photocleavage resulting in formation of highly fluorescent tautomer R±. This effect, well-known for rhodamine B, is confirmed in the present study with other rhodamines. On the other hand, the blue fluorescence and an anomalously high Stokes shift of rhodamine lactones in low-polar media was shown by us as a general effect characteristic of all rhodamines studied by us. The reason may be either spiroconjugation and charge transfer in the exited state. Hypothesis of the blue fluorescence owing to the excited state structural relaxation process of the “butterfly” type was formulated by us for the first time in the present paper. As an alternative explanation, another way of lactone cycle rupture was proposed in the present paper.
In general, we believe that the results presented in this article will contribute to the purposeful application of rhodamines in various fields of chemistry, including those that were discussed in the Introduction.

Author Contributions

O.M.O.: Investigation, Methodology, Visualization, and Writing—original draft; N.O.M.-P.: Conceptualization, Data curation, Project administration, Methodology, Supervision, Writing—original draft, and Writing—review and editing; N.A.V.: Investigation, Formal analysis, Methodology, Validation, and Visualization; L.D.P.: Investigation, Formal analysis, Project administration, Resources, and Writing—review and editing; A.O.D.: Conceptualization, Resources, Software, Data curation, and Writing—review and editing. All authors have read and agreed to the published version of the manuscript.

Funding

This research received no external funding.

Informed Consent Statement

Not applicable.

Conflicts of Interest

The authors declare no conflict of interest.

References

  1. Beija, M.; Afonso, C.A.M.; Martinho, J.M.G. Synthesis and applications of rhodamine derivatives as fluorescent probes. Chem. Soc. Rev. 2009, 38, 2410–2433. [Google Scholar] [CrossRef] [PubMed] [Green Version]
  2. Han, J.; Burgess, K. Fluorescent indicators for intracellular pH. Chem. Rev. 2010, 110, 2709–2728. [Google Scholar] [CrossRef] [PubMed]
  3. Haugland, R.P. Handbook of Fluorescent Probes and Research Products, 9th ed.; Molecular Probes, Inc.: Eugene, OR, USA, 2002. [Google Scholar]
  4. Shin, Y.; Kim, K.S.; Kim, B. Loading behavior of pH-responsive P(MMA-co-EGMA) hydrogel microparticles for intelligent drug delivery applications. Polymer 2008, 32, 421–426. [Google Scholar] [CrossRef]
  5. Liu, W.; Chen, J.; Xu, L.; Wu, J.; Zhang, H.; Wang, P. Reversible “off–on” fluorescence chemosensor for Hg2+ based on rhodamine derivative. Spectrochim. Acta A 2012, 85, 38–42. [Google Scholar] [CrossRef]
  6. Freddi, S.; Sironi, L.; D’Antuono, R.; Morone, D.; Dona, A.; Cabrini, E.; D’Alfonso, L.; Collini, M.; Pallavicini, P.; Baldi, G.; et al. A Molecular Thermometer for Nanoparticles for Optical Hyperthermia. Nano Lett. 2013, 13, 2004–2010. [Google Scholar] [CrossRef]
  7. Rittikulsittichai, S.; Singhana, B.; Bryan, W.W.; Sarangi, S.; Jamison, A.C.; Brazdeikis, A.; Lee, T.R. Preparation, characterization, and utilization of multifunctional magnetic-fluorescent composites for bioimaging and magnetic hyperthermia therapy. RSC Adv. 2013, 3, 7838–7849. [Google Scholar] [CrossRef]
  8. Moreno-Villoslada, I.; Jofre, M.; Miranda, V.; Gonzalez, R.; Sotelo, T.; Hess, S.; Rivas, B.L. pH Dependence of the Interaction between Rhodamine B and the Water-Soluble Poly(sodium 4-styrenesulfonate). J. Phys. Chem. B 2006, 110, 11809–11812. [Google Scholar] [CrossRef]
  9. Bujdak, J.; Czimerova, A.; Lopez Arbeloa, F. Two-step resonance energy transfer between dyes in layered silicate films. J. Colloid Interface Sci. 2011, 364, 497–504. [Google Scholar] [CrossRef]
  10. Nikishiori, H.; Fujii, T. Molecular forms of rhodamine B in dip-coated thin films. J. Phys. Chem. B 1997, 101, 3680–3687. [Google Scholar] [CrossRef]
  11. Merka, O.; Yarovyi, V.; Bahnemann, D.W.; Wark, M. pH-Control of the photocatalytic degradation mechanism of rhodamine B over Pb3Nb4O13. J. Phys. Chem. C 2011, 115, 8014–8023. [Google Scholar] [CrossRef]
  12. Watarai, H.; Funaki, F. Total Internal Reflection Fluorescence Measurements of Protonation Equilibria of Rhodamine B and Octadecylrhodamine B at a Toluene/Water Interface. Langmuir 1996, 12, 6717–6720. [Google Scholar] [CrossRef]
  13. Tsukahara, S.; Yamada, Y.; Watarai, H. Effect of surfactants on in-plane and out-of-plane rotational dynamics of octadecylrhodamine B at toluene–water interface. Langmuir 2000, 16, 6787–6794. [Google Scholar] [CrossRef]
  14. Tokimoto, T.; Tsukahara, S.; Watarai, H. Lactone-cleavage reaction kinetics of rhodamine dye at liquid/liquid interfaces studied by micro-two-phase sheath flow/two-photon excitation fluorescence microscope. Langmuir 2005, 21, 1299–1304. [Google Scholar] [CrossRef] [PubMed]
  15. Matsui, T.; Tsukahara, S.; Watarai, H. Single-molecule lactonization of octadecylrhodamine B at a liquid-liquid interface. Langmuir 2012, 28, 15428–15432. [Google Scholar] [CrossRef]
  16. Zhen, X.-Y.; Harata, A. Confocal fluorescence microscope studies of the adsorptive behavior of dioctadecyl-rhodamine B molecules at a cyclohexane–water interface. Anal. Sci. 2001, 17, 131–135. [Google Scholar] [CrossRef] [PubMed] [Green Version]
  17. Snare, M.J.; Treloar, F.E.; Ghiggino, K.P.; Thistlethwaite, P.J. The photophysics of rhodamine B. J. Photochem. 1982, 18, 335–346. [Google Scholar] [CrossRef]
  18. Chang, T.-L.; Cheung, H.C. Solvent effect on photoisomerisation rates of the zwitterionic and the cationic forms of rhodamine B in protic solvents. J. Phys. Chem. 1992, 96, 4874–4878. [Google Scholar] [CrossRef]
  19. Magde, D.; Rogas, G.E.; Seybold, P.G. Solvent dependence of the fluorescence lifetime of xanthene dyes. Photochem. Photobiol. 1999, 70, 737–744. [Google Scholar] [CrossRef]
  20. Karpiuk, J.; Grabowski, Z.R.; De Schryver, F.C. Photophysics of the Lactone Form of Rhodamine 101. J. Phys. Chem. 1994, 98, 3247–3256. [Google Scholar] [CrossRef]
  21. El-Rayyes, A.A.; Al-Arfai, A.A.; Klein, U.K.A.; Barri, S.A.I. Acidity of all-slica MCM-41–studied by laser spectroscopy of adsorbed fluorescent probe compounds. Catal. Lett. 2004, 97, 83–90. [Google Scholar] [CrossRef]
  22. Sinelnikov, A.N.; Artyukhov, V.Y. Fluorescence of the lactone form of rhodamine B. Russ. J. Phys. Chem. A 2013, 87, 1409–1416. [Google Scholar] [CrossRef]
  23. Zhang, X.-F.; Zhang, Y.; Liu, L. Fluorescence lifetimes and quantum yields of ten rhodamine derivatives: Structural effect on emission mechanism in different solvents. J. Lumin. 2014, 145, 448–453. [Google Scholar] [CrossRef]
  24. Sagoo, S.K.; Jockusch, R.A. The fluorescence properties of cationic rhodamine B in the gas phase. J. Photochem. Photobiol. A Chem. 2011, 220, 173–178. [Google Scholar] [CrossRef]
  25. Nagy, A.M.; Talbot, F.; Czar, M.F.; Jockusch, R.A. Fluorescence lifetimes of rhodamine dyes in vacuo. J. Photochem. Photobiol. A Chem. 2012, 244, 47–53. [Google Scholar] [CrossRef]
  26. Caruana, M.V.; Fava, M.C.; Magri, D.C. A colorimetric and fluorimetric three-input inverted enabled OR logic array by self-assembly of a rhodamine probe in micelles. Asian J. Org. Chem. 2015, 4, 239–243. [Google Scholar] [CrossRef]
  27. Tahara, K.; Mikuriya, K.; Masuko, T.; Kikuchi, J.-I.; Hisaeda, Y. Dechlorination of DDT catalyzed by visible-light-driven system composed of vitamin B12 derivative and Rhodamine B. J. Porphyr. Phthalocyanines 2013, 17, 135–141. [Google Scholar] [CrossRef]
  28. Kim, Y.-R.; Kim, H.J.; Kim, J.S.; Kim, H. Rhodamine-based “turn-on” fluorescent chemodosimeter for Cu(II) on ultrathin platinum films as molecular switches. Adv. Mater. 2008, 20, 4428–4432. [Google Scholar] [CrossRef]
  29. Doumani, N.; Bou-Maroun, E.; Maalouly, J.; Tueni, M.; Dubois, A.; Bernhard Denat, F.; Cayot, P.; Sok, N. A new pH-dependent macrocyclic rhodamine B-based fluorescence probe for copper detection in white wine. Sensors 2019, 19, 4514. [Google Scholar] [CrossRef] [Green Version]
  30. Kamino, S.; Horio, Y.; Komeda, S.; Minoura, K.; Ichikawa, H.; Horigome, J.; Tatsumi, A.; Kaji, S.; Yamaguchi, T.; Usami, Y.; et al. A new class of rhodamine luminophores: Design, syntheses and aggregation-induced emission enhancement. Chem. Commun. 2010, 46, 9013–9015. [Google Scholar] [CrossRef]
  31. Kamino, S.; Muranaka, A.; Murakami, M.; Tatsumi, A.; Nagaoka, N.; Shirasaki, Y.; Watanabe, K.; Yoshida, K.; Horigome, J.; Komeda, S.; et al. A red-emissive aminobenzopyrano-xamthene dye: Elucidation of fluorescence emission mechanisms in solution and in the aggregate state. Phys. Chem. Chem. Phys. 2013, 15, 2131–2140. [Google Scholar] [CrossRef]
  32. Kamino, S.; Murakami, M.; Tanioka, M.; Shirasaki, Y.; Watanabe, K.; Horigone, J.; Ooyama, Y.; Enomoto, S. Design and syntheses of highly emissive aminobenzopyrano-xanthene dyes in the visible and far-red regions. Org. Lett. 2014, 16, 258–261. [Google Scholar] [CrossRef] [PubMed]
  33. Tanioka, M.; Kamino, S.; Muranaka, A.; Ooyama, Y.; Ota, H.; Shirasaki, Y.; Horigome, J.; Ueda, M.; Uchiyama, M.; Sawada, D.; et al. Reversible near-infrared/blue mechanofluorochromism of aminobenzopyranoxanthene. J. Am. Chem. Soc. 2015, 137, 6436–6439. [Google Scholar] [CrossRef] [PubMed]
  34. Shirasaki, Y.; Okamoto, Y.; Muranaka, A.; Kamino, S.; Sawada, D.; Hashizume, D.; Uchiyama, M. Fused-fluoran leuco dyes with large coloe-change derived from two-step equilibrium: Iso-aminobenzopyranoxanthenes. J. Org. Chem. 2016, 81, 12046–12051. [Google Scholar] [CrossRef] [PubMed]
  35. Tanioka, M.; Kamino, S.; Muranaka, A.; Shirasaki, Y.; Ooyama, Y.; Ueda, M.; Uchiyama, M.; Ueda, M.; Enomoto, S.; Sawada, D. Water-tunable solvatochromic and nanoaggregate fluorescence: Dual color visualization and quantification of trace water in tetrahydrofuran. Phys. Chem. Chem. Phys. 2017, 19, 1209–1216. [Google Scholar] [CrossRef] [PubMed]
  36. Obukhova, E.N.; Mchedlov-Petrossyan, N.O.; Vodolazkaya, N.A.; Patsenker, L.D.; Doroshenko, A.O.; Marynin, A.I.; Krasovitskii, B.M. Absorption, fluorescence, and acid-base equilibria of rhodamines in micellar media of sodium dodecyl sulfate. Spectrochim. Acta Part A Mol. Biomol. Spectrosc. 2017, 170, 138–144. [Google Scholar] [CrossRef] [PubMed]
  37. Ramette, R.W.; Sandell, E.B. Rhodamine B Equilibria. J. Am. Chem. Soc. 1956, 78, 4872–4878. [Google Scholar] [CrossRef]
  38. Ferguson, J.; Mau, A.W.H. Absorption studies of acidbase equilibria of dye solutions. Chem. Phys. Lett. 1972, 17, 543–546. [Google Scholar] [CrossRef]
  39. Sadkowski, P.J.; Fleming, G.R. Photophysics of the acid and base forms of rhodamine B. Chem. Phys. Lett. 1978, 57, 526–529. [Google Scholar] [CrossRef]
  40. Rosenthal, I.; Peretz, P.; Muszkat, K.L. Thermochromic and hyperchromic effects in rhodamine B solutions. J. Phys. Chem. 1979, 83, 350–353. [Google Scholar] [CrossRef]
  41. Faraggi, M.; Peretz, P.; Rosenthal, I.; Weinraub, D. Solution properties of dye lasers. Rhodamine B in alcohols. Chem. Phys. Lett. 1984, 103, 310–314. [Google Scholar] [CrossRef]
  42. Hinckley, D.A.; Seybold, P.G.; Borris, D.P. Solvatochromism and thermochromism of rhodamine solutions. Spectrochim. Acta 1986, 42A, 747–754. [Google Scholar] [CrossRef]
  43. Lopez Arbeloa, I.; Rohatgi-Mukerjee, K.K. Solvent effects on the photophysics of the molecular forms of rhodamine B internal conversion mechanism. Chem. Phys. Lett. 1986, 129, 607–614. [Google Scholar] [CrossRef]
  44. Lopez, F.; Ruiz Ojeda, P.; Lopez Arbeloa, I. Fluorescence self-quenching of the molecular forms of rhodamine B in aqueous and ethanolic solutions. J. Lumin. 1989, 44, 105–112. [Google Scholar] [CrossRef]
  45. López Arbeloa, F.; López Arbeloa, T.; Tapia Estévez, M.J.; López Arbeloa, I. Photophysics of rhodamines: Molecular structure and solvent effects. J. Phys. Chem. 1991, 95, 2203–2208. [Google Scholar] [CrossRef]
  46. Kanasaki, E. Thermochromism and photochromism of rhodamine B. Kagaku Kogyo Chem. Chem. Ind. 1987, 40, 870–871. (In Japanese) [Google Scholar]
  47. Adamovich, L.P.; Melnik, V.V.; Mchedlov-Petrossyan, N.O. Rhodamine B equilibria in aqueous salt solutions. Zhurnal Fiz. Khimii 1979, 53, 356–359. [Google Scholar]
  48. Kurtaliev, E.N.; Khonkeldieva, M.T.; Talipov, S.A.; Nizomov, N.; Ibragimov, B.T. X-ray study of structure of chloride rhodamine B disolvate with chloroform. Uzb. J. Phys. 2015, 17, 261–264. (In Russian) [Google Scholar]
  49. Kvick, A.; Vaughan, G.B.M.; Wang, X.; Sun, Y.; Long, Y. A synchrotron-radiation study of the lactone form of rhodamine B at 120 K. Acta Crystallogr. C Cryst. Struct. Commun. 2000, C56, 1232–1233. [Google Scholar] [CrossRef] [Green Version]
  50. Wang, X.; Song, M.; Lomg, Y. Synthesis, characterization, and crystal structure of the lactone form of rhodamine B. J. Solid State Chem. 2001, 156, 325–330. [Google Scholar] [CrossRef]
  51. Lopez Arbeloa, F.; Urrecha Aquirresacona, I.; Lopez Arbeloa, I. Influence of the molecular structure and the nature of the solvent on the absorption and fluorescence characteristics of rhodamines. Chem. Phys. 1989, 130, 371–378. [Google Scholar] [CrossRef]
  52. Barigelletti, F. Effect of temperature on the photophysics of rhodamine 101 in a polar solvent. Chem. Phys. Lett. 1987, 140, 603–606. [Google Scholar] [CrossRef]
  53. Elderfield, R.C. (Ed.) Heterocyclic Compounds; Wiley: New York, NY, USA, 1954; Volume 2. [Google Scholar]
  54. Sivakumar, M.; Pandit, A.B. Ultrasound enhanced degradation of rhodamine B: Optimization with power density. Ultrason. Sonochem. 2001, 8, 233–240. [Google Scholar] [CrossRef]
  55. Mallah, H.A.; Naoufal, D.M.; Safa, A.I.; El Jamal, M.M. Study of the Discoloration Rate of Rhodamine B as a Function of the Operating Parameters at Pt and BDD Electrodes. Port. Electrochim. Acta 2013, 31, 185–193. [Google Scholar] [CrossRef]
  56. Beshir, W.B.; Eid, S.; Gafar, S.M.; Ebraheem, S. Application of solutions of Rhodamine B in dosimetry. Appl. Radiat. Isot. 2014, 89, 13–17. [Google Scholar] [CrossRef]
  57. Mchedlov-Petrossyan, N.O.; Kholin, Y.V. Aggregation of Rhodamine B in Water. Russ. J. Appl. Chem. 2004, 77, 414–422. [Google Scholar] [CrossRef]
  58. Mchedlov-Petrossyan, N.O. Ionization and tautomeric interconversions of rhodamine dyes. Zhurnal Fiz. Khimii 1985, 59, 3000–3004. (In Russian) [Google Scholar]
  59. Mchedlov-Petrossyan, N.O.; Salinas Mayorga, R.; Surov, Y.N. Ionization and tautomerism of xanthene dyes in mixtures of water with dimethyl sulfoxide. Zhurnal Obs. Khimii (Russ. J. Gen. Chem.) 1991, 61, 225–233. (In Russian) [Google Scholar]
  60. Mchedlov-Petrosyan, N.O.; Fedorov, L.A.; Sokolovskii, S.A.; Surov, Y.N.; Salinas Maiorga, R. Structural conversions of rhodamines in solutions. Bull. Russ. Acad. Sci. Divis. Chem. Sci. 1992, 3, 403–409. [Google Scholar] [CrossRef]
  61. Mchedlov-Petrossyan, N.O.; Kukhtik, V.I.; Bezugliy, V.D. Dissociation, tautomerism and electroreduction of xanthene and sulfonephthalein dyes in N,N-dimethylformamide and other solvents. J. Phys. Org. Chem. 2003, 16, 380–397. [Google Scholar] [CrossRef]
  62. Mchedlov-Petrossyan, N.O. Ionization constant of triple-charged cation of rhodamine B. Zhurnal Fiz. Khimii 1979, 53, 2041–2042. [Google Scholar]
  63. Ponomarev, O.A.; Doroshenko, A.O.; Pedash, Y.F.; Mchedlov-Petrosyan, N.O. On the anomalous Stokes shift of fluorescence of lactones of rhodamine dyes. Zhurnal Fiz. Khimii 1989, 63, 2219–2222. (In Russian) [Google Scholar]
  64. Ramos, S.S.; Vilhena, A.F.; Santos, L.; Almeida, P. 1H and 13C NMR spectra of commercial rhodamine ester derivatives. Magn. Reson. Chem. 2000, 38, 475–478. [Google Scholar] [CrossRef]
  65. Reichardt, C.; Welton, T. Solvents and Solvent Effects in Organic Chemistry, 4th ed.; Wiley-VCH: Weinheim, Germany, 2011. [Google Scholar]
  66. Mchedlov-Petrossyan, N.O. Chemical Equilibrium of Multifunctional Compounds of Xanthenes and Triphenylmethane Series in Nonaqueous Media. Ph.D. Dissertation, Kharkov State University, Kharkov, Ukraine, 1992. [Google Scholar]
  67. Mollin, J.; Kucerova, T. Acid-base properties and isomerism of nicotinic acid. Chem. Zvesti 1979, 33, 52–56. [Google Scholar]
  68. Niazi, M.S.K.; Mollin, J. Dissociation constants of some amino acids and pyridinecarboxylic acids in ethanol–water mixtures. Bull. Chem. Soc. Jpn. 1987, 60, 2605–2610. [Google Scholar] [CrossRef] [Green Version]
  69. Mchedlov-Petrossyan, N.O.; Kalembet, O.A.; Arias Cordova, E. Tautomerism of rhodamines. I. Kharkov Univ. Bull. 1989, 340, 3–18. [Google Scholar]
  70. Bates, R. Determination of pH, Theory and Practice, 2nd ed.; John Wiley & Sons: Hoboken, NJ, USA, 1973. [Google Scholar]
  71. Kolthoff, I.M.; Chantooni, M.K.; Bhowmik, S. Dissociation constants of uncharged and monovalent cation acids in dimethyl sulfoxide. J. Am. Chem. Soc. 1968, 90, 23–28. [Google Scholar] [CrossRef]
  72. Mchedlov-Petrossyan, N.O. Protolytic equilibrium in lyophilic nano-sized dispersions: Differentiating influence of the pseudophase and salt effects. Pure Appl. Chem. 2008, 80, 1459–1510. [Google Scholar] [CrossRef]
  73. Breant, M.; Auroux, A.; Lavergne, M. Détermination spectrophotométrique de la partie acide de l’échelle de ph dans la n-méthylpyrrolidone et le diméthylacétamide. Anal. Chim. Acta 1976, 83, 49–57. [Google Scholar] [CrossRef]
  74. Mchedlov-Petrossyan, N.O.; Filatov, D.; Goga, S.T.; Lebed, A.V. Ionic equilibrium in mixtures of protophobic and protophilic polar non-hydrogen bond donor solvents: Acids, salts, and indicators in acetone containing 5 mol% DMSO. J. Phys. Org. Chem. 2010, 23, 418–430. [Google Scholar] [CrossRef]
  75. Ioffe, I.O.; Shapiro, A.L. Investigations in the field of rhodamine dyes and relative compounds. Zhurnal. Org. Khimii 1972, 8, 1726–1729. (In Russian) [Google Scholar]
  76. Barra, M.; de Rossi, R.H. Erythromicin as a supramolecular receptor. Tetrahedron Lett. 1988, 29, 1119–1122. [Google Scholar] [CrossRef]
  77. Barra, M.; Cosa, J.J.; de Rossi, R.H. Erythromicin A as a supramolecular catalyst: Effect on rhodamine B lactonization. J. Org. Chem. 1990, 55, 5850–5853. [Google Scholar] [CrossRef]
  78. Grigoryeva, T.M.; Ivanov, V.L.; Nizamov, N.; Kuzmin, M.G. Adiabatic photodissociation of the C–O in rhodamine C lactone. Doklady AN SSSR (Proc. Acad. Sci. USSR) 1977, 232, 1108–1111. (In Russian) [Google Scholar]
  79. Pikaev, A.K.; Kartasheva, L.I.; Chulkov, V.N. A new, highly-sensitive dosimetric composition based on a solution of rhodamine B lactone in chloroform. Mendeleev Commun. 1997, 7, 178–180. [Google Scholar] [CrossRef]
  80. Krygowski, T.M.; Wrona, P.K.; Zielkowska, U.; Reichardt, C. Empirical parameters of Lewis acidity and basicity for aqueous binary solvent mixtures. Tetrahedron 1985, 41, 4519–4527. [Google Scholar] [CrossRef]
  81. Kalidas, C.; Hefter, G.; Marcus, Y. Gibbs Energies of Transfer of Cations from Water to Mixed Aqueous Organic Solvents. Chem. Rev. 2000, 100, 819–852. [Google Scholar] [CrossRef] [PubMed]
  82. Chantooni, M.K.; Kolthoff, I.M. Proton solvation in the lower aliphatic alcohols with emphasis on isopropyl and tert-butyl alcohols. J. Phys. Chem. 1978, 82, 994–1000. [Google Scholar] [CrossRef]
  83. Hojo, M.; Ueda, T.; Yamasaki, M.; Inoue, A.; Tokita, S.; Yanagita, M. 1 H and 13 C NMR Detection of the Carbocations or Zwitterions from Rhodamine B Base, a Fluoran-Based Black Color Former, Trityl Benzoate, and Methoxy-Substituted Trityl Chlorides in the Presence of Alkali Metal or Alkaline Earth Metal Perchlorates in Acetonitrile Solution. Bull. Chem. Soc. Jpn. 2002, 75, 1569–1576. [Google Scholar] [CrossRef]
  84. Hojo, M.; Ueda, T.; Inoue, A.; Tokita, S. Interaction of a practical fluoran-based black color former with possible color developers, various acids and magnesium ions, in acetonitrile. J. Mol. Liq. 2009, 148, 109–113. [Google Scholar] [CrossRef]
  85. Shakhverdov, T.A.; Ergashev, R. Photophysics of metal complexes of rhodamine B. Opt. Spectrosc. 1999, 87, 236–242. (In Russian) [Google Scholar]
  86. Nizamov, N.; Shakhverdov, T.A.; Ergashev, R.; Atakhodjaev, A.K. Spectral-fluorescence studies of rhodamine B with metal ions in liquid solutions. Proc. Acad. Sci. Uzb. Repub. 1986, 5, 72–76. (In Russian) [Google Scholar]
  87. Ergashev, R. The Study of Complex Formation of Rhodamine Dyes with Metal Ions by Spectral-Luminescent Methods. In Spectroscopy of Intermolecular Interactions and Molecular Motion; Paper Collection; Alisher Navoi Samarkand State University: Samarkand, Uzbekistan, 1985; pp. 58–64. (In Russian) [Google Scholar]
  88. Ergashev, R. Photophysics of Organic Anions and Their Complexes with Metals. Ph.D. Dissertation, Leningrad State University, Leningrad, Russia, 1989. [Google Scholar]
  89. Refat, M.S.; Killa, H.M.A.; Mansour, A.F.; Ibrahim, M.Y.; Fetooh, H. Cu(II), Co(II), and Mn(II) Complexes of Rhodamine C and Rhodamine 640 Perchlorate: Synthesis, Spectroscopic, Thermal, Fluorescence, and Photostability Studies. J. Chem. Eng. Data 2011, 56, 3493–3503. [Google Scholar] [CrossRef]
  90. Klein, U.K.A.; Hafner, F.W. A new dual fluorescence with rhodamine lactone. Chem. Phys. Lett. 1976, 43, 141–145. [Google Scholar] [CrossRef]
  91. Djumadinov, R.K. Spectroscopic Study of Intermolecular Interactions in Solutions of Rhodamine Dyes. Ph.D. Dissertation, State University, Leningrad, Russia, 1977. [Google Scholar]
  92. Lippert, E. Dipolmoment und Elektronenstruktur von angeregten Molekülen. Z. Nat. A 1955, 10a, 541–545. [Google Scholar] [CrossRef] [Green Version]
  93. Cavallo, L.; Moore, M.K.; Corrie, J.E.H.; Fraternali, F. Quantum Mechanics Calculations on Rhodamine Dyes Require Inclusion of Solvent Water for Accurate Representation of the Structure. J. Phys. Chem. A 2004, 108, 7744–7751. [Google Scholar] [CrossRef]
  94. Karpiuk, J. Photoinduced electron transfer in Malachite Green lactone. Phys. Chem. Chem. Phys. 2003, 5, 1078–1090. [Google Scholar] [CrossRef]
  95. Karpiuk, J. Dual Fluorescence from Two Polar Excited States in One Molecule. Structurally Additive Photophysics of Crystal Violet Lactone. J. Phys. Chem. A 2004, 108, 11183–11195. [Google Scholar] [CrossRef]
  96. Bizjak, T.; Karpiuk, J.; Lochbrunner, S.; Riedle, E. 50-fs Photoinduced Intramolecular Charge Separation in Triphenylmethane Lactones. J. Phys. Chem. A 2004, 108, 10763–10769. [Google Scholar] [CrossRef]
  97. Simmons, H.E.; Fukunaga, T. Spiroconjugation. J. Am. Chem. Soc. 1967, 89, 5208–5215. [Google Scholar] [CrossRef]
  98. Schweig, A.; Weidner, U.; Hellwinkel, D.; Krapp, W. Spiroconjugation. Angew. Chem. Int. Engl. Ed. 1973, 12, 310–311. [Google Scholar] [CrossRef]
  99. Schweig, A.; Weidner, U.; Hill, R.K.; Cullison, D.A. Theory and application of photoelectron spectroscopy. 36. Quantitative account of spiroconjugation. J. Am. Chem. Soc. 1973, 95, 5426–5427. [Google Scholar] [CrossRef]
  100. Dürr, H.; Gleiter, R. Spiroconjugation. Angew. Chem. Int. Engl. Ed. 1978, 17, 559–569. [Google Scholar] [CrossRef]
  101. Maslak, P.; Chopra, A.; Moylan, C.R.; Wortmann, R.; Lebus, S.; Rheingold, A.L.; Yap, G.P.A. Optical Properties of Spiroconjugated Charge-Transfer Dyes. J. Am. Chem. Soc. 1996, 118, 1471–1481. [Google Scholar] [CrossRef]
  102. Wu, C.-C.; Liu, W.-G.; Hung, W.-Y.; Liu, T.-L.; Lin, Y.-T.; Lin, H.-W.; Wong, K.-T.; Chien, Y.-Y.; Chen, R.-T.; Hung, T.-H.; et al. Spiroconjugation-enhanced intermolecular charge transport. Appl. Phys. Lett. 2005, 87, 052103. [Google Scholar] [CrossRef]
  103. Zhu, L.; Zhong, C.; Liu, Z.; Yang, C.; Qin, J. New intramolecular through-space charge transfer emission: Tunable dual fluorescence of terfluorenes. Chem. Commun. 2010, 46, 6666–6668. [Google Scholar] [CrossRef]
  104. Zhu, L.; Zhong, C.; Liu, C.; Liu, Z.; Qin, J.; Yang, C. Spiroconjugated Intramolecular Charge-Transfer Emission in Non-Typical Spiroconjugated Molecules: The Effect of Molecular Structure upon the Excited-State Configuration. Chem. Phys. Chem. 2013, 14, 982–989. [Google Scholar] [CrossRef]
  105. Wössner, J.S.; Grenz, D.C.; Kratzert, D.; Esser, B. Tuning the optical properties of spiro-centered charge-transfer dyes by extending the donor or acceptor part. Org. Chem. Front. 2019, 6, 3649–3656. [Google Scholar] [CrossRef]
  106. Wössner, J.S.; Esser, B. Spiroconjugated Donor−σ–Acceptor Charge-Transfer Dyes: Effect of the π-Subsystems on the Optoelectronic Properties. J. Org. Chem. 2020, 85, 5048–5057. [Google Scholar] [CrossRef] [PubMed]
  107. Sinel’nikov, A.N.; Artyukhov, V.Y. Quantum chemical investigation of spectral-luminescent properties of zwitterion and lactone forms of rhodamine B. Russ. Phys. J. 2012, 54, 1057–1066. [Google Scholar] [CrossRef]
  108. Luzanov, A.V. The Structure of the Electronic Excitation of Molecules in Quantum-chemical Models. Russ. Chem. Rev. 1980, 49, 1033–1048. [Google Scholar] [CrossRef]
  109. Luzanov, A.V.; Zhikol, O.A. Electron invariants and excited state structural analysis for electronic transitions within CIS, RPA, and TDDFT models. Int. J. Quantum Chem. 2010, 110, 902–924. [Google Scholar] [CrossRef]
  110. Luzanov, A.V.; Zhikol, O.A. Excited State Structural Analysis: TDDFT and Related Models. In Practical Aspects of Computational Chemistry I; Leszczynski, J., Shukla, M.K., Eds.; Springer: Dordrecht, The Netherlands, 2011. [Google Scholar]
  111. Espinosa, E.; Molins, E.; Lecomte, C. Hydrogen bond strengths revealed by topological analyses of experimentally observed electron densities. Chem. Phys. Lett. 1998, 285, 170–173. [Google Scholar] [CrossRef]
  112. Bader, R.F.W. Atoms in molecules. Acc. Chem. Res. 1985, 18, 15–18. [Google Scholar] [CrossRef]
  113. Bader, R.F.W. A quantum theory of molecular structure and its applications. Chem. Rev. 1991, 91, 893–928. [Google Scholar] [CrossRef]
  114. Bader, R.F.W. A Bond Path: A Universal Indicator of Bonded Interactions. J. Phys. Chem. A 1998, 102, 7314–7323. [Google Scholar] [CrossRef]
  115. Grabowski, Z.R.; Rotkiewicz, K.; Rettig, W. Structural Changes Accompanying Intramolecular Electron Transfer: Focus on Twisted Intramolecular Charge-Transfer States and Structures. Chem. Rev. 2003, 103, 3899–4032. [Google Scholar] [CrossRef]
  116. Lippert, E.; Rettig, W.; Bonacic-Koutecky, V.; Heisel, F.; Miehe, J.A. Photophysics of internal twisting. In Advances in Chemical Physics; Prigogine, I., Rice, S.A., Eds.; John Wiley & Sons, Inc.: Hoboken, NJ, USA, 1987; pp. 1–174. [Google Scholar]
  117. Vollmer, F.; Rettig, W.; Birckner, E. Photochemical Mechanisms Producing Large Fluorescence Stokes Shifts. J. Fluoresc. 1994, 4, 65–69. [Google Scholar] [CrossRef]
  118. Rettig, W.; Klock, A. Intramolecular fluorescence quenching in aminocoumarines. Identification of an excited state with full charge separation. Can. J. Chem. 1985, 63, 1649–1653. [Google Scholar] [CrossRef] [Green Version]
  119. Krishnamurthy, M.; Phaniraj, P.; Dogra, S.K. Absorptiometric and fluorimetric study of solvent dependence and prototropism of benzimidazole homologues. J. Chem. Soc. Perkin Trans. 2 1986, 1917–1925. [Google Scholar] [CrossRef]
  120. Fujiki, K.; Iwanaga, C.; Koizumi, M. Some Spectral Studies of the Aqueous Solution of Pyronine G. Bull. Chem. Soc. Jpn. 1962, 35, 185–195. [Google Scholar] [CrossRef] [Green Version]
  121. Golovina, A.P.; Mitzel, Y.A.; Levshin, L.V.; Bobrovskaya, E.A. Vestnik MGU, Fizyka. Astonomiya (Bull. Mosc. State Univ. Phys. Astron.) 1969, 4, 36–41. (In Russian) [Google Scholar]
  122. Frisch, M.J.; Trucks, G.W.; Schlegel, H.B.; Scuseria, G.E.; Robb, M.A.; Cheeseman, J.R.; Scalmani, G.; Barone, V.; Mennucci, B.; Petersson, G.A.; et al. Fox, Gaussian 09, Revision B.01; Gaussian, Inc.: Wallingford, CT, USA, 2010. [Google Scholar]
  123. Becke, A.D. Density-functional thermochemistry. III. The role of exact exchange. J. Chem. Phys. 1993, 98, 5648–5652. [Google Scholar] [CrossRef] [Green Version]
  124. Woon, D.E.; Dunning, T.H. Gaussian basis sets for use in correlated molecular calculations. III. The atoms aluminum through argon. J. Chem. Phys. 1993, 98, 1358–1371. [Google Scholar] [CrossRef] [Green Version]
  125. Tomasi, J.; Mennucci, B.; Cammi, R. Quantum Mechanical Continuum Solvation Models. Chem. Rev. 2005, 105, 2999–3094. [Google Scholar] [CrossRef]
  126. Wolinski, K.; Hinton, J.F.; Pulay, P. Efficient implementation of the gauge-independent atomic orbital method for NMR chemical shift calculations. J. Am. Chem. Soc. 1990, 112, 8251–8260. [Google Scholar] [CrossRef]
  127. Bylaska, E.J.; de Jong, W.A.; Govind, N.; Kowalski, K.; Straatsma, T.P.; Valiev, M.; Wang, D.; Apra, E.; Windus, T.L.; Hammond, J.; et al. A Computational Chemistry Package for Parallel Computers; Version 5.1; Pacific Northwest National Laboratory: Richland, WA, USA, 2007.
Chart 1. Rhodamine B (1) cation HR+ and the tautomers of the neutral R form: R± and R0.
Colorants 01 00006 ch001
Chart 2. Molecular structures of rhodamine dyes studied in the present work. Dye 7 is also named as rhodamine 101. 1 (X1 = Et; X2 = 6-NEt2; Y = CH), 2 (X1 = Et; X2 = 6-NMe2; Y = CH), 3 (X1 = Me; X2 = 6-NMe2; Y = CH), 4 (X1 = Et; X2 = 6-NH2; Y = CH), 9 (X1 = Et; X2 = 7.8-benzo; Y = CH), 10 (X1 = Et; X2 = 7-NH2; Y = CH), 11 (X1 = Et; X2 = 6-Cl; Y = CH), 12 (X1 = Et; X2 = 6-NMe2, 8-OH; Y = CH), 13 (X1 = Me; X2 = 6-NMe2; Y = N), 14 (X1 = Et; X2 = 6-NEt2; Y = N), 5 (X = Et; Y = CH), 6 (X = Me; Y = CH), 7 (Y = CH), 8 (X = Et). 15 (Y = N).
Colorants 01 00006 ch002
Chart 3. Acidic dissociation and tautomerism of rhodamine 5 {HR+ ⇄ (R± ⇄ R0) + H+}.
Colorants 01 00006 ch003
Figure 1. Absorption spectra of HR+ and R species of substance 5 in n-butanol (a), 2-methyl-propane-2-ol (tert-butanol) (b), acetonitrile (c), and DMSO (d). Dye concentrations were around 1 × 10⁻⁵ M except the spectra of the form R in acetonitrile and DMSO, where the concentration was 7 × 10⁻⁵ M.
Colorants 01 00006 g001
Figure 2. Infrared spectra of compound 5 (0.03 M) in DMSO in cationic form HR+ and neutral form, mainly as lactonic tautomer R0.
Colorants 01 00006 g002
Chart 4. Atom numbering in compound 5 (shown as cation).
Colorants 01 00006 ch004
Figure 3. Correlations between the experimental 13C NMR spectra of lactone (inclusion of both aromatic and aliphatic atoms were needed for identification of C-9) and zwitterion (only aromatic atoms are included) tautomers of compound 5 and corresponding calculated magnetic shielding.
Colorants 01 00006 g003
Figure 4. Absorption of the cationic and neutral forms of rhodamine dyes in 90 mass% aqueous acetone. The HR+ and R spectra are obtained in 0.01 M HCl and 0.001 M NaOH, respectively. Dye concentrations are around 10−5 M.
Colorants 01 00006 g004aColorants 01 00006 g004b
Figure 5. Dependence of the sum of absorbances of dye 5 at 550, 555, 560, and 565 nm on pH in aqueous solutions (1) and p a H + in 90 mass % aqueous acetone (2).
Colorants 01 00006 g005
Figure 6. Dependence of the logarithm of tautomerization constant of dye 5 in different solvents on the ( p K a , HBenz s p K a , HBenz w log γ H + ) values.
Colorants 01 00006 g006
Chart 5. Zwitterions as two kinds of intramolecular ionic pairs; left-hand side: solvent-separated (solvent-shared, externally solvated, long); right-hand side: contact (intimate, short).
Colorants 01 00006 ch005
Figure 7. Absorption spectrum of the neutral form, R, of rhodamine 5 (1.0 × 10⁻⁵ M) in acetonitrile with 0.2 M Mg(ClO4)2·3H2O (1) and without this salt (2).
Colorants 01 00006 g007
Figure 8. Rhodamine 5 (1.0 × 10⁻⁵ M) in CH3CN; (a): 0.001 and 0.003 M DBU (1, 2); 5 × 10⁻⁴ and 0.001 M p-toluenesulfonic acid (3, 4); 2 × 10⁻³, 5 × 10⁻³, 0.01, 0.02, and 0.04 M LiClO4 (5, 6, 7, 8, and 9); (b): 2 × 10⁻³, 5 × 10⁻³, and 0.01 M Ca(ClO4)2 (5, 6, and 7).
Colorants 01 00006 g008
Chart 6. Associate of the zwitterionic tautomer R± with Li+.
Colorants 01 00006 ch006
Figure 9. Rhodamine 5 (1.0 × 10⁻⁵ M) in CH3CN at varying of LiClO4 concentrations.
Colorants 01 00006 g009
Figure 10. Emission spectra of compound 5 in acetone: neutral (lactonic, colorless) form, λ excit = 330 nm, and cationic form, λ excit = 565 nm. The conversion of the dye in the cationic form is reached by addition of sulfuric acid traces.
Colorants 01 00006 g010
Figure 11. The ground (left) and the excited state (right) optimized molecular geometry of rhodamine B 1 lactone in vacuo.
Colorants 01 00006 g011
Figure 12. Molecular structure of rhodamine B lactone, optimized in its excited S1 state, which wave function was analyzed with application of the elements of AIM theory [112,113,114]. Unconventional H-bond with its bond path and critical point of (3,-1) type is marked by a circle.
Colorants 01 00006 g012
Chart 7. Lactones of rhodamines 110 (16), 19 (17), and succinyl rhodamine (18).
Colorants 01 00006 ch007
Figure 13. The ground (left) and the excited state (right) optimized molecular geometry of rhodamine B 18 lactone in vacuo.
Colorants 01 00006 g013
Chart 8. Carbinols of pyronine G (19) and rhodamine 6G (20).
Colorants 01 00006 ch008
Chart 9. Alternative explanation of the blue fluorescence of rhodamine lactones.
Colorants 01 00006 ch009
Table 1. Signals assignment in carbon-13 NMR spectra of compound 5 lactone and zwitterion tautomeric forms.
AtomLactone R0Zwitterion R±
1128.41132.62
2105.50114.16
3144.43155.95
496.9596.58
5105.59106.23
6134.97153.19
7117.41125.35
8124.63128.46
979.16173.33
10106.32114.36
11147.75154.17
12149.23158.74
13108.37115.17
14168.78161.69
1′152.76133.82
2′127.25141.42
3′124.26130.93
4′129.70130.63
5′124.63130.43
6′124.26130.54
Table 2. Assignment of signals in carbon-13 NMR spectra of Rhodamine B.
AtomsCation HR+ of 1Esters of 1R± of 1R0 of 1
From Ref. [60]From Ref. [64]From Ref. [60]From Ref. [60]
CD3ODDMSO(d6)CDCl3CD3OD + NaOHDMSO(d6) + NaOH
1, 8131.7131.9131.1–131.3132.4
2, 7114.7115.2114.2–114.9114.1109.2
3, 6158.6157.4154.9–155.8158.6150.2
4, 597.097.096.3–95.496.397.9
11, 12156.4155.8156.1153.7
10, 13114.2113.5114.2106.1
9160.3158.7–158.9162.5
14167.2167.4164.9–165.5172.8169.9
1′134.2133.2–133.5133.1
2′133.2135.4129.7–130.3141.0
Table 3. Spectral data and KT values of compounds 115 in 90 mass% aqueous acetone, 20 °C.
No.Compound λ max /nm Δ λ max ( Δ ν max / cm 1 ) KT = [R0]/[R±]
HR+R±
1 Colorants 01 00006 i00155054010 (337)16.6 [58]
2 Colorants 01 00006 i00255254012 (402)16.9
3 Colorants 01 00006 i00355153813 (438)29.8
4 Colorants 01 00006 i00453151516 (585)2.19
5 Colorants 01 00006 i00556555510 (319)1.05
6 Colorants 01 00006 i00657756611 (337)0.32
7 Colorants 01 00006 i00757856612 (367)0.38
8 Colorants 01 00006 i008575a
9 Colorants 01 00006 i009522a
10 Colorants 01 00006 i010576a
11 Colorants 01 00006 i011494, 525a
12 Colorants 01 00006 i01254247072 (2826)4.04
13 Colorants 01 00006 i01355854612 (394)4.10
14 Colorants 01 00006 i01456255012 (483)1.65
15 Colorants 01 00006 i01558357310 (299)0.12
a Absorption of the neutral form R in the visible region is too low to be accurately measured. Accordingly, in these cases the fraction of R± is undetectable.
Table 5. Selected values of the tautomerization constant of rhodamine B (1).
SolventKT = [R0]/[R±]
Water 0.005–0.01 a,b
Methanol 0.1 c
Ethanol 0.28 d
90 mass% aqueous acetone 16.6
91.3 mass% aqueous DMSO59 e
CHCl3 saturated with water 90 f
N,N-Dimethylformamide100 g
98.3 mass% aqueous acetone234 h
Acetone 250 a
a Extrapolated value. b In ref. [42]: 0.23. c In ref. [42]: 0.12. d In ref. [42]: 0.42. e Refs. [59,60]. f Refs. [61,66,69]. g Ref. [61]. h Refs. [66,69].
Table 6. Absorption maxima of cationic (HR+) and zwitterionic (R±) species of dye 5 in different organic solvents and the values of the tautomerization constant, KT = [R0]/[R±] (see Chart 3).
Solvent a λ max /nm Δ λ max KT E T N
HR+R b
Methanol (32) 56455680.0280.762
Benzene—ethanol—water c (12.8) 567556110.1550.587
1-Propanol (20.4) 566556100.160.617
1-Butanol (17.4) 564553110.190.586
2-Methyl-propane-1-ol (17.9)566554120.230.552
2-Propanol (19.9) 564550140.320.546
2-Methyl-propane-2-ol (12.5) d563546172.940.389
90% Acetone—10% water e (24) 565555101.060.57
95% Acetone—5% water e (22) 56856085.760.49
90% CH3CN—10% water e (39.4) 56755890.170.692
CH3CN (35.9) 566550948.30.460
91.3% DMSO e (56)574560142.890.50
DMSO (46.4) 5775661170.70.444
N,N-Dimethylformamide (36.7)570555589.90.404
a In parenthesis: relative permittivity, ε r b Absorption of the R± tautomer. c Mass ratio of components: 47:47:6. d 30 °C. e Mass ratio.
Table 7. Absorption maxima of rhodamine 5 in selected organic solvents.
SolventCation HR+
(0.01 M H2SO4)
Neutral Form (R± ⇄ R0)
(0.02 M DBU)
λmax, nmEmax × 10−3, M−1 cm−1λmax, nmEmax × 10−3, M−1 cm−1
Methanol 56498.055695.3
Acetonitrile 56698.65502.00
DMF570110.05551.21
DMSO57593.25561.30
Table 8. The log K T values of rhodamine 5 and in different solvents and parameters of acid–base equilibrium, p K a , HBenz s , p K a , HBenz w , and log γ H + in these media.
Solvent p K a , HBenz s log γ H + p K a , HBenz s p K a , HBenz w log γ H + log K T
Methanol9.40+1.523.68−1.55
90% acetonitrile
(x2 = 0.798)
9.1+1.213.70−0.77
2-Propanol 11.75+1.426.13−0.49
91% DMSO
(x2 = 0.708)
8.05−3.617.46+0.48
Acetonitrile 20.7+7.858.65+1.68
DMF12.3–2.529.78+1.95
DMSO11.1–3.4010.3+1.85
Table 9. Calculated (b3lyp/cc-PVDZ) long-wavelength electronic transitions in the absorption spectra of rhodamine B lactone in its Franck-Condon and excited state structurally relaxed molecular geometry. The latter corresponds to the fluorescence spectrum of title compound.
TransitionWavelength, Wavenumber, Oscillator StrengthElectronic Localization IndicesCharge Transfer Indices
Colorants 01 00006 i016 Colorants 01 00006 i017 Colorants 01 00006 i018
Absorption (S0-state optimized geometry, DFT)
S0-S1352 nm
28,400 cm−1
0.005
24.724.750.6 Colorants 01 00006 i019
S0-S2342 nm
29,200 cm−1
0.0004
22.222.254.1 Colorants 01 00006 i020
Fluorescence (S1-state optimized geometry, TDDFT)
S0-S1496 nm
20,150 cm−1
0.005
4.244.151.2 Colorants 01 00006 i021
Table 10. Fluorescence of rhodamine lactones in benzene.
Compound λ max a b , nm (from Absorption Spectrum) λ max e m , nmStokes Shift, cm−1
23134509700
331045410,300
43013897500
531247811,150
631848610,900
731949111,050
93254568850
1031546210,100
123514857900
143415119750
15310435 a9300
585 b15,200
a Low intensive fluorescence of the lactone form. b Intensive fluorescence of the zwitterions. Dye 15 is less inclined to lactone formation (see Table 1) and exhibits a dual fluorescence even in benzene.
Publisher’s Note: MDPI stays neutral with regard to jurisdictional claims in published maps and institutional affiliations.

