Article

DNA and BSA Interaction Studies and Antileukemic Evaluation of Polyaromatic Thiosemicarbazones and Their Copper Complexes

by
Giorgio Pelosi
1,2,3,
Silvana Pinelli
4 and
Franco Bisceglie
1,2,3,*
1
Department of Chemistry, Life Sciences and Environmental Sustainability, University of Parma, 43124 Parma, Italy
2
C.E.R.T. Centro di Eccellenza per la Ricerca Tossicologica, University of Parma, 43124 Parma, Italy
3
C.O.M.T. Centre for Molecular and Translational Oncology, University of Parma, 43124 Parma, Italy
4
Department of Medicine and Surgery, University of Parma, 43126 Parma, Italy
*
Author to whom correspondence should be addressed.
Submission received: 11 April 2022 / Revised: 13 May 2022 / Accepted: 17 May 2022 / Published: 23 May 2022
(This article belongs to the Special Issue Feature Papers in Compounds)

Abstract

:
Some ten million cancer deaths occurred in 2020, highlighting the fact that the search for new anticancer drugs remains extremely topical. In the search for new coordination compounds with relevant biological properties, the choice of a metal ion is important for the design of the complex. In this regard, copper plays a peculiar role, thanks to its distinct properties. Thiosemicarbazones are, analogously, a unique class of ligands because they are easily modifiable, and therefore, extremely versatile in terms of modulating molecular properties. In this work, we synthesized and characterized, by means of X-ray diffraction, four new naphthaldehyde and anthraldehyde thiosemicarbazone derivatives and their copper complexes to be used in interaction studies with biological systems. The objective was to evaluate the antileukemic activity of these compounds. Reactions of these ligands with Cu(II) salts produced unexpected oxidation products and the isolation of Cu(I) metal complexes. One ligand and its related Cu(I) complex, which is stable in physiological conditions, were subjected to in vitro biological tests (UV-Vis and CD titration). An important interaction with DNA and an affinity toward BSA were observed in FT-IR experiments. Preliminary in vitro biological tests against a histiocytic lymphoma cell line revealed an interestingly low IC50 value, i.e., 5.46 µM, for the Cu(I) complex.

1. Introduction

It was recently reported that worldwide, an estimated 19.3 million new cancer cases and almost 10.0 million cancer deaths occurred in 2020 [1]. It is therefore apparent that the search for new anticancer drugs is still extremely topical. The discovery of cis-{[PtCl2(NH3)2]}, cisplatin, a platinum-based drug, was a major breakthrough in cancer treatment strategies [2]. However, the toxicity and drug resistance associated with this compound steered drug discovery research toward the rational development of metal-containing agents with more specific activity and less toxicity, and a mode of action different from cis-{[PtCl2(NH3)2]} and its derivatives. Metallodrugs have been used for centuries, but only now are methods and techniques becoming available to characterize such drugs more precisely, to identify their target sites, and to elucidate their often unique mechanisms of action [3]. It is also noteworthy that a better understanding of the roles played by metal compounds at a mechanistic level will help in the implementation of new metal-based therapies by providing an alternative, targeted, and rational approach to supplement non-targeted screening of novel chemical entities for biological activity [4]. In the search for new coordination compounds with promising biological properties, the choice of the metal ion is crucial [3,4]. Amongst metal ions, copper plays an important role thanks to its distinct properties [5,6]. Copper is a bioessential element in biology with truly unique chemical characteristics in its two biologically relevant oxidation states, i.e., +1 and +2. Its most notable features are its almost exclusive function in the metabolism of O2 or N/O compounds (NO2, N2O) and its frequent association with the oxidation/generation of organic and inorganic radicals such as tyrosyl, semiquinones, superoxide, or nitrosyl [7]. Many ligands can be chosen to bind copper and create valuable coordination complexes. Thiosemicarbazones are particularly interesting ligands because they present at least a couple of N, S donor atoms that can modulate the hard and soft character. Moreover, they can be suitably modified to increase the denticity of the ligand or the number of donor atoms, or to adjust parameters such as solubility and the partition coefficient [8,9,10,11], thereby modulating the biological activity of the compound in question. Thiosemicarbazones are a class of compounds which are known to exert different biological properties, e.g., catalysis [12] antibacterial [13,14], antifungal [15,16,17,18,19,20,21], antiparasitic [22], antiviral [23,24] and anticancer [25,26,27,28,29,30,31,32]. The antitumor activity provided by thiosemicarbazones is usually enhanced upon complexation. Many mechanisms of action have been proposed, including ribonucleotide reductase and topoisomerase II inhibitors, ROS generators (which, it is assumed, interact with DNA) and others which are attributed, for example, to their strong iron chelating ability [8,29]. With these hypotheses, we decided to synthesize new thiosemicarbazones and their copper complexes and perform interaction studies with in vitro biological systems in order to preliminarily evaluate their antitumor activity. As mentioned, DNA is a major target for both anticancer therapy and metal based drugs, and it is also known that polycyclic aromatic hydrocarbons tend to intercalate into DNA nitrogenous bases stackings [33]. Based on these hypotheses, analogues of naphthaldehyde and anthraldehyde thiosemicarbazone derivatives were synthesized and characterized, because naphthaldehyde [34,35,36,37,38,39,40,41] and anthraldehyde [37,42,43,44,45,46,47,48] have already shown interesting and promising chemical and biological properties. Structural modifications on the thiosemicarbazide terminal nitrogen, which seems to play a relevant role in its biological activity, have been investigated. Unexpectedly, reaction of the ligands with Cu(II) salts produced ligand oxidation products and the isolation of Cu(I) metal complexes. The nature of these compounds, formed upon reduction of copper, was assessed by means of X-ray crystallography. The ligand and its Cu(I) complex were subjected to biological tests (UV-Vis and CD titration) and showed important interaction with DNA which was not ascribable to intercalation. The same compounds also showed affinity toward BSA, as established by FT-IR experiments. Preliminary in vitro biological tests against a histiocytic lymphoma cell line resulted in a very low IC50 value, i.e., 5.46 µM, for the Cu(I) complex, highlighting the interesting behavior of this compound.

2. Materials and Methods

1H NMR were recorded on a Bruker Anova spectrometer at 300 MHz, with chemical shift reported in δ units (ppm). NMR spectra were referenced relative to residual NMR solvent peaks. Coupling constants (J) are reported in hertz (Hz). The solvent used in the acquisitions of spectra was DMSO-d6.
The FT-IR measurements were recorded on Perkin Elmer’s Spectrum Two in the 4000–400 cm−1 range, equipped with the ATR accessory. The shapes and signal intensities are reported as w (weak), m (medium), s (strong), sh (sharp), b (broad).
Elemental analyses were performed using Flashsmart CHNS Elemental Analyzer (Thermofisher Scientific, Waltham, MA, USA).
Mass analyses were carried out using a Waters Acquity Ultraperformance ESI-MS spectrometer with Single Quadrupole Detector (Mode used: Flow Injection; Source temperature (°C) 150; Desolvation Temperature (°C) 300; Cone Gas Flow (L/Hr) 100; Desolvation Gas Flow (L/Hr) 480; Solvent Flow (mL/min) 0.2; Capillary voltage (kV) 3, Cone voltage (V) 20/50/80). The compounds were dissolved in MeOH.
Melting points were determined using a SPM3 apparatus (Stuart Scientific, Nicosia, Cyprus).
Circular dichroism spectra were recorded with a Jasco J-715 spectropolarimeter.
UV-Vis spectra were collected using Thermofisher Scientific’s Evolution 260 Bio Spectrophotometer in a quartz cuvette.
The crystallographic data of compounds L1, L2, L3, L5 and [CuI2(SO4)(L2)5] (2) were collected with a SMART APEX2 diffractometer using Mo-Kα radiation and a graphite crystal monochromator [λ(Mo-Kα) 0.71073 Å]. Intensities data for compounds L4 and [CuI(L1)2](HSO4) (1) were collected on a Siemens AED diffractometer using Cu-Kα radiation [λ(Cu-Kα) 1.54178 Å]. For the data collected on the SMART APEX2 diffractometer, the SAINT [49] software was used for integrating reflection intensities and scaling, and SADABS [50] for absorption correction. The structures were solved by direct methods using SHELXS [51]] and refined by full-matrix least-squares on all F2 using SHELXL97 [52] implemented in the OLEX package [53]. The structure drawings were obtained with the ORTEPIII [54] and Mercury [55] programs.

2.1. Synthetic Procedures

2.1.1. General Information

The following compounds were used: 4-methyl-3-thiosemicarbazide, 97% (Aldrich, St. Louis, MO, USA), 4,4-dimethyl-3-thiosemicarbazide, 98% (TCI Europe N.V., Zwijndrecht, Belgium), 2-naphthaldehyde (Aldrich), 10-chloro-9-anthraldehyde, 97% (Aldrich), Cu(SO4)2∙5H2O (Aldrich), disodium salt of calf thymus DNA (CT DNA) (Serva), bovine serum albumin (BSA) (Aldrich).

2.1.2. Synthesis of the Ligands

L1, 2-naphthaldehyde 4,4-dimethyl-3-thiosemicarbazone was synthesized as follows.
First, 2-naphthaldehyde (0.0826 g, 0.529 mmol) was placed in a round bottomed flask with 25 mL of absolute ethanol. Subsequently, a slightly larger amount of 4,4-dimethyl-3-thiosemicarbazide (0.0815 g, 0.684 mmol) was added to the reaction flask. A representation of the synthesis is presented in Scheme 1. The mixture was gently heated until dissolution of both reagents, and then the flask was placed in an ice bath to limit the formation of by-products for one day under magnetic stirring. The solution took on a more intense yellow color over time, until a yellow suspension formed which was filtered on Buchner and then analyzed. The analyses highlighted the purity of the product, which was then recrystallized from acetonitrile, yielding straw yellow, needle-like crystals which were subjected to X-ray diffractometric analysis (Figure 1). Crystal data details are reported in the Supplementary Materials.
Yield: 52%.
1H NMR (300 MHz, ppm, DMSO d6): 11.05 (s, 1H, N–NH–C=S), 8.36 (s, 1H, CH=N), 7.97 (m, 5H, aromatic), 7.55 (q, 2H, aromatic), 3.33 (s, 6H, N–(CH3)2).
FT–IR: 3139 cm−1, m, sh, ν N–H; 3008 cm−1, w, broad, ν sp2 C–H; 2980 cm−1, w, broad, ν CH3; 1550 cm−1, s, ν C=C; 1520 cm−1, s, ν C=N; 1282 cm−1, s, ν C–N; 1121 cm−1, m, ν C=S.
L2, 2-naphthaldehyde 4-methyl-3-thiosemicarbazone was synthesized as follows.
First, 2-naphthaldehyde (0.0947 g, 0.606 mmol) was placed in a round bottomed flask with 25 mL of ethanol and a slight excess amount of 4-methyl-3-thiosemicarbazide (0.0769 g, 0.727 mmol) was added. A representation of the synthesis is reported in Scheme 1. The mixture was then gently heated to dissolve both reagents, and then the reaction flask was placed in an ice bath under magnetic stirring for three days, monitoring the reaction by means of TLC. The product was then extracted from the solution by evaporation of the solvent under vacuum and analyzed. Due to the presence of reagent impurities, the product was then subjected to a purification silica column (ethyl acetate/cyclohexane 1/5 as mobile phase). The central fraction was then dried and recrystallized from acetonitrile, yielding white crystals in the shape of rice grains, which were suitable for diffractometric analysis (Figure 2). Crystal data details are reported in the Supplementary Materials.
Yield: 61%.
1H NMR (300 MHz, ppm, DMSO d6): 11.58 (s, 1H, N–NH–C=S); 8.60 (d, J = 4.75 Hz, 1H, S=C–NH–CH3); 8.19 (m, 2H, aromatic); 8.10 (s, 1H, CH=N); 7.95 (m, 3H, aromatic); 7.55 (q, 2H, aromatic); 3.05 (d, J = 4.57 Hz, 3H, NH–CH3).
FT–IR: 3294 cm−1, w, ν N–H; 3167 cm−1, w, b, ν sp2 C–H; 2980 cm−1, w, b, ν CH3; 1550 cm−1, s, ν C=C; 1517 cm−1, s, ν C=N; 1282 cm−1, s, ν C–N; 1093 cm−1, m, ν C=S.
L3, 10-chloro-9-anthraldehyde 4,4-dimethyl-3-thiosemicarbazone was synthesized as follows.
First, 10-chloro-9-anthraldehyde (0.105 g, 0.436 mmol) was mixed with an equimolar amount of 4,4-dimethyl-3-thiosemicarbazide, in 25 mL isopropanol in a round bottomed flask. A representation of the synthesis is presented in Scheme 2. A few drops of glacial acetic acid were added and the suspension was left with magnetic stirring at a reflux temperature for 2 h. Next, the mixture was allowed to reach room temperature and left under stirring for three days during which the formation of a precipitate was observed. The solid product, in the form of a red powder, was then filtered by gravity and finally extracted three times using acetone (3 × 25 mL). From an acetone saturated solution, red-orange crystals were obtained which were suitable for X-ray diffraction (Figure 3). Crystal data details are reported in the Supplementary Materials.
Yield: 74%.
1H NMR (300 MHz, ppm, DMSO d6): 11.245 (s, 1H, N–NH–C=S), 9.47 (s, 1H, CH=N), 8.92–8.50 (m, 4H, aromatic), 7.82–7.69 (m, 4H, aromatic), 3.38 (s, 6H, N(CH3)2).
FT–IR: 3156 cm−1, w, b, ν N–H; 2947 cm−1, w, b, ν CH3; 1545 cm−1, s, broad ν C=C/ν C=N; 1258 cm−1, m, ν C–N; 1061 cm−1, m, ν C=S; 750 cm−1, s, sh, ν C–Cl.
L4, 10-chloro-9-anthraldehyde 4-methyl-3-thiosemicarbazone was synthesized as follows.
First, 10-chloro-9-anthraldehyde (0.2676 g, 1.11 mmol) together with 4-methyl-3-thiosemicarbazide (0.1609 g, 1.53 mmol) were placed in a 25 mL round bottomed flask. A representation of the synthesis is presented in Scheme 2. Then, 10 mL of ethyl acetate was added, a solvent in which 10-chloro-9-anthraldehyde is very soluble, while 4-methyl-3-thiosemicarbazide is relatively insoluble. The suspension was left for three days at room temperature under vigorous stirring until the formation of a pale green precipitate was observed, which was then filtered using a Buchner. To obtain crystals suitable for an XRD analysis, a small quantity of product was dissolved in a CCl4-CHCl3-CH2Cl2 mixture (1-1-1 v/v) in a test tube. Pale green square microcrystals were obtained; these were used as crystallization germs for supersaturated solutions until a crystal of suitable size was obtained (Figure 4). Crystal data details are reported in the Supplementary Materials.
Yield: 76%.
1H NMR (300 MHz, DMSO d6): ppm 11.78 (s, 1H, N–NH–C=S), 9.21 (s, 1H, CH=N), 8.55–8.49 (m, 4H, aromatic), 8.40 (q, J = 4.50 Hz, 1H, NH–CH3), 7.82–7.70 (m, 4H, aromatic), 3.00 (d, J = 4.50 Hz, 3H, NH–CH3).
FT–IR: 3342/3169 cm−1, m, sh, ν N–H; 2960 cm−1, w, broad, ν CH3; 1550 cm−1, s, ν C=C; 1517 cm−1, s, ν C=N; 1238 cm−1, s, ν C–N; 1079 cm−1, m, ν C=S, 745 cm−1, s, sh, ν C–Cl.

2.1.3. Synthesis of the Complexes

[CuI(L1)2](HSO4) (1)
Ligand L1 (0.0318 g 0.124 mmol) was placed in a round bottomed flask together with CuSO4·5H2O (0.0164 g, 0.0657 mmol) in order to obtain a 2:1 = ligand:metal stoichiometry. Then, 12 mL of 1/1 acetonitrile/methanol mixture was added. After the addition of the solvent, the solution immediately turned light brown and traces of a brown precipitate remained on the bottom. The solution was then filtered on Buchner and the mother liquors were left to evaporate slowly. Red crystals in the shape of prisms mixed with a powdery brown solid were obtained. The crystals were subjected to XRD analysis, which characterized them as a copper (I) complex, having a 2:1 = ligand:metal stoichiometry (Figure 5). Crystal data details are reported in the Supplementary Materials.
The brown powder was then dissolved in CHCl3 and the product was allowed to crystallize, giving rise to crystals which were suitable for X-ray diffraction. This compound was identified as L5 (Figure 6). Crystal data details are reported in the Supplementary Materials.
Yield: 49%.
FT-IR: 3142 cm−1, m, sh, ν N–H; 3005 cm−1, w, broad, ν sp2 C–H; 2984 cm−1, w, broad, ν CH3; 1551 cm−1, s, ν C=C; 1505 cm−1, m, ν C=N; 1274 cm−1, m, ν C–N; 1084 cm−1, m, ν C=S.
Melting point: 250 °C
[CuI2(SO4)(L2)5] (2)
L2 (0.0522 g, 0.215 mmol) dissolved in 10 mL of acetonitrile and CuSO4∙5H2O (0.0287 g, 0.115 mmol), dissolved in 10 mL of methanol, were combined in a 25 mL flask. The two solutions, respectively initially colorless and light blue, once joined gave rise to a clear light green colored solution. The resulting mixture was left under magnetic stirring at room temperature for 30 min and then placed in a crystallizer to evaporate. The slow evaporation of the solvent took place over about 10 days, leaving a heterogeneous mixture, in which light yellow crystals and brown/green powdery agglomerates (L6) were present. The crystals were identified as [CuI2(SO4)(L2)5] (Figure 7).
FT–IR: 3290 cm−1, w, ν N-H; 3165 cm−1, w, b, ν sp2 C–H; 2983 cm−1, w, b, ν CH3; 1550 cm−1, s, ν C=C; 1500 cm−1, s, ν C=N; 1278 cm−1, s, ν C-N; 1081 cm−1, m, ν C=S.
Melting point: 188 °C.
L5
FT–IR: 3008 cm−1, w, broad, ν sp2 C–H; 2985 cm−1, w, broad, ν CH3; 1552 cm−1, s, ν C=C; 1520 cm−1, s, ν C=N; 1275 cm−1, s, ν C–N; 1125 cm−1.

2.2. Measurements

L1
Melting point: 172 °C.
Elemental analysis. Calculated C(65.34%) H(5.87%) N(16.33%) S(12.46%). Found: C(65.85%) H(5.54%) N(16.75%) S(12.33%).
ESI-MS: 258.15 (MH+).
Soluble in: acetonitrile, toluene, DMSO, partially in ethanol and methanol.
L2
Melting point: 221 °C.
Elemental analysis. Calculated: C(64.17%) H(5.39%) N(17.27%) S(13.18%). Found C(64.38) H(5.20), N(17.25), S(13.44).
ESI-MS: 244.18 (MH+).
Soluble in: acetonitrile, DMSO, partly in ethanol and methanol.
L3
Melting point: 204 °C.
Elemental analysis. Calculated: C(63.24%), H(4.72%), N(12.29%), S(9.38%). Found: C(63.55%), H(4.64%), N(12.40%), S(9.15%).
ESI-MS: 342.78 (MH+).
Soluble in: THF, 1,4-dioxane, DMSO, partially in acetone and chloroform.
L4
Melting point: 238 °C. (A decomposition into a glassy dark red substance occurs around 220 °C which then melts normally at the indicated temperature).
Elemental analysis. Calculated: C(62.28%), H(4.30%), N(12.82%), S(9.78%). Found C(62.43%), H(4.28%), N(12.58%), S(9.66%).
ESI-MS: 328.48 (MH+).
Soluble in: THF, 1,4-dioxane, partially in acetone/methanol (1/1 v/v), chloroform, very weakly in pure alcohols.
L5
Melting point: 180 °C
Elemental analysis. Calculated C(65.85%) H(5.13%) N(16.46%) S(12.56%). Found: C(65.63%) H(5.24%) N(16.37%) S(12.34%).
ESI-MS: 256.40 (MH+).
[CuI(L1)2](HSO4) (1)
Elemental analysis. Calculated C(49.80%) H(4.63%) N(12.44%) S(14.24%). Found: C(50.08%) H(4.95%) N(12.35%) S(14.48%).
ESI-MS: 578.10 (M+-HSO4).
Circular dichroism (CD) spectra were recorded at 25 °C with buffer compensation. Each spectrum is the average of three independent measurements. Cuvettes with a 1-cm path-length quartz were used. CT-DNA was used as received and stored at 4 °C. Solutions of DNA in 10 mM of PBS (pH = 7.4) 137 mM NaCl, 2.7 mM KCl gave a ratio of UV absorbance at 260 and 280 nm, A260/A280, of 1.9, indicating that the DNA was sufficiently free of protein. The concentration of stock solutions of DNA, expressed in moles of nucleotide phosphate [NP] was determined by UV absorbance at 260 nm. The extinction coefficient, ε260, was taken as 6600 M−1 cm−1 [56]. Stock solutions were stored at 4 °C and used after no more than four days. Tested compounds were dissolved in DMSO. The final concentration of DMSO in the buffered solution never exceeded 5%. Ligand L1 and its copper complex [CuI(L1)2](HSO4) (1) were subjected to analyses. The effect of the ligand and its complex on the conformation of the DNA secondary structure, explored with CD, was studied, keeping the CT-DNA concentration constant at 4.5 × 10⁻⁵ M for the ligand and at 5 × 10⁻⁵ M for its copper complex. The concentration of the studied molecules in the 10 mL buffer solution of PBS (pH = 7.4) varied following the ratio r = [ligand or complex]/[DNA] = 0, 0.1, 0.2, 0.4, 0.6. The spectrum of CT-DNA and those with the added substances were monitored in the 220–320 nm range. Each spectrum is the average of 3.
Interactions of compounds with CT-DNA were also investigated by means of UV/Vis titrations in order to find the binding constants. Measured volumes of the ligand and, separately, its complex at known concentrations were added to the PBS solution containing different amounts of DNA.
The titrations took place at room temperature with an incubation time of approximately 4 h at 37 °C. Changes in absorbance were monitored at absorption maxima of 313 nm for the ligand and 393 nm for the complex.
Binding constants for the interaction of the studied compounds with nucleic acid were determined as described in [33] by means of UV–vis titrations. The intrinsic binding constant Kb for the interaction of the compounds under study with CT-DNA was calculated by absorption spectra titration data using the following equation:
1/Δεap = 1/(ΔεKbD) + 1/Δε
where Δεap = |εA − εf|, Δε = |εB − εf|, D = [DNA], and εA, εB, and εf are the apparent, bound, and free extinction coefficients of the compound, respectively. The constant Kb is given by the ratio of the slope to intercept when it is reported in plot form [DNA]/(εA − εf) versus [DNA], and it is expressed as M−1. The previous equation, originally used to calculate the binding constants for hydrophobic derivatives, is now broadly used to investigate a wide variety of metal complexes containing phenanthroline and its derivatives, and has subsequently been adopted to evaluate binding constant values from metal complexes with different ligands [34,57,58,59,60,61,62]. Fixed amounts of the ligands and complexes were dissolved in DMSO because their high solubility in this solvent allowed us to prepare concentrated solutions, and therefore, to utilize reduced volumes in titrations. It was also verified that the DMSO percentage added to the DNA solution did not interfere with the nucleic acid; in fact, the 260 nm absorption band was not subject to modifications in intensity and position. Calculated amounts of stock solutions were taken to final concentration values of 10 mM of PBS, and increasing amounts of DNA over a range of ratios r = [DNA]/[complex] = 0, 0.5, 1, 1.5, 1.9. The final concentration of the ligand was kept constant at 2.57 × 10⁻⁵ M, while that of the complex was kept constant at 3.10 × 10⁻⁵ M. The changes in absorbance of an intraligand (IL) band upon each addition of DNA were monitored at the maximum wavelengths 313 for L1, and 393 nm for [CuI(L1)2](HSO4) (1).
Drug effects on cell viability were analyzed using a 3-(4,5-dimethylthiazol-2-yl)-2,5-diphenyltetrazolium bromide (MTT) colorimetric assay, based upon the ability of metabolically active cells to reduce MTT into formazan by the action of mitochondrial dehydrogenases. U937 (150,000 mL−1) cells were seeded into 96-well plates overnight, and then exposed to compounds at indicated concentrations. At the end of the treatment, MTT was added (final concentration 0.5 mg mL·mL−1) for 3 h at 37 °C and formazan crystals were dissolved in 100 mL for each well of acidic isopropanol (0.08 N HCl). After mixing, absorbance was evaluated using a Multiskan Ascent microwell plate reader equipped with a 550 nm filter (Thermo Labsystems, Helsinki, Finland). At least three independent experiments were performed with eight replicate wells per sample. The percentage of cell viability was calculated using the following equation: % viability = (Mean ODsample)/(Mean ODblank) × 100. The half maximal inhibitory concentration (IC50) was determined as the concentration resulting in 50% cell growth reduction compared with untreated control cells (Figure S1).

3. Results and Discussion

3.1. Synthetic Comments

During the synthesis of L2 an alternative strategy was attempted that produced an already pure product obtained in a single step but with lower yields (55%), by mixing a stoichiometric quantity of reagents in ethanol with a few drops of acetic acid and heating the mixture at reflux temperature for 24 h. The product precipitates and can be filtered.
A second procedure was attempted also for the synthesis of L4, that gave better results in terms of speed and yield (90%). Equimolar amounts of reagents in absolute ethanol at reflux temperature were placed in a round bottomed flask, together with a few drops of glacial acetic acid as catalyst. The aldehyde is insoluble as well as the product, which was obtained in the form of a pale green powder that was filtered on Buchner within 4 h.
The brown/green powder agglomerates, named L6, obtained while synthesizing [CuI2(SO4)(L2)5] (2), were subject to IR, AE and MS analyses but it was not possible to clearly identify their nature. Different attempts were made to redissolve the heterogeneous powdery system in an acetonitrile/methanol mixture. The most of the product was solubilized, but a dark brown precipitate remained on the bottom of the beaker; the two phases were then separated by gravity filtration. The soluble part was placed in a crystallizer to evaporate while an IR was made of the insoluble part, which showed that it was mostly composed of CuSO4 and traces of the ligand. The soluble part was dried in a few days, and the IR spectrum was very similar to both the spectra of the crystals and of the agglomerates. An elemental analysis was performed on it but the result was not perfectly congruent with none of the hypotheses proposed. Neither MS could help.
The major surprises raised from the syntheses of the copper complexes with L1 and L2 ligands that produced unexpected but reproducible results. It is noteworthy that thanks to X-ray diffractometry it has been possible to understand the nature of the isolated pure products. By reacting the naphthyl derivatives with the Cu(II) salt, in fact, only Cu(I) complexes were isolated. Unfortunately, it was not possible to isolate the byproduct L6 in a crystal form apt for X-ray diffractometry. Also its characterization by means of spectroscopic, spectrometric and elemental analysis did not allow to get a stoichiometry of the compound that contain the oxidation products associated to the reduction of the complex. Likely, it contains a mixture of oxidized ligand together with a part of a Cu(II) complex, but unfortunately it was not possible to separate the different species present in the mixture. Also in the case of the syntheses of the complexes with the anthraldehyde derivatives, it could not be possible to isolate the products probably because of the formation of a mixture of different redox products promoted by the electron withdrawing behaviour of the chloroanthraldehyde that could not be properly separated.
The red [CuI(L1)2](HSO4) (1) crystals exposed to air, do not undergo to a re-oxidation process and therefore are kinetically stable. The same crystals dissolved in a methanol/acetonitrile = 1/1 solution, seem stable for a period of circa 3 days, but with the slow evaporation of the solvent and the concentration of the mixture, it can be observed the formation of the red [CuI(L1)2](HSO4) (1) crystals together with the green/brown powder associated to L5. This leads to the conclusion that the copper (I) complex in crystalline form is kinetically stable in air. In solution, in the presence of oxygen for a medium/long period of time, [CuI(L1)2](HSO4) (1) partially degrades. The exact degradation mechanism is still unknown.

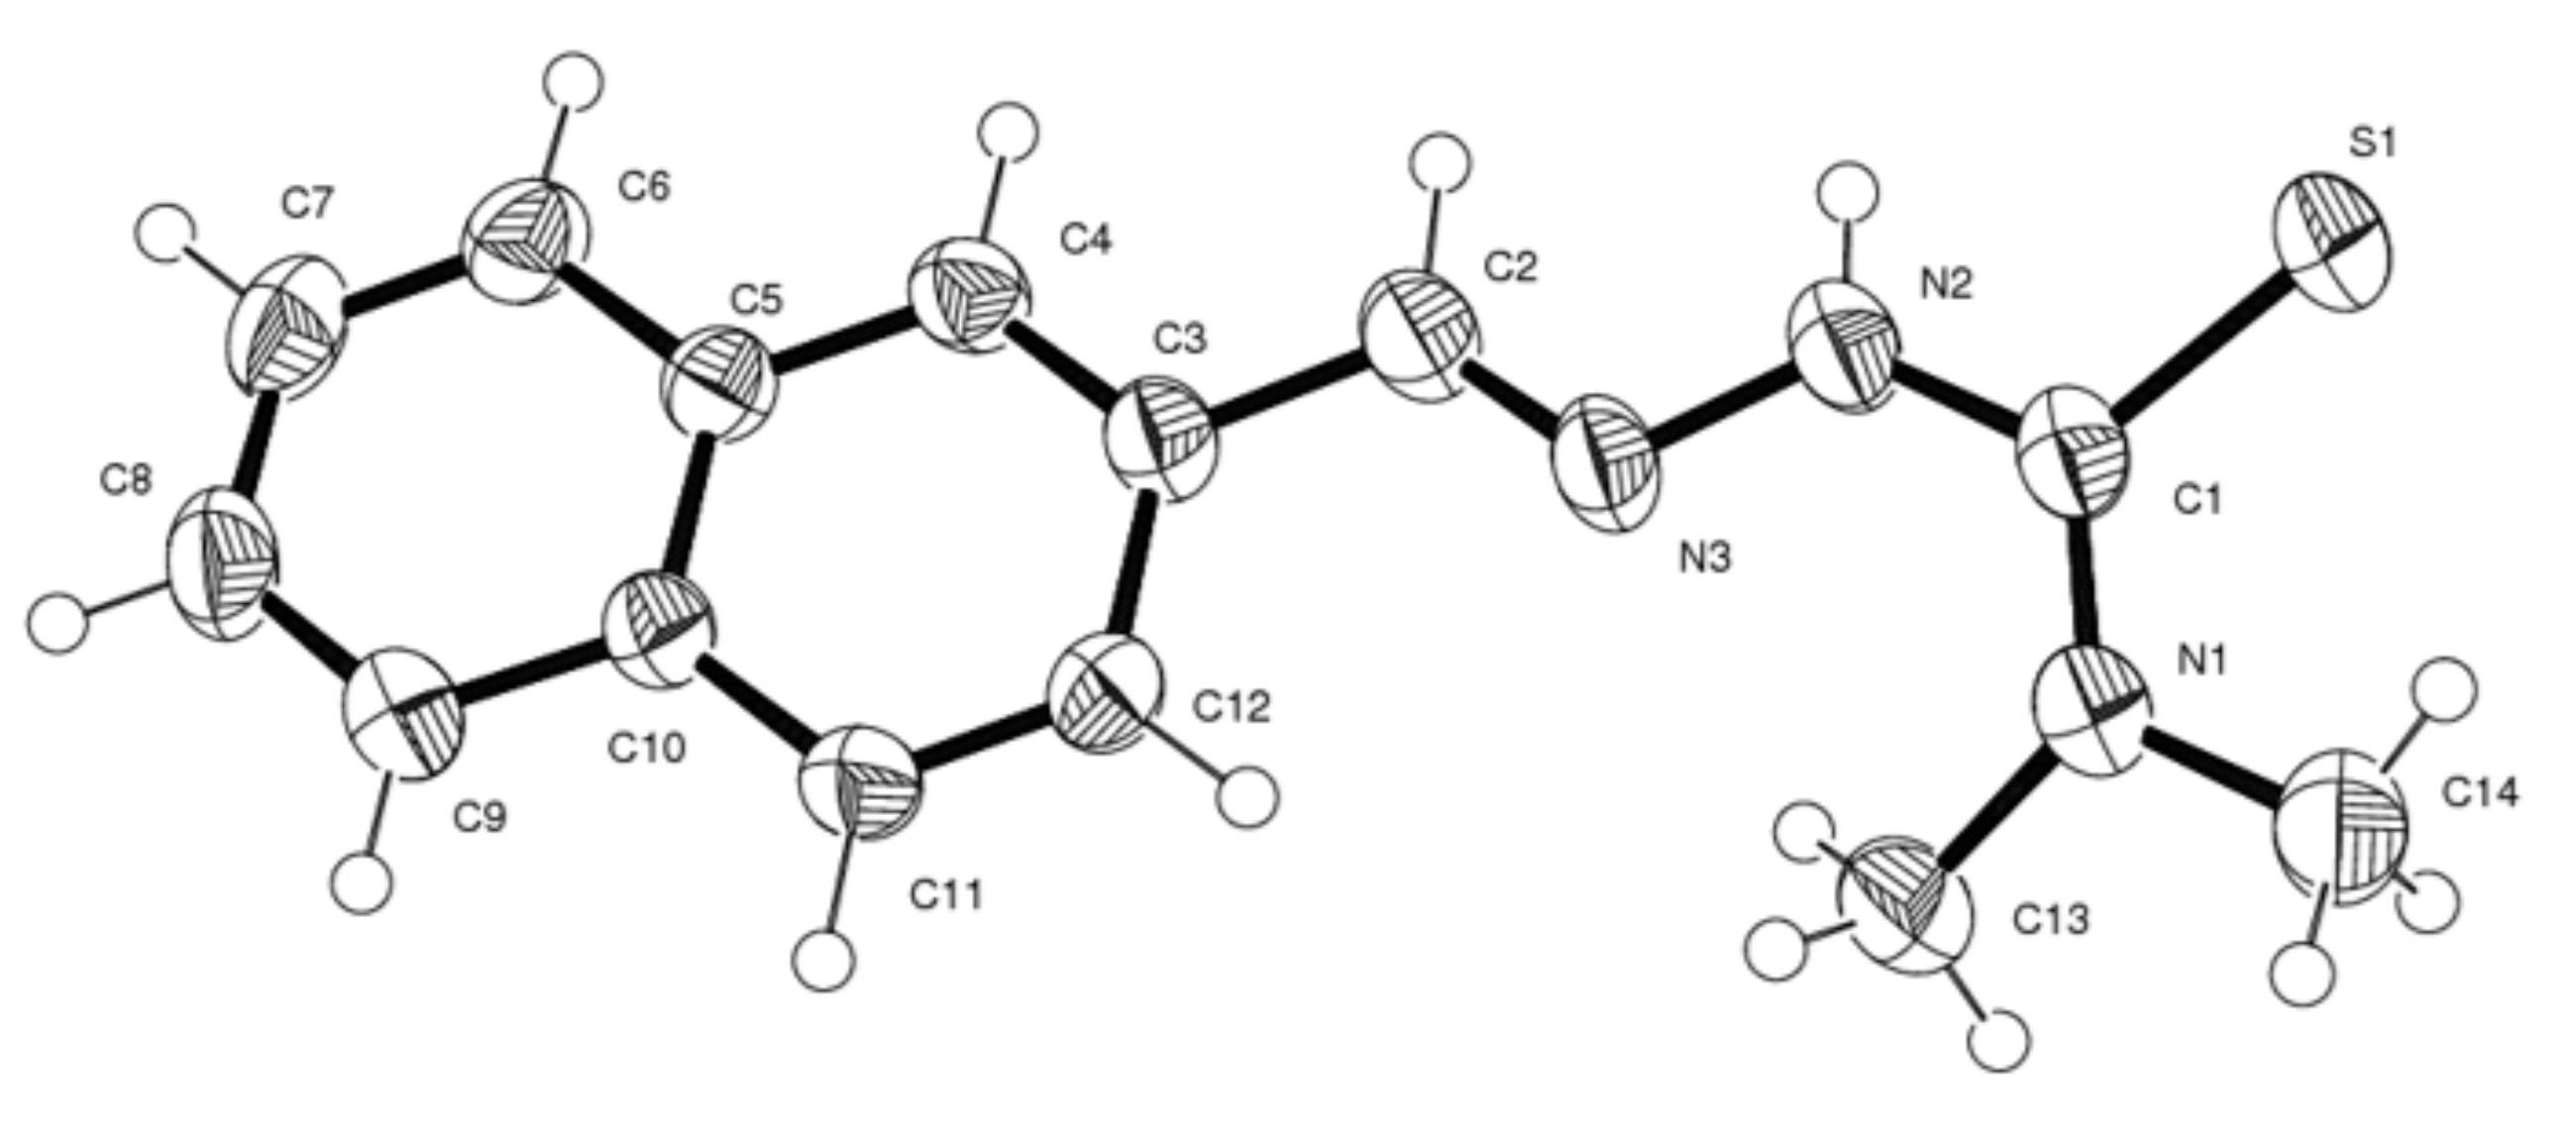
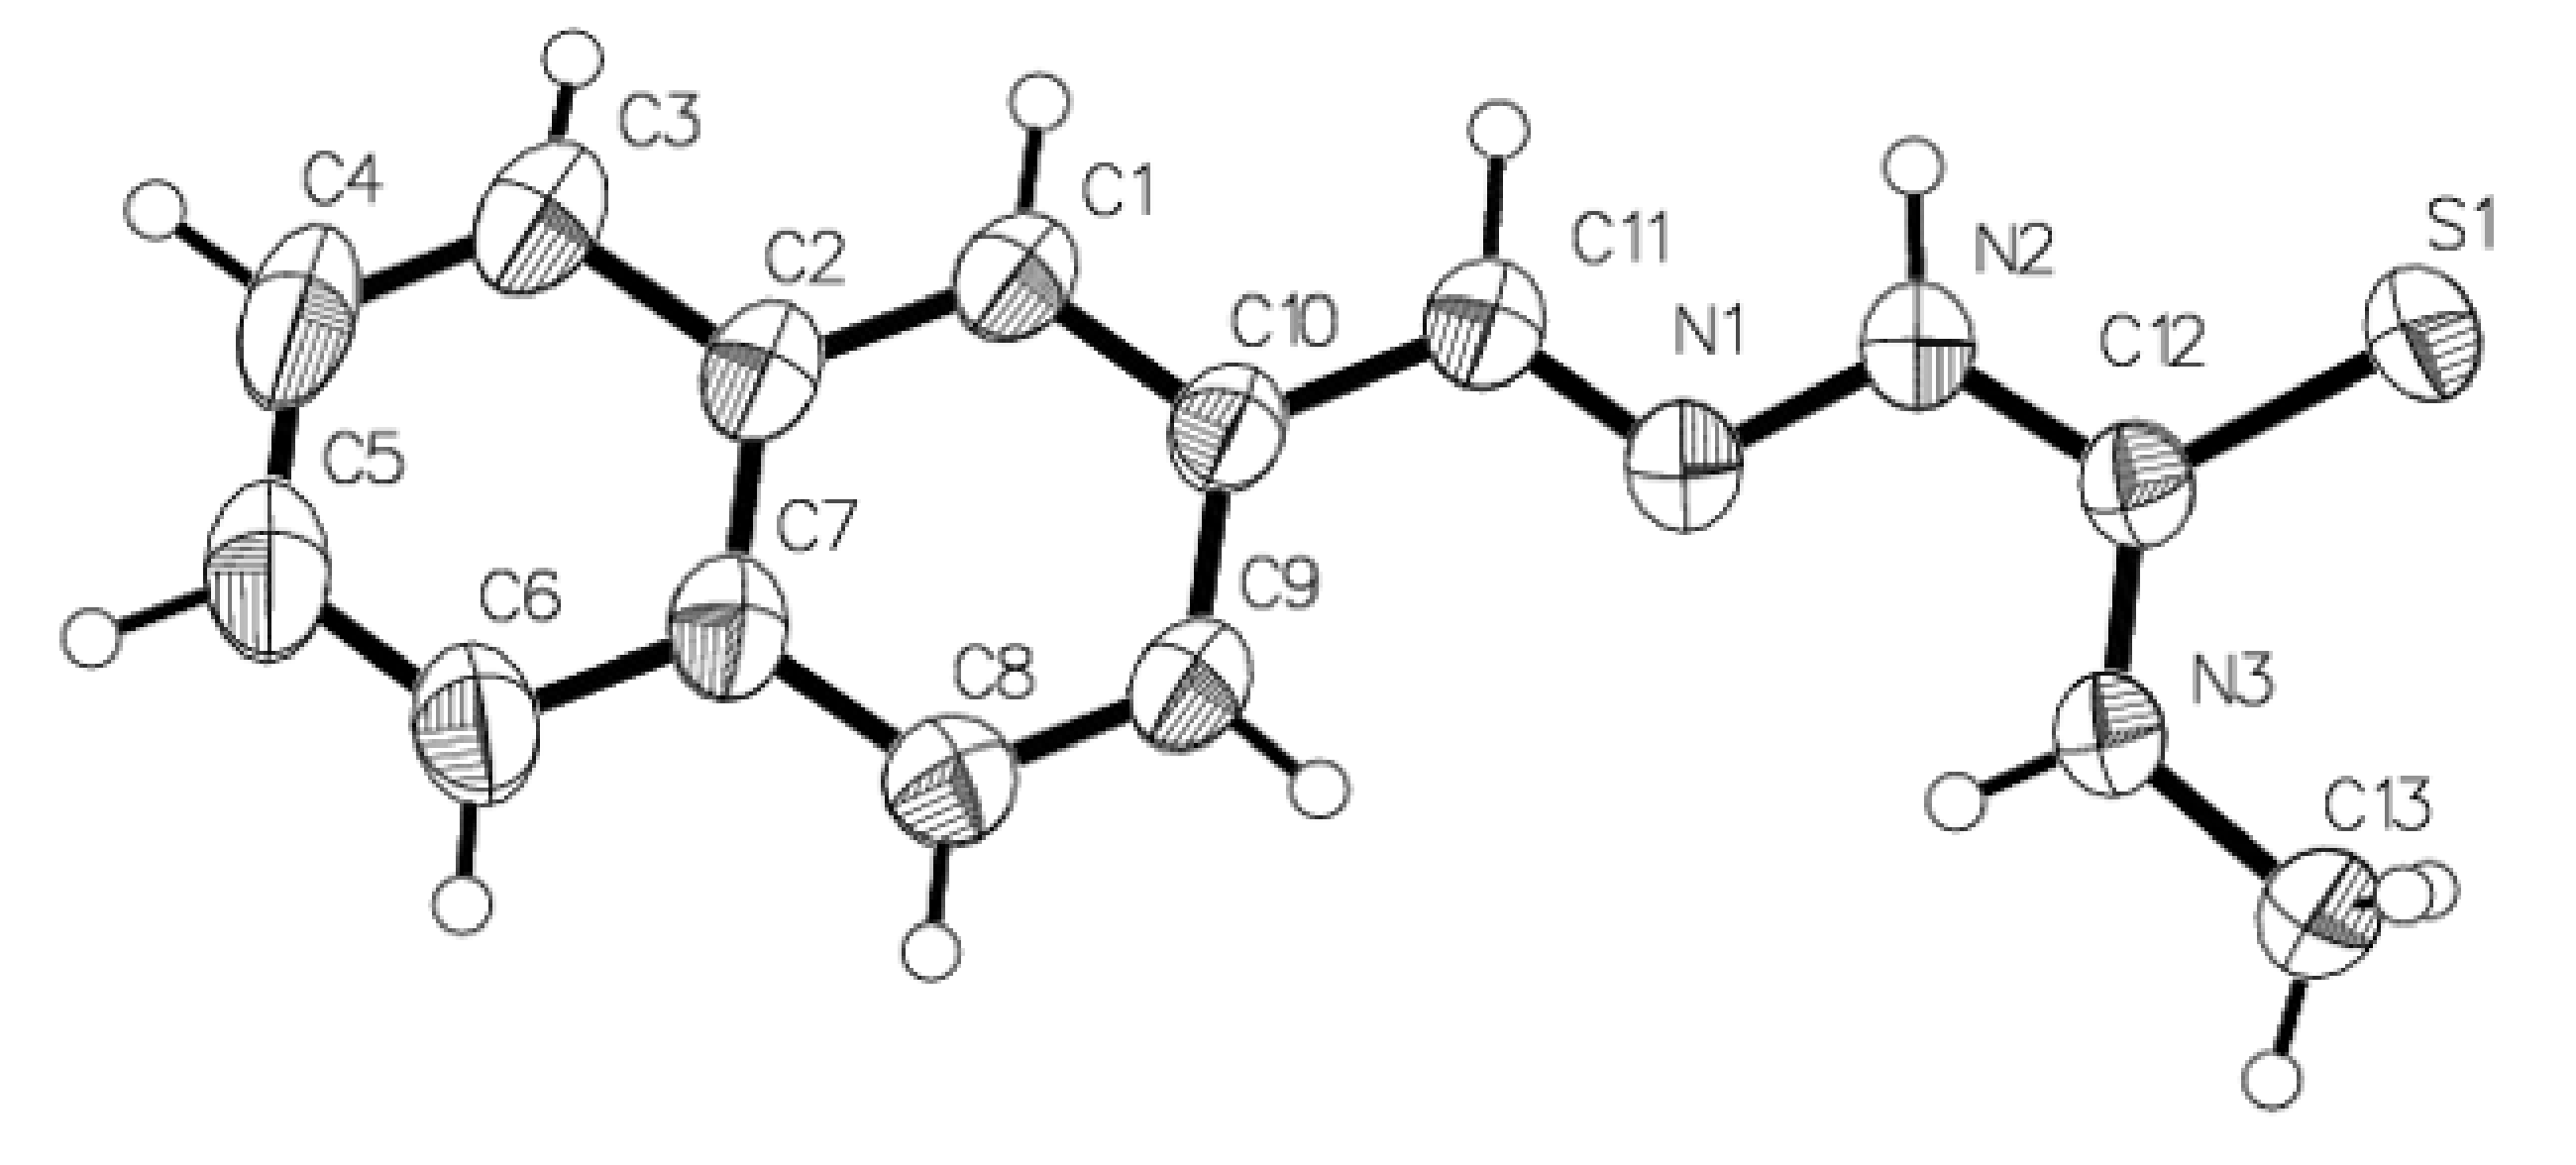
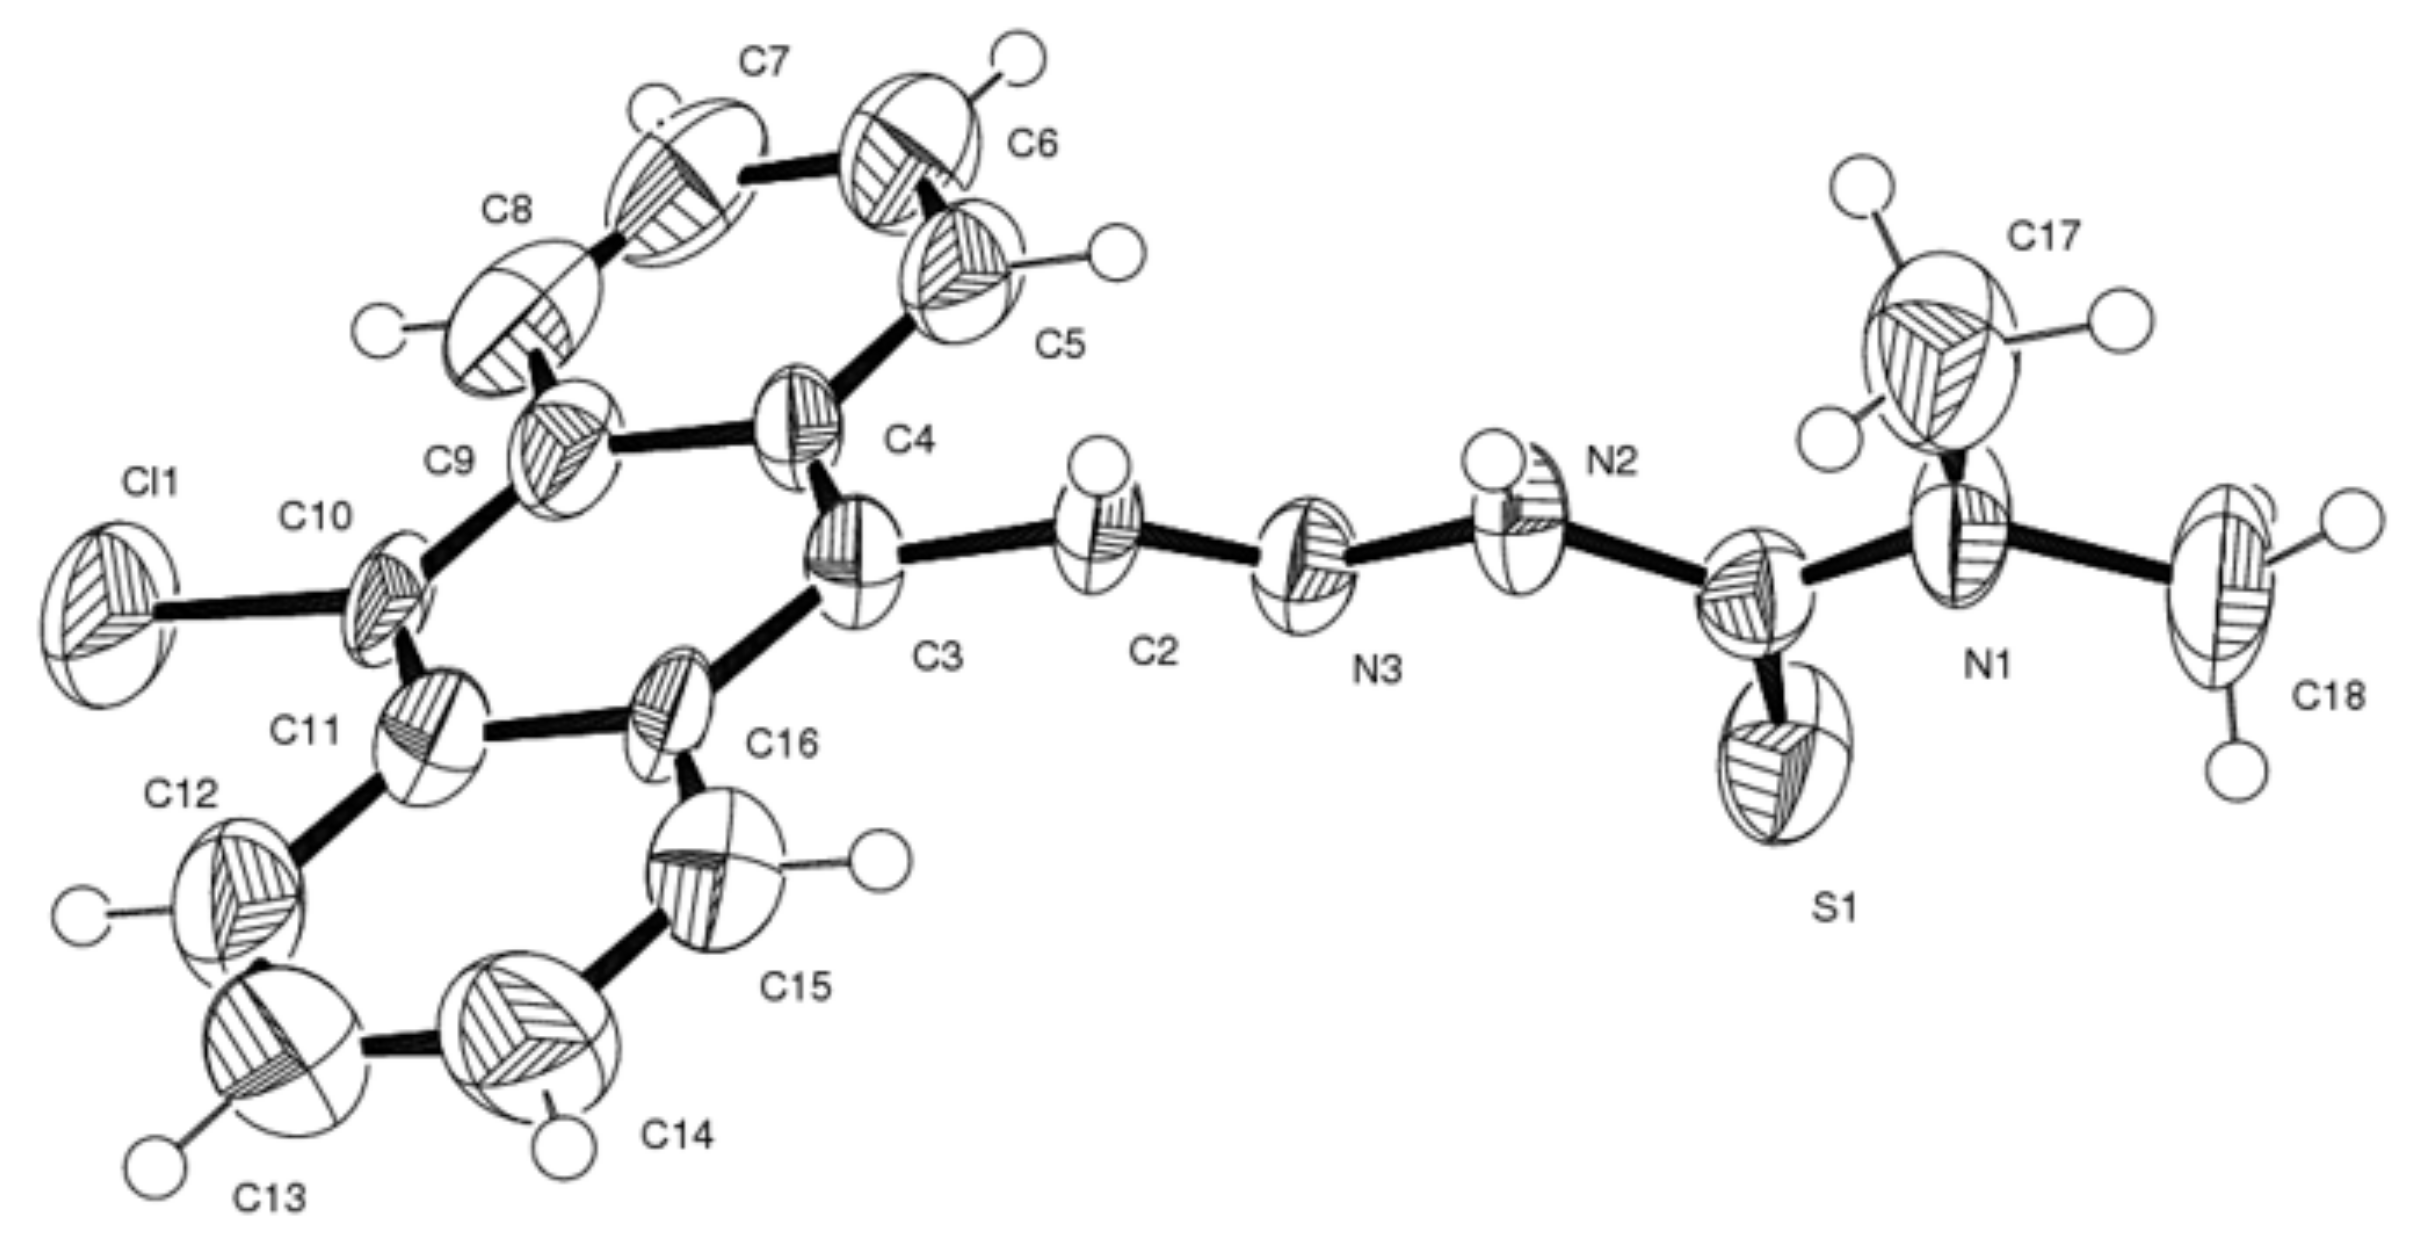
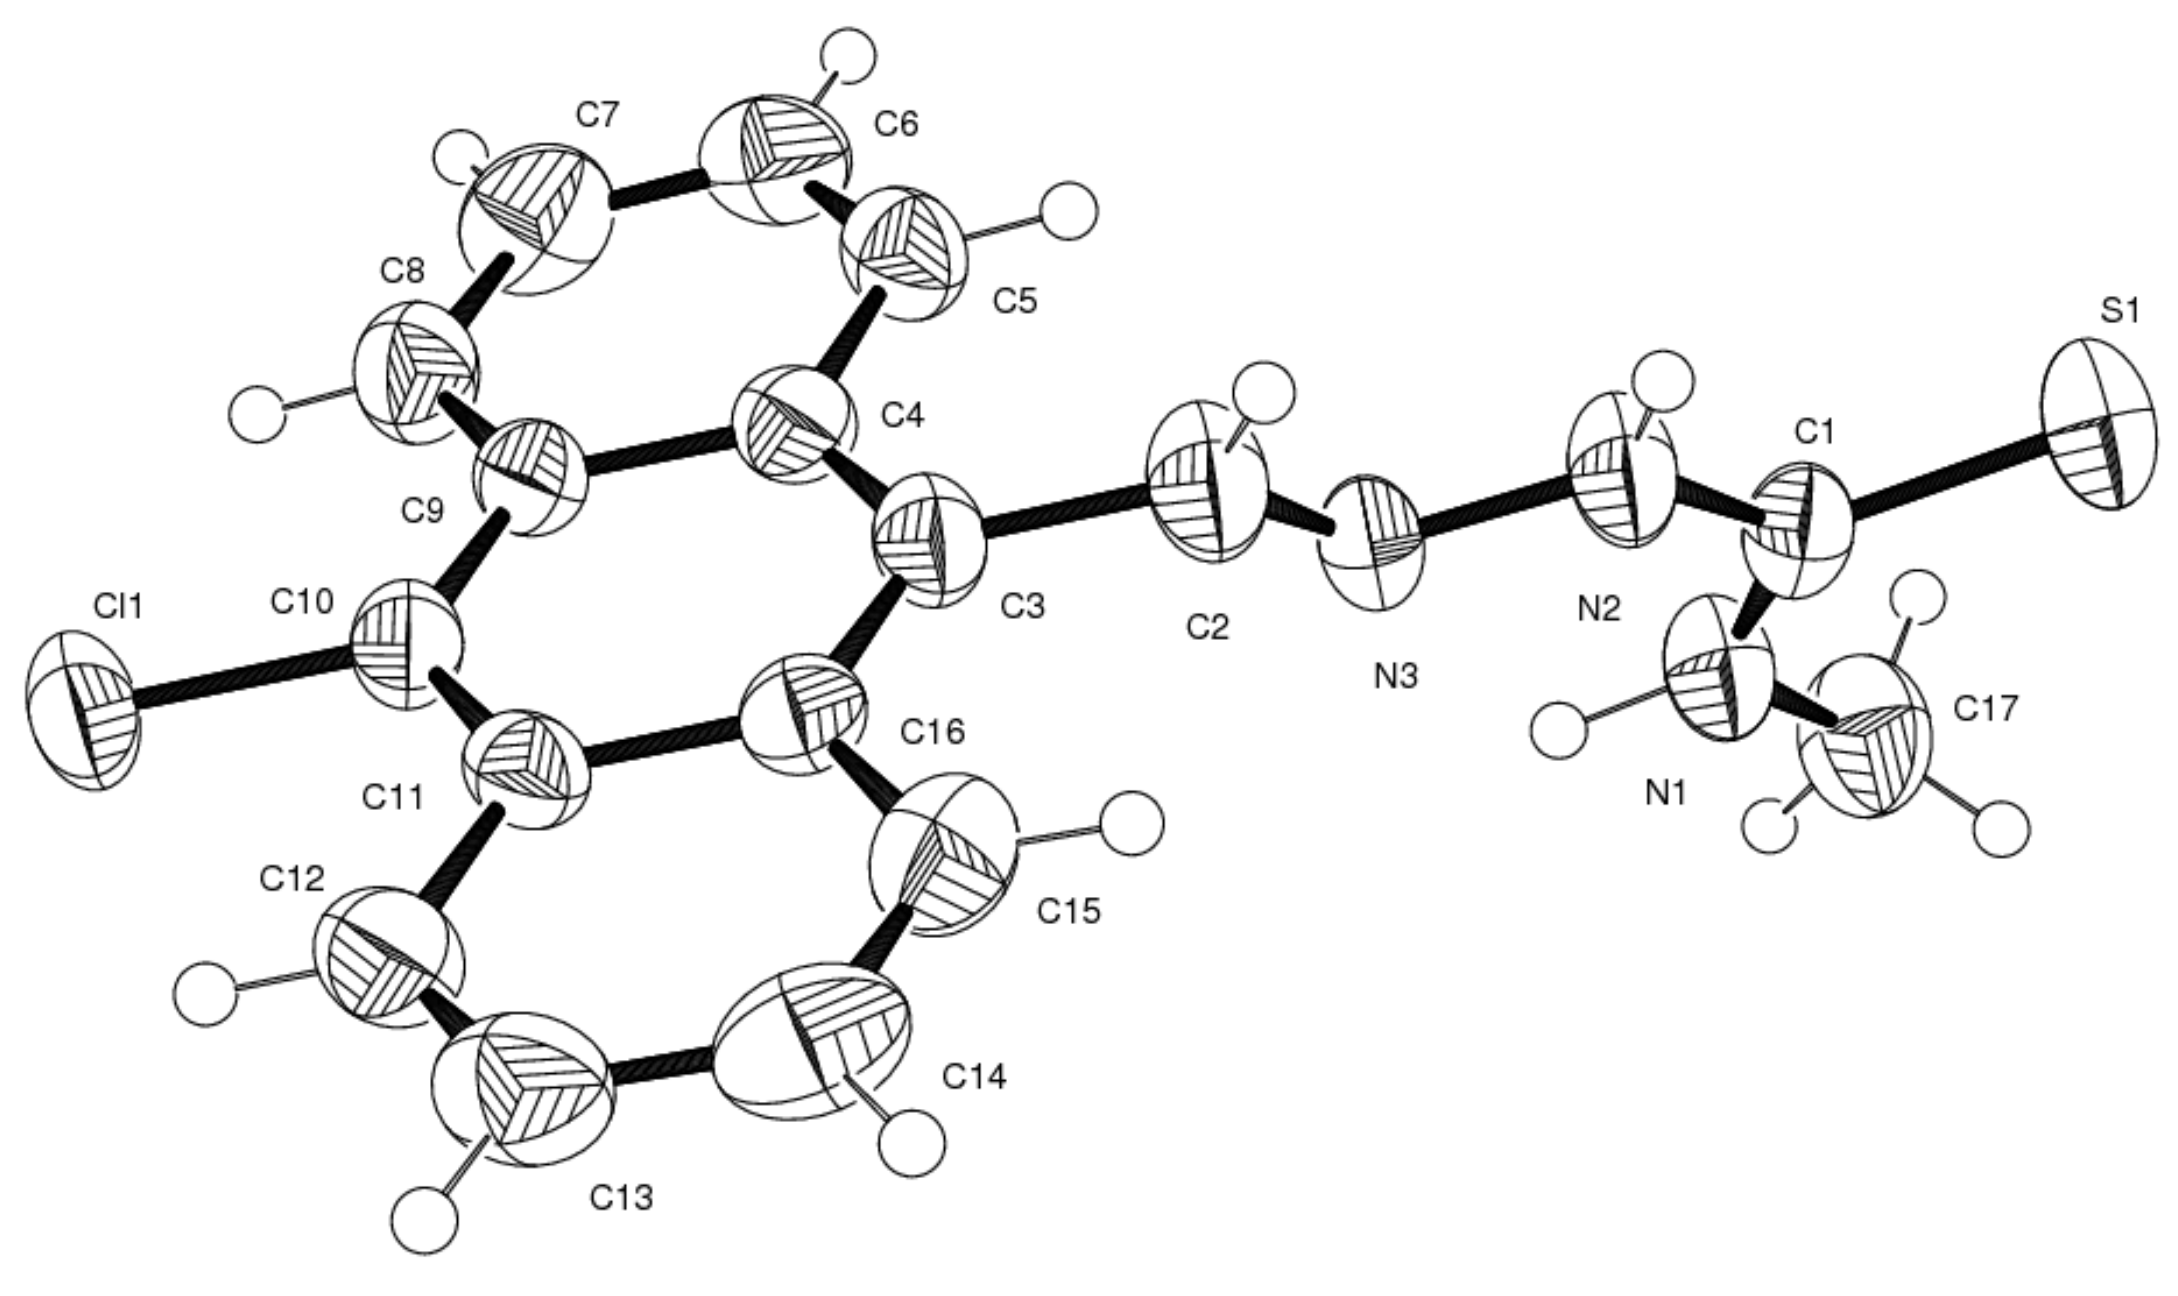
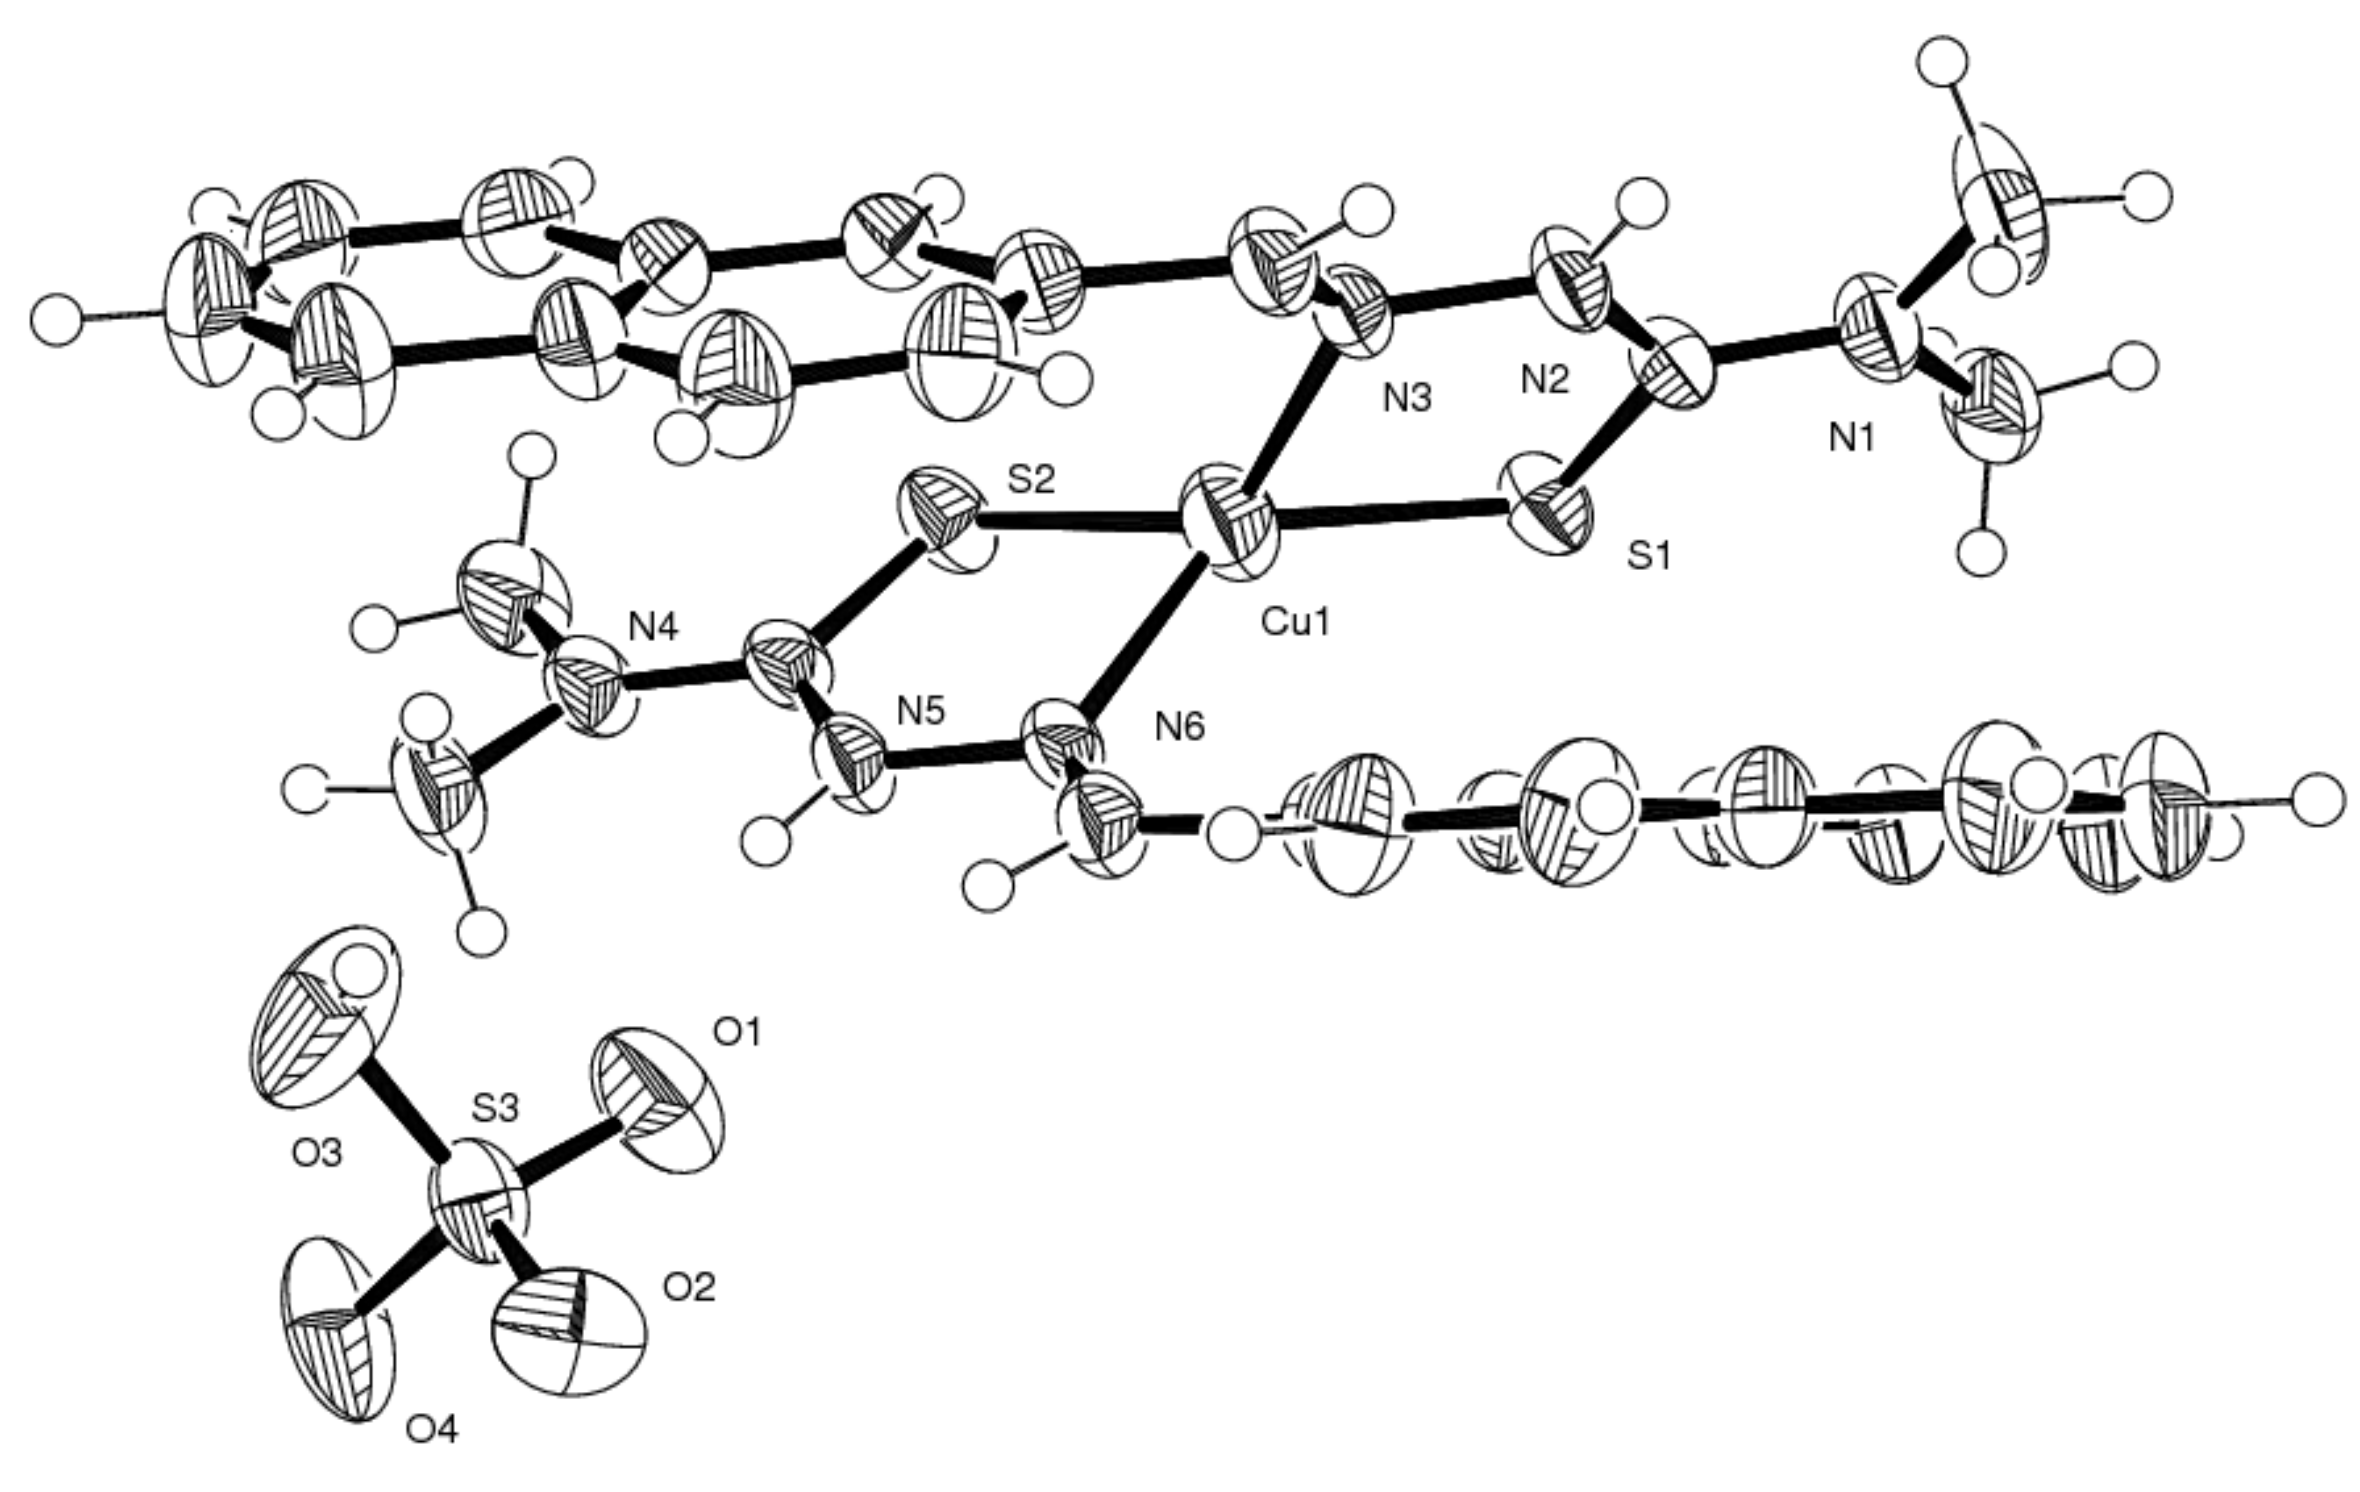
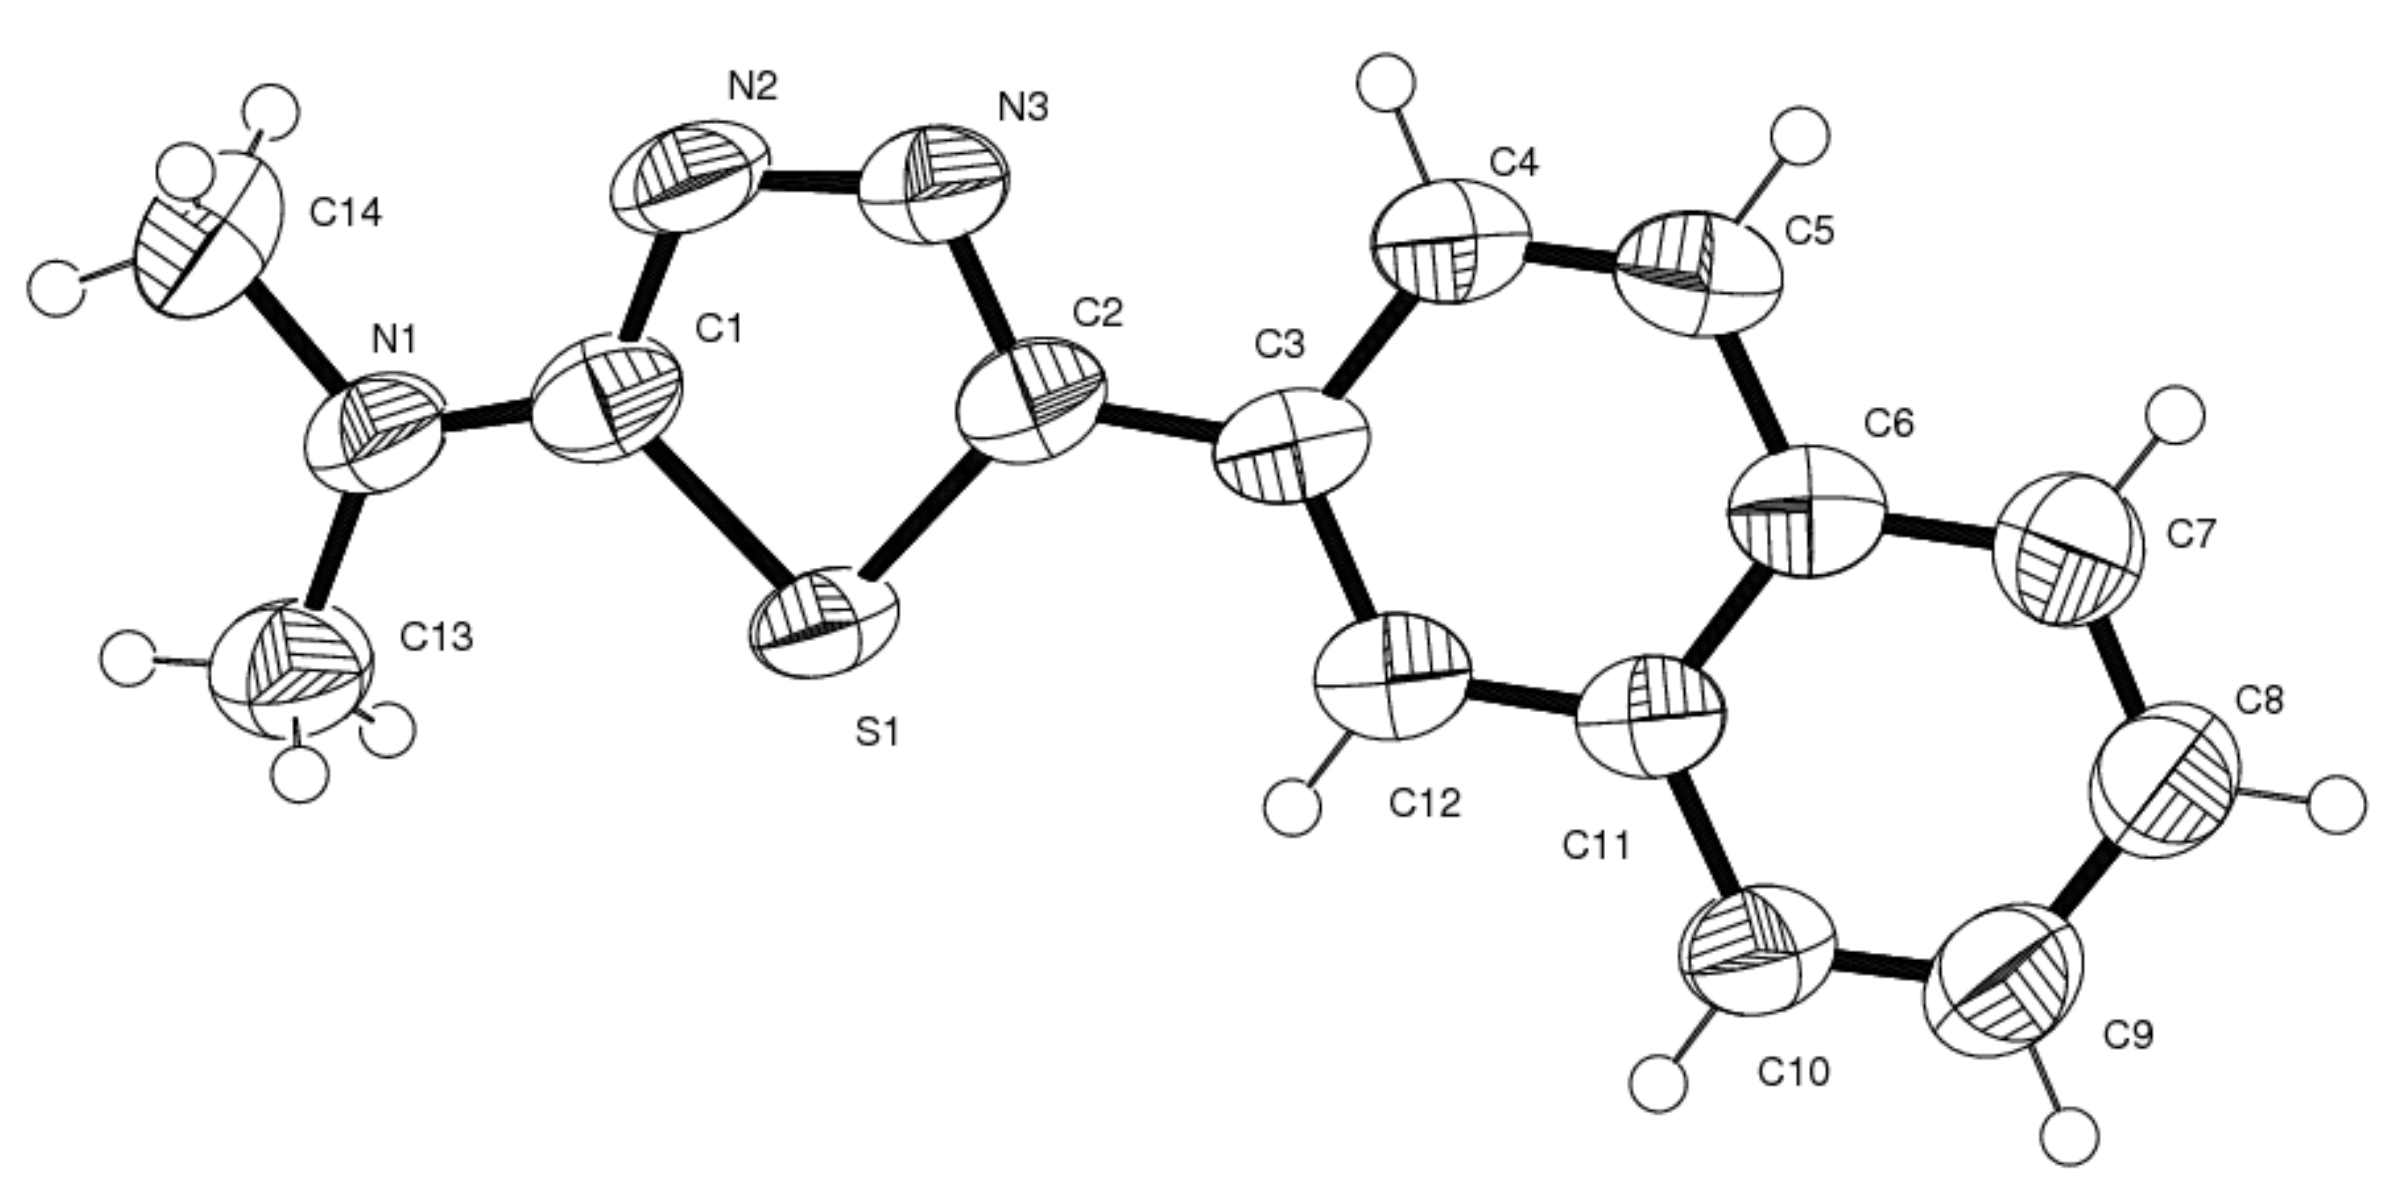
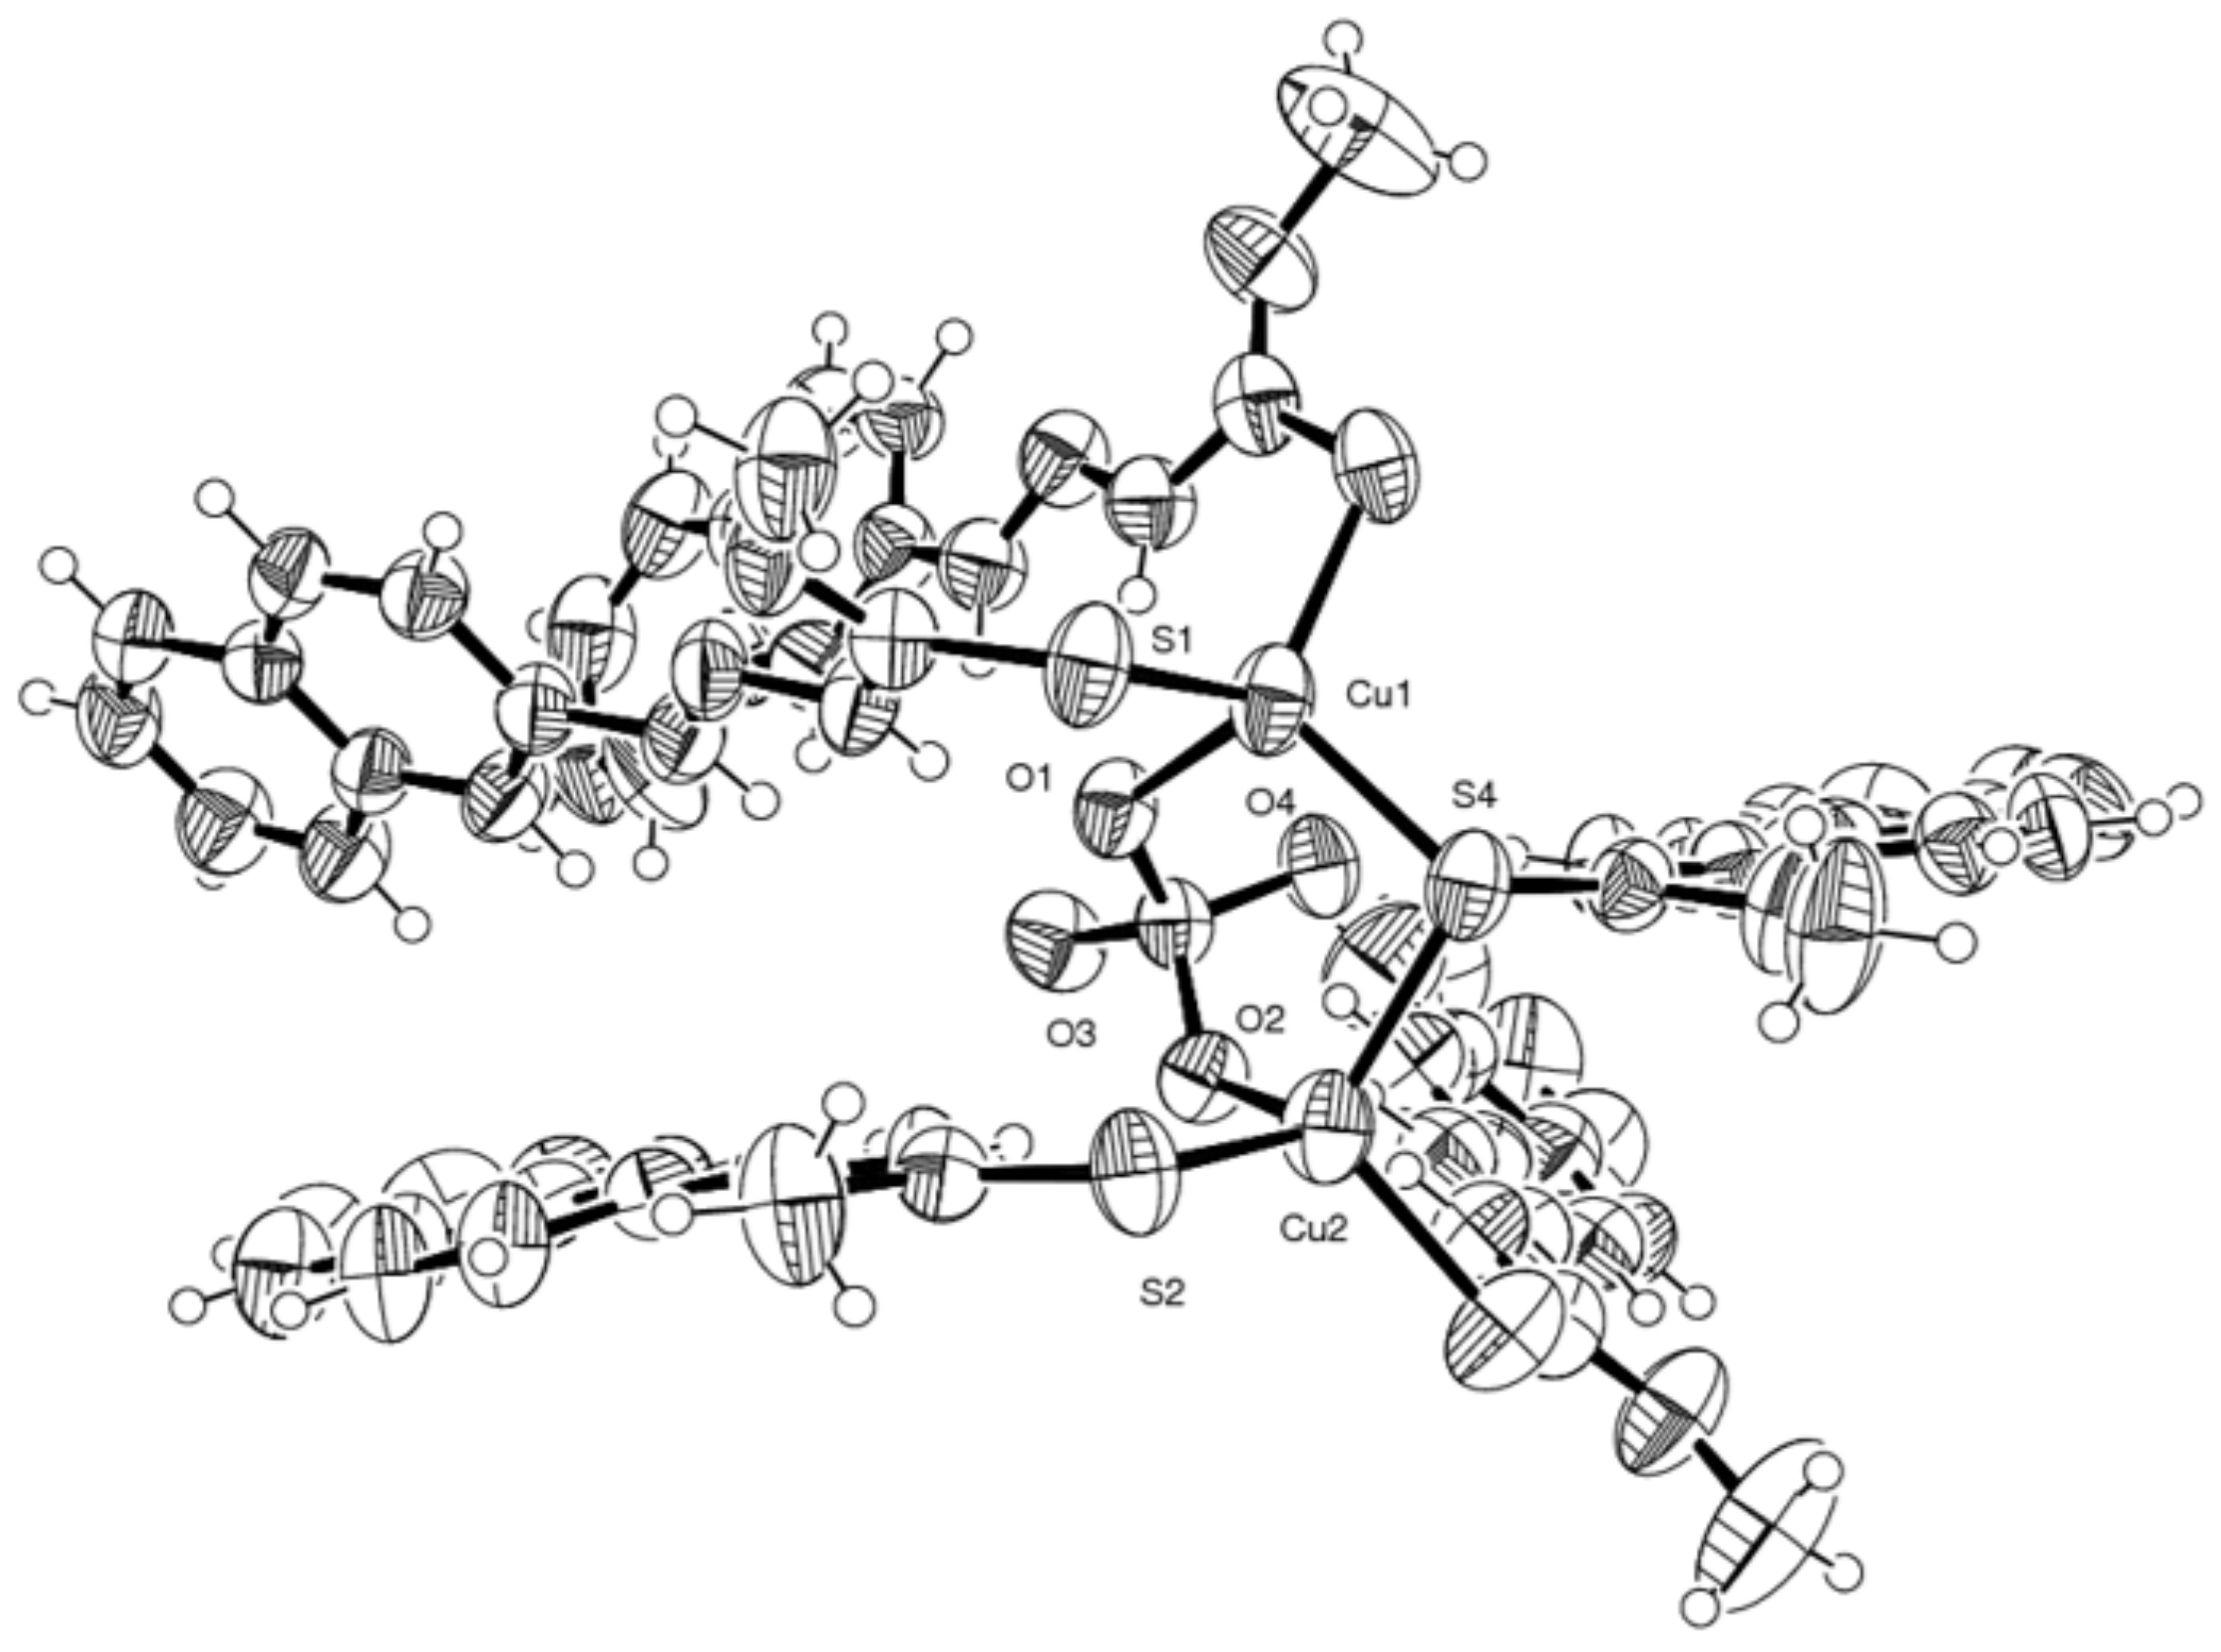
3.2. Description of the Structures

For what L1 and L2 is concerned, from the X-ray analysis it can be seen that the molecule exhibits an E conformation around the C1-N2 bond (Figure 1) as found in other uncoordinated thiosemicarbazones.
The mean planes of the thiosemicarbazone group and that of the naphthyl group form a dihedral angle of 15.9°. Also L2 shows the same behaviour (Figure 2).
On the contrary, the L3 ligand shows a Z conformation around the C1-N2 (Figure 3), therefore the sulfur and the iminic nitrogen atoms are already in the proper position for chelation. The mean planes of the thiosemicarbazone group and that of the anthracene aromatic structure form a dihedral angle of about 70°.
For what L4 is concerned, if the dihedral angle is still of about 70°, the conformation around the C1–N2 bond is E instead (Figure 4).
The X-ray analysis of the compound obtained by reaction of L1 with Cu(II) ions revealed the copper complex in its reduced oxidation state. The structure of [CuI(L1)2](HSO4) (1) (Figure 5) is formed by a Cu(I) ion which coordinates two molecules of non-deprotonated S,N bidentate ligand to form a distorted tetrahedron. The positive charge of the Cu(I) ion is neutralized by the negative charge of a hydrogensulfate ion. The coordination distances are Cu1-S1 = 2.252(1) Å, Cu1-S2 = 2.246(1) Å, Cu1-N3 = 2.153(2) Å, Cu1-N6 = 2.150(3) Å. The ligand molecule is strongly distorted due to the coordination. In fact the dihedral angle between the mean plane of thiosemicarbazide and that of naphthalene is 50.9°. The packing is determined by hydrogen bonds between the hydrazine nitrogen atoms and two oxygen atoms of the hydrogen sulfate ion (N5-H.....O1e N2-H.....O4 (x − 1, y, z) with the value of 2.885(5) Å) and by a short hydrogen bond O3-H…..O3 (−x + 1, −y + 1, −z + 1) between two hydrogen sulfate ions of only 2.615(5) Å.
The oxidation product isolated L5 (Figure 6) has a thiadiazole aromatic heterocyclic ring coplanar with the naphthyl moiety. The bond distances are within the mean values observed in similar structures.
Comparing the dimethylated derivative with the monomethylated one, the structure of the corresponding copper complex [CuI2(SO4)(L2)5] (2) (Figure 7 and Figure S2), dramatically changes. In fact, the crystalline structure is formed by two independent copper atoms in the oxidation state +1 and by five ligand molecules that behave as monodentates through the sulfur atom. One of the five ligands acts as a bridging ligand through the sulfur atom between two Cu(I) ions. All the ligand molecules are neutral and the positive charge of the complex is neutralized by the sulfate group arranged as a bridge between the two copper atoms. Each Cu(I) therefore has a tetrahedral coordination determined by three sulfur atoms of the ligands (one of which is a bridge) and by an oxygen atom of the sulfate group. The coordination distances are respectively Cu1-S: 2.308(2), 2.305(2), 2.276(2) Å; Cu1-O1: 2.281(2) Å and Cu2-S: 2.349(2), 2.271(2), 2.265(2) Å; Cu2-O2: 2.293(2) Å. The five molecules of the ligand, unlike what has been observed for the [CuI(L1)2](HSO4) (1) complex, are markedly planar, in fact the dihedral angles between the thiosemicarbazidic group and the naphthalene plane in the five ligands are 3.51°, 8.76°, 11.63°, 11.69° and 15.66°. The crystalline structure contains three water molecules of crystallization that contribute to the packing.
Beside the reduction of copper, an oxidation of the ligands occurred that in the case of the L1 derivative could also be detected and clarified by means of X-ray diffraction (L5, Figure 6). The oxidation of the thiosemicarbazone leading to a 1,3,4-thiadiazole derivative promoted by metal salts is an already known process [63,64,65]. Usually, this kind of oxidation is promoted by Fe(III) as metal ion, while Cu(II) has been observed to produce only the 1,2,4-triazolines species [65]. It has also been observed that very different results—both in terms of reaction regiochemistry and yields, and in terms of reaction kinetics—can be achieved by the use of different salts, depending on the hardness/softness of the metal cation, as well as on its intrinsic oxidizing strength. The formation of the 1,3,4-thiadiazole ring seems to be induced by an electrophilic attack of the metal cation as a Lewis acid on the imine nitrogen atom, followed by the ring closure step, and finally by the metal reduction and-deprotonation step [66]. Also the role of the substituent plays a fundamental role in the oxidation process [67].

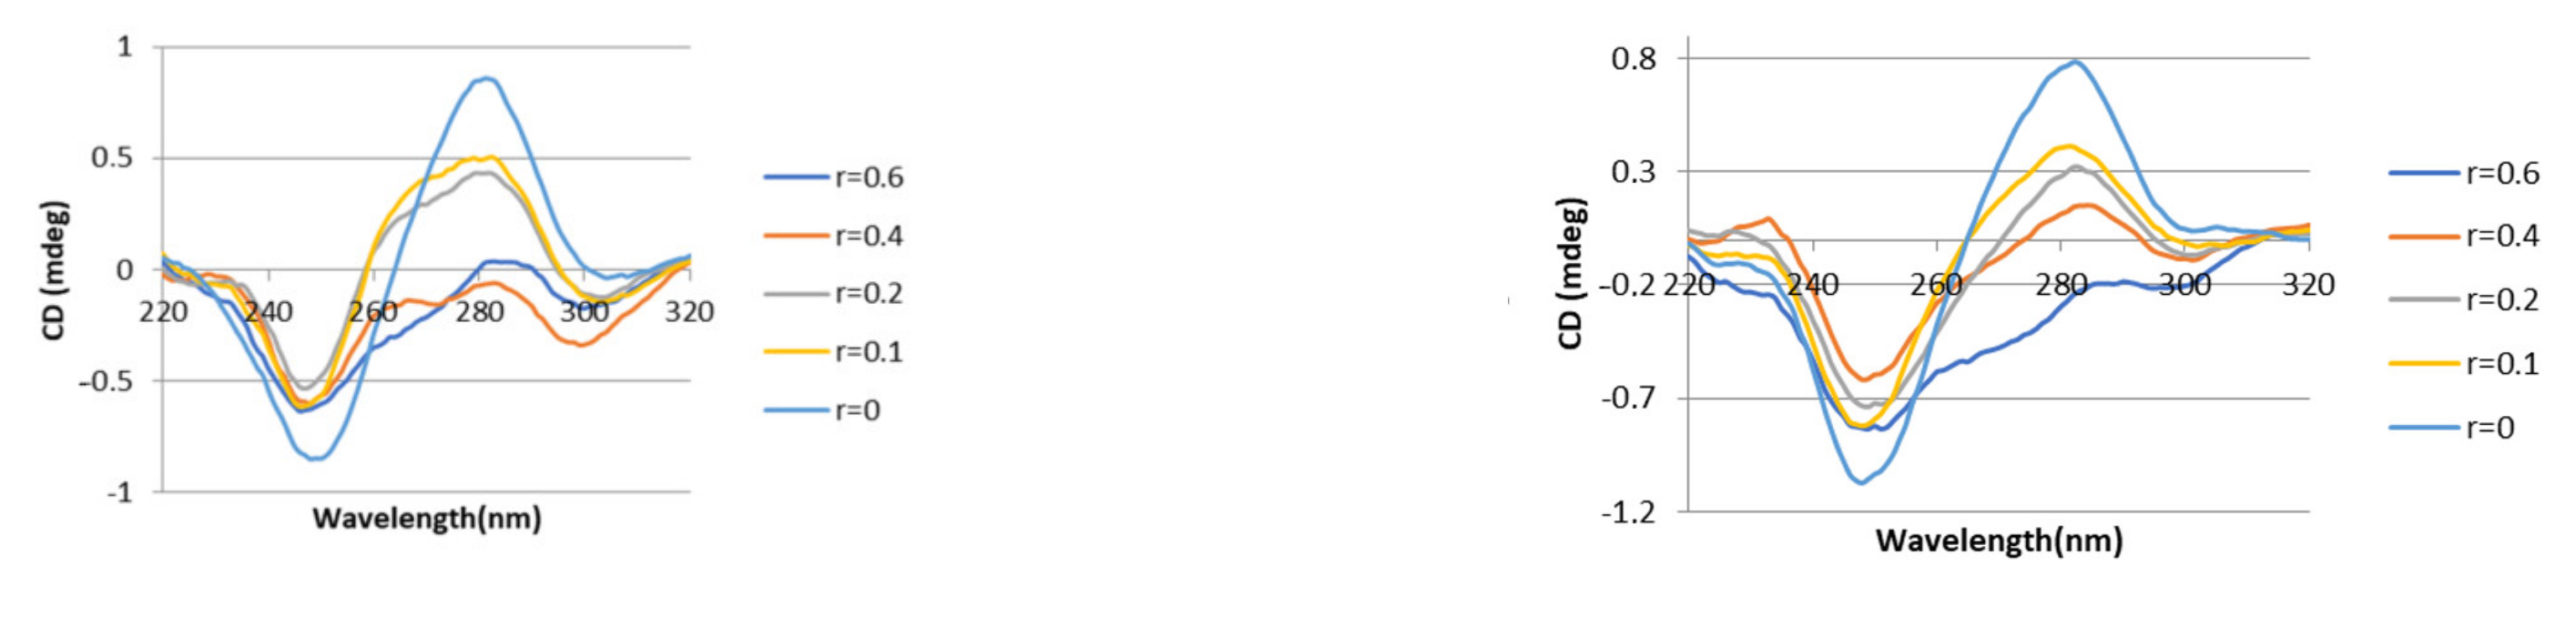
3.3. DNA and BSA Interaction Studies and Cell Viability Assay

Among the synthesized compounds, we decided to carry out biological testing only on the L1 ligand and its [CuI(L1)2](HSO4) (1) complex, since the main interest of our research was to verify whether complexation with copper could significantly improve the effect of the ligand on the biological substrate. The [CuI2(SO4)(L2)5] (2) complex had to be excluded because it proved to be poorly soluble and stable in the biological medium and the anthraldehyde derivatives were also not taken into consideration due to the impossibility to isolate their well characterized copper complexes.
As a first biological approach, we started by studying if these compounds could give direct interactions with DNA. To establish in detail whether the interaction of the molecules under study leads to a significant conformational change of the DNA double helix, Circular Dichroism (CD) spectra were recorded as the compound/CT-DNA ratio increased. The CD spectrum observed for calf thymus DNA consists of a positive band at 280 nm (UV: λ max, 260 nm) due to the nitrogenous base stacking and a negative band at 250 nm, due to helicity. This behaviour is characteristic of right-handed DNA in B form. It is known that at wavelengths over 230 nm, the CD spectrum of DNA in its B form consists of a positive band at longer wavelengths and a negative band at shorter wavelengths of almost equal magnitude with the point of intersection at maximum absorption [31]. As shown in Figure 8 (left) regarding the L1 ligand, the CD spectrum of DNA shows a moderate monotone decrease in the band to ca. 250 nm with a blueshift of a few nm.
The most important feature is observed for the positive band at approx. 280 nm. Usually, a slight interaction with the DNA groove and electrostatic interactions with small molecules show small perturbations or even no interaction on the bands attributed to base stacking or helicity [68]. In our case, both the ligand and its complex reveal an interaction with the nucleic acid. For both compounds, the observed behaviour at circular dichroism is consistent with a possible conformational change of DNA from B to C [69]. This aspect is more marked in the case of the ligand in which the positive band becomes practically absent as the concentration increases. For both compounds, the absence of isodichroic points also suggests the simultaneous presence of more than one mode of interaction with respect to DNA.
This last aspect could also justify the different spectral behaviour of the negative band, especially when the DNA interacts with the complex (Figure 8, right). In fact, in the CD spectrum of DNA in form C the negative band is similar in position and size to that of form B. In our case, the slightest deviation in the case of the interaction with the ligand and the more marked one in the case of the complex could lead us to think to an interaction of the condensed aromatic system with the nitrogenous bases of DNA. In conclusion, the results of the circular dichroism studies are indicative of a conformational change of the DNA double helix following the interaction of the DNA macromolecule with the tested compounds, and an intercalating interaction can be excluded.
From the data obtained from Figure 9; Figure 10 the constants Kb have been obtained, which are 1.3 × 10⁴ M−1 and 2.1 × 10² M−1 for the ligand and the complex respectively. These values are significantly lower than those found for classical intercalators (for example ethidium bromide has a Kb of 1.4 × 10⁶ in 25 mM Tris-HCl/40 mM NaCl buffer, pH = 7.8 [70]), and indicate that the compounds studied have a low affinity for DNA.
It is very interesting to note that the metal complex binds to DNA with less affinity than the free ligand. This data can be justified by the ionic character of the complex which could exert a greater electrostatic affinity towards the negatively charged nucleic acid. Furthermore, the overall structure of the compound strongly deviates from the planarity, as verified by X-ray diffraction, accentuating the distortions already present in the ligand (clearly visible in the packing that both molecules assume in the crystalline phase), making the aromatic condensed moiety less accessible to a stacking with the nitrogenous bases.
Hypochromism and red shift (bathochromism) in the absorption spectra of DNA bound to different compounds is generally attributed to intercalation, involving a strong stacking between the aromatic chromophores and the DNA base pairs. In our case this phenomenon is observed only for the ligand and in any case up to values of r = 1.5. This behaviour shows that a partial intercalation cannot be excluded for the ligand. In any case, this phenomenon is strongly dependent on the concentration. With the increase of the dilution of the ligand with respect to DNA, weaker interactions prevail which justify the not excessively high Kb values and also confirm the possibility that the ligand has to act in different ways against DNA, as also already verified by CD experiments. In the case of the complex, a marked hyperchromism is observed. This phenomenon, not yet well understood, suggests an external mode of action towards DNA, determined more by electrostatic interactions [71] and by the possibility to form a great network of hydrogen bonds. Since an hypochromic increase is normally associated with an increase in hydrophobic character, again this is in agreement with the ionic nature of the complex [72]. In conclusion, with our UV experiments we observe a strong interaction with the nucleic acid, as already verified in the CD experiments. However, the Kb values and the spectral behaviour exclude an intercalative action for the complex, behaviour that can only be partially provided by the ligand.
To better understand if the ligand or its complex could have a higher affinity for cellular proteins than for DNA, FT-IR spectra of bovine albumin (BSA) titrated with the ligand and the complex were recorded and reported in Figure 11.
The studies were performed following the procedure reported in the literature [73]. The infrared spectra of BSA, BSA with the compound (5 µM solution) in a 1:1 molar ratio and the compound alone were recorded after evaporating the solvent. The BSA-compound solutions were incubated for 24 h prior to measurement. The absorbance of the buffer was subtracted from the spectra of the solutions. Then, difference spectra were calculated using the instrument’s software package.
The infrared spectra of proteins [73] show the amide I bond (attributed to the C=O stretching of the functional group of the peptide moiety) between 1600 and 1700 cm−1. The exact position is determined by the backbone conformation. Since the band is associated with the secondary structure of the protein, perturbations of the bond on interaction with the tested compounds can provide a qualitative assessment of the binding, assuming that the binding induces a conformation change. As can be seen from Figure 11, the considered peak undergoes a red shift of about 20 cm−1 (1606 cm−1 for L1, 1605 cm−1 for [CuI(L1)2](HSO4) (1)). Since this peak is associated with the secondary structure of the protein, a significant perturbation of this type probably indicates that both the ligand and the complex have an affinity for BSA to induce a modification in its conformation. Although there could be other explanations, it is probably the thiosemicarbazone part of the compounds that interacts, since there is no large shift difference in the spectra of BSA treated with the ligand or with the complex.
The last biological test that has been performed is the study on tumour cell viability. The U937 cell line, originally established from a histiocytic lymphoma, has been widely used as a powerful in vitro model for hematological studies [74]. In our experiments, we found no activity exerted by the ligand alone on the cell line, while its complex [CuI(L1)2](HSO4) (1) showed an important inhibition on cell viability, reaching remarkably low IC50 value of 5.46 µM, considering that on the same cell line, the most famous metal based antitumor drug, cis-{[PtCl2(NH3)2]}, owns an IC50 value of 3 µM [75].

4. Conclusions

A set of four thiosemicarbazone ligands derived from naphthaldehyde and anthraldehyde have been synthesized and characterized also X-ray diffraction. The reactivity of the ligands toward Cu(II) ions revealed unexpected behavior. Cu2+ was able to oxidize a part of the naphthaldehyde thiosemicarbazones to a 1,3,4-thiadiazole derivative; this was unusual, given that this reactivity is usually associated with Fe3+ ions and not with other redox metal ions. The remaining naphthaldehyde thiosemicarbazone molecules present in solution yielded a Cu(I) complex. The anthraldehyde thiosemicarbazones were even more reactive towards Cu(II) ions and were oxidized to multiple species (not clearly identifiable) that probably contained not only 1,3,4-thiadiazole derivatives, but also 1,2,4-triazolines derivatives. Between the two Cu(I) complexes isolated, only [CuI(L1)2](HSO4) (1) was stable under the tested conditions, and moreover, did not undergo reoxidation, at least for the duration of the biological tests. Therefore, it was selected, together with its parent ligand, for further biological investigations. Both the ligand and its complex revealed an interaction with DNA. For both compounds, the observed circular dichroism behavior was consistent with a possible conformational change of DNA from B to C, and with the simultaneous presence of more than one mode of interaction. The UV experiments confirmed multiple ways for both compounds to interact with DNA, excluding complex intercalation as the prevalent interaction, and suggesting an external mode of action toward DNA, as determined by electrostatic interactions and by the formation of a great network of hydrogen bonds. Both the ligand and the complex had an affinity for BSA; this was probably due to the thiosemicarbazone moiety of the compounds that interacted with the protein, since there was no significant difference between the ligand and the complex behavior. The most interesting outcome of this research is that complex [CuI(L1)2](HSO4) (1) showed an important inhibition effect on U937 leukemic cell line viability, reaching a very low IC50 value of 5.46 µM, a property that is absent in the ligand alone.

Supplementary Materials

The following supporting information can be downloaded at: https://0-www-mdpi-com.brum.beds.ac.uk/article/10.3390/compounds2020011/s1, Crystal data and Cell viability curve after complex treatment. Figure S1: U937 cell viability curve after treatment with [CuI(L1)2](HSO4) (1) at different concentrations; Figure S2: Representation of complex [CuI2(SO4)(L2)5] (2).

Author Contributions

Conceptualization, G.P. and F.B.; Data curation, F.B.; Formal analysis, G.P., S.P. and F.B.; Methodology, F.B.; Supervision, G.P. and F.B.; Writing—original draft, F.B.; Writing—review & editing, G.P. All authors have read and agreed to the published version of the manuscript.

Funding

This research was funded by UNIPR Fil.

Institutional Review Board Statement

Not applicable.

Informed Consent Statement

Not applicable.

Data Availability Statement

CCDC 2164721-2164726 contain the supplementary crystallographic data. These data can be obtained free of charge via http://www.ccdc.cam.ac.uk/conts/retrieving.html (accessed on 6 April 2022), or from the Cambridge Crystallographic Data Centre, 12 Union Road, Cambridge CB2 1EZ, UK; Fax: (+44)-1223-336-033, or E-mail: [email protected].

Conflicts of Interest

The authors declare no conflict of interest.

References

  1. Sung, H.; Ferlay, J.; Siegel, R.L.; Laversanne, M.; Soerjomataram, I.; Jemal, A.; Bray, F. Global Cancer Statistics 2020: GLOBOCAN Estimates of Incidence and Mortality Worldwide for 36 Cancers in 185 Countries. CA Cancer J. Clin. 2021, 71, 209–249. [Google Scholar] [CrossRef] [PubMed]
  2. Kelland, L. The Resurgence of Platinum-Based Cancer Chemotherapy. Nat. Rev. Cancer 2007, 7, 573–584. [Google Scholar] [CrossRef] [PubMed]
  3. Anthony, E.J.; Bolitho, E.M.; Bridgewater, H.E.; Carter, O.W.L.; Donnelly, J.M.; Imberti, C.; Lant, E.C.; Lermyte, F.; Needham, R.J.; Palau, M.; et al. Metallodrugs Are Unique: Opportunities and Challenges of Discovery and Development. Chem. Sci. 2020, 11, 12888–12917. [Google Scholar] [CrossRef] [PubMed]
  4. Boros, E.; Dyson, P.J.; Gasser, G. Classification of Metal-Based Drugs According to Their Mechanisms of Action. Chem 2020, 6, 41–60. [Google Scholar] [CrossRef]
  5. More, M.S.; Joshi, P.G.; Mishra, Y.K.; Khanna, P.K. Metal Complexes Driven from Schiff Bases and Semicarbazones for Biomedical and Allied Applications: A Review. Mater. Today Chem. 2019, 14, 100195. [Google Scholar] [CrossRef]
  6. Denoyer, D.; Clatworthy, S.A.S.; Cater, M.A. Copper Complexes in Cancer Therapy. In Metallo-Drugs: Development and Action of Anticancer Agents; Sigel, A., Sigel, H., Freisinger, E., Sigel, R.K.O., Eds.; De Gruyter: Berlin, Germany; Boston, MA, USA, 2018; Volume 18, pp. 469–506. [Google Scholar]
  7. Kaim, W.; Rall, J. Copper—A“Modern” Bioelement. Angew. Chem. Int. Edit. 1996, 35, 43–60. [Google Scholar] [CrossRef]
  8. Pelosi, G. Thiosemicarbazone Metal Complexes: From Structure to Activity. Open Crystallogr. J. 2010, 3, 16–28. [Google Scholar] [CrossRef]
  9. Kostas, I.D.; Steele, B.R. Thiosemicarbazone Complexes of Transition Metals as Catalysts for Cross-Coupling Reactions. Catalysts 2020, 10, 1107. [Google Scholar] [CrossRef]
  10. Bisceglie, F.; Pinelli, S.; Alinovi, R.; Tarasconi, P.; Buschini, A.; Mussi, F.; Mutti, A.; Pelosi, G. Copper(II) Thiosemicarbazonate Molecular Modifications Modulate Apoptotic and Oxidative Effects on U937 Cell Line. J. Inorg. Biochem. 2012, 116, 195–203. [Google Scholar] [CrossRef]
  11. Bisceglie, F.; Tavone, M.; Mussi, F.; Azzoni, S.; Montalbano, S.; Franzoni, S.; Tarasconi, P.; Buschini, A.; Pelosi, G. Effects of Polar Substituents on the Biological Activity of Thiosemicarbazone Metal Complexes. J. Inorg. Biochem. 2018, 179. [Google Scholar] [CrossRef]
  12. Priyarega, S.; Haribabu, J.; Karvembu, R. Development of Thiosemicarbazone-Based Transition Metal Complexes as Homogeneous Catalysts for Various Organic Transformations. Inorg. Chim. Acta 2022, 532, 120742. [Google Scholar] [CrossRef]
  13. Egorova, A.; Jackson, M.; Gavrilyuk, V.; Makarov, V. Pipeline of Anti-Mycobacterium Abscessus Small Molecules: Repurposable Drugs and Promising Novel Chemical Entities. Med. Res. Rev. 2021, 41, 2350–2387. [Google Scholar] [CrossRef]
  14. Bisceglie, F.; Bacci, C.; Vismarra, A.; Barilli, E.; Pioli, M.; Orsoni, N.; Pelosi, G. Antibacterial Activity of Metal Complexes Based on Cinnamaldehyde Thiosemicarbazone Analogues. J. Inorg. Biochem. 2020, 203, 110888. [Google Scholar] [CrossRef]
  15. Bajaj, K.; Buchanan, R.M.; Grapperhaus, C.A. Antifungal Activity of Thiosemicarbazones, Bis(Thiosemicarbazones), and Their Metal Complexes. J. Inorg. Biochem. 2021, 225, 111620. [Google Scholar] [CrossRef]
  16. Lin, Y.; Betts, H.; Keller, S.; Cariou, K.; Gasser, G. Recent Developments of Metal-Based Compounds against Fungal Pathogens. Chem. Soc. Rev. 2021, 50, 10346–10402. [Google Scholar] [CrossRef]
  17. Zani, C.; Bisceglie, F.; Restivo, F.M.; Feretti, D.; Pioli, M.; Degola, F.; Montalbano, S.; Galati, S.; Pelosi, G.; Viola, G.V.C.; et al. A Battery of Assays as an Integrated Approach to Evaluate Fungal and Mycotoxin Inhibition Properties and Cytotoxic/Genotoxic Side-Effects for the Prioritization in the Screening of Thiosemicarbazone Derivatives. Food Chem. Toxicol. 2017, 105, 498–505. [Google Scholar] [CrossRef]
  18. Degola, F.; Bisceglie, F.; Pioli, M.; Palmano, S.; Elviri, L.; Pelosi, G.; Lodi, T.; Restivo, F.M. Structural Modification of Cuminaldehyde Thiosemicarbazone Increases Inhibition Specificity toward Aflatoxin Biosynthesis and Sclerotia Development in Aspergillus Flavus. Appl. Microbiol. Biotechnol. 2017, 101, 6683–6696. [Google Scholar] [CrossRef]
  19. Degola, F.; Morcia, C.; Bisceglie, F.; Mussi, F.; Tumino, G.; Ghizzoni, R.; Pelosi, G.; Terzi, V.; Buschini, A.; Restivo, F.M.; et al. In Vitro Evaluation of the Activity of Thiosemicarbazone Derivatives against Mycotoxigenic Fungi Affecting Cereals. Int. J. Food Microbiol. 2015, 200, 104–111. [Google Scholar] [CrossRef]
  20. Bartoli, J.; Montalbano, S.; Spadola, G.; Rogolino, D.; Pelosi, G.; Bisceglie, F.; Restivo, F.M.; Degola, F.; Serra, O.; Buschini, A.; et al. Antiaflatoxigenic Thiosemicarbazones as Crop-Protective Agents: A Cytotoxic and Genotoxic Study. J. Agric. Food Chem. 2019, 67, 10947–10953. [Google Scholar] [CrossRef]
  21. Dallabona, C.; Pioli, M.; Spadola, G.; Orsoni, N.; Bisceglie, F.; Lodi, T.; Pelosi, G.; Restivo, F.M.; Degola, F. Sabotage at the Powerhouse? Unraveling the Molecular Target of 2-Isopropylbenzaldehyde Thiosemicarbazone, a Specific Inhibitor of Aflatoxin Biosynthesis and Sclerotia Development in Aspergillus Flavus, Using Yeast as a Model System. Molecules 2019, 24, 2971. [Google Scholar] [CrossRef] [Green Version]
  22. Rogolino, D.; Gatti, A.; Carcelli, M.; Pelosi, G.; Bisceglie, F.; Restivo, F.M.; Degola, F.; Buschini, A.; Montalbano, S.; Feretti, D.; et al. Thiosemicarbazone Scaffold for the Design of Antifungal and Antiaflatoxigenic Agents: Evaluation of Ligands and Related Copper Complexes. Sci. Rep. 2017, 7, 11214. [Google Scholar] [CrossRef]
  23. Gupta, O.; Pradhan, T.; Bhatia, R.; Monga, V. Recent Advancements in Anti-Leishmanial Research: Synthetic Strategies and Structural Activity Relationships. Eur. J. Med. Chem. 2021, 223, 113606. [Google Scholar] [CrossRef]
  24. Moharana, A.K.; Dash, R.N.; Subudhi, B.B. Thiosemicarbazides: Updates on Antivirals Strategy. Mini-Rev. Med. Chem. 2021, 20, 2135–2152. [Google Scholar] [CrossRef]
  25. Pelosi, G.; Bisceglie, F.; Bignami, F.; Ronzi, P.; Schiavone, P.; Re, M.C.; Casoli, C.; Pilotti, E. Antiretroviral Activity of Thiosemicarbazone Metal Complexes. J. Med. Chem. 2010, 53, 8765–8769. [Google Scholar] [CrossRef]
  26. Shakya, B.; Yadav, P.N. Thiosemicarbazones as Potent Anticancer Agents and Their Modes of Action. Mini-Rev. Med. Chem. 2020, 20, 638–661. [Google Scholar] [CrossRef]
  27. Singh, N.K.; Kumbhar, A.A.; Pokharel, Y.R.; Yadav, P.N. Anticancer Potency of Copper(II) Complexes of Thiosemicarbazones. J. Inorg. Biochem. 2020, 210, 111134. [Google Scholar] [CrossRef]
  28. Chekmarev, J.; Azad, M.G.; Richardson, D.R. The Oncogenic Signaling Disruptor, NDRG1: Molecular and Cellular Mechanisms of Activity. Cells 2021, 10, 2382. [Google Scholar] [CrossRef]
  29. Babak, M.V.; Ahn, D. Modulation of Intracellular Copper Levels as the Mechanism of Action of Anticancer Copper Complexes: Clinical Relevance. Biomedicines 2021, 9, 852. [Google Scholar] [CrossRef]
  30. Wijesinghe, T.P.; Dharmasivam, M.; Dai, C.C.; Richardson, D.R. Innovative Therapies for Neuroblastoma: The Surprisingly Potent Role of Iron Chelation in up-Regulating Metastasis and Tumor Suppressors and down-Regulating the Key Oncogene, N-Myc. Pharmacol. Res. 2021, 173, 105889. [Google Scholar] [CrossRef]
  31. Bisceglie, F.; Orsoni, N.; Pioli, M.; Bonati, B.; Tarasconi, P.; Rivetti, C.; Amidani, D.; Montalbano, S.; Buschini, A.; Pelosi, G. Cytotoxic Activity of Copper(Ii), Nickel(Ii) and Platinum(Ii) Thiosemicarbazone Derivatives: Interaction with DNA and the H2A Histone Peptide. Metallomics 2019, 11, 1729–1742. [Google Scholar] [CrossRef]
  32. Baruffini, E.; Ruotolo, R.; Bisceglie, F.; Montalbano, S.; Ottonello, S.; Pelosi, G.; Buschini, A.; Lodi, T. Mechanistic Insights on the Mode of Action of an Antiproliferative Thiosemicarbazone-Nickel Complex Revealed by an Integrated Chemogenomic Profiling Study. Sci. Rep. 2020, 10, 10524. [Google Scholar] [CrossRef] [PubMed]
  33. Baldini, M.; Belicchi-Ferrari, M.; Bisceglie, F.; Capacchi, S.; Pelosi, G.; Tarasconi, P. Zinc Complexes with Cyclic Derivatives of α-Ketoglutaric Acid Thiosemicarbazone: Synthesis, X-ray Structures and DNA Interactions. J. Inorg. Biochem. 2005, 99, 1504–1513. [Google Scholar] [CrossRef] [PubMed]
  34. Wolfe, A.; Shimer, G.H.; Meehan, T. Polycyclic Aromatic Hydrocarbons Physically Intercalate into Duplex Regions of Denatured DNA. Biochemistry 1987, 26, 6392–6396. [Google Scholar] [CrossRef] [PubMed]
  35. Kalaivani, P.; Prabhakaran, R.; Poornima, P.; Huang, R.; Hornebecq, V.; Dallemer, F.; Vijaya Padma, V.; Natarajan, K. Synthesis and Structural Characterization of New Ruthenium(Ii) Complexes and Investigation of Their Antiproliferative and Metastatic Effect against Human Lung Cancer (A549) Cells. RSC Adv. 2013, 3, 20363. [Google Scholar] [CrossRef]
  36. Hernández, W.; Paz, J.; Carrasco, F.; Vaisberg, A.; Spodine, E.; Manzur, J.; Hennig, L.; Sieler, J.; Blaurock, S.; Beyer, L. Synthesis and Characterization of New Palladium(II) Thiosemicarbazone Complexes and Their Cytotoxic Activity against Various Human Tumor Cell Lines. Bioinorg. Chem. Appl. 2013, 2013, 524701. [Google Scholar] [CrossRef] [Green Version]
  37. Prabhakaran, R.; Kalaivani, P.; Huang, R.; Poornima, P.; Vijaya Padma, V.; Dallemer, F.; Natarajan, K. DNA Binding, Antioxidant, Cytotoxicity (MTT, Lactate Dehydrogenase, NO), and Cellular Uptake Studies of Structurally Different Nickel(II) Thiosemicarbazone Complexes: Synthesis, Spectroscopy, Electrochemistry, and X-ray Crystallography. J. Biol. Inorg. Chem. 2013, 18, 233–247. [Google Scholar] [CrossRef]
  38. Saswati, S.; Chakraborty, A.; Dash, S.P.; Panda, A.K.; Acharyya, R.; Biswas, A.; Mukhopadhyay, S.; Bhutia, S.K.; Crochet, A.; Patil, Y.P.; et al. Synthesis, X-ray Structure and in Vitro Cytotoxicity Studies of Cu(I/II) Complexes of Thiosemicarbazone: Special Emphasis on Their Interactions with DNA. Dalton Trans. 2015, 44, 6140–6157. [Google Scholar] [CrossRef] [Green Version]
  39. Qi, J.; Gou, Y.; Zhang, Y.; Yang, K.; Chen, S.; Liu, L.; Wu, X.; Wang, T.; Zhang, W.; Yang, F. Developing Anticancer Ferric Prodrugs Based on the N-Donor Residues of Human Serum Albumin Carrier IIA Subdomain. J. Med. Chem. 2016, 59, 7497–7511. [Google Scholar] [CrossRef]
  40. Subhashree, G.R.; Haribabu, J.; Saranya, S.; Yuvaraj, P.; Anantha Krishnan, D.; Karvembu, R.; Gayathri, D. In Vitro Antioxidant, Antiinflammatory and in Silico Molecular Docking Studies of Thiosemicarbazones. J. Mol. Struct. 2017, 1145, 160–169. [Google Scholar] [CrossRef]
  41. Bai, Y.-L.; Zhang, Y.-W.; Xiao, J.-Y.; Guo, H.-W.; Liao, X.-W.; Li, W.-J.; Zhang, Y.-C. Oxovanadium Phenanthroimidazole Derivatives: Synthesis, DNA Binding and Antitumor Activities. Trans. Met. Chem. 2018, 43, 171–183. [Google Scholar] [CrossRef]
  42. Rajendran, N.; Periyasamy, A.; Kamatchi, N.; Solomon, V. Biological Evaluation of Copper(II) Complexes on N (4)−substituted Thiosemicarbazide Derivatives and Diimine Co-Ligands Using DNA Interaction, Antibacterial and in Vitro Cytotoxicity. J. Coord. Chem. 2019, 72, 1937–1956. [Google Scholar] [CrossRef]
  43. Lewis, N.A.; Liu, F.; Seymour, L.; Magnusen, A.; Erves, T.R.; Arca, J.F.; Beckford, F.A.; Venkatraman, R.; González-Sarrías, A.; Fronczek, F.R.; et al. Synthesis, Characterisation, and Preliminary In Vitro Studies of Vanadium(IV) Complexes with a Schiff Base and Thiosemicarbazones as Mixed Ligands. Eur. J. Inorg. Chem. 2012, 2012, 664–677. [Google Scholar] [CrossRef] [Green Version]
  44. Khan, A.; Paul, K.; Singh, I.; Jasinski, J.P.; Smolenski, V.A.; Hotchkiss, E.P.; Kelley, P.T.; Shalit, Z.A.; Kaur, M.; Banerjee, S.; et al. Copper(I) and Silver(I) Complexes of Anthraldehyde Thiosemicarbazone: Synthesis, Structure Elucidation, in Vitro Anti-Tuberculosis/Cytotoxic Activity and Interactions with DNA/HSA. Dalton Trans. 2020, 49, 17350–17367. [Google Scholar] [CrossRef]
  45. Beckford, F.A.; Leblanc, G.; Thessing, J.; Shaloski, M.; Frost, B.J.; Li, L.; Seeram, N.P. Organometallic Ruthenium Complexes with Thiosemicarbazone Ligands: Synthesis, Structure and Cytotoxicity of [(H6-p-Cymene)Ru(NS)Cl]+ (NS = 9-Anthraldehyde Thiosemicarbazones). Inorg. Chem. Comm. 2009, 12, 1094–1098. [Google Scholar] [CrossRef] [Green Version]
  46. Beckford, F.A. Reaction of the Anticancer Organometallic Ruthenium Compound, [(η6-p-Cymene)Ru(ATSC)Cl]PF6 with Human Serum Albumin. Int. J. Inorg. Chem. 2010, 2010, 975756. [Google Scholar] [CrossRef] [Green Version]
  47. Beckford, F.A.; Brock, A.; Gonzalez-Sarrías, A.; Seeram, N.P. Cytotoxic Gallium Complexes Containing Thiosemicarbazones Derived from 9-Anthraldehyde: Molecular Docking with Biomolecules. J. Mol. Struct. 2016, 1121, 156–166. [Google Scholar] [CrossRef] [Green Version]
  48. Beckford, F.A.; Shaloski, M., Jr.; Leblanc, G.; Thessing, J.; Lewis-Alleyne, L.C.; Holder, A.A.; Li, L.; Seeram, N.P. Microwave Synthesis of Mixed Ligand Diimine–Thiosemicarbazone Complexes of Ruthenium(Ii): Biophysical Reactivity and Cytotoxicity. Dalton Trans. 2009, 48, 10757. [Google Scholar] [CrossRef] [Green Version]
  49. Beebe, S.J.; Celestine, M.J.; Bullock, J.L.; Sandhaus, S.; Arca, J.F.; Cropek, D.M.; Ludvig, T.A.; Foster, S.R.; Clark, J.S.; Beckford, F.A.; et al. Synthesis, Characterization, DNA Binding, Topoisomerase Inhibition, and Apoptosis Induction Studies of a Novel Cobalt(III) Complex with a Thiosemicarbazone Ligand. J. Inorg. Biochem. 2020, 203, 110907. [Google Scholar] [CrossRef]
  50. Bruker SAINT; Bruker AXS Inc.: Madison, WI, USA, 2012.
  51. Sheldrick, G.M. SADABS—Bruker Nonius Area Detector Scaling and Aabsorption Correction—V2016/2; Bruker AXS Inc.: Madison, WI, USA, 2016. [Google Scholar]
  52. Sheldrick, G.M. SHELXT—Integrated Space-Group and Crystal-Structure Determination. Acta Crystallogr. A 2015, 71, 3–8. [Google Scholar] [CrossRef] [Green Version]
  53. Sheldrick, G.M. SHELXL-97—Programs for Crystal Structure Analysis (Release 97-2); Institut fur Anorganishe Chemie der Universitat: Goettingen, Germany, 1998. [Google Scholar]
  54. Dolomanov, O.V.; Bourhis, L.J.; Gildea RJ, J.; Howard, A.K.; Puschmann, H. OLEX2: A complete structure solution, refinement and analysis program. J. Appl. Cryst. 2009, 42, 339–341. [Google Scholar] [CrossRef]
  55. Johnson, C.K.; Burnett, M.N. ORTEPIII. Report ORNL-6895; Oak Ridge National Laboratory: Oak Ridges, TN, USA, 1996.
  56. Macrae, C.F.; Sovago, I.; Cottrell, S.J.; Galek, P.T.A.; McCabe, P.; Pidcock, E.; Platings, M.G.; Shields, P.; Stevens, J.S.; Towler, M.; et al. Mercury 4.0: From visualization to analysis, design and prediction. J. Appl. Cryst. 2020, 53, 226–235. [Google Scholar] [CrossRef] [Green Version]
  57. Reichmann, M.E.; Rice, S.A.; Thomas, C.A.; Doty, P. A Further Examination of the Molecular Weight and Size of Desoxypentose Nucleic Acid. J. Am. Chem. Soc. 1954, 76, 3047–3053. [Google Scholar] [CrossRef]
  58. Kalsbeck, W.A.; Thorp, H.H. Determining Binding Constants of Metal Complexes to DNA by Quenching of the Emission of Pt2(pop)44− (pop= P2O5H22−). J. Am. Chem. Soc. 1993, 115, 7146–7151. [Google Scholar] [CrossRef]
  59. Baldini, M.; Belicchi-Ferrari, M.; Bisceglie, F.; Pelosi, G.; Pinelli, S.; Tarasconi, P. Cu(II) Complexes with Heterocyclic Substituted Thiosemicarbazones: The Case of 5-Formyluracil. Synthesis, Characterization, X-ray Structures, DNA Interaction Studies, and Biological Activity. Inorg. Chem. 2003, 42, 2049–2055. [Google Scholar] [CrossRef]
  60. Liu, J.; Zhang, T.; Lu, T.; Qu, L.; Zhou, H.; Zhang, Q.; Ji, L. DNA-Binding and Cleavage Studies of Macrocyclic Copper(II) Complexes. J. Inorg. Biohem. 2002, 91, 269–276. [Google Scholar] [CrossRef]
  61. Mudasir; Yoshioka, N.; Inoue, H. DNA Binding of Iron(II) Mixed-Ligand Complexes Containing 1,10-Phenanthroline and 4,7-Diphenyl-1,10-Phenanthroline. J. Inorg. Biohem. 1999, 77, 239–247. [Google Scholar] [CrossRef]
  62. Beckford, F.; Dourth, D.; Shaloski, M.; Didion, J.; Thessing, J.; Woods, J.; Crowell, V.; Gerasimchuk, N.; Gonzalez-Sarrías, A.; Seeram, N.P. Half-Sandwich Ruthenium–Arene Complexes with Thiosemicarbazones: Synthesis and Biological Evaluation of [(H6-p-Cymene)Ru(Piperonal Thiosemicarbazones)Cl]Cl Complexes. J. Inorg. Biohem. 2011, 105, 1019–1029. [Google Scholar] [CrossRef] [Green Version]
  63. Hassan, A.A.; Shawky, A.M.; Shehatta, H.S. Chemistry and Heterocyclization of Thiosemicarbazones. J. Heterocycl. Chem. 2012, 49, 21–37. [Google Scholar] [CrossRef]
  64. Shaban, M.A.E.; Mostafa, M.A.; Nasr, A.Z. Oxidative Cyclization of D-Fructose Thiosemicarbazones to 2-Amino-5- (d-Arabino-1,2,3,4-Tetrahydroxybut-1-Yl)-1,3,4-Thiadiazoles through Carboncarbon Bond Cleavage of the Sugar Chain. Pharmazie 2003, 58, 367–371. [Google Scholar]
  65. Buscemi, S.; Gruttadauria, M. Photocyclization Reaction of Some 2-Methyl-4-Phenyl- Substituted Aldehyde Thiosemicarbazones. Mechanistic Aspects. Tetrahedron 2000, 56, 999–1004. [Google Scholar] [CrossRef]
  66. Meo, P.L.; Gruttadauria, M.; Noto, R. Oxidative Cyclization of Aldehyde Thiosemicarbazones Induced by Potassium Ferricyanide and by Tris(p-Bromophenyl)Amino Hexachloroantimoniate. A Joint Experimental and Computational Study. Arkivoc 2005, 2005, 114–129. [Google Scholar] [CrossRef] [Green Version]
  67. Noto, R.; Buccheri, F.; Cusmano, G.; Gruttadauria, M.; Werber, G. Substituent Effect on Oxidative Cyclization of Aldehyde Thiosemicarbazones with Ferric Chloride. J. Heterocycl. Chem. 1991, 28, 1421–1427. [Google Scholar] [CrossRef]
  68. Ivanov, V.I.; Minchenkova, L.E.; Schyolkina, A.K.; Poletayev, A.I. Different Conformations of Double-Stranded Nucleic Acid in Solution as Revealed by Circular Dichroism. Biopolymers 1973, 12, 89–110. [Google Scholar] [CrossRef] [PubMed]
  69. Nordén, B.; Tjerneld, F. Structure of Methylene Blue-DNA Complexes Studied by Linear and Circular Dichroism Spectroscopy. Biopolymers 1982, 21, 1713–1734. [Google Scholar] [CrossRef]
  70. Lepecq, J.-B.; Paoletti, C. A Fluorescent Complex between Ethidium Bromide and Nucleic Acids. J. Mol. Biol. 1967, 27, 87–106. [Google Scholar] [CrossRef]
  71. Song, Y.; Zhong, D.; Luo, J.; Tan, H.; Chen, S.; Li, P.; Wang, L.; Wang, T. Binding Characteristics and Interactive Region of 2-Phenylpyrazolo[1,5-c]Quinazoline with DNA. Luminescence 2014, 29, 1141–1147. [Google Scholar] [CrossRef]
  72. Sahoo, D.K.; Jena, S.; Dutta, J.; Chakrabarty, S.; Biswal, H.S. Critical Assessment of the Interaction between DNA and Choline Amino Acid Ionic Liquids: Evidences of Multimodal Binding and Stability Enhancement. ACS Cent. Sci. 2018, 4, 1642–1651. [Google Scholar] [CrossRef]
  73. Byler, D.M.; Susi, H. Examination of the Secondary Structure of Proteins by Deconvolved FTIR Spectra. Biopolymers 1986, 25, 469–487. [Google Scholar] [CrossRef]
  74. Minafra, L.; di Cara, G.; Albanese, N.N.; Cancemi, P. Proteomic Differentiation Pattern in the U937 Cell Line. Leukemia Res. 2011, 35, 226–236. [Google Scholar] [CrossRef]
  75. Akiyama, M.; Horiguchi-Yamada, J.; Saito, S.; Hoshi, Y.; Yamada, O.; Mizoguchi, H.; Yamada, H. Cytostatic Concentrations of Anticancer Agents Do Not Affect Telomerase Activity of Leukaemic Cells in Vitro. Eur. J. Cancer 1999, 35, 309–315. [Google Scholar] [CrossRef]
Scheme 1. Representation of the syntheses of ligands L1 and L2.
Compounds 02 00011 sch001
Figure 1. X-ray structure of L1 with ellipsoid probability at 50%.
Compounds 02 00011 g001
Figure 2. X-ray structure of L2 with ellipsoid probability at 50%.
Compounds 02 00011 g002
Figure 3. X-ray structure of L3 with ellipsoid probability at 50%.
Compounds 02 00011 g003
Scheme 2. Representation of the syntheses of ligands L3 and L4.
Compounds 02 00011 sch002
Figure 4. X-ray structure of L4 with ellipsoid probability at 50%.
Compounds 02 00011 g004
Figure 5. X-ray structure of [CuI(L1)2](HSO4) (1) with ellipsoid probability at 50%.
Compounds 02 00011 g005
Figure 6. X-ray structure of L5 with ellipsoid probability at 50%.
Compounds 02 00011 g006
Figure 7. X-ray structure of [CuI2(SO4)(L2)5] (2) with ellipsoid probability at 50%.
Compounds 02 00011 g007
Figure 8. Circular dichroism titration of CT-DNA with L1 (left) and [CuI(L1)2](HSO4) (1) (right) at different r values (r = [compound]/[DNA]).
Compounds 02 00011 g008
Figure 9. UV–vis spectra of CT-DNA treated with L1 at different [DNA]/[ligand] ratios.
Compounds 02 00011 g009
Figure 10. UV–vis spectra of CT-DNA treated with [CuI(L1)2](HSO4) (1) at different [DNA]/[complex] ratios.
Compounds 02 00011 g010
Figure 11. IR spectra of BSA alone (lower spectrum) and after incubation with L1 (left) and [CuI(L1)2](HSO4) (1) (right) (higher spectrum).
Compounds 02 00011 g011
Publisher’s Note: MDPI stays neutral with regard to jurisdictional claims in published maps and institutional affiliations.

