Article

Gas Transport in Mixed Matrix Membranes: Two Methods for Time Lag Determination

by
Alessio Fuoco
1,*,
Marcello Monteleone
1,
Elisa Esposito
1,
Rosaria Bruno
2,
Jesús Ferrando-Soria
3,
Emilio Pardo
3,
Donatella Armentano
2 and
Johannes Carolus Jansen
1,*
1
Institute on Membrane Technology, CNR-ITM, Via P. Bucci 17/C, 87036 Rende (CS), Italy
2
Dipartimento di Chimica e Tecnologie Chimiche (CTC), Università della Calabria, 87036 Rende, Cosenza, Italy
3
Departamento de Química Inorgánica, Instituto de Ciencia Molecular (ICMol), Catedrático José Beltrán Martínez, 2, Universidad de Valencia, 46980 Paterna, Spain
*
Authors to whom correspondence should be addressed.
Submission received: 20 March 2020 / Revised: 1 April 2020 / Accepted: 7 April 2020 / Published: 11 April 2020

Abstract

:
The most widely used method to measure the transport properties of dense polymeric membranes is the time lag method in a constant volume/pressure increase instrument. Although simple and quick, this method provides only relatively superficial, averaged data of the permeability, diffusivity, and solubility of gas or vapor species in the membrane. The present manuscript discusses a more sophisticated computational method to determine the transport properties on the basis of a fit of the entire permeation curve, including the transient period. The traditional tangent method and the fitting procedure were compared for the transport of six light gases (H2, He, O2, N2, CH4, and CO2) and ethane and ethylene in mixed matrix membranes (MMM) based on Pebax®1657 and the metal–organic framework (MOF) CuII2(S,S)-hismox·5H2O. Deviations of the experimental data from the theoretical curve could be attributed to the particular MOF structure, with cavities of different sizes. The fitting procedure revealed two different effective diffusion coefficients for the same gas in the case of methane and ethylene, due to the unusual void morphology in the MOFs. The method was furthermore applied to mixed gas permeation in an innovative constant-pressure/variable-volume setup with continuous analysis of the permeate composition by an on-line mass-spectrometric residual gas analyzer. This method can provide the diffusion coefficient of individual gas species in a mixture, during mixed gas permeation experiments. Such information was previously inaccessible, and it will greatly enhance insight into the mixed gas transport in polymeric or mixed matrix membranes.

1. Introduction

Membranes-based separation processes are used in several industrial applications and are emerging in many more [1,2]. They are promising techniques for the treatment of large volumes of gaseous streams required for the CO2 capture from flue gas and bio/natural gas upgrading [3,4]. However, their exploitation is hindered by the trade-off between permeability and selectivity which does not allow the fabrication of membranes with very high productivity and high purity of the final products [1,5,6,7]. To overcome this limit, the concept of mixed matrix membranes (MMMs) has been introduced, where the transport properties of highly engineered microporous materials (e.g., metal–organic frameworks—MOFs) is exploited as a filler in processable and stable polymers [8]. In the last years, several MMM preparation protocols have been reported, from the dispersion of the fillers in the polymer matrix [9,10,11] to their in situ growth on the membrane surface [12,13]. In general, the gas transport properties of the MMMs are measured with the same techniques used for dense membranes, and several models can be used to describe the influence of the filler, such as the Maxwell model, the Higuchi model, the Landauer model, and the effective medium theory [14]. Previous studies have reported that they give similar results [15,16]; the one most commonly used is the Maxwell model due to its simplicity [17,18]. The Maxwell model estimates the effective permeability of a mixed matrix membrane, PMMM, as a function of the gas permeability in both the continuous polymer matrix, Pc, and the dispersed filler, Pd [19]:
P M M M = P c | P d + 2 P c 2 Φ d ( P c P d ) P d + 2 P c + Φ d ( P c P d ) |
where Φ d is the volume fraction occupied by the filler. Thus, the Maxwell model predicts an increase of the permeability if Pd > Pc and a decrease if Pd < Pc. The minimum and maximum limits are given by Pd = 0 and Pd ≈ ∞, which correspond to impermeable fillers and empty voids, respectively.
Transport of gases in dense membranes is described by the so-called solution-diffusion model [20,21]. One of the most commonly used techniques for the determination of the permeability of dense membranes is the so-called time lag method [20,21,22], in which a membrane is fixed in a permeation cell with two separate compartments (feed and permeate). After complete evacuation of the membrane for a sufficiently long time, it is suddenly exposed to the gas of interest, from the feed side of the membrane cell, after which the pressure is recorded in the permeate side with constant volume. A typical curve can be divided into three distinct regions (Figure 1): in the penetration region, the gas is absorbed at the feed side of the membrane and it starts diffusing across the thickness of the film, but it does not reach the permeate side; in the transient region, the first gas molecules start desorbing from the membrane at the permeate side, and the rate gradually increases until it becomes constant. These two phases are related to the diffusion coefficient, D. Finally, in the stationary state, which is used to determine the permeability coefficient, P, a constant flux across the membrane takes place. If Fickian diffusion takes place, and the solubility of the gas and its diffusion coefficient in the polymer are both constant, then the diffusion coefficient can be determined from the membrane thickness, l, and the time lag, Θ, which is the intersection of the tangent to the steady-state permeation curve and the horizontal axis (Figure 1), allowing the determination of the diffusion coefficient as follows:
D = l 2 6 Θ
Knowing P and D, the solubility coefficient, S, can be calculated as:
S = P D
Different methods have been developed for the determination of the permeability of membranes. The most common method for single gases is the analysis of the pressure increase in a previously evacuated closed permeate chamber after exposure of the membrane to the gas [20,21,22], as described above. Alternatively, the permeate side can also be a different gas instead of a vacuum, as in the original method of Daynes, proposed a century ago [23]. The most important method for gas mixtures is the measurement of the permeate gas flow rate in a system with a cross-flow membrane cell, either directly via a flow meter, or indirectly via the concentration of the gas in a carrier stream, for instance by gas chromatography. In the simplest cases of Fickian diffusion and a constant gas solubility, analytical solutions exist for the description of the permeate pressure or the permeate concentration as a function of time, from the very first exposure of the membrane to the gas until the steady-state permeation. Analysis of the entire curve, including the transient behavior, allows the determination not only of the permeability, but also of the diffusion coefficient and the solubility. This method is much more powerful than the tangent method for analysis of P and D, and any deviation of the points from the fitted model curve based on Fickian diffusion unambiguously indicates non-ideal behavior [24,25,26,27]. For instance, Follain et al. demonstrate how the permeation curve changes in the case of a concentration-dependent diffusion coefficient [28], while Favre et al. calculated the expected effect of an imperfect upstream pressure increase on the permeation transient [29].
Beckman et al. give a concise overview of the different methods to determine the permeability and diffusion coefficients via analysis of the integral, differential or pulse signal for transient permeation [30,31]. The use of functional scales may reveal the deviation of the permeation transient from normal Fickian behavior, for instance in the case of vapor permeation in polyvinyltrimethylsilane (PVTMS) [32]. Although the integral method, i.e., the permeate pressure is reported as a function of time, is by far the most commonly used method to determine the diffusion coefficient [23], the differential method, i.e., the permeate flow rate is reported as a function of time, first proposed by Yasuda and Rosengren [33], offers advantages in some cases. One of the advantages of the differential method is that it can be applied for the analysis of gas mixtures in a cross-flow cell configuration, provided that a suitable continuous gas analyzer is used [34].
The scope of this work is to give a brief overview of the methods for the analysis of the entire permeation curve, and then some examples of the computation of the desired transport parameters. More precisely, we aim to compare the integral method (or time lag method) and the differential method, and to demonstrate how the direct analysis of the entire permeation curve helps to identify and quantify anomalous transport phenomena, for example related to the presence of highly sorbing MOF fillers in a polymeric matrix. We will show one of the first examples of how mass-spectrometric analysis of the permeate gas composition allows the calculation of the diffusion coefficient of each of the individual gas species in a mixture during a mixed-gas permeation experiment.

2. Materials and Methods

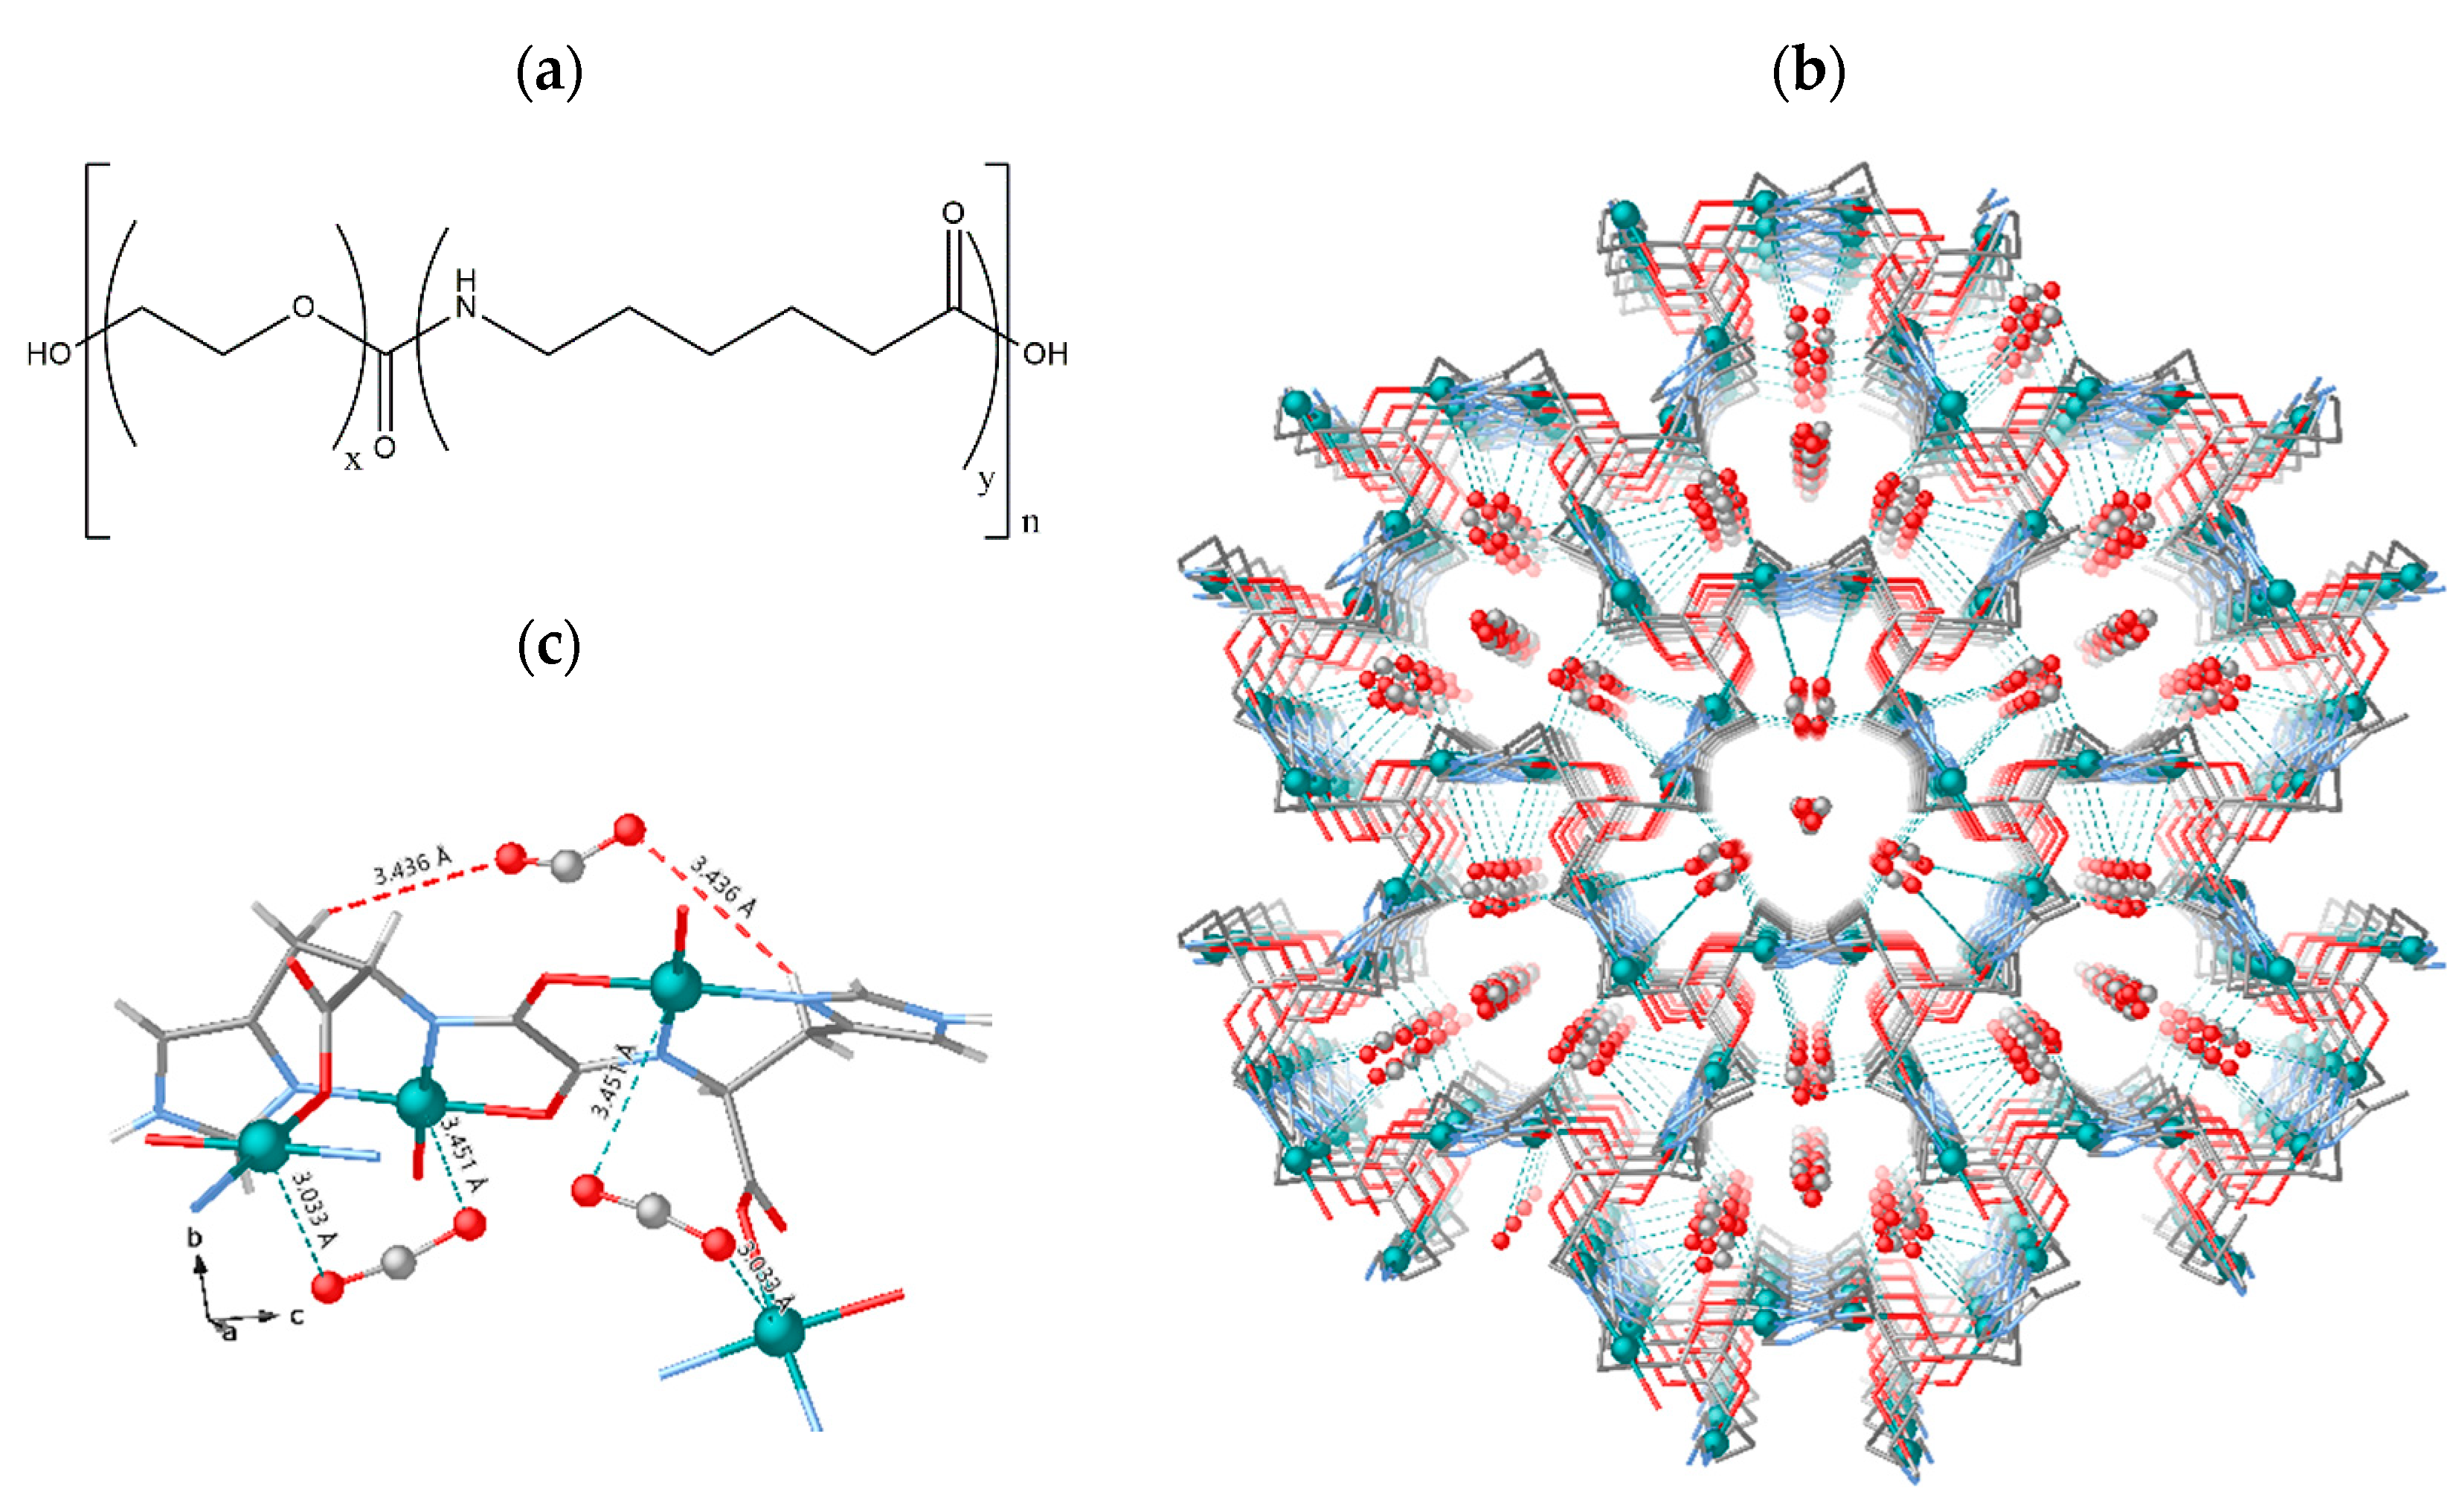
2.1. Materials and Membrane Preparation

The poly(ether-amide) multi-block copolymer Pebax®1657 was kindly supplied by Arkema (Italy). The chiral three-dimensional metal–organic framework (MOF), CuII2(S,S)-hismox·5H2O (where hismox = bis[(S)-histidine]oxalyl diamide [35]; Figure 2b) was prepared as described previously [36]. Ethanol was purchased from VWR and used without further purification. All the light gases for the permeation tests (He, H2, CO2, CH4, N2, and O2) were supplied by Sapio (Monza, Italy) at a minimum purity of 99.9995%. C2H4 and C2H6 were supplied by Siad (Bergamo, Italy) at a minimum purity of 99.995%.
The Pebax®1657 was dissolved in a water/ethanol mixture (30/70 wt%) at a concentration of 8 wt% of polymer under reflux (approximately 80 °C). Then, the CuII2(S,S)-hismox·5H2O was added to the polymer solution with a Polymer/MOF weight ratio of 5:2, which corresponds to 22 vol% of MOF. The resulting dispersion was stirred overnight and then cast into a levelled Teflon petri-dish, and left to evaporate at room temperature and atmospheric pressure until the formation of the dense self-standing Pebax®1657/CuII2(S,S)-hismox mixed matrix membrane. The membrane was further dried at 80 °C overnight to guarantee complete evaporation of residual solvent and removal of coordinated water from the MOF. The detailed membrane preparation procedure was described previously [36].

2.2. Gas permeation Tests

Single gas permeation measurements were performed at 25 °C and at feed pressures ranging from 0.1 bar to 1 bar on a constant volume/pressure increase instrument, desigend by Helmholz Zentrum Geesthacht, and constructed by EESR (Geesthacht, Germany).
Mixed gas permeation measurements were performed on a custom-made variable volume/constant pressure instrument in a cross-flow cell with argon as the sweeping gas. The permeate composition is measured continuously by means of a mass-spectrometric residual gas analyzer (HPR-20 QIC Benchtop residual gas analysis system, Hiden Analytical). Measurements were performed at high feed flow rates and relatively high sweep flow rates at a low stage cut, near 1% or lower, and a negligible partial pressure in the permeate, in order to avoid polarization phenomena.
Details of both methods, the instrument specifications, and the calibrations were described previously [34,37].

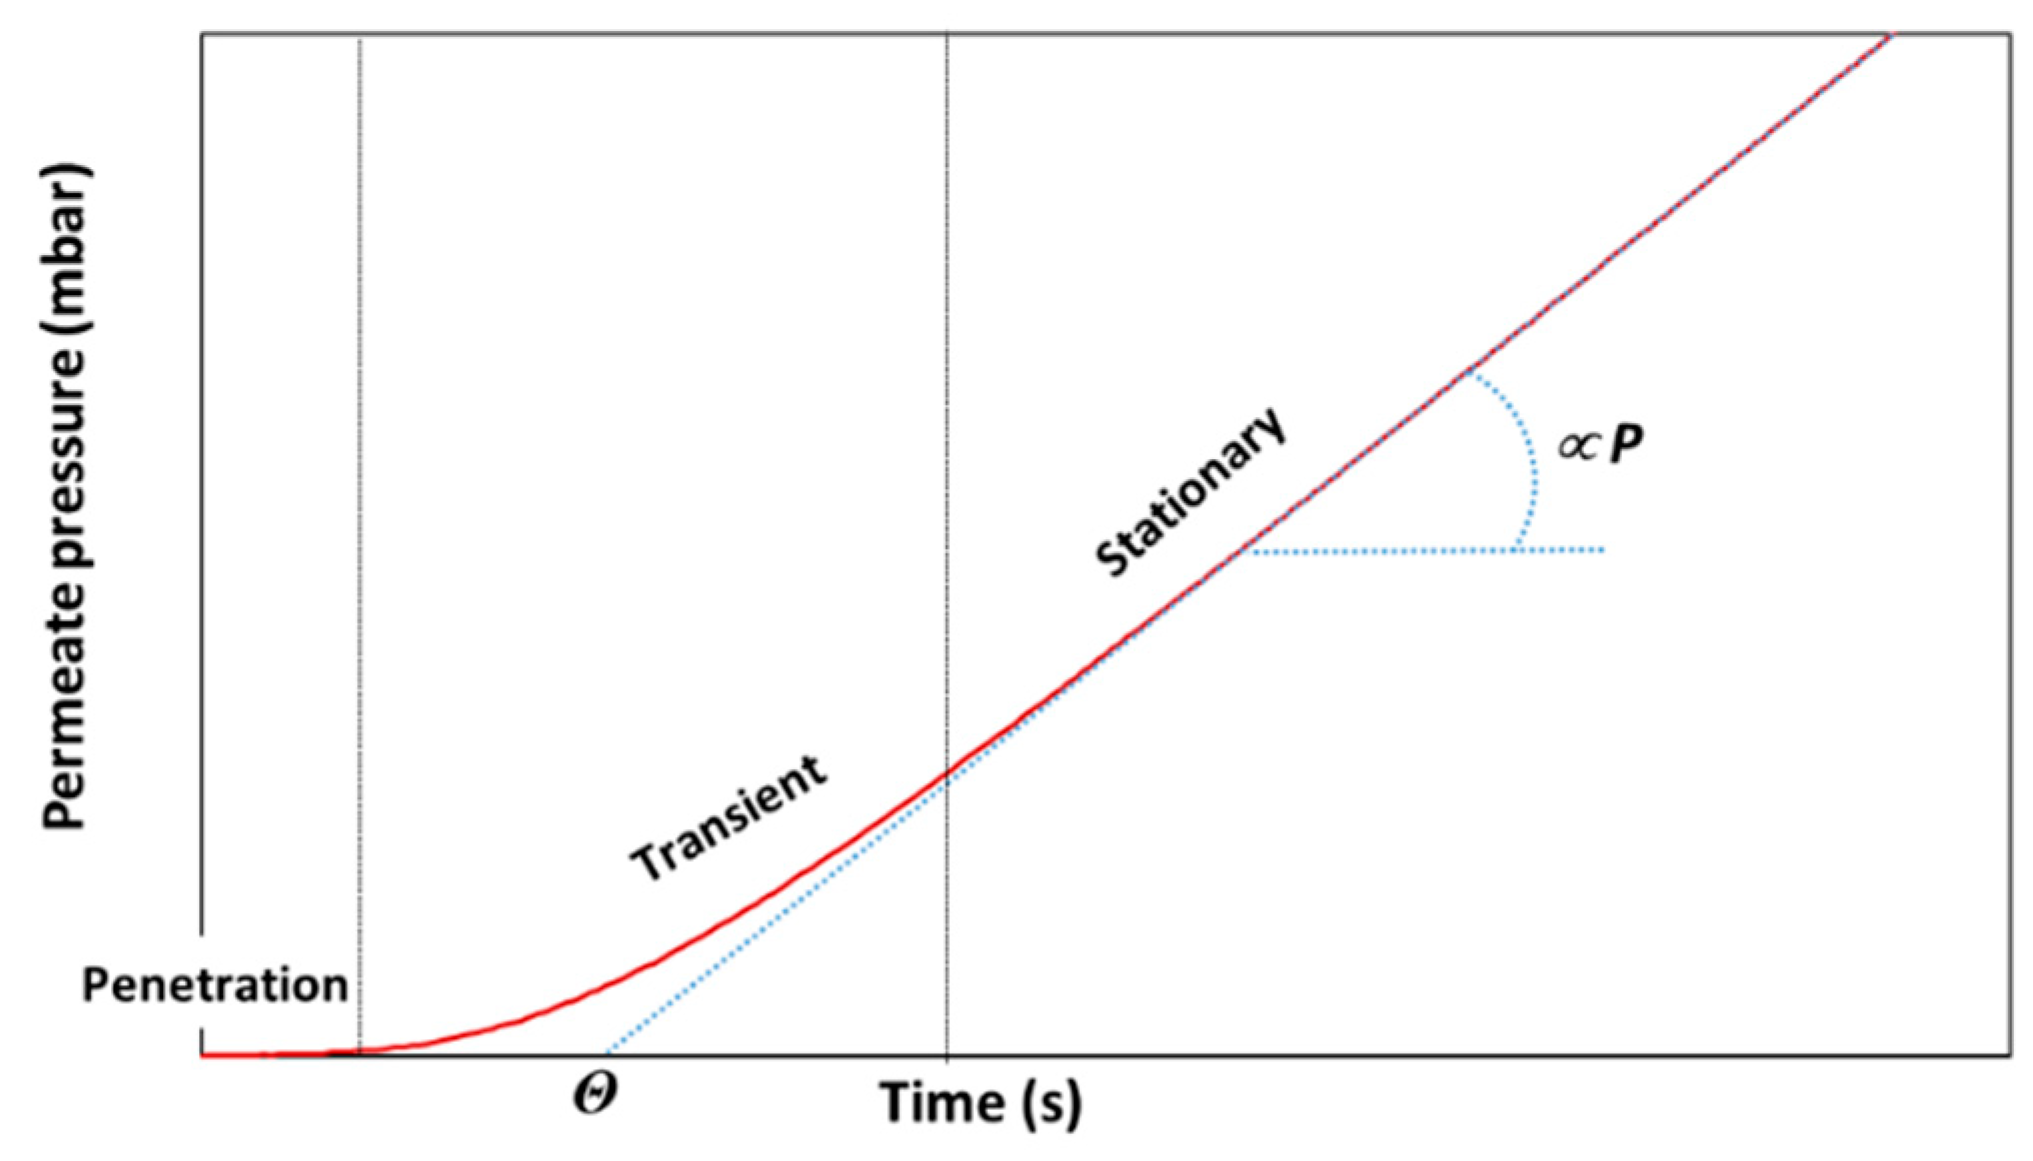
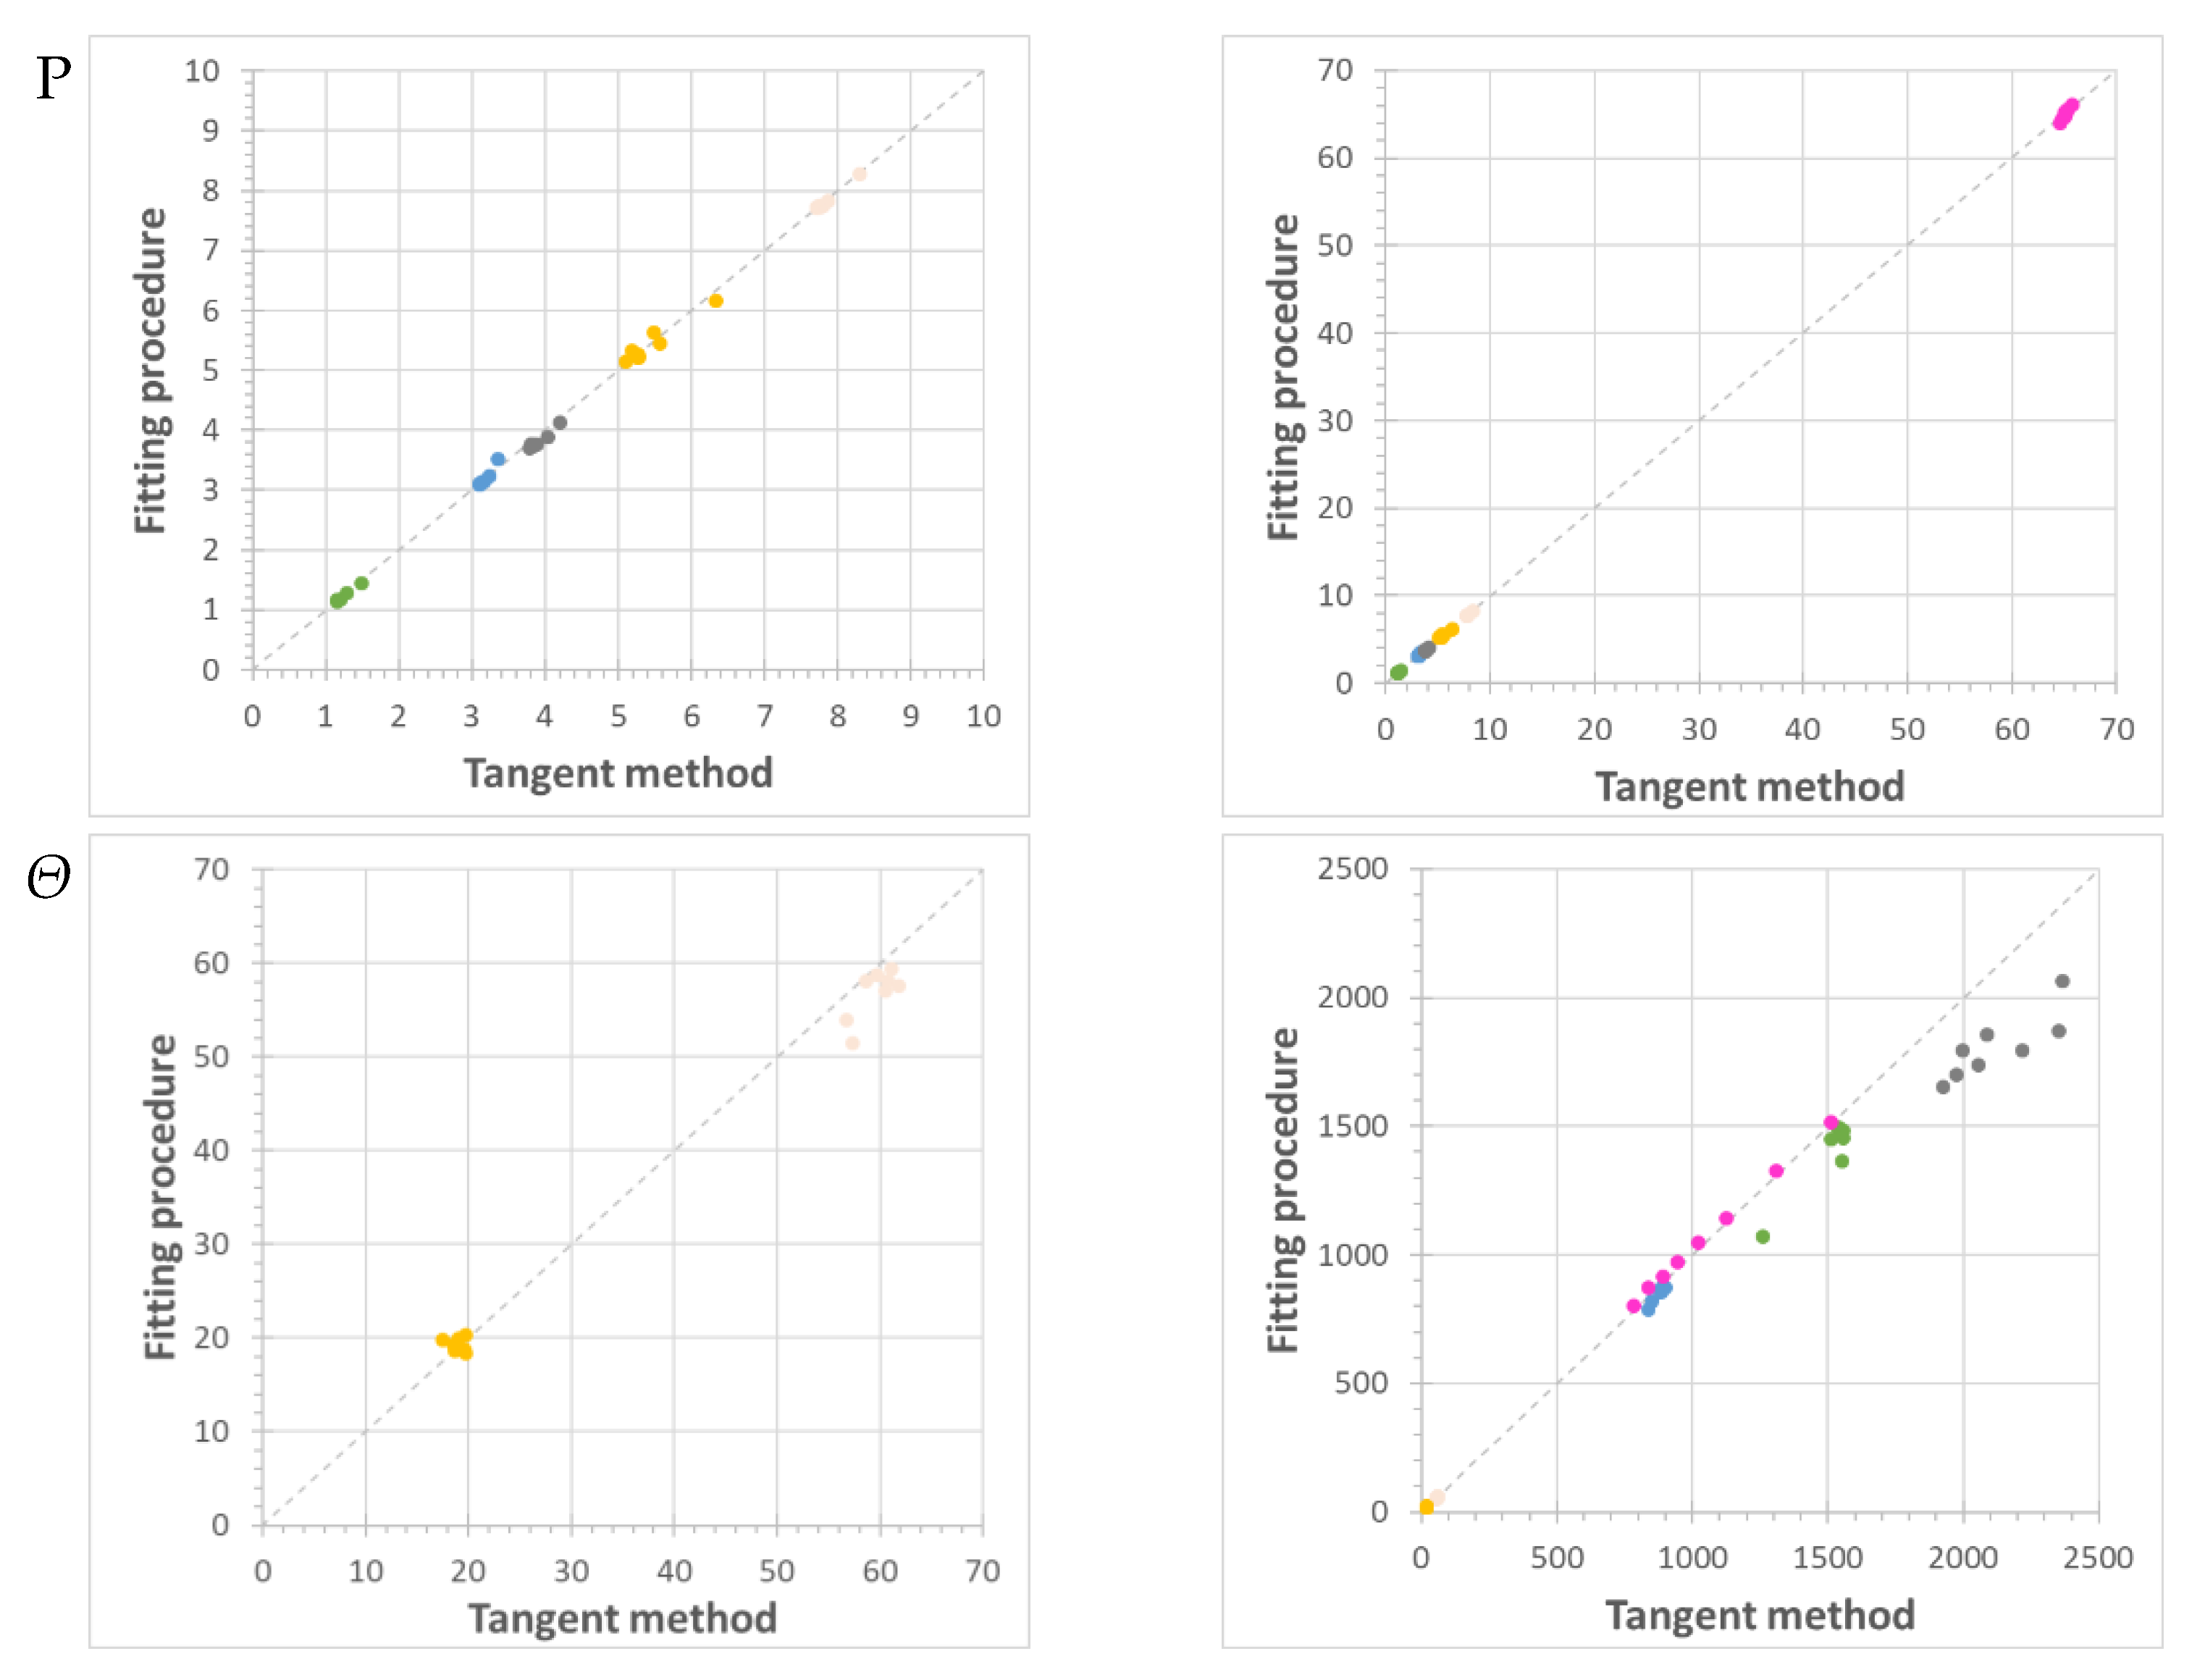
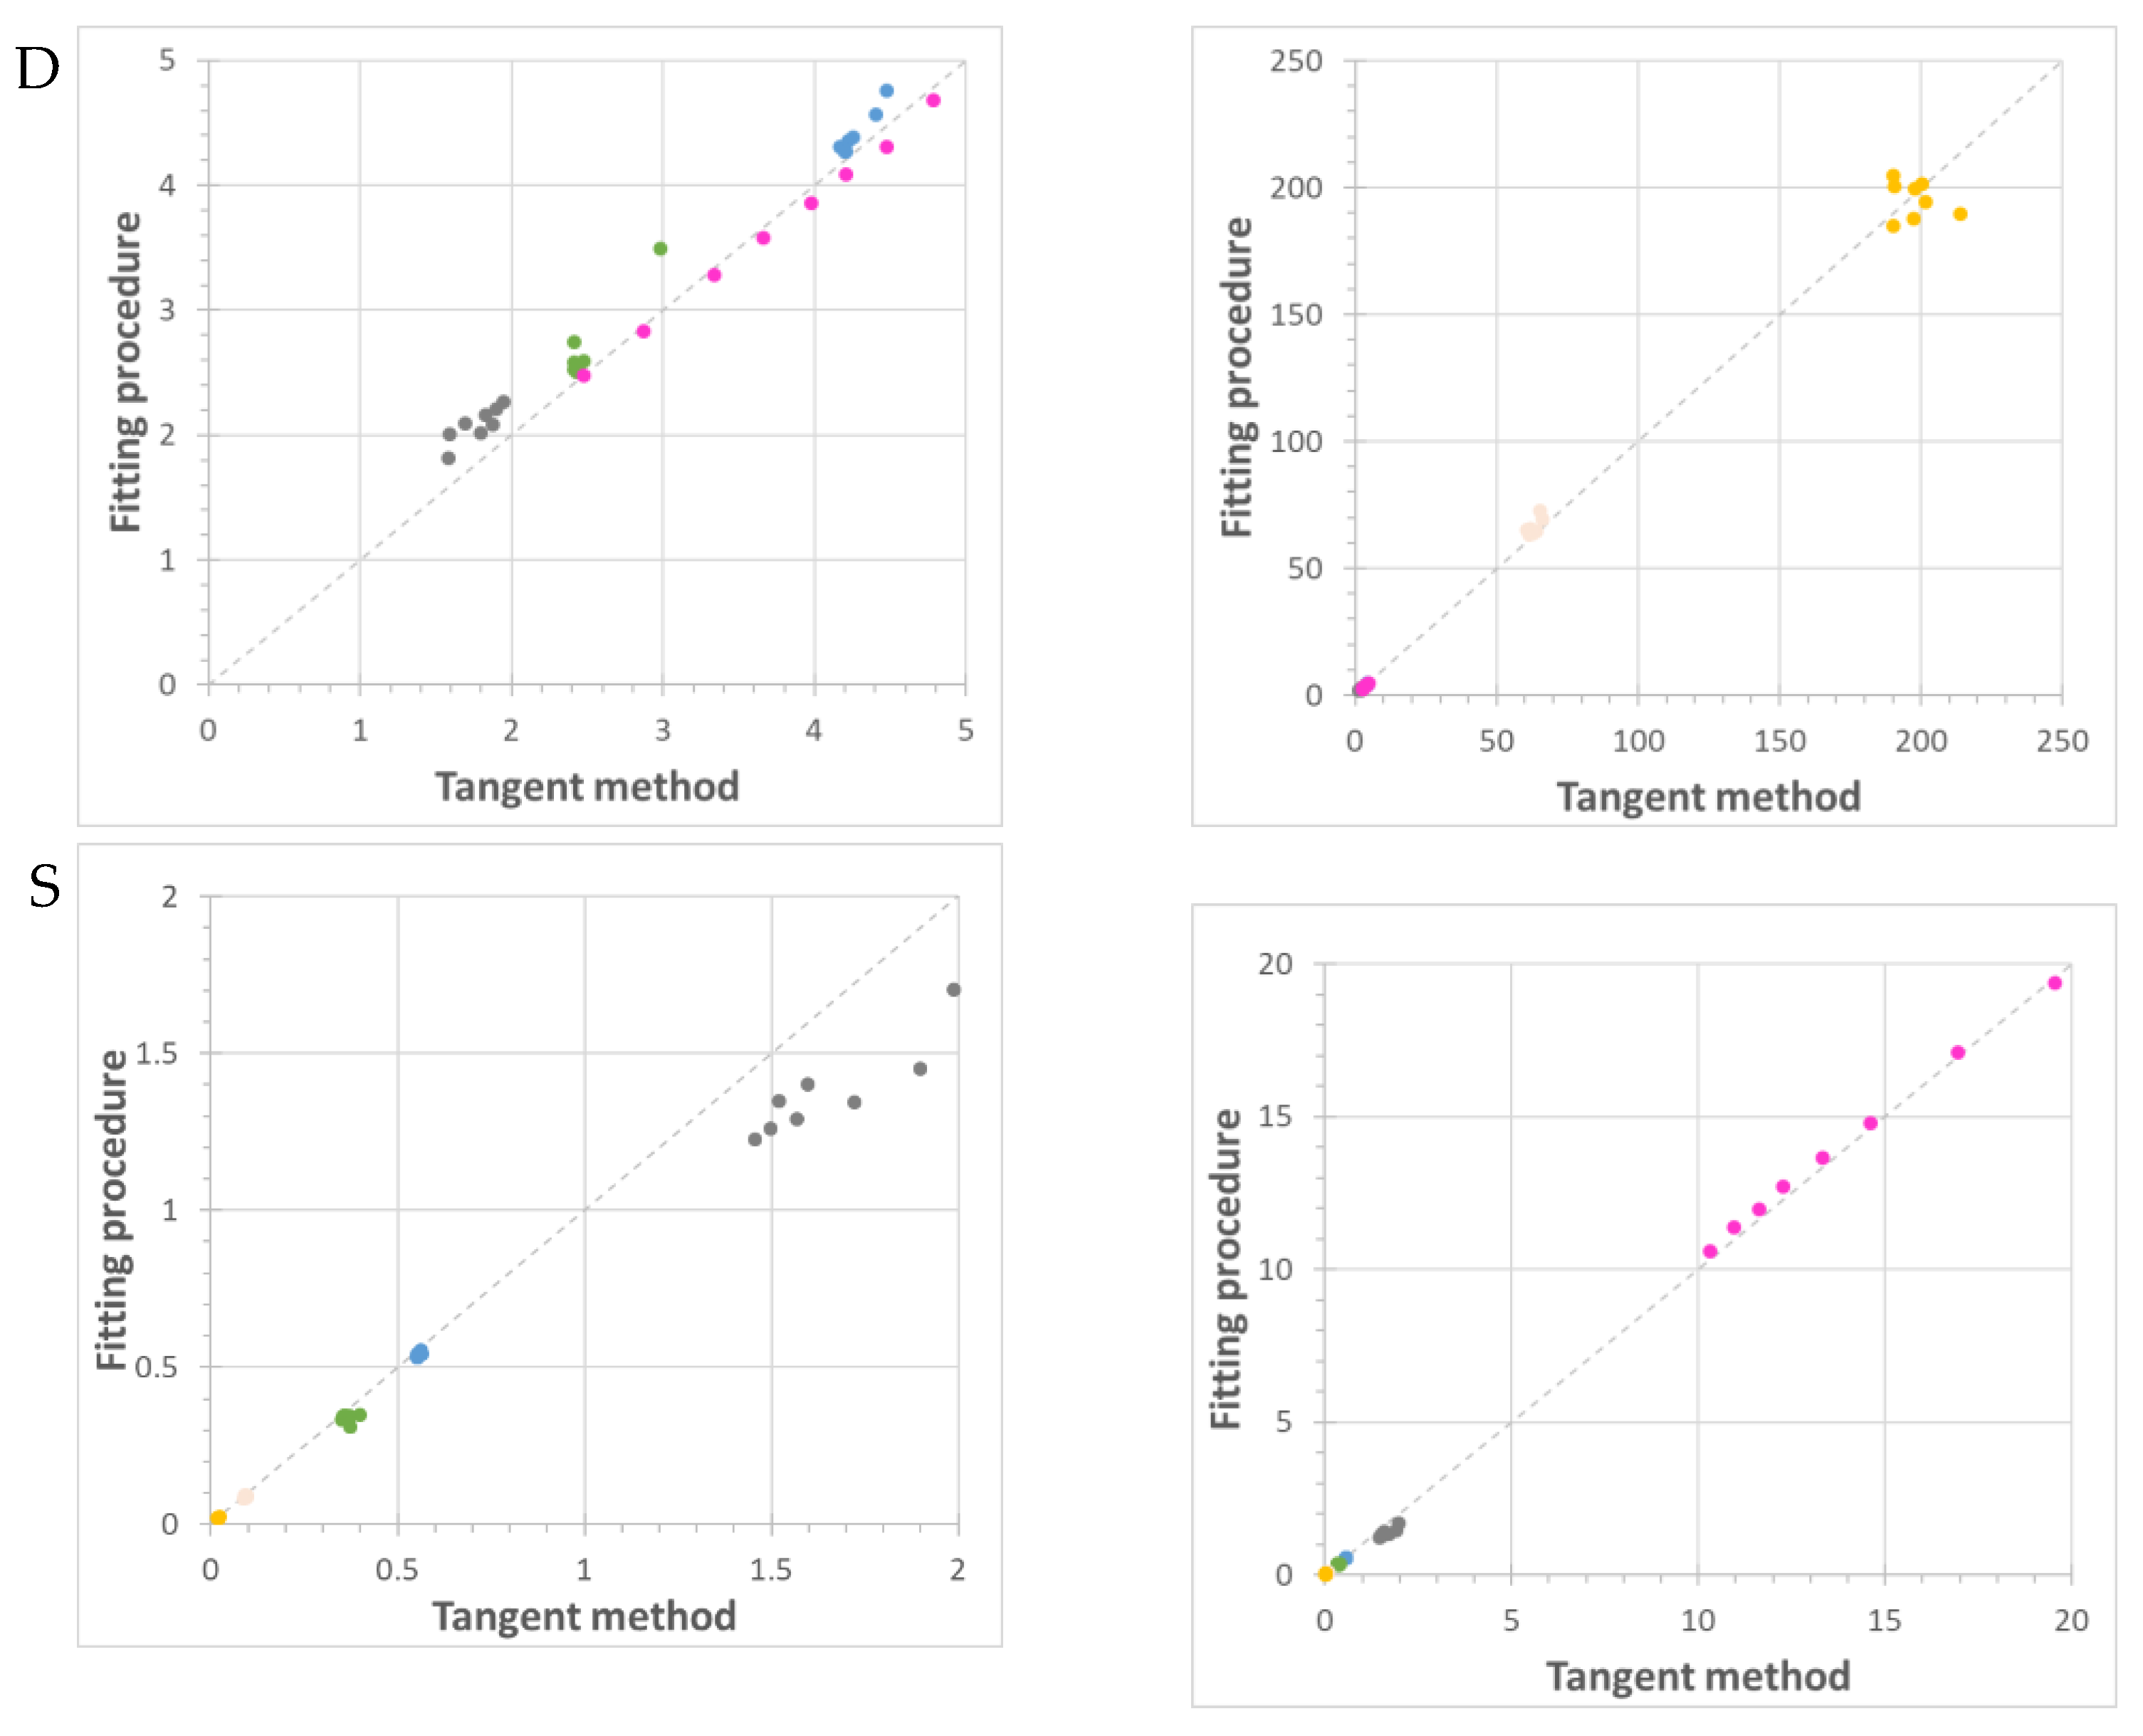
2.2.1. Data Analysis by the Tangent Method for Both Instruments

The type of permeation curve displayed in Figure 1 can be expressed algebraically by the following equation, derived from Fick’s first and second laws:
p t = p 0 + ( d p d t ) 0 t + R T V p V m A l p f S ( D t l 2 1 6 2 π 2 1 n ( 1 ) n n 2 e x p ( D n 2 π 2 t l 2 ) )
where pt is the permeate pressure at time t, p0 is the permeate pressure at the starting of the measurement, (dp/dt)0 is the baseline slope, which is related to the eventual presence of micro-defects in the membrane or leaks in the system, R is the universal gas constant, T is the absolute temperature, Vp is the permeate volume, Vm is the molar volume of the penetrant gas in standard conditions, A is the exposed surface area of the membrane, l is the thickness, pf is the feed pressure, S is the solubility coefficient, D is the diffusion coefficient.
Considering that in the stationary state the exponential term tends to zero, the starting permeate pressure is close enough to zero, i.e., p0 = 0, and the use of a defect-free and a leak-proof instrument, i.e., (dp/dt)0 = 0, Equation (4) can be highly simplified:
p t = R T V p V m A p f S D l ( t l 2 6 D )
Thus, assuming the validity of solution-diffusion model, the permeability can be calculated from the slope of the stationary part of the curve in Figure 1 by:
P = V P V m l R T A p f d p d t
In the case of a membrane with pinhole defects or in the case of minor leaks in the instrument, the two parameters p0 and (dp/dt)0 may not be negligible, and Θ must be calculated from the intersection of the tangent to the stationary state and the tangent to the initial part of the permeation curve, which acts as the baseline. Since the variable volume/constant pressure instrument does not measure the total permeate pressure, but the concentration or the partial pressure of the permeating gas, this signal must first be integrated to obtain the ‘conventional’ time lag curve [34].

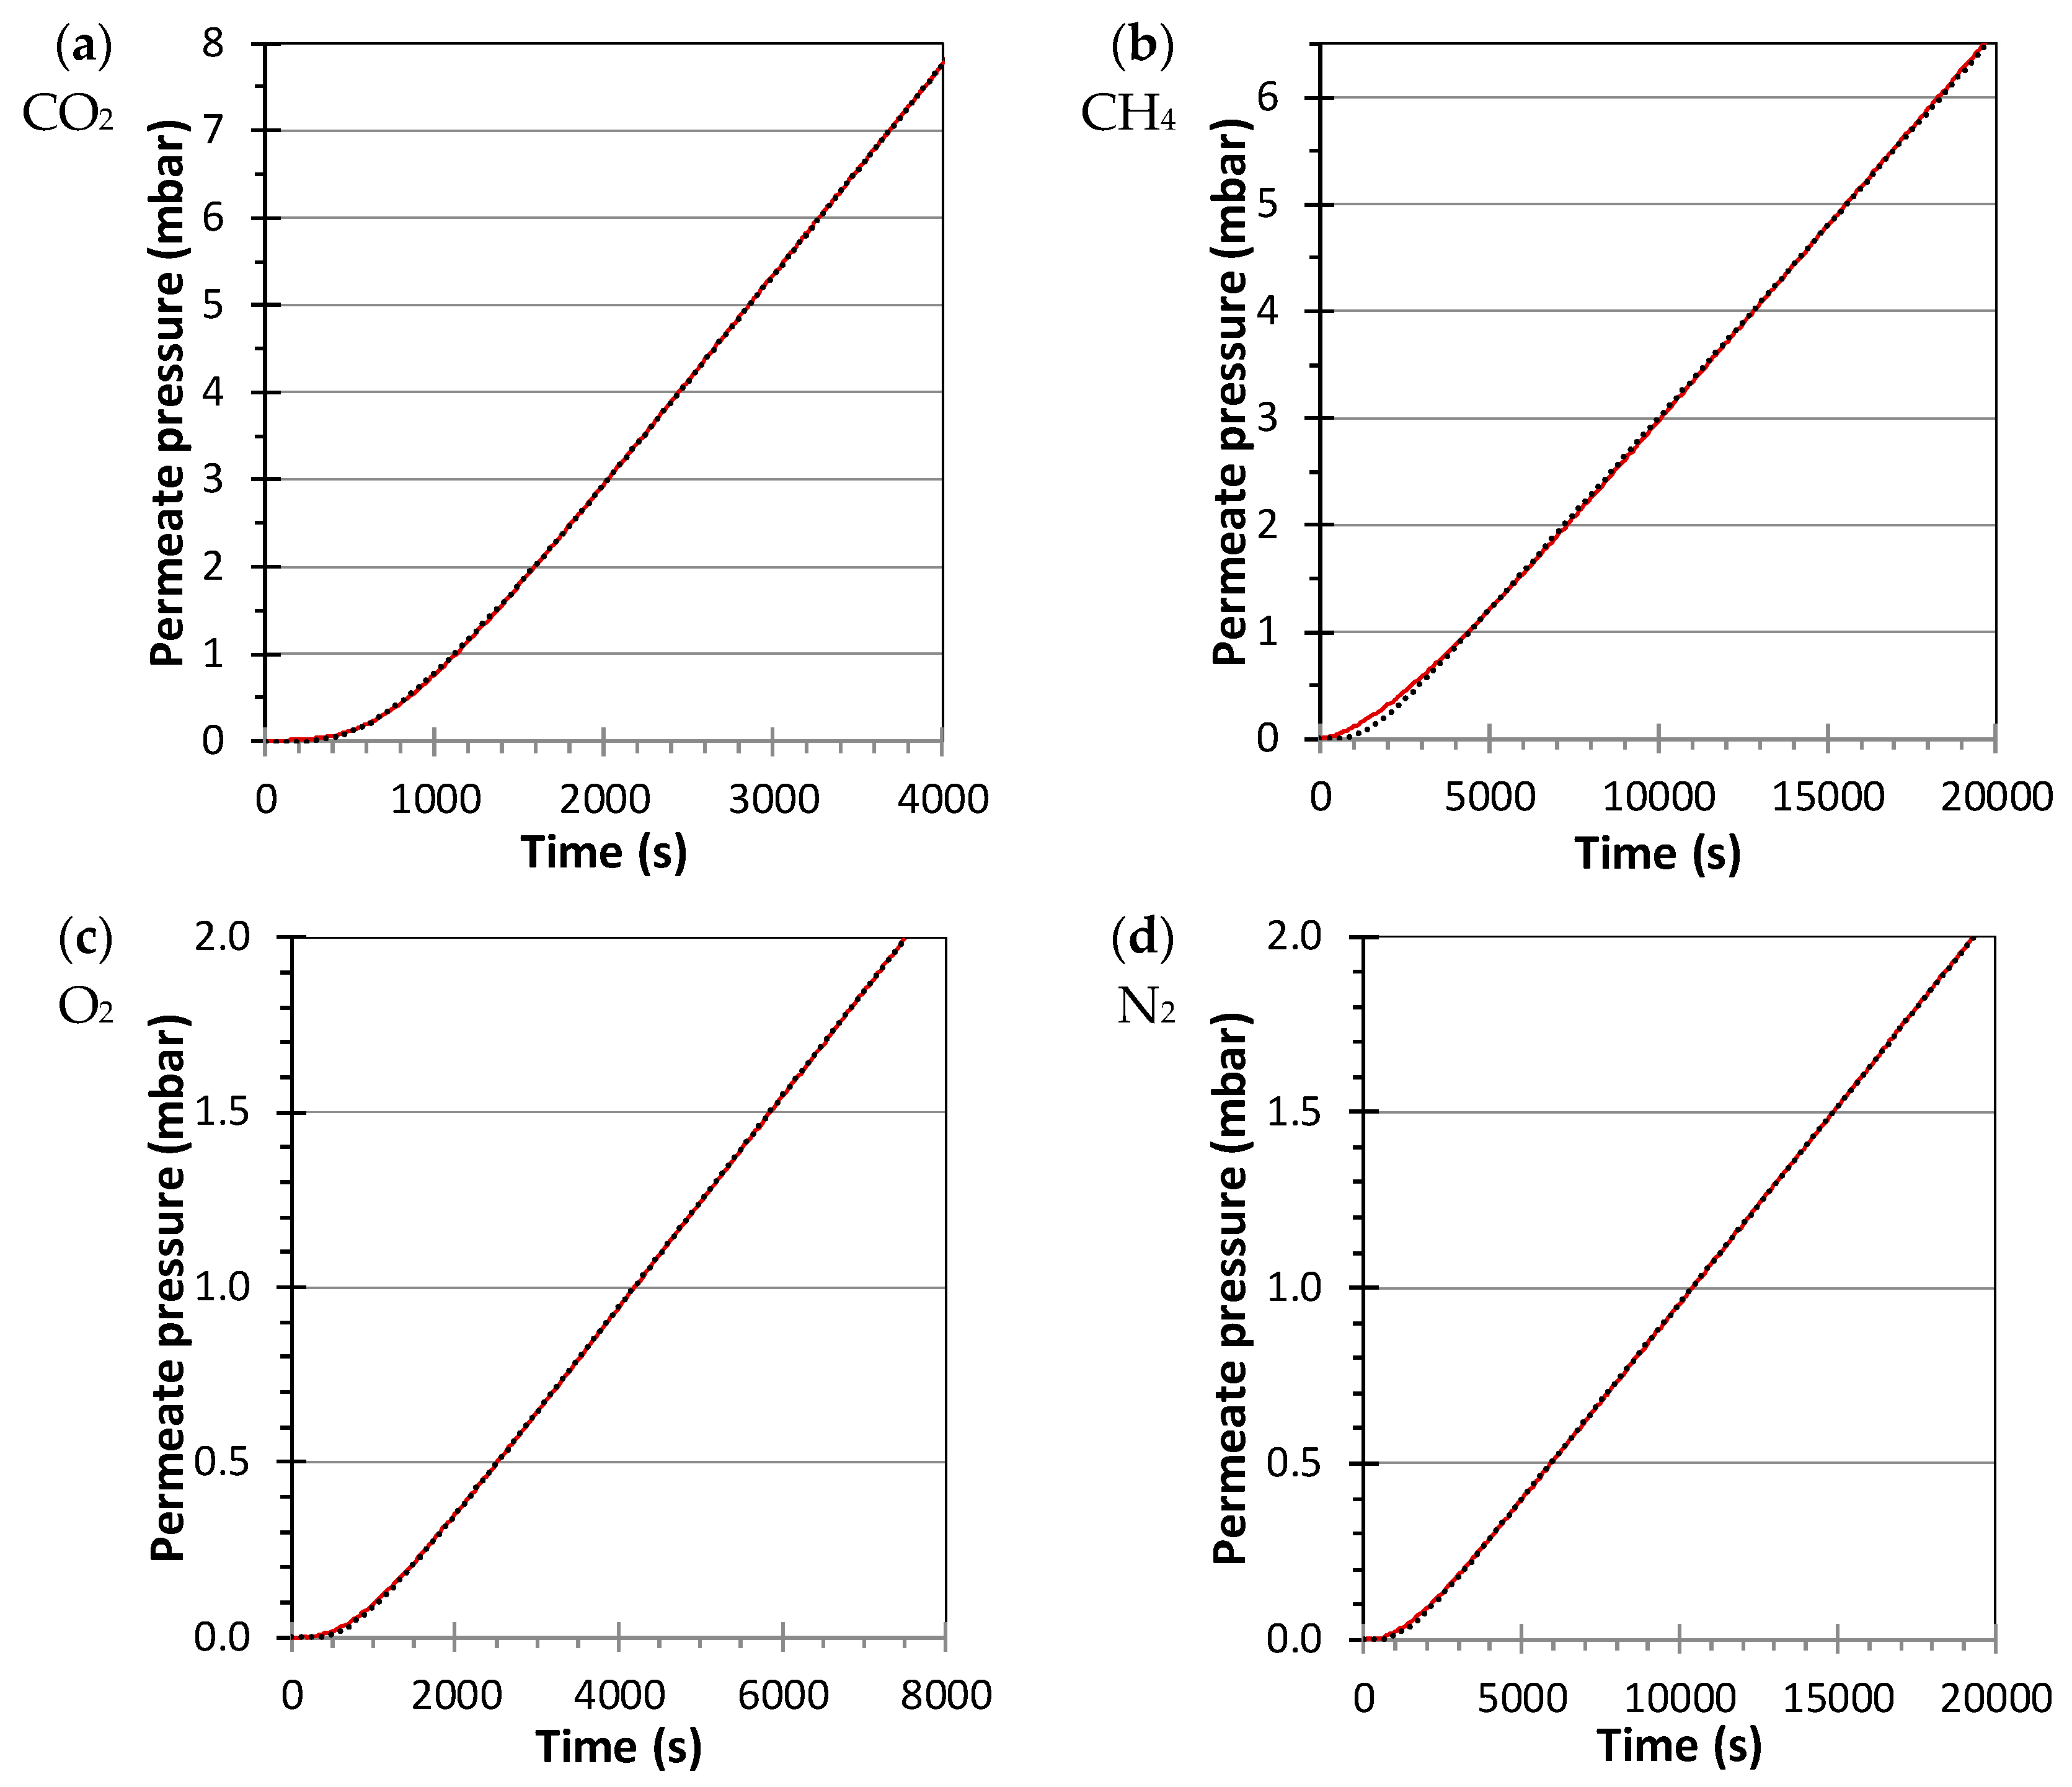
2.2.2. Fitting Method for a Constant Volume/Pressure Increase Instrument

The tangent method can be used without restrictions for polymeric films where no anomalous phenomena occur. In other cases, it can still be used, but the result is an ‘effective’ permeability and an ‘effective’ diffusion coefficient. Instead, in the case of, for instance, vapor transport analysis or gas transport in mixed matrix membranes in which highly sorbing fillers are used, a detailed analysis of the transient region by fitting the entire permeation curve may be needed, and this requires the series expansion of the last term in Equation (4), given by Equation (7):
1 n ( 1 ) n n 2 e x p ( D n 2 π 2 t l 2 )
In this work, the series expansion was conducted until the 25th term and the fitting was performed using the least squares method and the solver function of Microsoft Excel for the calculation of the optimized values for p0, (dp/dt)0, S, and D. The permeability is then calculated as the product of D and S. In case of anomalous transport phenomena, the permeation curve can be described as the sum of multiple, m, coexisting permeation phenomena, each having a different pair of Dm and Sm values [38]:
p t = p 0 + ( d p d t ) 0 t + R T V p V m A l p f 1 m S m ( D m t l 2 1 6 2 π 2 1 n ( 1 ) n n 2 e x p ( D m n 2 π 2 t l 2 ) )

2.2.3. Fitting Method for a Variable Volume/Constant Pressure Instrument

The permeate flow rate as a function of time for dense membranes tested by the variable volume/constant pressure instrument must be described in terms of Fickian diffusion in nonporous polymers, and it follows the derivative of Equation (4)
φ P = ( d V d t ) 0 + A l p f S ( D l 2 2 π 2 1 n ( 1 ) n n 2 ( D n 2 π 2 l 2 ) e x p ( D n 2 π 2 l 2 ) )
where the term (dV/dt)0 represents the sum of the contributions of the instrumental leak flow, the flow through pinhole defects, and also for this case, the series expansion was conducted until the 25th term in this work. Fitting was performed using the least squares method and the Excel solver function to obtain the optimized values for (dV/dt)0, S, and D. The permeability is calculated as the product of D and S.

3. Results and Discussion

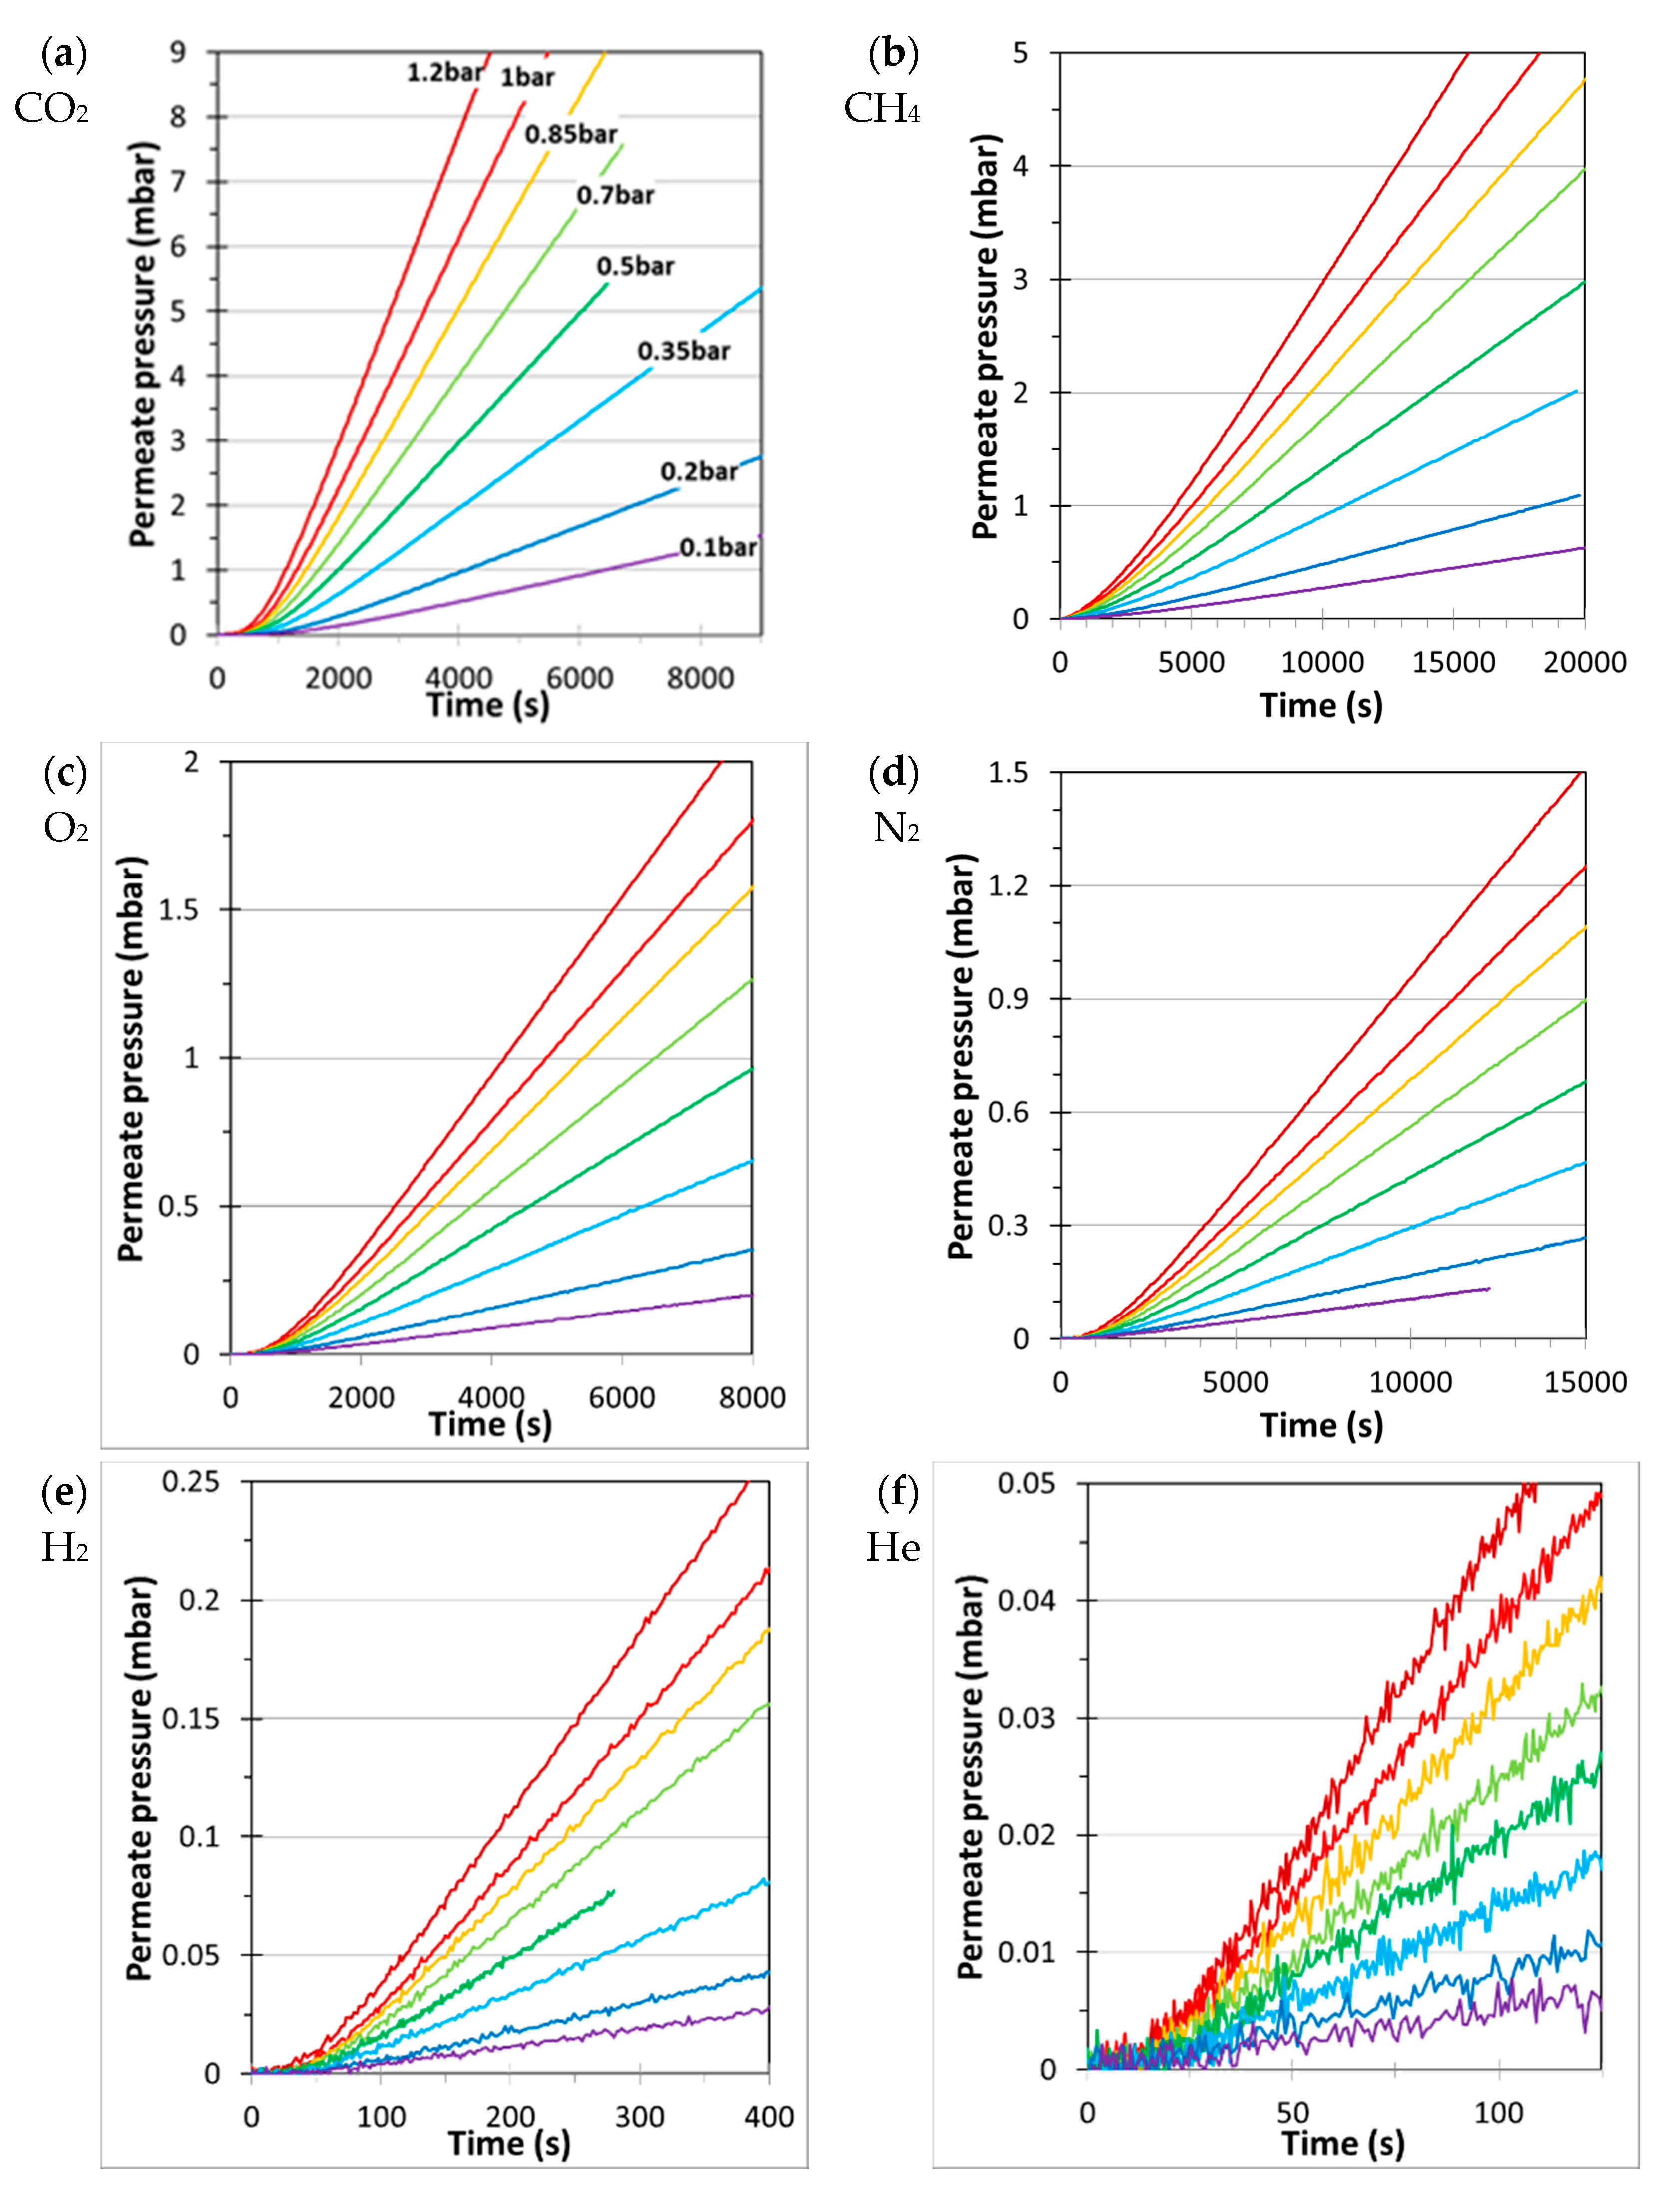
3.1. Single Gas Transport

The Pebax®1657/CuII2(S,S)-hismox mixed matrix membrane had a thickness of 150 µm, which is thick enough to get a time lag of several hundreds of seconds for the slowest gas species, yet not too thick to get a low signal-to-noise ratio. Figure 3 shows an example of the time lag curves for the membrane with Pebax®1657/CuII2(S,S)-hismox mixed matrix membrane in the constant volume/pressure increase instrument, at feed pressures ranging from 0.1 to 1.2 bar. Qualitatively, it is clear that small and rapidly diffusing gases such as He and H2 show a quick increase in the permeate pressure, and a constant permeation rate is reached within some tens of seconds to not more than 100 s.
On the other hand, for the bulkiest gas, CH4, the permeate pressure starts rising after a much longer time, and a constant permeation rate is not reached before about 5000 s. CO2 shows the steepest final slope, which indicates the highest permeability. This means that even if He and H2 are the faster diffusing gases, the much higher solubility of CO2 leads to an overall higher permeability.
The pure gas transport measurements were evaluated quantitatively, both by the tangent method and by the fitting procedure of the entire permeation curve, yielding the permeability, diffusion, and solubility coefficients of the gases at different feed pressures. On the short time scale of the measurements of H2 and especially He, they have a relatively poor signal-to-noise ratio, which makes the tangent method less accurate. In this case, it is a clear advantage to use the entire permeation curve, including the transient region, and not the first and last few percent of the curves to calculate P, D, and S. The complete overview of the results is reported in Appendix A. The general trends of the data are similar, showing the validity of both methods to determine the effective transport parameters, and this justifies the use of the simple tangent method where no anomalous transport takes place. However, comparing single experiments data for data, the values of P, D, and S are in good agreement for H2, He, O2, and CO2, whereas for CH4, the fit results in an approximately 10%–25% higher diffusion coefficient and a correspondingly lower solubility, while the permeability still corresponds well with both methods. To a lesser extent, the same is observed for N2, especially at low pressure. The correlation between the transport properties determined by the two methods is given in Appendix B. Examples of the fitting curves for CO2, CH4, O2, and N2 are reported in Figure 4 and show that the fitting procedure is unable to describe the curve in the transient region for CH4 (Figure 4d). In particular, the CH4 permeation curve seems to have an unusually quickly rising baseline. Similar differences occur between ethylene and ethane permeation (Figure 5). While Equation (4) accurately describes the permeation of C2H6 in the Pebax®1657/CuII2(S,S)-hismox MMMs (Figure 5a), the permeation curve of C2H4 cannot be fitted satisfactorily (Figure 5b). Most remarkably, the C2H4 diffusion appears to be slower than that of C2H6, which is unexpected on the basis of its smaller dimension ( d e f f ,   C 2 H 4 = 3.57Å and d e f f ,   C 2 H 6 = 3.69Å [39]). In addition, C2H4 shows a poor fit, with an unusually steep initial part of the curve, similar to that of CH4 in Figure 4d. Upon a closer look at the curve, the initial part is similar to a normal time lag curve with much shorter time lag (see insert in Figure 5b). This represents a faster diffusion process than that of C2H6, as would be expected on the basis of their relative sizes.
This fast process is then followed by a much slower process to reach the final steady state. In our previous publication, we observed that CuII2(S,S)-hismox has a much higher affinity for propylene than for propane [36], and this seems to be true also for ethylene vs. ethane. This can be ascribed to sterical factors, related to the remarkable internal void structure of CuII2(S,S)-hismox, with wide triangular voids and narrower voids at the extremities of the triangle, but also to chemical factors. As described previously, CuII2(S,S)-hismox possesses specific binding sites of Cu(II) that can link with the ethylene double bond, which is missing in ethane [36]. The simplest phenomenological explanation is this that the MOF behaves as a sort of reservoir for the permeating gas species, and the higher the sorption capacity, the longer time lag. A similar observation was recently made by Esposito et al. [40] for NiII2{NiII4[CuII2(Me3mpba)2]3}·54H2O in Pebax®1657, with unexpectedly long time lags.
The second explanation is that gases with different sizes and different affinity for the internal voids of the MOF, have access to different sorption sites. Indeed, both C2H4 and C2H6 have access to the relatively large central voids of CuII2(S,S)-hismox, and the diffusion of C2H4 is faster than that of C2H6, in agreement with its smaller size. On the other hand, the narrower channels are only accessible to C2H4, and the higher affinity leads to a higher sorption capacity reflected in a higher solubility, but the slower diffusion coefficient in/into these narrower channels and the higher overall sorption capacity result in a much longer time lag and thus a lower effective diffusion coefficient. Indeed, the permeation of C2H4 can be fitted better using Equation (8) and m = 2, i.e., with two diffusion terms. This means that the ethylene permeation can be mathematically described by a two-step process, one faster and one slower process. This is schematically displayed in Figure 5c,d: the lower dotted line in Figure 5c is the fit of the fastest process (the insert in Figure 5b), and the shaded area is the difference between the fit of the fast process and the overall permeation process, and represents the fully decoupled slower diffusion process. Indeed, it is worth noting that the curve in Figure 5d, which is obtained by subtracting the curve of the first fit (dotted black line in Figure 5c) to the complete permeation curve, has also the shape of an ideal time lag curve for a constant volume/pressure increase instrument and can be fitted to yield independent values of P, D, and S. This is in agreement with the fact that the permeation is a result of two distinct phenomena, both driven by the solution-diffusion mechanism. The power of the here presented computational evaluation of the time lag phenomena is that both processes can be fully decoupled, and this allows the determination of P, D, and S for both processes (Table 1), unlike the tangent method, which provides a single effective permeability and diffusivity.

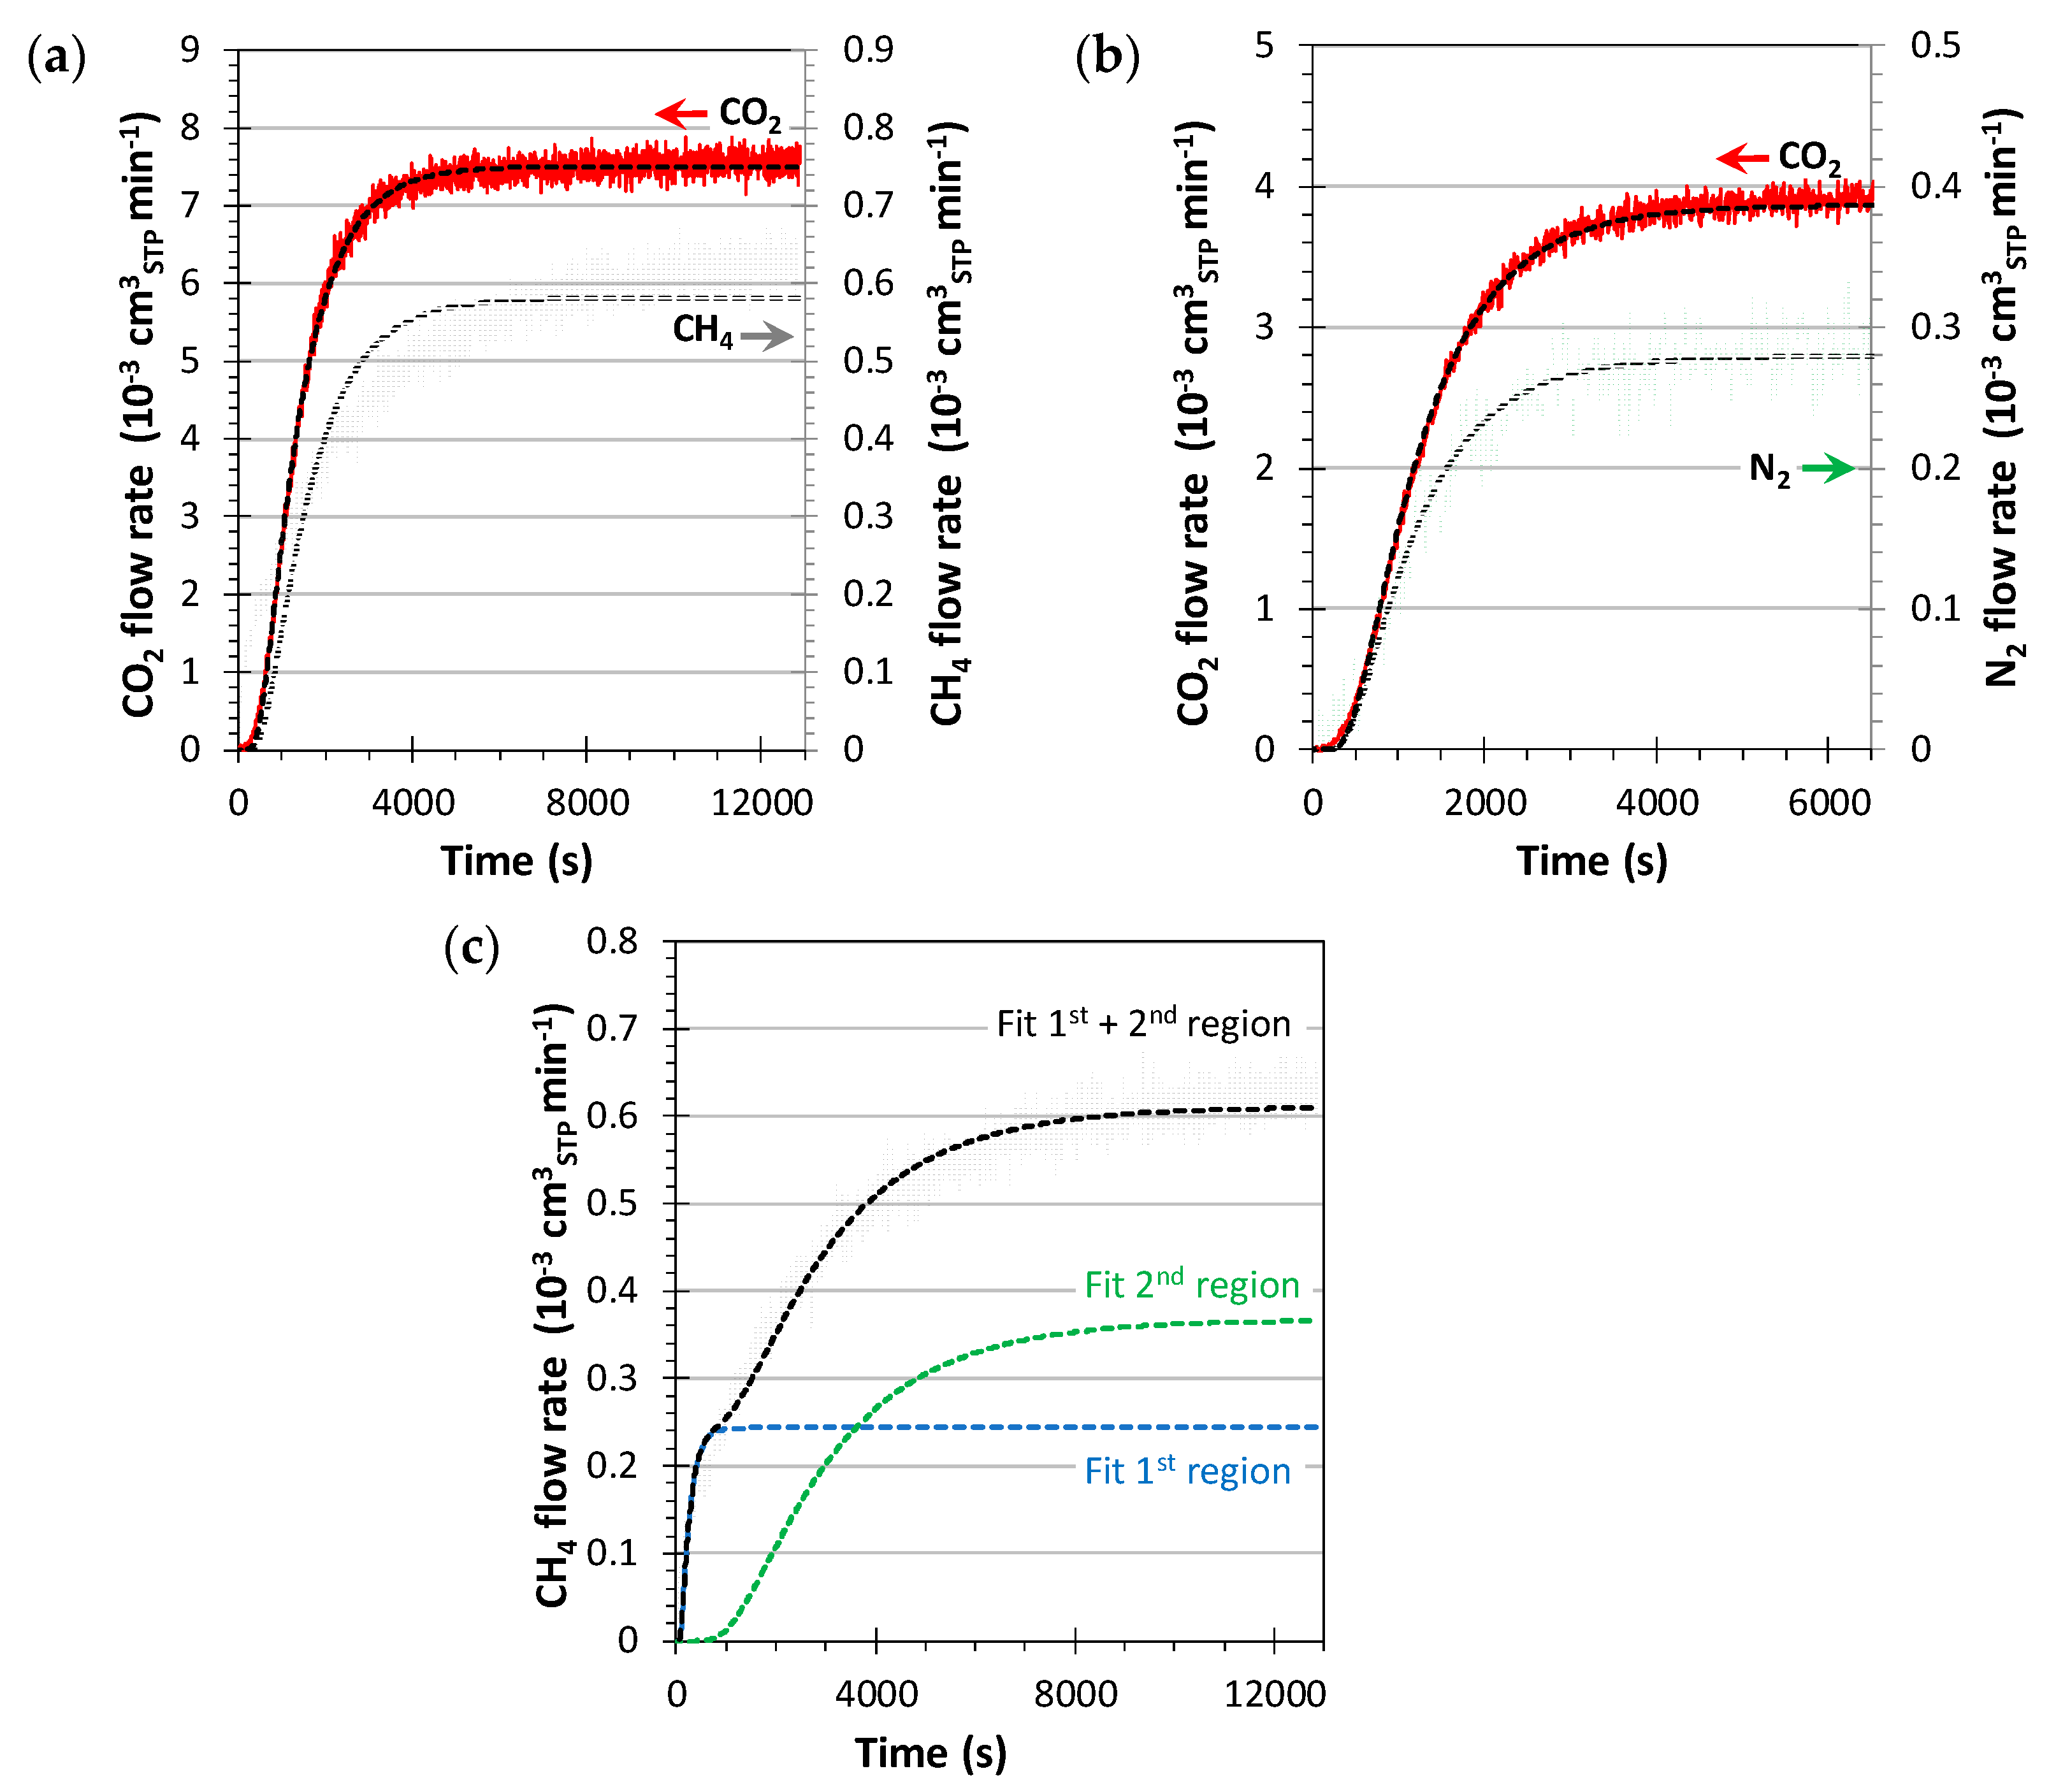
3.2. Mixed Gas Transport

Figure 6 shows the continuous permeation curve of binary mixtures CO2/CH4 and CO2/N2 in the Pebax®1657/CuII2(S,S)-hismox MMM, including the transient region. These two mixtures are of particular interest since they mimic the compositions of biogas and of flue gas, and the full understanding of the mixed gas transport could lead to breakthrough in the development of novel materials for a drastically improved separation process for these mixtures. The curves in Figure 6 are typical examples of the differential method [31] and, in our case, can be fitted with Equation (9). The trend of N2 in the CO2/N2 mixture and of CO2 in both mixtures is described well with Equation (9), but as with the single gas in Figure 4b, the fit of the CH4 signal is poor and strongly underestimates the experimental trend in the early stage. This behavior is analogous to that described above for ethylene. Apparently, the relatively bulky CH4 molecule easily penetrates into the main channels of the MOF where its diffusion is fast, and its diffusion is much slower in the lateral spaces of the MOF, resulting in the superposition of slow transient process over the fast initial transient. This is clearly demonstrated by the successful two-stage fit of the methane permeation curve, giving a much better overlap of the fitted signal with the experimental permeation curve (Figure 6c,d). There is still some deviation from the experimental and the fitted CH4 curve, most likely because the shape of the CH4 curve is affected by other phenomena, such as the competitive sorption by CO2. During the entire transient period of CO2, its concentration in the membrane increases, and this leads to a stronger competition with sorption of CH4. The effective diffusion coefficient for the various methods is plotted as a function of the squared effective diameter in Figure 7. It must be noted that the diffusion coefficient of all gases is much lower than that in neat Pebax®1657 [41]. Instead, the C2H6 diffusion coefficient, the CH4 diffusion coefficient, and the C2H4 diffusion coefficient calculated for the quick first stage are much closer to the trend for neat Pebax®1657 (for CH4) and even above this trend (for C2H4 and C2H6).
According to the Maxwell model (Equation (1)), this means that the permeability of the dispersed filler is indeed higher than that of the continuous polymer phase in these cases, but the process is dominated by the slower term. The unusually slow overall diffusion has been identified in other systems, where it was attributed to ‘immobilizing adsorption’ [42,43] or specific noncovalent interactions [44]. This shows that for a filler to be effective, high sorption capacity alone is not sufficient and may be even counter-productive, if not accompanied by a proportional increase in the diffusion coefficient in the cavities of the adsorbent.

4. Conclusions

This work presents the comparison of the conventional tangent method and a more sophisticated computational method for the determination of the transport parameters P, D, and S in Pebax®1657/CuII2(S,S)-hismox mixed matrix gas separation membranes, using the fit of the entire permeation curve based on the analytical solution of Fick’s law. Both for the integral method (time lag curve) and the differential method (flow rate curve in a cross-flow permeation cell), the fit of the entire permeation curve provides much more information than the tangent method. For He, H2, N2, O2, CO2, and C2H6, an excellent fit of the experimental data with the integral curve, indicates normal transport with a single effective diffusion coefficient. On the other hand, a poor fit of CH4 and C2H4 can be attributed to anomalous transport with multiple diffusion coefficients in the complex internal voids of CuII2(S,S)-hismox, dispersed in the mixed matrix membranes. This behavior is confirmed for the differential method, when fitting the CH4 curve measured during the permeation of a CO2/CH4 mixture with a cross-flow cell. In particular, the fit of the entire permeation curves allows the identification and quantification of a fast diffusion process through the core of the MOF voids and a slower process related to diffusion in the narrower extremities of the triangle-like voids, where only smaller molecules with high affinity, such as CO2 and C2H4, readily adsorb and slowly diffuse. This means that during the conceptualization of a novel filler, both sorption capacity and diffusion coefficient in the filler’s cavities should be considered, because too high sorption capacity could lead to the counter-productive effects of slowing the diffusion of the targeted molecule. This work also confirms the power of the innovative mixed gas permeation setup with continuous analysis of the permeate composition by an on-line mass-spectrometric residual gas analyzer. Even for complex mixed matrix membranes like in the present work, this instrument can provide the diffusion coefficient of individual gas species in a mixture during mixed gas permeation experiments.

Author Contributions

Conceptualization, J.C.J.; Data curation, A.F.; Formal analysis, A.F.; Funding acquisition, E.P., D.A. and J.C.J.; Investigation, A.F., M.M., E.E., R.B. and J.F.-S.; Methodology, A.F.; Resources, J.C.J.; Supervision, E.P., D.A. and J.C.J.; Writing—original draft, A.F. and J.C.J.; Writing—review & editing, A.F., M.M., E.E., R.B., J.F.-S., E.P., D.A. and J.C.J. All authors have read and agreed to the published version of the manuscript.

Funding

This work was supported by Ministero dell’Istruzione, dell’Università e della Ricerca (Italy). R.B. thanks the MIUR (Project PON R&I FSE–FESR 2014–2020) for predoctoral grant. Thanks are also extended to the “2019 Post–doctoral Junior Leader–Retaining Fellowship, la Caixa Foundation (ID100010434 and fellowship code LCF/BQ/PR19/11700011” (J.F.-S.). E.P. acknowledges the financial support of the European Research Council under the European Union’s Horizon 2020 research and innovation programme/ERC Grant Agreement No 814804, MOF–reactors.) D.A. acknowledges Diamond Light Source for the awarded beamtime and provision of synchrotron radiation facilities with dosing gas cell for in situ X-ray structural characterization and thanks Mark Warren for his assistance at I19 beamline (Proposal No. MT18768-2).

Acknowledgments

C. Cantoni (Arkema Italy) is gratefully acknowledged for providing the Pebax®1657 pellets.

Conflicts of Interest

The authors declare no conflict of interest.

Appendix A

Table A1. Permeability [Barrer], Θ [s], Diffusion coefficient [10−12 m2 s−1] and Solubility [cm3STP cm−3 bar−1] of the Pebax®1657/CuII2(S,S)-hismox·MMM at 25 °C and different feed pressures [mbar] determined by the tangent and the fitting methods (single Time Lag), as well as their % difference.
Tangent MethodFitting MethodDifference % (Fitting-Tangent)
Gas pFeedPΘDSPΘDSPΘDS
O212003.108884.220.5513.098614.360.53−0.48−3.103.20−3.57
10003.118934.200.5543.108784.270.54−0.31−1.621.65−1.93
8503.118924.200.5553.108784.270.54−0.28−1.621.65−1.90
6803.128934.200.5573.118754.290.54−0.35−2.012.06−2.35
5203.149004.170.5653.128714.310.54−0.40−3.203.31−3.59
3503.178814.250.5583.158554.390.54−0.40−3.003.09−3.39
1803.248514.410.5523.238224.560.53−0.34−3.423.55−3.75
1003.368384.470.5633.527884.760.554.61−5.966.34−1.63
N212001.1615142.480.3511.1514492.590.33−0.51−4.274.46−4.75
10001.1515332.450.3531.1514962.510.34−0.34−2.462.52−2.79
8501.1615422.430.3561.1514942.510.34−0.39−3.103.20−3.48
6801.1615492.420.3591.1514872.520.34−0.43−4.064.23−4.47
5201.1715562.410.3651.1714832.530.35−0.53−4.674.90−5.18
3501.2015542.410.3721.1914542.580.35−0.67−6.456.90−7.08
1801.2915542.410.4001.2713642.750.35−1.05−12.314.0−13.2
1001.4812582.980.3731.4510723.500.31−2.34−14.817.3−16.8
CH412003.7919241.951.463.7116542.271.23−2.11−14.016.3−15.8
10003.8019721.901.503.7216982.211.26−2.18−13.916.1−15.8
8503.8019981.881.523.7517962.091.35−1.36−10.111.3−11.3
6803.8120541.831.573.7217372.161.29−2.58−15.518.3−17.6
5203.8320881.801.603.7718572.021.40−1.5−11.112.5−12.4
3503.8822191.691.723.7517932.091.35−3.36−19.223.8−21.9
1804.0423521.591.903.8818692.011.45−3.84−20.525.8−23.6
1004.2023661.591.994.1220641.821.70−1.94−12.814.6−14.5
H212007.7356.866.00.0887.7153.969.60.083−0.24−5.065.33−5.28
10007.7358.663.90.0917.7258.164.50.09−0.09−0.910.92−1.00
8507.7559.762.80.0937.7458.863.80.091−0.18−1.521.55−1.70
6807.7661.161.30.0957.7559.463.10.092−0.18−2.822.9−2.99
5207.7760.761.80.0947.7258.164.50.09−0.60−4.254.44−4.83
3507.8060.561.90.0947.7557.165.70.089−0.63−5.676.01−6.26
1807.8761.860.70.0977.8357.565.20.09−0.50−6.917.42−7.38
1008.3057.365.50.0958.2751.572.90.085−0.40−10.211.3−10.5
He12005.2718.72000.0205.2118.62010.019−1.19−0.460.46−1.64
10005.2918.91980.0205.2218.82000.02−1.42−0.830.83−2.24
8505.2718.62020.0205.2619.31950.02−0.143.64−3.523.50
6805.1119.71900.0205.1420.31850.0210.562.81−2.733.39
5205.1817.52140.0185.3419.81900.0212.9812. 7−11.216.0
3505.5719.71900.0225.4618.32050.02−2.05−7.037.56−8.94
1805.4919.71910.0225.6318.72000.0212.61−4.875.11−2.38
1006.3319.01970.0246.1720.01880.025−2.564.94−4.712.26
CO2120065.87844.7810.366.08014.6810.60.382.22−2.182.61
100065.38384.4810.965.58704.3111.40.273.88−3.744.16
85065.38914.2111.665.49174.0912.00.132.93−2.853.07
68065.19443.9712.365.29733.8512.70.223.16−3.063.39
52065.110233.6613.365.210483.5813.70.132.45−2.392.58
35065.111233.3414.664.711423.2814.8−0.491.65−1.631.15
18064.813082.8716.964.513252.8317.1−0.411.32−1.310.91
10064.615132.4819.564.015152.4819.4−0.830.10−0.10−0.73
C2H610009.1515424.40.289.0714226.30.26−0.87−7.797.79−7.14

Appendix B

Figure A1. Plot of the permeability [Barrer], time lag [s], diffusivity [10−12 m2 s−1] and solubility [cm3STP cm-3 bar−1]- determined by the fitting procedure plotted vs. the values obtained via the tangent method for the following gases: CO2 ( Computation 08 00028 i006), N2 ( Computation 08 00028 i007), O2 ( Computation 08 00028 i008), CH4 ( Computation 08 00028 i009), H2 ( Computation 08 00028 i010), He ( Computation 08 00028 i011).
Computation 08 00028 g0a1aComputation 08 00028 g0a1b

References

  1. Park, H.B.; Kamcev, J.; Robeson, L.M.; Elimelech, M.; Freeman, B.D. Maximizing the right stuff: The trade-off between membrane permeability and selectivity. Science (80-) 2017, 356, eaab0530. [Google Scholar] [CrossRef] [PubMed] [Green Version]
  2. Sholl, D.S.; Lively, R.P. Seven chemical separations to change the world. Nature 2016, 532, 435–437. [Google Scholar] [CrossRef]
  3. Galizia, M.; Chi, W.S.; Smith, Z.P.; Merkel, T.C.; Baker, R.W.; Freeman, B.D. 50th Anniversary Perspective: Polymers and Mixed Matrix Membranes for Gas and Vapor Separation: A Review and Prospective Opportunities. Macromolecules 2017, 50, 7809–7843. [Google Scholar] [CrossRef]
  4. Esposito, E.; Dellamuzia, L.; Moretti, U.; Fuoco, A.; Giorno, L.; Jansen, J.C. Simultaneous production of biomethane and food grade CO2 from biogas: An industrial case study. Energy Environ. Sci. 2019, 12, 281–289. [Google Scholar] [CrossRef]
  5. Comesaña-Gándara, B.; Chen, J.; Bezzu, C.G.; Carta, M.; Rose, I.; Ferrari, M.C.; Esposito, E.; Fuoco, A.; Jansen, J.C.; McKeown, N.B. Redefining the Robeson upper bounds for CO2 /CH4 and CO2 /N2 separations using a series of ultrapermeable benzotriptycene-based polymers of intrinsic microporosity. Energy Environ. Sci. 2019, 12, 2733–2740. [Google Scholar] [CrossRef] [Green Version]
  6. Robeson, L.M. The upper bound revisited. J. Memb. Sci. 2008, 320, 390–400. [Google Scholar] [CrossRef]
  7. Robeson, L.M. Correlation of separation factor versus permeability for polymeric membranes. J. Memb. Sci. 1991, 62, 165–185. [Google Scholar] [CrossRef]
  8. Chuah, C.Y.; Goh, K.; Yang, Y.; Gong, H.; Li, W.; Enis Karahan, H.D.; Guiver, M.; Wang, R.; Bae, T.H. Harnessing Filler Materials for Enhancing Biogas Separation Membranes. Chem. Rev. 2018, 118, 8655–8769. [Google Scholar] [CrossRef]
  9. Sabetghadam, A.; Seoane, B.; Keskin, D.; Duim, N.; Rodenas, T.; Shahid, S.; Sorribas, S.; Le Guillouzer, C.; Clet, G.; Tellez, C.; et al. Metal Organic Framework Crystals in Mixed-Matrix Membranes: Impact of the Filler Morphology on the Gas Separation Performance. Adv. Funct. Mater. 2016, 26, 3154–3163. [Google Scholar] [CrossRef]
  10. Liu, X.; Wang, X.; Bavykina, A.V.; Chu, L.; Shan, M.; Sabetghadam, A.; Miro, H.; Kapteijn, F.; Gascon, J. Molecular-Scale Hybrid Membranes Derived from Metal-Organic Polyhedra for Gas Separation. ACS Appl. Mater. Interfaces 2018, 10, 21381–21389. [Google Scholar] [CrossRef]
  11. Ghalei, B.; Sakurai, K.; Kinoshita, Y.; Wakimoto, K.; Isfahani, A.P.; Song, Q.; Doitomi, K.; Furukawa, S.; Hirao, H.; Kusuda, H.; et al. Enhanced selectivity in mixed matrix membranes for CO2 capture through efficient dispersion of amine-functionalized MOF nanoparticles. Nat. Energy 2017, 2, 17086. [Google Scholar] [CrossRef]
  12. Nagaraju, D.; Bhagat, D.G.; Banerjee, R.; Kharul, U.K. In Situ growth of metal-organic frameworks on a porous ultrafiltration membrane for gas separation. J. Mater. Chem. A 2013, 1, 8828–8835. [Google Scholar] [CrossRef]
  13. Fuoco, A.; Khdhayyer, R.M.; Attfield, P.M.; Esposito, E.; Jansen, C.J.; Budd, M.P. Synthesis and Transport Properties of Novel MOF/PIM-1/MOF Sandwich Membranes for Gas Separation. Membranes 2017, 7, 7. [Google Scholar] [CrossRef] [PubMed] [Green Version]
  14. Mahajan, R.; Koros, W.J. Mixed matrix membrane materials with glassy polymers. Part 1. Polym. Eng. Sci. 2002, 42, 1420–1431. [Google Scholar] [CrossRef]
  15. Petropoulos, J.H. A comparative study of approaches applied to the permeability of binary composite polymeric materials. J. Polym. Sci. Polym. Phys. Ed. 1985, 23, 1309–1324. [Google Scholar] [CrossRef]
  16. Zimmerman, C.M.; Singh, A.; Koros, W.J. Tailoring mixed matrix composite membranes for gas separations. J. Memb. Sci. 1997, 137, 145–154. [Google Scholar] [CrossRef]
  17. Shimekit, B.; Mukhtar, H.; Murugesan, T. Prediction of the relative permeability of gases in mixed matrix membranes. J. Memb. Sci. 2011, 373, 152–159. [Google Scholar] [CrossRef]
  18. Vinh-Thang, H.; Kaliaguine, S. Predictive models for mixed-matrix membrane performance: A review. Chem. Rev. 2013, 113, 4980–5028. [Google Scholar] [CrossRef]
  19. Maxwell, J.C. A Treatise on Electricity and Magnetism; Cambridge University Press: Cambridge, UK, 2010; ISBN 9780511709333. [Google Scholar]
  20. Wijmans, J.G.; Baker, R.W. The solution-diffusion model: A review. J. Memb. Sci. 1995, 107, 1–21. [Google Scholar] [CrossRef]
  21. Wijmans, J.G.; Baker, R.W. The Solution-Diffusion Model: A Unified Approach to Membrane Permeation. In Materials Science of Membranes for Gas and Vapor Separation; Yampolskii, Y., Pinnau, I., Freeman, B., Eds.; John Wiley& Sons, Ltd.: Chichester, UK, 2006; pp. 159–189. [Google Scholar]
  22. Crank, J. The Mathematics of Diffusion, 2nd ed.; Clarendon Press: Oxford, UK, 1975; ISBN 0198533446. [Google Scholar]
  23. Daynes, H.A. The Process of Diffusion through a Rubber Membrane. Proc. R. Soc. A Math. Phys. Eng. Sci. 1920, 97, 286–307. [Google Scholar] [CrossRef]
  24. Amarantos, S.G.; Tsimillis, K.; Savvakis, C.; Petropoulos, J.H. Kinetic analysis of transient permeation curves. J. Memb. Sci. 1983, 13, 259–272. [Google Scholar] [CrossRef]
  25. Tsimillis, K.; Petropoulos, J.H. Experimental study of a simple anomalous diffusion system by time-lag and transient-state kinetic analysis. J. Phys. Chem. 1977, 81, 2185–2191. [Google Scholar] [CrossRef]
  26. Strzelewicz, A.; Grzywna, Z.J. On the permeation time lag for different transport equations by Frisch method. J. Memb. Sci. 2008, 322, 460–465. [Google Scholar] [CrossRef]
  27. Frisch, H.L. Anomalous Polymer-Penetrant Permeation. J. Chem. Phys. 1962, 37, 2408–2413. [Google Scholar] [CrossRef]
  28. Follain, N.; Valleton, J.M.; Lebrun, L.; Alexandre, B.; Schaetzel, P.; Metayer, M.; Marais, S. Simulation of kinetic curves in mass transfer phenomena for a concentration-dependent diffusion coefficient in polymer membranes. J. Memb. Sci. 2010, 349, 195–207. [Google Scholar] [CrossRef]
  29. Favre, E.; Morliere, N.; Roizard, D. Experimental evidence and implications of an imperfect upstream pressure step for the time-lag technique. J. Memb. Sci. 2002, 207, 59–72. [Google Scholar] [CrossRef]
  30. Beckman, I.N.; Shalygin, M.G.; Teplyakov, V.V. Particularities of Membrane Gas Separation Under Unsteady State Conditions. In Mass Transfer in Chemical Engineering Processes; Markoš, J., Ed.; InTech: Rijeka, Croatia, 2011; pp. 205–232. ISBN 978-953-307-619-5. [Google Scholar]
  31. Beckman, I.N.; Syrtsova, D.A.; Shalygin, M.G.; Kandasamy, P.; Teplyakov, V.V. Transmembrane gas transfer: Mathematics of diffusion and experimental practice. J. Memb. Sci. 2020, 601, 117737. [Google Scholar] [CrossRef]
  32. Shalygin, M.G.; Kozlova, A.A.; Syrtsova, D.A.; Markova, S.Y.; Ryabova, O.R.; Teplyakov, V.V. Diffusion Transport of Water and Methanol Vapors in Polyvinyltrimethylsilane. Membr. Membr. Technol. 2019, 1, 183–189. [Google Scholar] [CrossRef] [Green Version]
  33. Yasuda, H.; Rosengren, K. Isobaric measurement of gas permeability of polymers. J. Appl. Polym. Sci. 1970, 14, 2839–2877. [Google Scholar] [CrossRef]
  34. Fraga, S.C.; Monteleone, M.; Lanč, M.; Esposito, E.; Fuoco, A.; Giorno, L.; Pilnáček, K.; Friess, K.; Carta, M.; McKeown, N.B.; et al. A novel time lag method for the analysis of mixed gas diffusion in polymeric membranes by on-line mass spectrometry: Method development and validation. J. Memb. Sci. 2018, 561, 39–58. [Google Scholar] [CrossRef]
  35. Mon, M.; Ferrando-Soria, J.; Verdaguer, M.; Train, C.; Paillard, C.; Dkhil, B.; Versace, C.; Bruno, R.; Armentano, D.; Pardo, E. Postsynthetic Approach for the Rational Design of Chiral Ferroelectric Metal–Organic Frameworks. J. Am. Chem. Soc. 2017, 139, 8098–8101. [Google Scholar] [CrossRef] [PubMed]
  36. Mon, M.; Bruno, R.; Tiburcio, E.; Grau-Atienza, A.; Sepúlveda-Escribano, A.; Ramos-Fernandez, E.V.; Fuoco, A.; Esposito, E.; Monteleone, M.; Jansen, J.C.; et al. Efficient Gas Separation and Transport Mechanism in Rare Hemilabile Metal–Organic Framework. Chem. Mater. 2019, 31, 5856–5866. [Google Scholar] [CrossRef]
  37. Monteleone, M.; Esposito, E.; Fuoco, A.; Lanč, M.; Pilnáček, K.; Friess, K.; Bezzu, C.; Carta, M.; McKeown, N.; Jansen, J.C. A Novel Time Lag Method for the Analysis of Mixed Gas Diffusion in Polymeric Membranes by On-Line Mass Spectrometry: Pressure Dependence of Transport Parameters. Membranes (Basel) 2018, 8, 73. [Google Scholar] [CrossRef] [PubMed] [Green Version]
  38. Jansen, J.C.; Friess, K.; Drioli, E. Organic vapour transport in glassy perfluoropolymer membranes: A simple semi-quantitative approach to analyze clustering phenomena by time lag measurements. J. Memb. Sci. 2011, 367, 141–151. [Google Scholar] [CrossRef]
  39. Teplyakov, V.; Meares, P. Correlation aspects of the selective gas permeabilities of polymeric materials and membranes. Gas. Sep. Purif. 1990, 4, 66–74. [Google Scholar] [CrossRef]
  40. Esposito, E.; Bruno, R.; Monteleone, M.; Fuoco, A.; Ferrando Soria, J.; Pardo, E.; Armentano, D.; Jansen, J.C. Glassy PEEK-WC vs. Rubbery Pebax®1657 Polymers: Effect on the Gas Transport in CuNi-MOF Based Mixed Matrix Membranes. Appl. Sci. 2020, 10, 1310. [Google Scholar] [CrossRef] [Green Version]
  41. Longo, M.; De Santo, M.P.; Esposito, E.; Fuoco, A.; Monteleone, M.; Giorno, L.; Jansen, J.C. Force spectroscopy determination of Young’s modulus in mixed matrix membranes. Polymer (Guildf) 2018, 156, 22–29. [Google Scholar] [CrossRef]
  42. Paul, D.R. Effect of immobilizing adsorption on the diffusion time lag. J. Polym. Sci. Part A-2 Polym. Phys. 1969, 7, 1811–1818. [Google Scholar] [CrossRef]
  43. Grzywna, Z.; Podkowka, J. Effect of immobilizing adsorption on mass transport through polymer films. J. Memb. Sci. 1981, 8, 23–31. [Google Scholar] [CrossRef]
  44. Fuoco, A.; Rizzuto, C.; Tocci, E.; Monteleone, M.; Esposito, E.; Budd, P.M.; Carta, M.; Comesaña-Gándara, B.; McKeown, N.B.; Jansen, J.C. The origin of size-selective gas transport through polymers of intrinsic microporosity. J. Mater. Chem. A 2019, 7, 20121–20126. [Google Scholar] [CrossRef]
Figure 1. Typical output curve of a time lag measurement performed on a constant volume/pressure increase instrument in a regime where the permeate pressure is negligible compared to the feed pressure.
Computation 08 00028 g001
Figure 2. (a) Pebax®1657 molecular structure and (b) perspective views of the porous structures of {Cu2[(S,S)-hismox]}·3CO2 determined by single-crystal X-ray diffraction containing CO2 [36]. (c) Building block of {Cu2[(S,S)-hismox]} showing in more detail the coordination of CO2.
Computation 08 00028 g002
Figure 3. Example of typical permeation curves for (a) CO2, (b) CH4, (c) O2, (d) N2, (e) H2, and (f) He in Pebax®1657/CuII2(S,S)-hismox in the pressure range 0.1 to 1 bar at 25 °C in the constant volume / pressure increase instrument.
Computation 08 00028 g003
Figure 4. Permeation curve in the Pebax®1657/CuII2(S,S)-hismox·MMM (mixed matrix membrane) at 1.2 bar and 25 °C for (a) CO2; (b) CH4; (c) O2; (d) N2; and their fits in dotted black lines using Equation (4).
Computation 08 00028 g004
Figure 5. Permeation curve in the Pebax®1657/CuII2(S,S)-hismox MMM at 1 bar for C2H6 (a) and C2H4 (b) and their fits using Equation (4). Alternative two-stage fit of the permeation curve of C2H4 with the first stage (c) and second stage (d) fits using Equation (8). The shaded area denotes the residuals of the fit of the start of the permeation curve and can be fitted as a typical time lag curve in the second stage.
Computation 08 00028 g005
Figure 6. Permeate flow rate in the variable volume/constant pressure instrument for MMMs based on Pebax®1657/CuII2(S,S)-hismox·using (a) the binary mixture CO2/CH4 (35/65 v/v) and (b) the binary mixture CO2/N2 (15/85 v/v) with the N2 signal displayed as the 5-point moving average for noise reduction. Fits are reported in dotted black lines and are calculated on the rough data using Equation (9). (c) Two-step fit CH4 permeation curve. Figure adapted from [36].
Computation 08 00028 g006
Figure 7. Correlation of the effective diffusion coefficient as a function of the molecular diameter of H2, He, N2, O2, CH4, CO2, C2H4, and C2H6 for neat Pebax®1657 (grey triangle, Computation 08 00028 i001
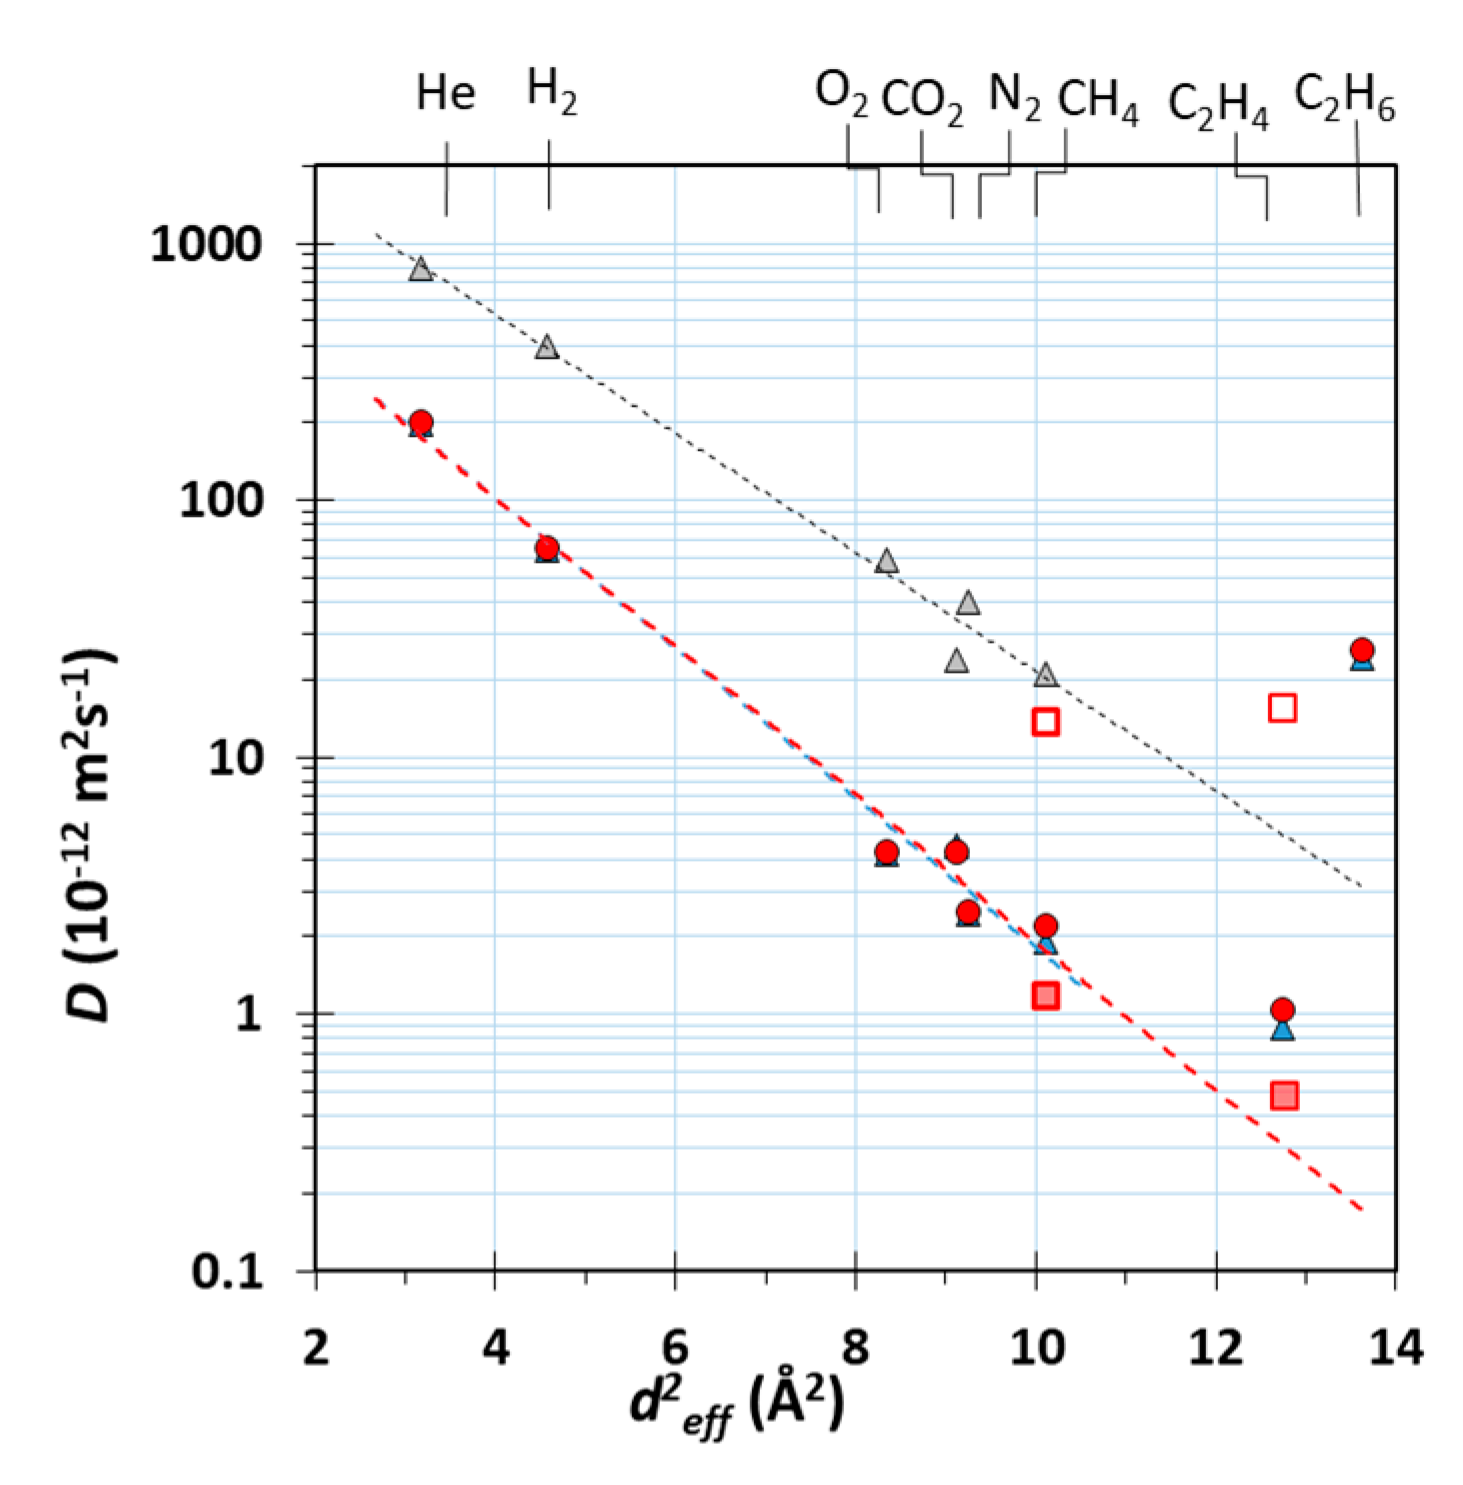
) and the Pebax®1657/CuII2(S,S)-hismox MMMs calculated via the tangent method (blue triangle, Computation 08 00028 i002) and the fitting procedure (filled circle, Computation 08 00028 i003). Filled square symbols ( Computation 08 00028 i004) indicate the slow term, and open square symbols ( Computation 08 00028 i005) indicate the fast term of the fit with two different effective diffusion coefficients.
Computation 08 00028 g007
Table 1. Permeability [Barrer], Diffusion coefficient [10−12 m2 s−1] and Solubility [cm3STP cm−3 bar−1] of the Pebax®1657/CuII2(S,S)-hismox mixed matrix membrane at 25 °C and 1 bar of feed pressure determined by the tangent and the fitting methods (double Time Lag).
Tangent MethodFitting Method
GasPDSP1P2D1D2S1S2
CH43.791.951.461.662.1113.51.190.091.32
C2H414.40.8712.46.497.9315.60.480.3112.3

