On the Application of Advanced Machine Learning Methods to Analyze Enhanced, Multimodal Data from Persons Infected with COVID-19


Abstract
:1. Introduction
2. Materials
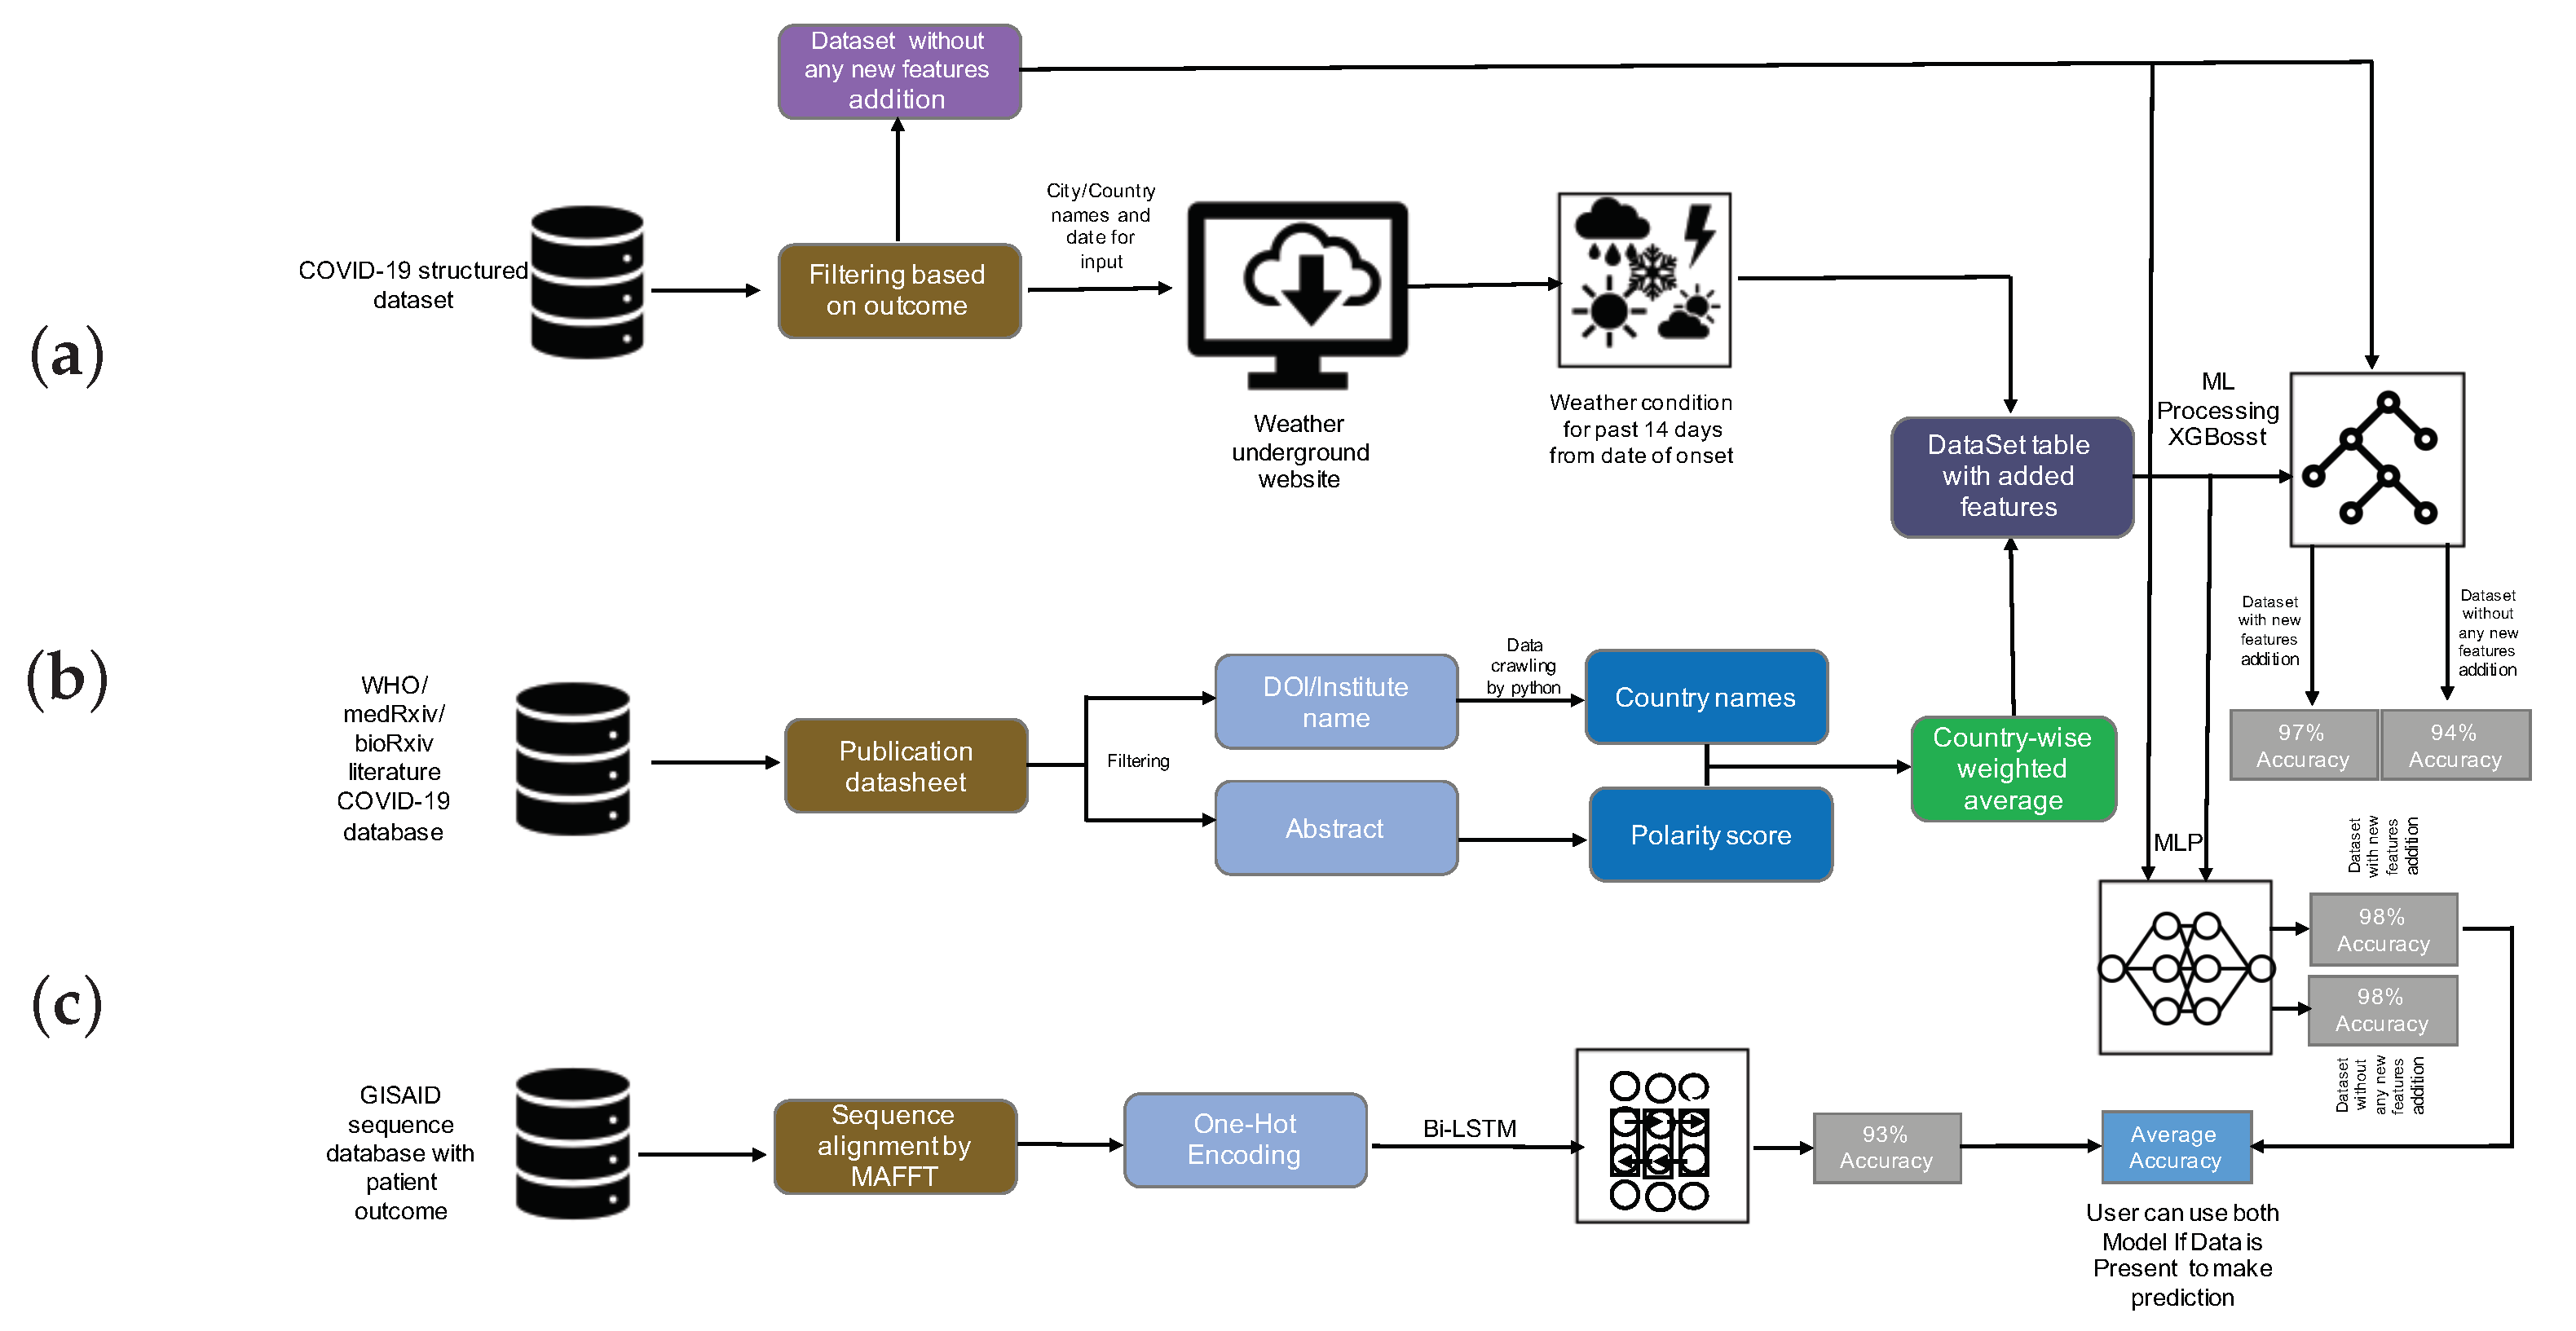
2.1. Data Collection
2.1.1. COVID-19 Structured Dataset
2.1.2. WHO, medRxiv, and bioRxiv COVID-19 Literature Database
2.1.3. GISAID CoV-19 Sequences Dataset
2.2. COVID-19-Enhanced Structured Dataset
2.3. Addition Feature Construction
2.4. Data Processing
2.4.1. Structured Data
2.4.2. Sequence Data
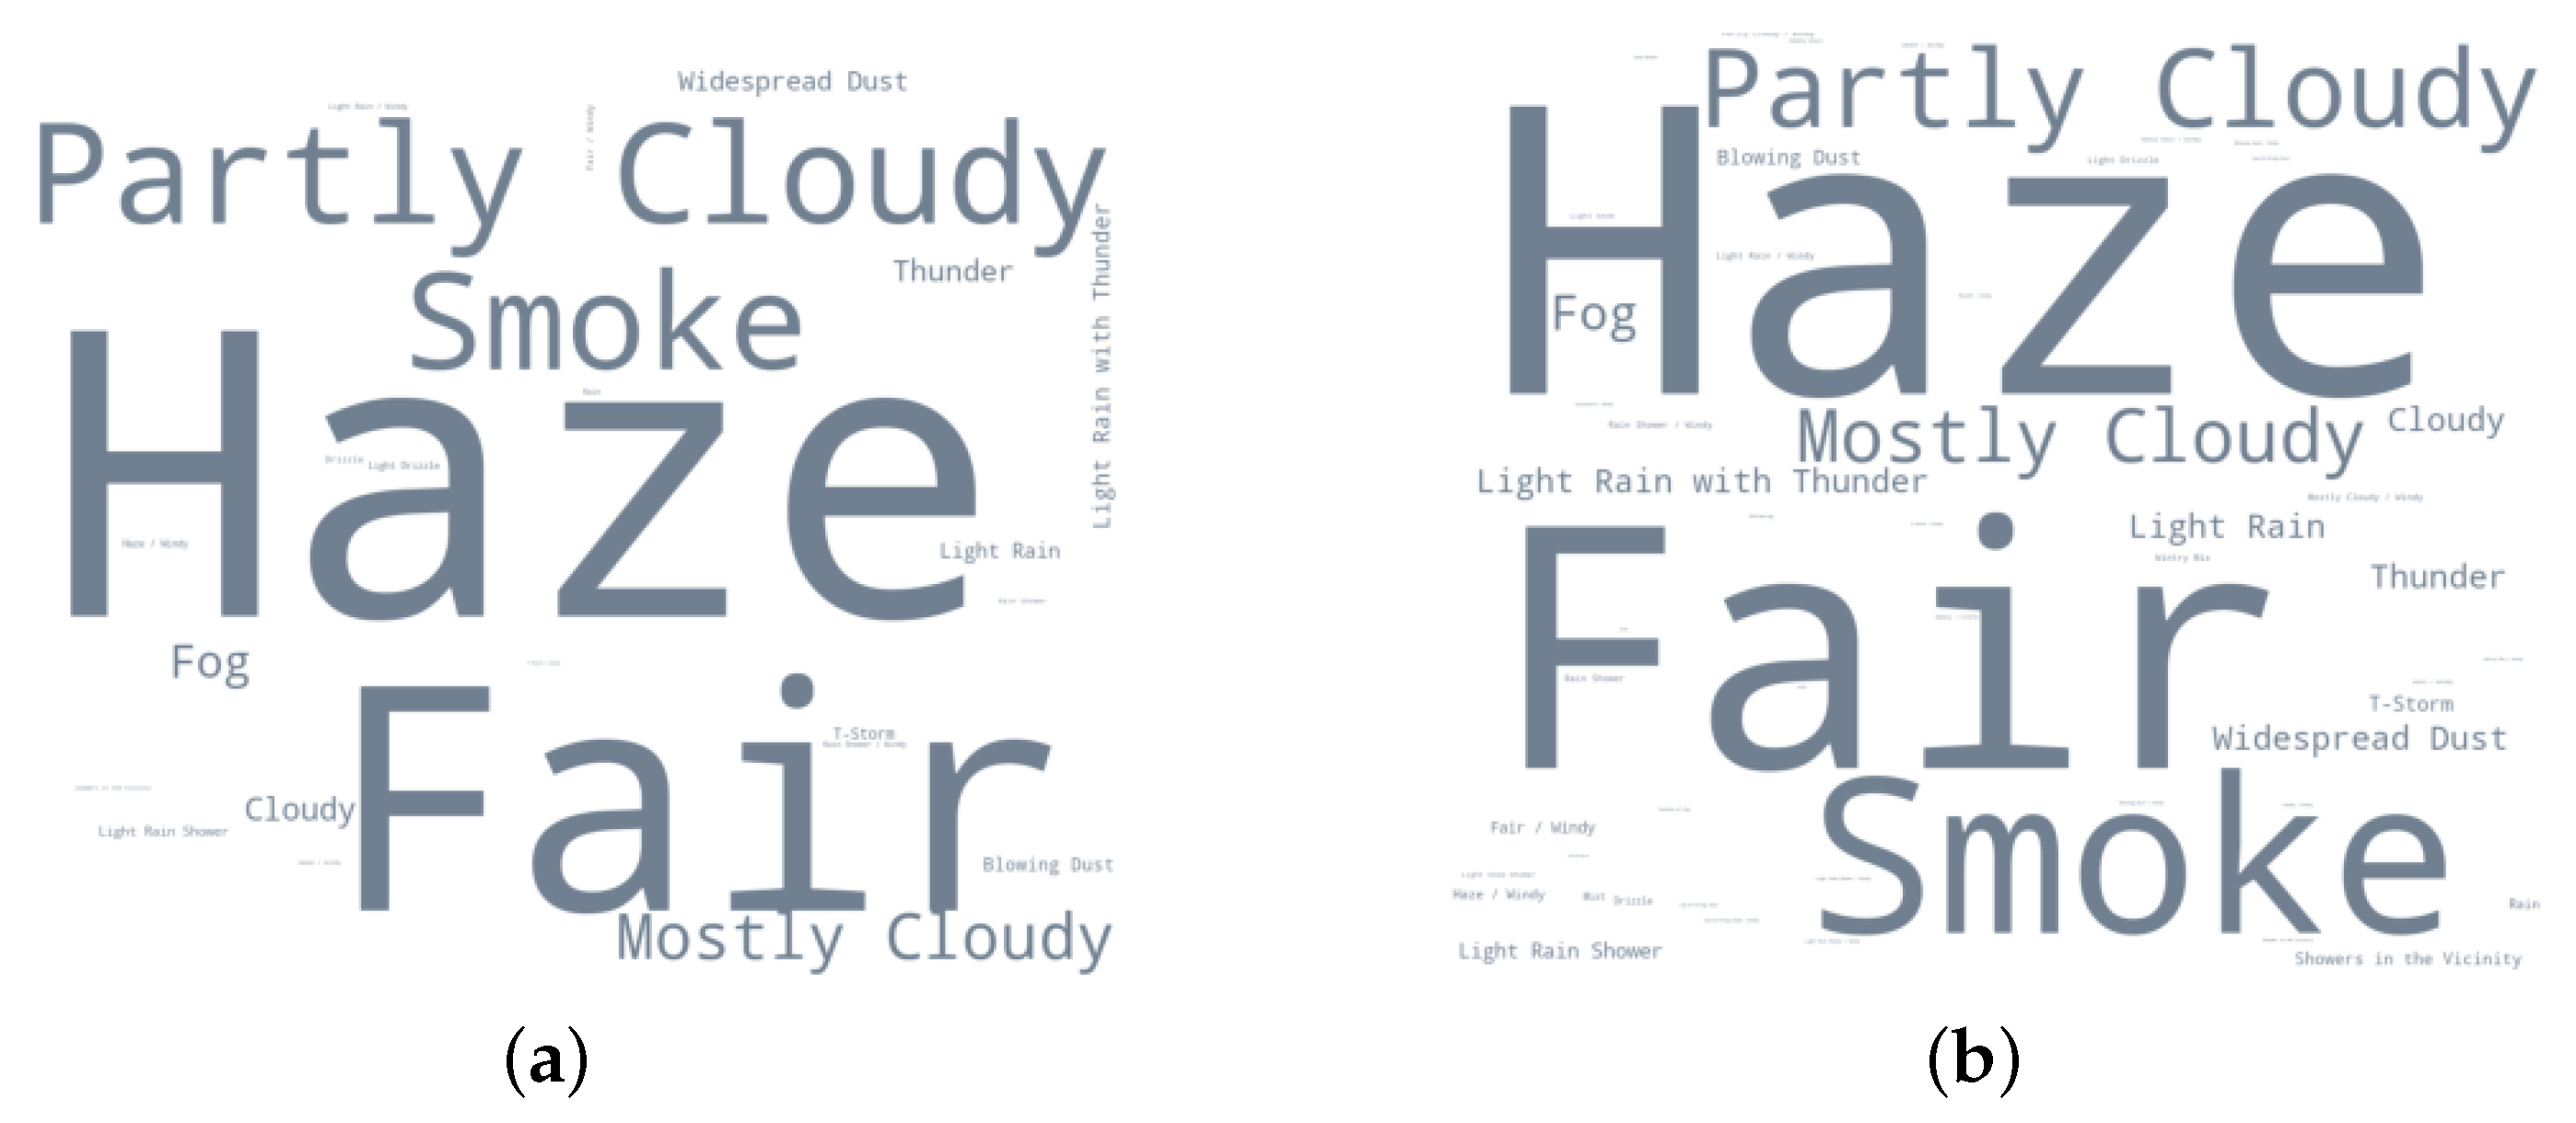
2.5. Data Statistics
3. Methods and Experiment
3.1. Sentiment Analysis
3.2. Machine Learning Algorithm
3.3. Deep Learning Algorithms
3.3.1. Multi-Layer Perceptron
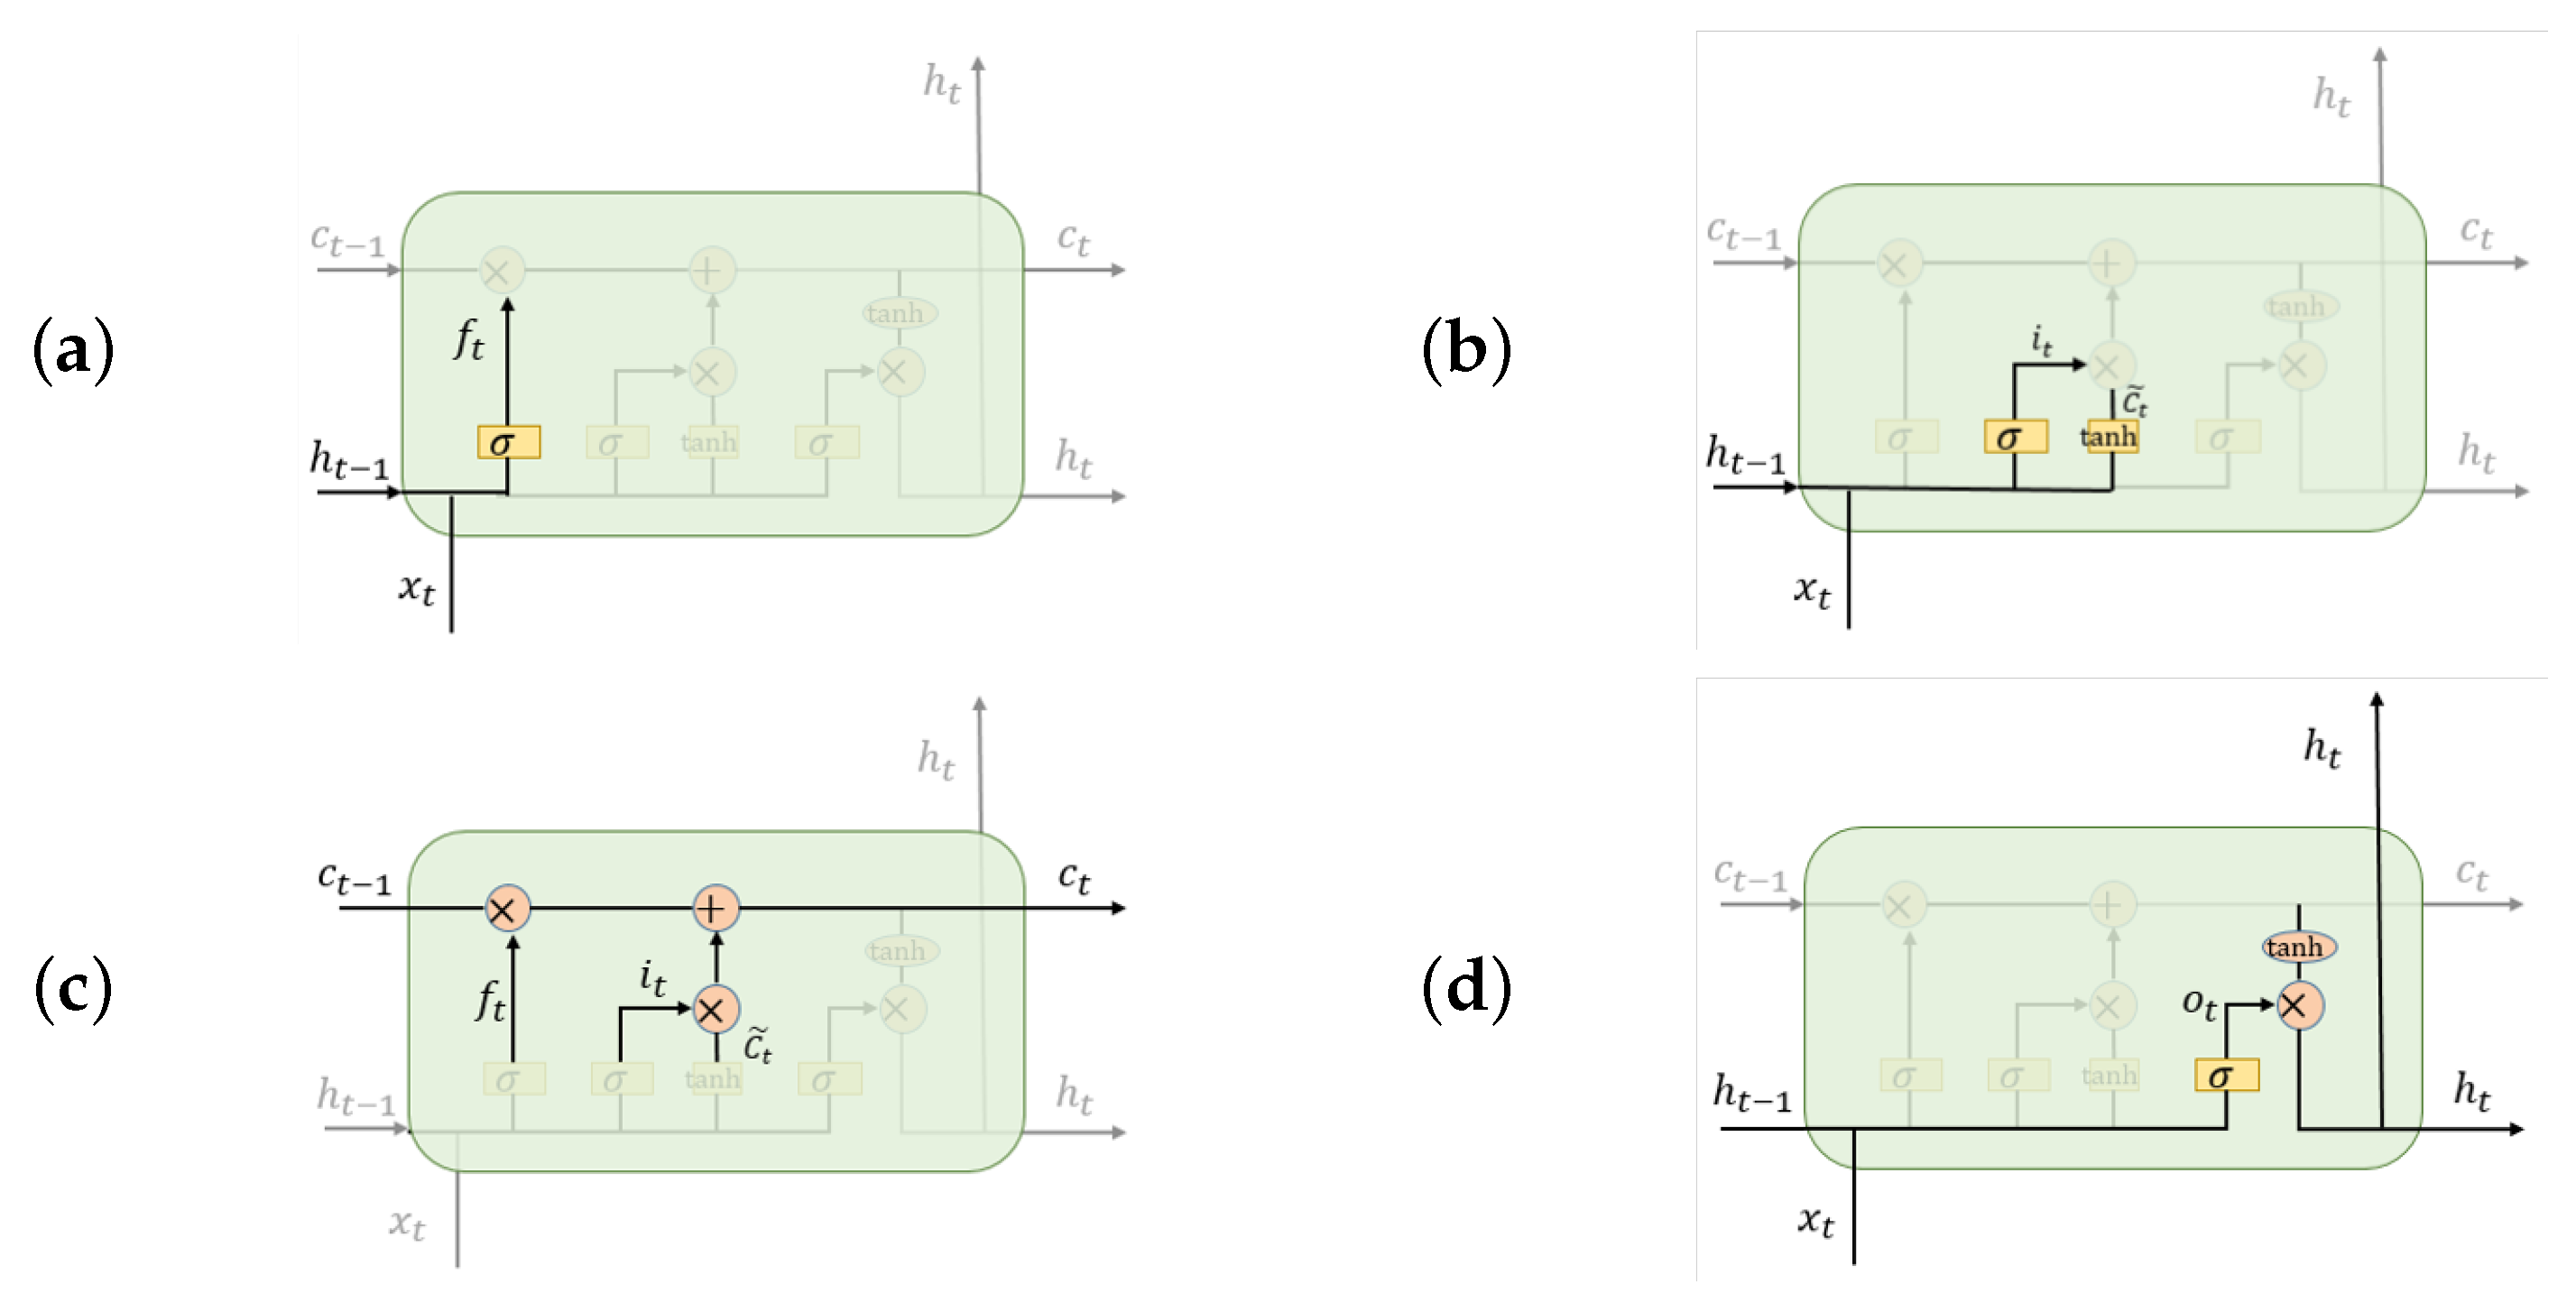
3.3.2. Bidirectional Long Short-Term Memory
3.4. Implementation
3.4.1. Machine Learning Algorithms
3.4.2. Deep Learning Algorithms
4. Results
4.1. Machine Learning Model
4.2. Deep Learning Model
5. Discussion and Conclusions
Supplementary Materials
Author Contributions
Funding
Institutional Review Board Statement
Informed Consent Statement
Data Availability Statement
Acknowledgments
Conflicts of Interest
Abbreviations
| COVID-19 | coronavirus disease |
| SARS-CoV-2 | severe acute respiratory syndrome coronavirus 2 |
| ARIMA | Autoregressive Integrated Moving Average model |
| Bi-LSTM | Bidirectional Long Short-Term Memory |
| LSTM | Long Short-Term Memory |
| MLP | Multi-Layer Perceptron |
| NLP | Natural Language Processing |
| WHO | World Health Organization |
| NCBI | National Center for Biotechnology Information |
| GISAID | Global initiative on sharing all influenza data |
| RNN | Recurrent Neural Network |
| SVR | Support Vector Regression |
| XGBoost | Extreme Gradient Boosting |
References
- WHO Coronavirus Disease (COVID-19) Dashboard. Available online: https://covid19.who.int/ (accessed on 5 January 2021).
- Torales, J.; O’Higgins, M.; Castaldelli-Maia, J.M.; Ventriglio, A. The outbreak of COVID-19 coronavirus and its impact on global mental health. Int. J. Soc. Psychiatry 2020, 31, 0020764020915212. [Google Scholar] [CrossRef] [Green Version]
- Singh, J.; Singh, J. COVID-19 and its impact on society. Electron. Res. J. Soc. Sci. Humanit. 2020, 2, 102–105. [Google Scholar]
- Holmes, E.A.; O’Connor, R.C.; Perry, V.H.; Tracey, I.; Wessely, S.; Arseneault, L.; Ballard, C.; Christensen, H.; Silver, R.C.; Everall, I.; et al. Multidisciplinary research priorities for the COVID-19 pandemic: A call for action for mental health science. Lancet Psychiatry 2020, 7, 547–560. [Google Scholar] [CrossRef]
- Lalmuanawma, S.; Hussain, J.; Chhakchhuak, L. Applications of machine learning and artificial intelligence for Covid-19 (SARS-CoV-2) pandemic: A review. Chaos Solitons Fractals 2020, 139, 110059. [Google Scholar] [CrossRef] [PubMed]
- Ramchandani, A.; Fan, C.; Mostafavi, A. Deepcovidnet: An interpretable deep learning model for predictive surveillance of covid-19 using heterogeneous features and their interactions. IEEE Access 2020, 8, 159915–159930. [Google Scholar] [CrossRef]
- Wang, P.; Zheng, X.; Li, J.; Zhu, B. Prediction of epidemic trends in COVID-19 with logistic model and machine learning technics. Chaos Solitons Fractals 2020, 139, 110058. [Google Scholar] [CrossRef] [PubMed]
- Mirri, S.; Delnevo, G.; Roccetti, M. Is a COVID-19 Second Wave Possible in Emilia-Romagna (Italy)? Forecasting a Future Outbreak with Particulate Pollution and Machine Learning. Computation 2020, 8, 74. [Google Scholar] [CrossRef]
- Alakus, T.B.; Turkoglu, I. Comparison of deep learning approaches to predict COVID-19 infection. Chaos Solitons Fractals 2020, 140, 110120. [Google Scholar] [CrossRef]
- Shahid, F.; Zameer, A.; Muneeb, M. Predictions for COVID-19 with deep learning models of LSTM, GRU and Bi-LSTM. Chaos Solitons Fractals 2020, 140, 110212. [Google Scholar] [CrossRef]
- Tuli, S.; Tuli, S.; Tuli, R.; Gill, S.S. Predicting the Growth and Trend of COVID-19 Pandemic using Machine Learning and Cloud Computing. Internet Things 2020, 11, 100222. [Google Scholar] [CrossRef]
- Elaziz, M.A.; Hosny, K.M.; Salah, A.; Darwish, M.M.; Lu, S.; Sahlol, A.T. New machine learning method for image-based diagnosis of COVID-19. PLoS ONE 2020, 15, e0235187. [Google Scholar] [CrossRef] [PubMed]
- Barstugan, M.; Ozkaya, U.; Ozturk, S. Coronavirus (Covid-19) classification using ct images by machine learning methods. arXiv 2020, arXiv:2003.09424. [Google Scholar]
- Yan, L.; Zhang, H.-T.; Goncalves, J.; Xiao, Y.; Wang, M.; Guo, Y.; Sun, C.; Tang, X.; Jing, L.; Zhang, M. An interpretable mortality prediction model for COVID-19 patients. Nat. Mach. Intell. 2020, 2, 283–288. [Google Scholar] [CrossRef]
- Narin, A.; Kaya, C.; Pamuk, Z. Automatic detection of coronavirus disease (COVID-19) using X-ray images and deep convolutional neural networks. arXiv 2020, arXiv:2003.10849. [Google Scholar]
- Magar, R.; Yadav, P.; Farimani, A.B. Potential neutralizing antibodies discovered for novel corona virus using machine learning. arXiv 2020, arXiv:22003.08447. [Google Scholar]
- Xu, B.; Gutierrez, B.; Mekaru, S.; Sewalk, K.; Goodwin, L.; Loskill, A.; Cohn, E.L.; Hswen, Y.; Hill, S.C.; Cobo, M.M.; et al. Epidemiological data from the COVID-19 outbreak, real-time case information. Sci. Data 2020, 7. [Google Scholar] [CrossRef]
- Lin, K.; Fong, D.Y.T.; Zhu, B.; Karlberg, J. Environmental factors on the SARS epidemic: Air temperature, passage of time and multiplicative effect of hospital infection. Epidemiol. Infect. 2006, 134, 223–230. [Google Scholar] [CrossRef] [PubMed] [Green Version]
- Lowen, A.C.; Mubareka, S.; Steel, J.; Palese, P. Influenza virus transmission is dependent on relative humidity and temperature. PLoS Pathog. 2007, 3, 151. [Google Scholar] [CrossRef]
- Tan, J.; Mu, L.; Huang, J.; Yu, S.; Chen, B.; Yin, J. An initial investigation of the association between the SARS outbreak and weather: With the view of the environmental temperature and its variation. J. Epidemiol. Community Health 2005, 59, 186–192. [Google Scholar] [CrossRef] [Green Version]
- Prata, D.N.; Rodrigues, W.; Bermejo, P.H. Temperature significantly changes COVID-19 transmission in (sub)tropical cities of brazil. Sci. Total. Environ. 2020, 729, 138862. [Google Scholar] [CrossRef]
- Jamil, T.; Alam, I.; Gojobori, T.; Duarte, C.M. No evidence for temperature-dependence of the COVID-19 epidemic. Front. Public Health 2020, 8, 436. [Google Scholar] [CrossRef] [PubMed]
- Xie, J.; Zhu, Y. Association between ambient temperature and COVID-19 infection in 122 cities from China. Sci. Total. Environ. 2020, 724, 138201. [Google Scholar] [CrossRef] [PubMed]
- Demongeot, J.; Flet-Berliac, Y.; Seligmann, H. Temperature decreases spread parameters of the new COVID-19 case dynamics. association between ambient temperature and COVID-19 infection in 122 cities from China. Biology 2020, 9, 94. [Google Scholar] [CrossRef]
- Aslam, F.; Awan, T.M.; Syed, J.H.; Kashif, A.; Parveen, M. Sentiments and emotions evoked bynews headlines of coronavirus disease (covid-19) outbreak. Humanit. Soc. Sci. Commun. 2020, 7, 1–9. [Google Scholar] [CrossRef]
- Hung, M.; Lauren, E.; Hon, E.S.; Birmingham, W.C.; Xu, J.; Su, S.; Hon, S.D.; Park, J.; Dang, P.; Lipsky, M.S. Social network analysis of covid-19 sentiments: Application of artificial intelligence. J. Med. Internet Res. 2020, 22, e22590. [Google Scholar] [CrossRef]
- Samuel, J.; Ali, G.G.; Rahman, M.; Esawi, E.; Samuel, Y. Covid-19 public sentiment insights and machine learning for tweets classification. Information 2020, 11, 314. [Google Scholar] [CrossRef]
- Souza, F.S.H.; Hojo-Souza, N.S.; Santos, E.B.; Silva, C.M.; Guidoni, D.L. Predicting the disease outcome in COVID-19 positive patients through Machine Learning: A retrospective cohort study with Brazilian data. medRxiv 2020. [Google Scholar] [CrossRef]
- Pinter, G.; Felde, I.; Mosavi, A.; Ghamisi, P.; Gloaguen, R. COVID-19 Pandemic Prediction for Hungary: A Hybrid Machine Learning Approach. Mathematics 2020, 8, 890. [Google Scholar] [CrossRef]
- Arora, P.; Kumar, H.; Panigrahi, B.K. Prediction and analysis of COVID-19 positive cases using deep learning models: A descriptive case study of India. Chaos Solitons Fractals 2020, 139, 110017. [Google Scholar] [CrossRef]
- Toyoshima, Y.; Nemoto, K.; Matsumoto, S.; Nakamura, Y.; Kiyotani, K. SARS-CoV-2 genomic variations associated with mortality rate of COVID-19. J. Hum. Genet. 2020, 65, 1075–1082. [Google Scholar] [CrossRef]
- Mercatelli, D.; Giorgi, F.M. Geographic and genomic distribution of SARS-CoV-2 mutations. Front. Microbiol. 2020. [Google Scholar] [CrossRef] [PubMed]
- Bhonde, S.; Bhati, M.; Prasad, J. Predictive Analytics to Combat with COVID-19 Using Genome Sequencing. 2020. Available online: https://ssrn.com/abstract=3580692 (accessed on 5 January 2021).
- Machine Learning for Biology: How Will COVID-19 Mutate Next? Available online: https://towardsdatascience.com/machine-learning-for-biology-how-will-covid-19-mutate-next-4df93cfaf544 (accessed on 5 January 2021).
- National Center for Biotechnology Information. Available online: https://0-www-ncbi-nlm-nih-gov.brum.beds.ac.uk/ (accessed on 5 January 2021).
- Elbe, S.; Buckland-Merrett, G. Data, disease and diplomacy: GISAID’s innovative contribution to global health. Glob. Challenges 2017, 1, 33–46. [Google Scholar] [CrossRef] [PubMed] [Green Version]
- Shu, Y.; McCauley, J. GISAID: Global initiative on sharing all influenza data–from vision to reality. Eurosurveillance 2017, 22, 13. [Google Scholar] [CrossRef] [PubMed] [Green Version]
- Weather Underground. Available online: https://www.wunderground.com/ (accessed on 5 January 2021).
- nCoV2019. Available online: https://github.com/beoutbreakprepared/nCoV2019/tree/master/latest_data (accessed on 5 January 2021).
- Global Research on Coronavirus Disease (COVID-19). Available online: https://www.who.int/emergencies/diseases/novel-coronavirus-2019/global-research-on-novel-coronavirus-2019-ncov (accessed on 5 January 2021).
- medRxiv. Available online: https://www.medrxiv.org/ (accessed on 5 January 2021).
- bioRxiv. Available online: https://www.biorxiv.org/ (accessed on 5 January 2021).
- API Summary for the Collection of COVID-19 SARS-CoV-2 Preprints from medRxiv and bioRxiv. Available online: https://api.biorxiv.org/covid19/help (accessed on 5 January 2021).
- Google Map. Available online: https://www.google.com/maps/ (accessed on 5 January 2021).
- WIKIPEDIA. Available online: https://www.wikipedia.org/ (accessed on 5 January 2021).
- NCBI Accession MN908947.3. Available online: https://0-www-ncbi-nlm-nih-gov.brum.beds.ac.uk/search/all/?term=MN908947 (accessed on 5 January 2021).
- Wu, F.; Zhao, S.; Yu, B.; Chen, Y.M.; Wang, W.; Song, Z.G.; Hu, Y.; Tao, Z.W.; Tian, J.H.; Pei, Y.Y.; et al. A new coronavirus associated with human respiratory disease in China. Nature 2020, 579, 265269. [Google Scholar] [CrossRef] [Green Version]
- Triplett, M. Evidence that higher temperatures are associated with lower incidence of COVID-19 in pandemic state, cumulative cases reported up to March 27, 2020. medRxiv 2020. [Google Scholar] [CrossRef] [Green Version]
- Katoh, K.; Standley, D.M. MAFFT multiple sequence alignment software version 7: Improvements in performance and usability. Mol. Biol. Evol. 2013, 30, 772–780. [Google Scholar] [CrossRef] [Green Version]
- Chawla, N.V.; Bowyer, K.W.; Hall, L.O.; Kegelmeyer, W.P. SMOTE: Synthetic minority over-sampling technique. J. Artif. Intell. Res. 2020, 16, 321–357. [Google Scholar] [CrossRef]
- Alessa, A.; Faezipour, M. A review of influenza detection and prediction through social networking sites. Theor. Biol. Med Model. 2018, 15, 2. [Google Scholar] [CrossRef] [Green Version]
- Lee, K.; Agrawal, A.; Choudhary, A. Forecasting influenza levels using real-time social media streams. In Proceedings of the 2017 IEEE International Conference on Healthcare Informatics (ICHI), Park City, UT, USA, 23–26 August 2017; pp. 409–414. [Google Scholar]
- Wang, Y.; Xu, K.; Kang, Y.; Wang, H.; Wang, F.; Avram, A. Regional influenza prediction with sampling Twitter data and PDE model. Int. J. Environ. Res. Public Health 2020, 17, 678. [Google Scholar] [CrossRef] [Green Version]
- TextBlob. Available online: https://github.com/sloria/TextBlob (accessed on 5 January 2021).
- Chen, T.; Guestrin, C. Xgboost: A scalable tree boosting system. In Proceedings of the 22nd ACM Sigkdd International Conference on Knowledge Discovery and Data Mining; ACM: New York, NY, USA, 2016; pp. 785–794. [Google Scholar]
- Elman, J.L. Finding structure in time. Cogn. Sci. 1990, 14, 179–211. [Google Scholar] [CrossRef]
- Hochreiter, S.; Schmidhuber, J. Long short-term memory. Neural Comput. 1997, 9, 1735–1780. [Google Scholar] [CrossRef] [PubMed]
- Verity, R.; Okell, L.C.; Dorigatti, I.; Winskill, P.; Whittaker, C.; Imai, N.; Cuomo-Dannenburg, G.; Thompson, H.; Walker, P.G.; Fu, H.; et al. Estimates of the severity of coronavirus disease 2019: A model-based analysis. Lancet Infect. Dis. 2020. [Google Scholar] [CrossRef]
- Glynn, J.R. Protecting workers aged 60–69 years from COVID-19. Lancet Infect. Dis. 2020. [Google Scholar] [CrossRef]
- Wang, H.; Li, T.; Barbarino, P.; Gauthier, S.; Brodaty, H.; Molinuevo, J.L.; Xie, H.; Sun, Y.; Yu, E. Dementia care during COVID-19. Lancet 2020, 395, 1190–1191. [Google Scholar] [CrossRef]
- Armitage, R.; Nellums, L.B. COVID-19 and the consequences of isolating the elderly. Lancet Public Health 2020, 5, e256. [Google Scholar] [CrossRef] [Green Version]
- Korber, B.; Fischer, W.M.; Gnanakaran, S.; Yoon, H.; Theiler, J.; Abfalterer, W.; Hengartner, N.; Giorgi, E.E.; Bhattacharya, T.; Foley, B.; et al. Tracking changes in SARS-CoV-2 Spike: Evidence that D614G increases infectivity of the COVID-19 virus. Cell 2020, 182, 812–827. [Google Scholar] [CrossRef]


| Enhanced Data | After Oversampling | |||
|---|---|---|---|---|
| Training Set | Test Set | Training Set | Test Set | |
| Positive samples | 236,483 | 59,117 | 236,483 | 59,117 |
| Negative samples | 4607 | 1156 | 23,648 | 1156 |
| Total | 241,090 | 60,273 | 260,131 | 60,273 |
| Model | Dataset | Acc. | AUC | F1 Score | Recall | Prec. |
|---|---|---|---|---|---|---|
| XGBoost | Initial structured dataset | 0.94 | 0.61 | 0.97 | 0.96 | 0.98 |
| Enhanced structured dataset | 0.97 | 0.77 | 0.99 | 0.99 | 0.98 | |
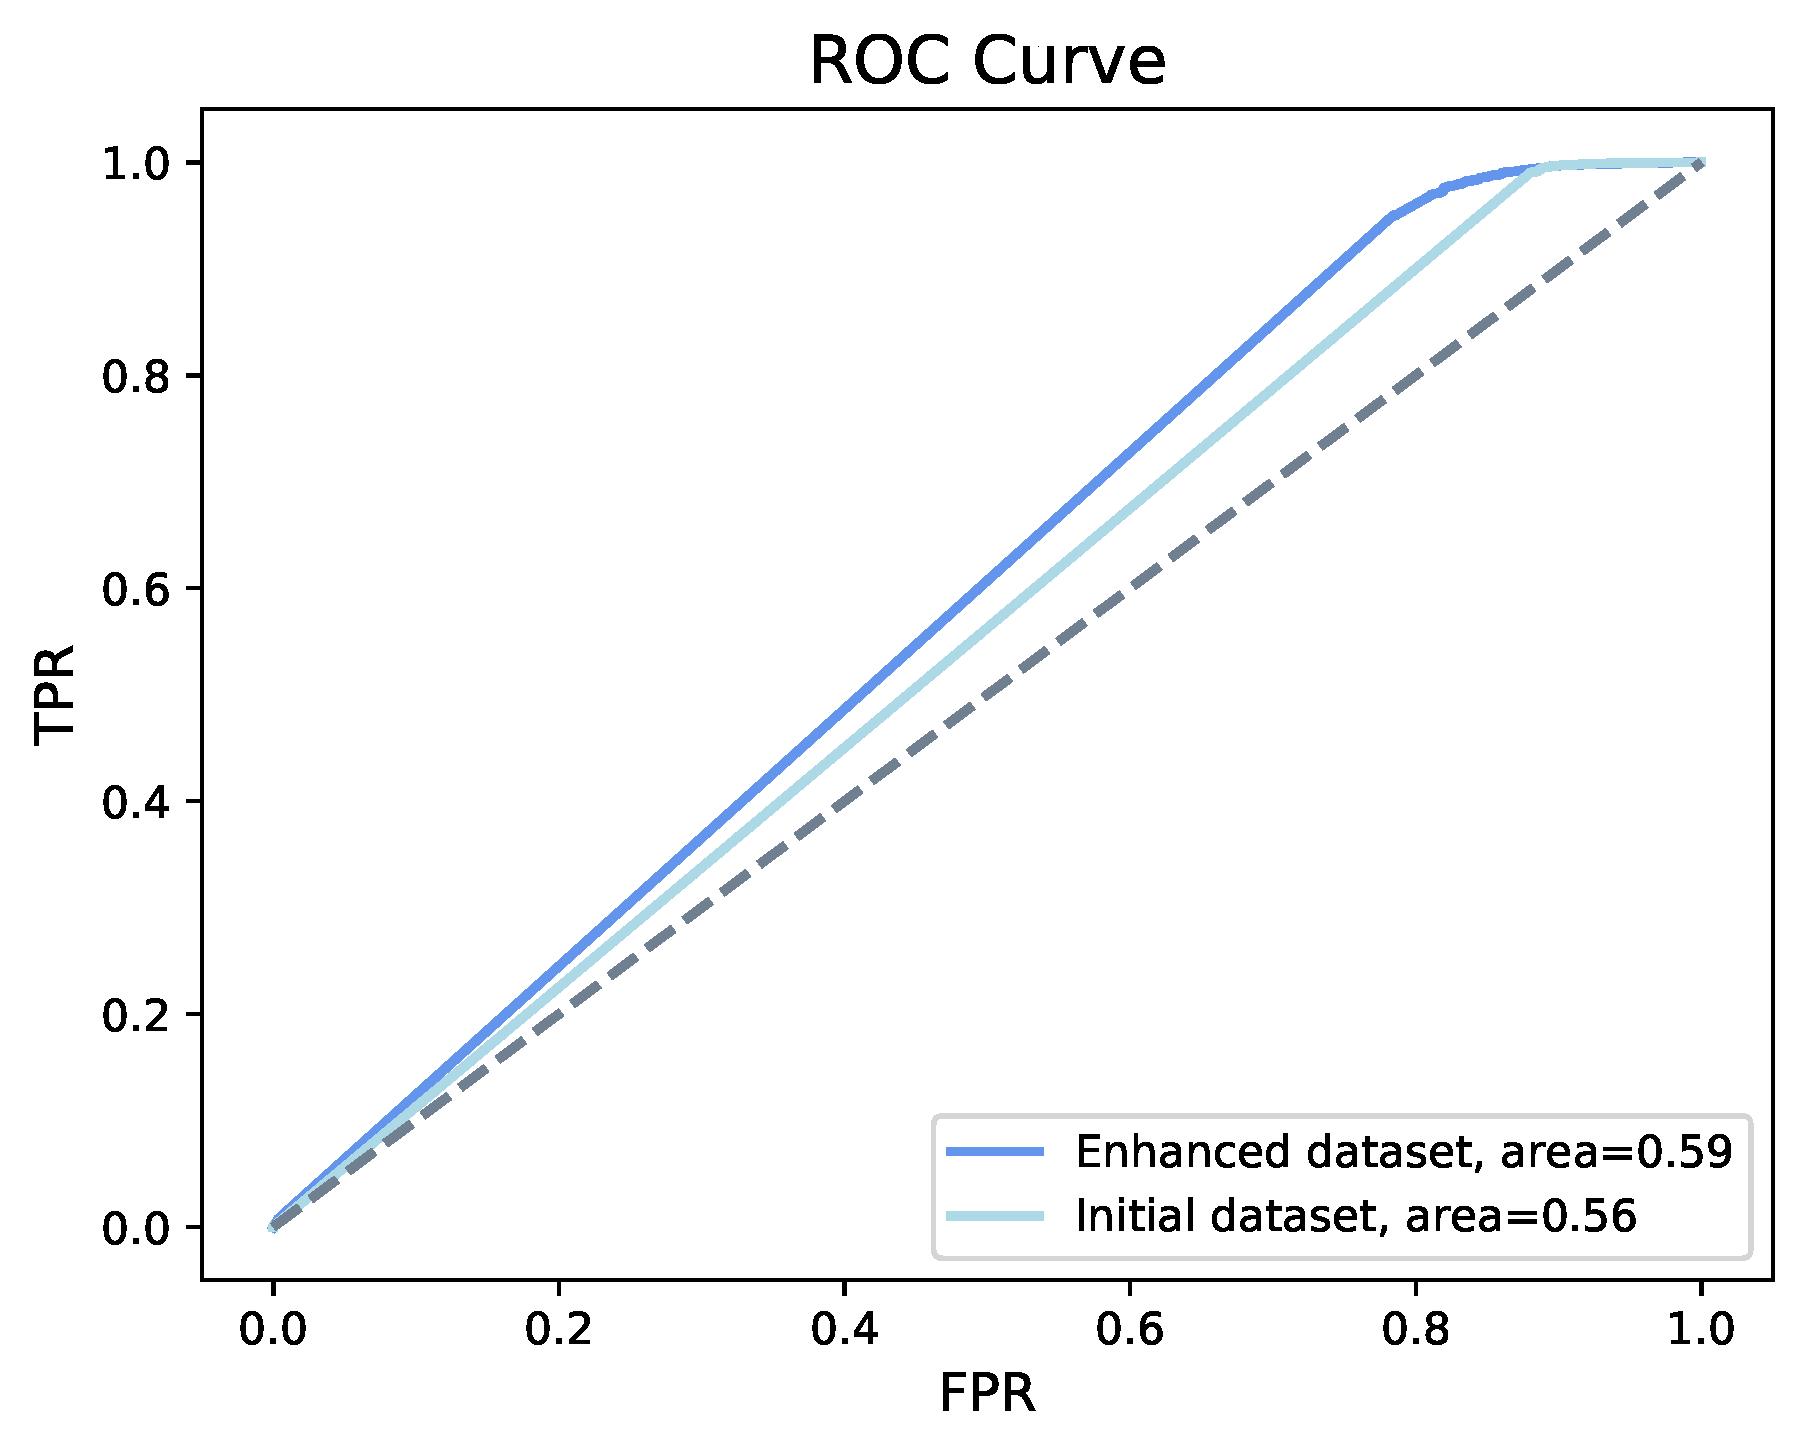
| MLP | Initial structured dataset | 0.98 | 0.56 | 0.99 | 1.0 | 0.98 |
| Enhanced structured dataset | 0.98 | 0.59 | 0.99 | 1.0 | 0.98 | |
| Bi-LSTM | Sequence dataset | 0.93 | 0.73 | 0.96 | 1.0 | 0.93 |
| Model | Dataset | Acc. | AUC | F1 Score | Recall | Prec. |
|---|---|---|---|---|---|---|
| XGBoost | Initial structured dataset | 0.96 | 0.60 | 0.15 | 0.19 | 0.12 |
| Enhanced structured dataset | 0.98 | 0.77 | 0.20 | 0.13 | 0.50 | |
| MLP | Initial structured dataset | 0.98 | 0.55 | 0.15 | 0.11 | 0.21 |
| Enhanced structured dataset | 0.98 | 0.59 | 0.13 | 0.21 | 0.10 | |
| Bi-LSTM | Sequence dataset | 0.93 | 0.64 | 0.21 | 0.35 | 0.14 |
Publisher’s Note: MDPI stays neutral with regard to jurisdictional claims in published maps and institutional affiliations. |
© 2021 by the authors. Licensee MDPI, Basel, Switzerland. This article is an open access article distributed under the terms and conditions of the Creative Commons Attribution (CC BY) license (http://creativecommons.org/licenses/by/4.0/).
Share and Cite
Zeng, W.; Gautam, A.; Huson, D.H. On the Application of Advanced Machine Learning Methods to Analyze Enhanced, Multimodal Data from Persons Infected with COVID-19. Computation 2021, 9, 4. https://0-doi-org.brum.beds.ac.uk/10.3390/computation9010004
Zeng W, Gautam A, Huson DH. On the Application of Advanced Machine Learning Methods to Analyze Enhanced, Multimodal Data from Persons Infected with COVID-19. Computation. 2021; 9(1):4. https://0-doi-org.brum.beds.ac.uk/10.3390/computation9010004
Chicago/Turabian StyleZeng, Wenhuan, Anupam Gautam, and Daniel H. Huson. 2021. "On the Application of Advanced Machine Learning Methods to Analyze Enhanced, Multimodal Data from Persons Infected with COVID-19" Computation 9, no. 1: 4. https://0-doi-org.brum.beds.ac.uk/10.3390/computation9010004