


Inverse Trigonometric Fuzzy Preference Programming to Generate Weights with Optimal Solutions Implemented on Evaluation Criteria in E-Learning

Abstract
:1. Introduction
2. Related Work
3. Research Methodology
3.1. Data Collection
3.2. Experiment
3.3. Inverse Trigonometric Fuzzy Preference Programming
3.4. Example
4. Results and Discussion
4.1. Result Comparison
4.2. Implementation of the Proposed Method
5. Conclusions and Future Work
Author Contributions
Funding
Data Availability Statement
Acknowledgments
Conflicts of Interest
References
- Nielsen, J.; Molich, R. Heuristic evaluation of user interfaces. In Proceedings of the SIGCHI Conference on Human Factors in Computing Systems Empowering People—CHI ’90, Seattle, WA, USA, 1–5 April 1990; ACM Press: New York, NY, USA, 1990; pp. 249–256. [Google Scholar] [CrossRef]
- Nielsen, J. Usability Inspection. In Proceedings of the SIGCHI Conference on Human Factors in Computing Systems—CHI ’94, Boston, MA, USA, 24–28 April 1994; pp. 413–414. [Google Scholar]
- Chen, S.Y.; Macredie, R.D. The assessment of usability of electronic shopping: A heuristic evaluation. Int. J. Inf. Manag. 2005, 25, 516–532. [Google Scholar] [CrossRef]
- Paz, F.; Pow-Sang, J.A.; Collantes, L. Usability Heuristics for Transactional Web Sites. In Proceedings of the 2014 11th International Conference on Information Technology: New Generations, Las Vegas, NV, USA, 7–9 April 2014; pp. 627–628. [Google Scholar] [CrossRef]
- Dowding, D.; Merrill, J.A. The Development of Heuristics for Evaluation of Dashboard Visualizations. Appl. Clin. Inform. 2018, 9, 511–518. [Google Scholar] [CrossRef] [PubMed]
- de Jong, M.; Lentz, L. Scenario evaluation of municipal Web sites: Development and use of an expert-focused evaluation tool. Gov. Inf. Q. 2006, 23, 191–206. [Google Scholar] [CrossRef]
- Kamper, R.J. Extending the Usability of Heuristics for Design and Evaluation: Lead, Follow, and Get Out of the Way. Int. J. Hum.-Comput. Interact. 2002, 14, 447–462. [Google Scholar] [CrossRef]
- Moraes, M.C.; Silveira, M.S. How am I ? Guidelines for Animated Interface Agents Evaluation. In Proceedings of the IEEE/WIC/ACM International Conference on Intelligent Agent Technology (IAT’06), Hong Kong, China, 18–22 December 2006; pp. 17–20. [Google Scholar]
- Clarkson, E.; Arkin, R.C. Applying Heuristic Evaluation to Human-Robot Interaction Systems. 2007. Available online: https://sites.cc.gatech.edu/ai/robot-lab/online-publications/ClarksonArkinTechReport2006.pdf (accessed on 29 February 2024).
- Mtebe, J.; Kissaka, M. Heuristics for Evaluating Usability of Learning Management Systems in Africa. In Proceedings of the 2015 IST-Africa Conference, Lilongwe, Malawi, 6–8 May 2015; pp. 1–13. [Google Scholar]
- Hermawati, S.; Lawson, G. Establishing usability heuristics for heuristics evaluation in a specific domain: Is there a consensus? Appl. Ergon. 2016, 56, 34–51. [Google Scholar] [CrossRef] [PubMed]
- Muhanna, M.A.; Amro, R.N.; Qusef, A. Using a new set of heuristics in evaluating Arabic interfaces. J. King Saud Univ.-Comput. Inf. Sci. 2018, 32, 248–253. [Google Scholar] [CrossRef]
- Saaty, T.L. How to make a decision: The Analytic Hierarchy Process. Eur. J. Oper. Res. 1990, 48, 9–26. [Google Scholar] [CrossRef]
- Saaty, T.L. There is no mathematical validity for using fuzzy number crunching in the analytic hierarchy process. J. Syst. Sci. Syst. Eng. 2006, 15, 457–464. [Google Scholar] [CrossRef]
- Dey, P.K. Managing project risk using combined analytic hierarchy process and risk map. Appl. Soft Comput. 2010, 10, 990–1000. [Google Scholar] [CrossRef]
- Ivanco, M.; Hou, G.; Michaeli, J. Sensitivity analysis method to address user disparities in the analytic hierarchy process. Expert Syst. Appl. 2017, 90, 111–126. [Google Scholar] [CrossRef]
- Mekouar, S. Classifiers selection based on analytic hierarchy process and similarity score for spam identification. Appl. Soft Comput. 2021, 113, 108022. [Google Scholar] [CrossRef]
- Bai, B.; Xie, C.; Liu, X.; Li, W.; Zhong, W. Application of integrated factor evaluation–analytic hierarchy process–T-S fuzzy fault tree analysis in reliability allocation of industrial robot systems. Appl. Soft Comput. 2022, 115, 108248. [Google Scholar] [CrossRef]
- Chang, D.-Y. Applications of the extent analysis method on fuzzy AHP. Eur. J. Oper. Res. 1996, 95, 649–655. [Google Scholar] [CrossRef]
- van Laarhoven, P.; Pedrycz, W. A fuzzy extension of Saaty’s priority theory. Fuzzy Sets Syst. 1983, 11, 229–241. [Google Scholar] [CrossRef]
- Boender, C.; de Graan, J.; Lootsma, F. Multi-criteria decision analysis with fuzzy pairwise comparisons. Fuzzy Sets Syst. 1989, 29, 133–143. [Google Scholar] [CrossRef]
- Mikhailov, L.; Tsvetinov, P. Evaluation of services using a fuzzy analytic hierarchy process. Appl. Soft Comput. 2004, 5, 23–33. [Google Scholar] [CrossRef]
- Wang, Y.-M.; Elhag, T.M.; Hua, Z. A modified fuzzy logarithmic least squares method for fuzzy analytic hierarchy process. Fuzzy Sets Syst. 2006, 157, 3055–3071. [Google Scholar] [CrossRef]
- Wang, Y.-M.; Luo, Y.; Hua, Z. On the extent analysis method for fuzzy AHP and its applications. Eur. J. Oper. Res. 2008, 186, 735–747. [Google Scholar] [CrossRef]
- Krejčí, J. Fuzzy eigenvector method for obtaining normalized fuzzy weights from fuzzy pairwise comparison matrices. Fuzzy Sets Syst. 2017, 315, 26–43. [Google Scholar] [CrossRef]
- Mikhailov, L. A fuzzy programming method for deriving priorities in the analytic hierarchy process. J. Oper. Res. Soc. 2000, 51, 341–349. [Google Scholar] [CrossRef]
- Mikhailov, L. Deriving priorities from fuzzy pairwise comparison judgements. Fuzzy Sets Syst. 2003, 134, 365–385. [Google Scholar] [CrossRef]
- Wang, Y.-M.; Chin, K.-S. Fuzzy analytic hierarchy process: A logarithmic fuzzy preference programming methodology. Int. J. Approx. Reason. 2011, 52, 541–553. [Google Scholar] [CrossRef]
- Tavana, M.; Shaabani, A.; Mohammadabadi, S.M.; Varzgani, N. An integrated fuzzy AHP- fuzzy MULTIMOORA model for supply chain risk-benefit assessment and supplier selection. Int. J. Syst. Sci. Oper. Logist. 2021, 8, 238–261. [Google Scholar] [CrossRef]
- Nazari, S.; Fallah, M.; Kazemipoor, H.; Salehipour, A. A fuzzy inference- fuzzy analytic hierarchy process-based clinical decision support system for diagnosis of heart diseases. Expert Syst. Appl. 2018, 95, 261–271. [Google Scholar] [CrossRef]
- Radhika, E.; Sadasivam, G.S. Budget optimized dynamic virtual machine provisioning in hybrid cloud using fuzzy analytic hierarchy process. Expert Syst. Appl. 2021, 183, 115398. [Google Scholar] [CrossRef]
- Khan, A.A.; Shameem, M.; Kumar, R.R.; Hussain, S.; Yan, X. Fuzzy AHP based prioritization and taxonomy of software process improvement success factors in global software development. Appl. Soft Comput. 2019, 83, 105648. [Google Scholar] [CrossRef]
- Sirisawat, P.; Kiatcharoenpol, T. Fuzzy AHP-TOPSIS approaches to prioritizing solutions for reverse logistics barriers. Comput. Ind. Eng. 2018, 117, 303–318. [Google Scholar] [CrossRef]
- Bostancioglu, E. Double skin façade assessment by fuzzy AHP and comparison with AHP. Arch. Eng. Des. Manag. 2021, 17, 110–130. [Google Scholar] [CrossRef]
- Wang, B.; Song, J.; Ren, J.; Li, K.; Duan, H.; Wang, X. Selecting sustainable energy conversion technologies for agricultural residues: A fuzzy AHP-VIKOR based prioritization from life cycle perspective. Resour. Conserv. Recycl. 2019, 142, 78–87. [Google Scholar] [CrossRef]
- Goyal, R.K.; Kaushal, S.; Sangaiah, A.K. The utility based non-linear fuzzy AHP optimization model for network selection in heterogeneous wireless networks. Appl. Soft Comput. 2018, 67, 800–811. [Google Scholar] [CrossRef]
- Singh, P.K.; Sarkar, P. A framework based on fuzzy AHP-TOPSIS for prioritizing solutions to overcome the barriers in the implementation of ecodesign practices in SMEs. Int. J. Sustain. Dev. World Ecol. 2019, 26, 506–521. [Google Scholar] [CrossRef]
- Celik, M.; Er, I.D.; Ozok, A.F. Application of fuzzy extended AHP methodology on shipping registry selection: The case of Turkish maritime industry. Expert Syst. Appl. 2009, 36, 190–198. [Google Scholar] [CrossRef]
- Ju, Y.; Ju, D.; Santibanez Gonzalez, E.D.R.; Giannakis, M.; Wang, A. Study of site selection of electric vehicle charging station based on extended GRP method under picture fuzzy environment. Comput. Ind. Eng. 2019, 135, 1271–1285. [Google Scholar] [CrossRef]
- Black, C.L.; Morris, A.E.; Akinluyi, E.; Kay, R.H. Heuristic evaluation of portable pulse oximeters for domiciliary use: Implications for its use in assessing medical device usability. Smart Health 2023, 27, 100357. [Google Scholar] [CrossRef]
- Klarich, A.; Noonan, T.Z.; Reichlen, C.; Barbara, S.M.J.; Cullen, L.; Pennathur, P.R. Usability of smart infusion pumps: A heuristic evaluation. Appl. Ergon. 2022, 98, 103584. [Google Scholar] [CrossRef]
- Momenipour, A.; Rojas-Murillo, S.; Murphy, B.; Pennathur, P.; Pennathur, A. Usability of state public health department websites for communication during a pandemic: A heuristic evaluation. Int. J. Ind. Ergon. 2021, 86, 103216. [Google Scholar] [CrossRef] [PubMed]


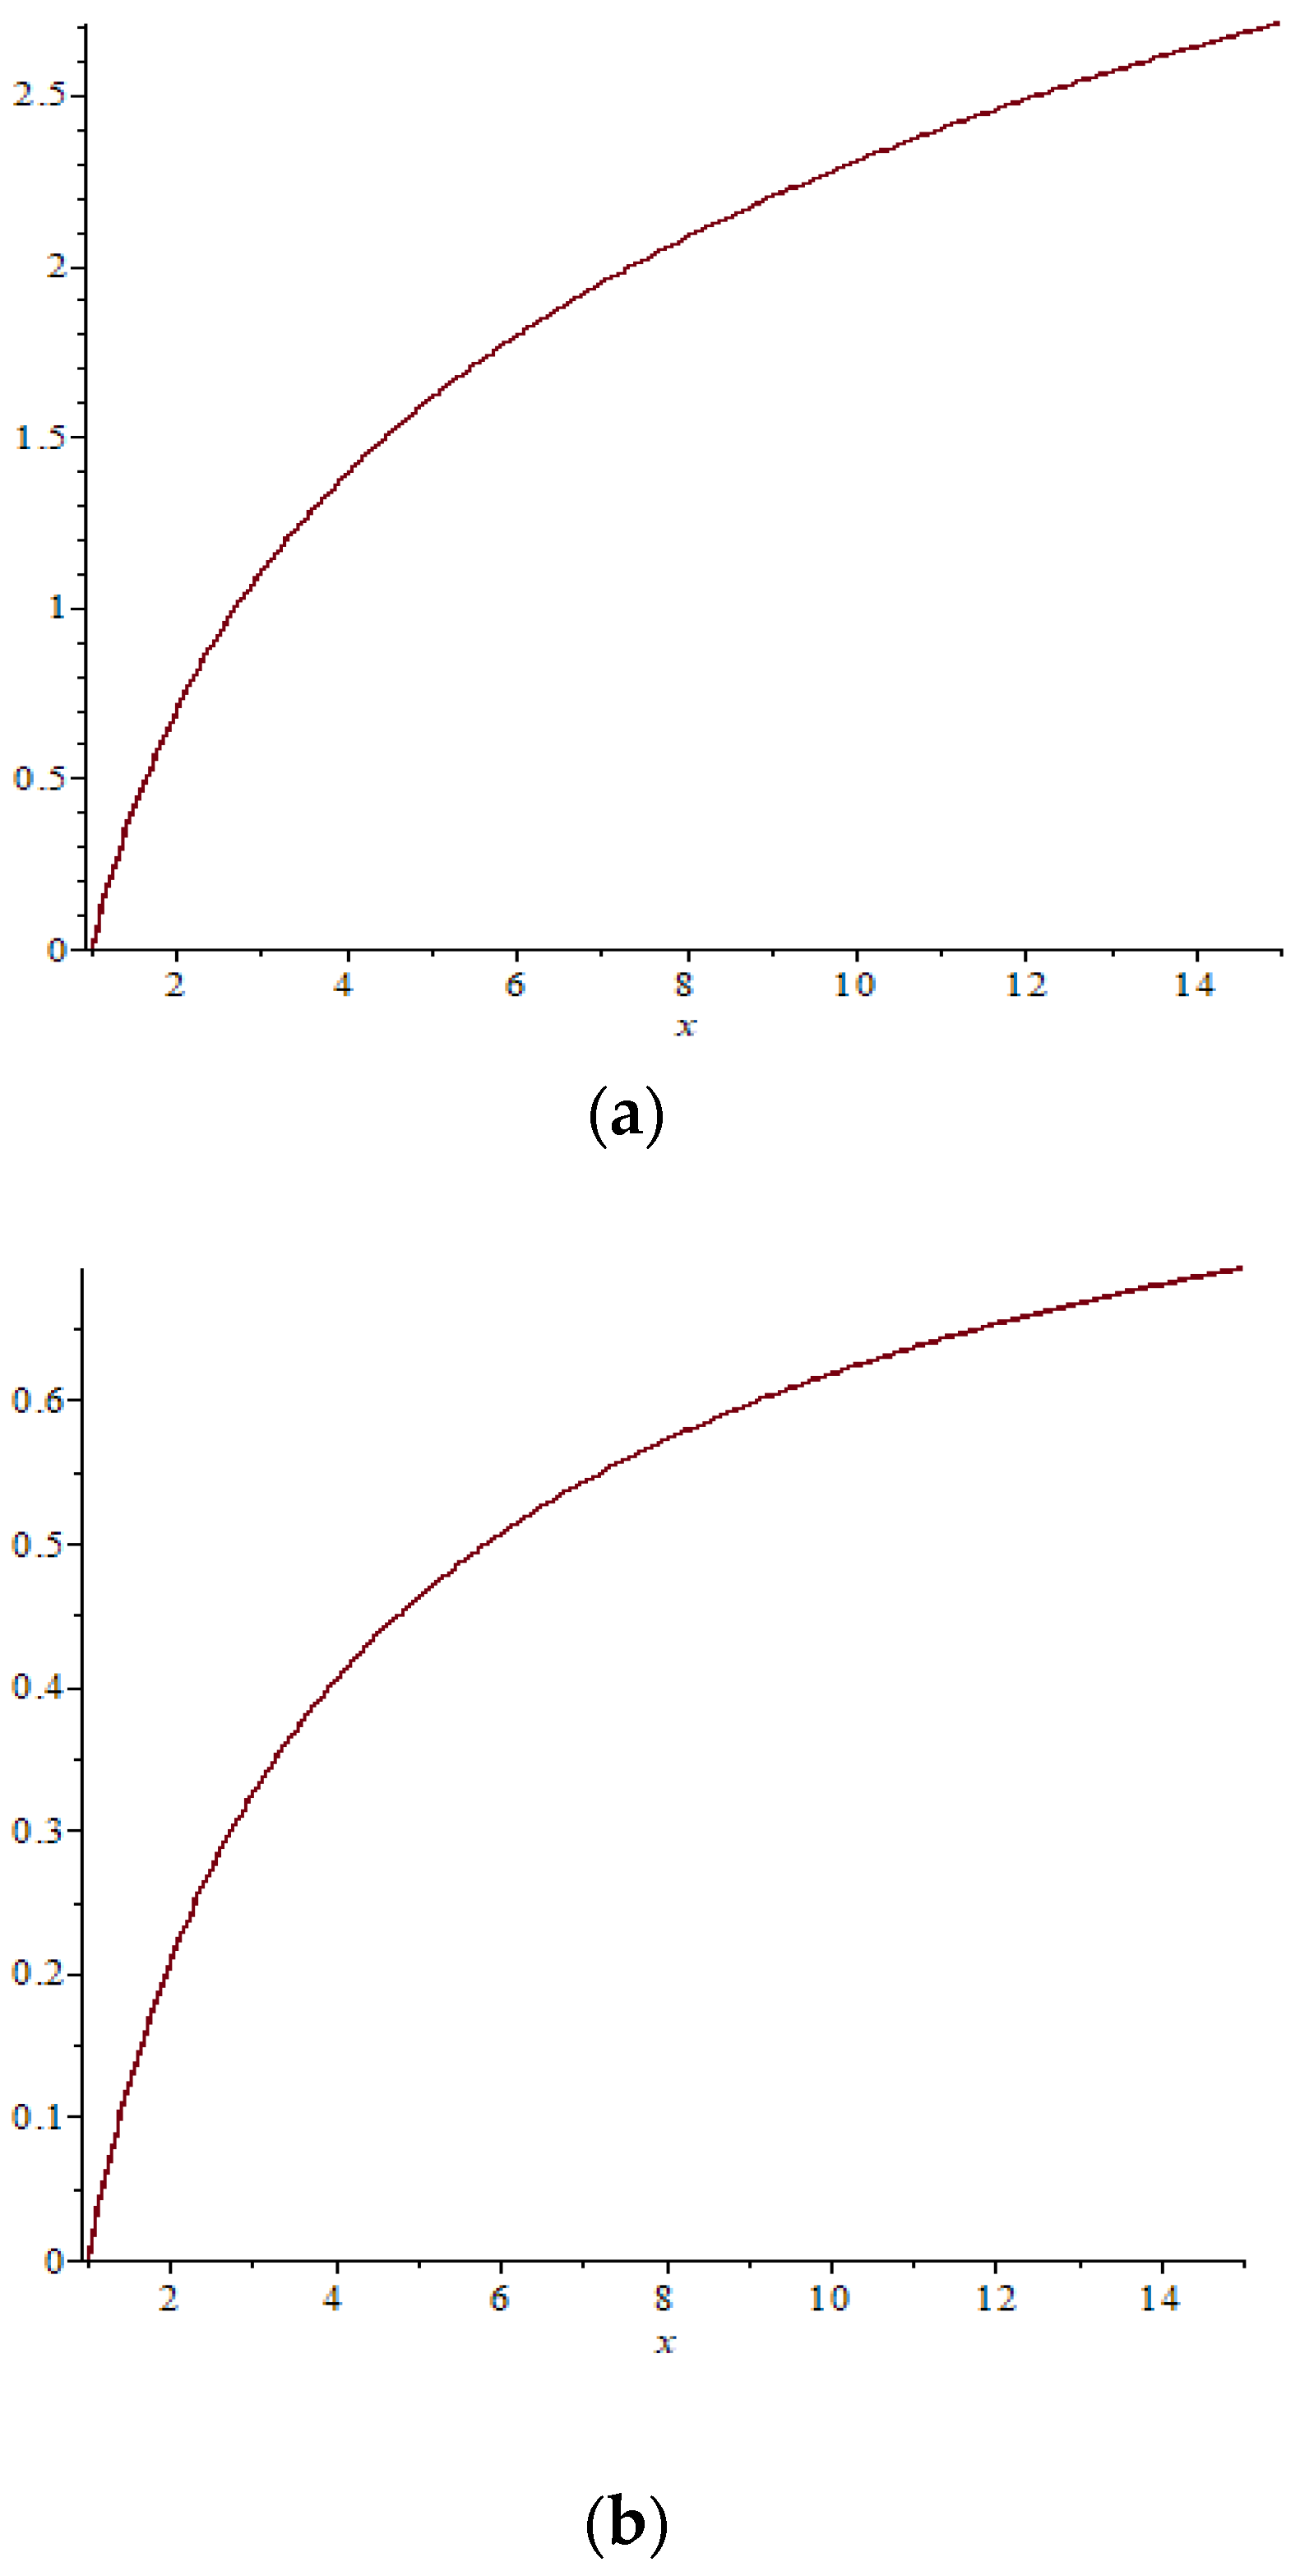
| Num. | Function A | Function B |
|---|---|---|
| 1 | 0 | 0 |
| 2 | 0.693147181 | 0.206128881 |
| 3 | 1.098612289 | 0.324463303 |
| 4 | 1.386294361 | 0.403696442 |
| 5 | 1.609437912 | 0.461512008 |
| 6 | 1.791759469 | 0.506098025 |
| 7 | 1.945910149 | 0.541837041 |
| 8 | 2.079441542 | 0.571315302 |
| 9 | 2.197224577 | 0.596170739 |
| 10 | 2.302585093 | 0.617497885 |
| 11 | 2.397895273 | 0.636059689 |
| 12 | 2.48490665 | 0.652406431 |
| 13 | 2.564949357 | 0.666946345 |
| 14 | 2.63905733 | 0.679989531 |
| 15 | 2.708050201 | 0.69177635 |
| ITFPP | Previous Study | |
|---|---|---|
| J | 0.03792303 | 0.31259023 |
| λ | 0.95166599 | 0.66190648 |
| W1 | 0.11236095 | 0.11299603 |
| W2 | 0.19410871 | 0.18520212 |
| W3 | 0.34157342 | 0.35384105 |
| W4 | 0.35195690 | 0.34796078 |
| Code | Criteria | Priority Level |
|---|---|---|
| A | User Interface and Experience | 3 |
| B | Learning Development | 2 |
| C | Motivational Learning (Psychology) | 1 |
| Code | Criteria | Priority Level |
|---|---|---|
| A1 | Visibility System Status | 9 |
| A2 | Match Between System and the Real World | 1 |
| A3 | User Control and Freedom | 8 |
| A4 | Consistency and Standards | 7 |
| A5 | Error Prevention | 6 |
| A6 | Recognizing Rather than Recall | 2 |
| A7 | Flexibility and Efficiency of Use | 5 |
| A8 | Aesthetic and Minimalist Design | 4 |
| A9 | Help and Documentation | 3 |
| Code | Sub-Criteria | Priority Level |
|---|---|---|
| B1 | Timeliness | 9 |
| B2 | Learning Design | 8 |
| B3 | Instructional Assessment | 7 |
| B4 | Instructional Material | 6 |
| B5 | Collaborative Learning | 5 |
| B6 | Learner Control | 4 |
| B7 | Feedback and Assessment | 3 |
| B8 | Diversity of Learning Content | 2 |
| B9 | Relevancy | 1 |
| Code | Sub-Criteria | Priority Level |
|---|---|---|
| C1 | Clarity of the Purpose and Objectives (Goals) | 2 |
| C2 | Motivation to Learn | 1 |
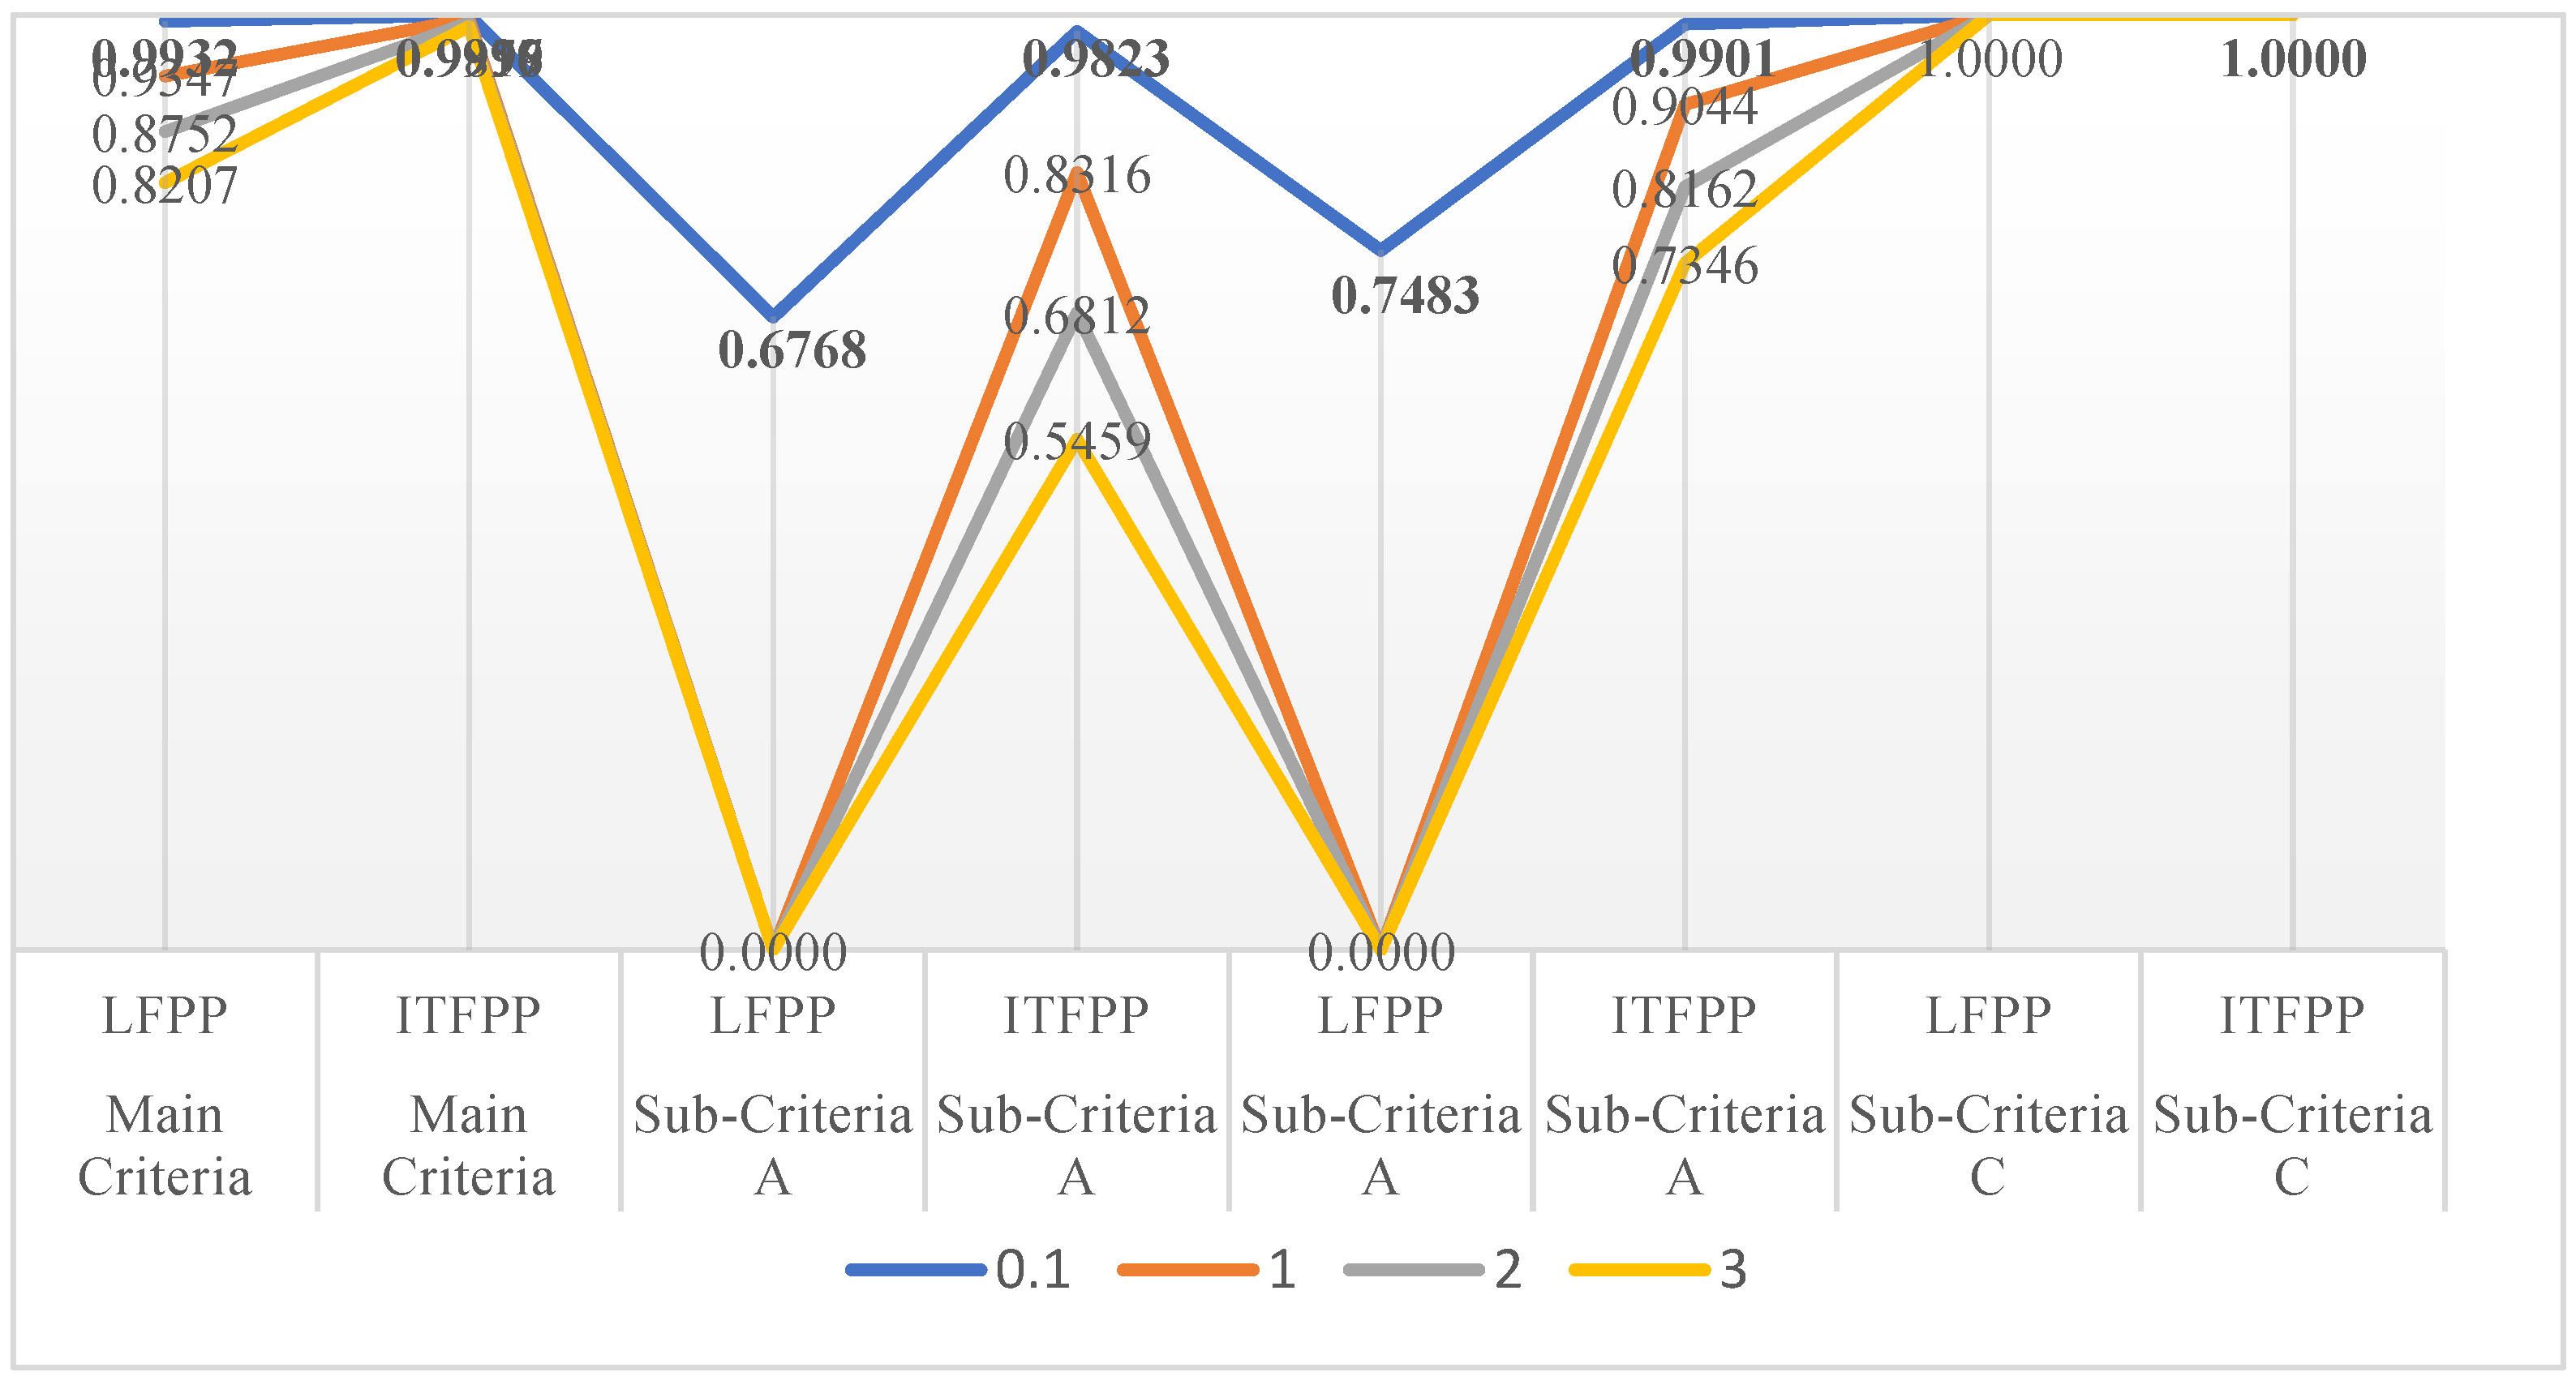
| M | Main Criteria | Sub Criteria A | Sub Criteria B | Sub Criteria C |
|---|---|---|---|---|
| 0.1 | 0.9996 | 0.9823 | 0.9901 | 1.0000 |
| 1 | 0.9959 | 0.8316 | 0.9044 | 1.0000 |
| 2 | 0.9918 | 0.6812 | 0.8162 | 1.0000 |
| 3 | 0.9877 | 0.5459 | 0.7346 | 1.0000 |
Disclaimer/Publisher’s Note: The statements, opinions and data contained in all publications are solely those of the individual author(s) and contributor(s) and not of MDPI and/or the editor(s). MDPI and/or the editor(s) disclaim responsibility for any injury to people or property resulting from any ideas, methods, instructions or products referred to in the content. |
© 2024 by the authors. Licensee MDPI, Basel, Switzerland. This article is an open access article distributed under the terms and conditions of the Creative Commons Attribution (CC BY) license (https://creativecommons.org/licenses/by/4.0/).
Share and Cite
Iryanti, E.; Santosa, P.I.; Kusumawardani, S.S.; Hidayah, I. Inverse Trigonometric Fuzzy Preference Programming to Generate Weights with Optimal Solutions Implemented on Evaluation Criteria in E-Learning. Computers 2024, 13, 68. https://0-doi-org.brum.beds.ac.uk/10.3390/computers13030068
Iryanti E, Santosa PI, Kusumawardani SS, Hidayah I. Inverse Trigonometric Fuzzy Preference Programming to Generate Weights with Optimal Solutions Implemented on Evaluation Criteria in E-Learning. Computers. 2024; 13(3):68. https://0-doi-org.brum.beds.ac.uk/10.3390/computers13030068
Chicago/Turabian StyleIryanti, Emi, Paulus Insap Santosa, Sri Suning Kusumawardani, and Indriana Hidayah. 2024. "Inverse Trigonometric Fuzzy Preference Programming to Generate Weights with Optimal Solutions Implemented on Evaluation Criteria in E-Learning" Computers 13, no. 3: 68. https://0-doi-org.brum.beds.ac.uk/10.3390/computers13030068