Article

Evaluation of Bunch Length by Measuring Coherent Synchrotron Radiation with a Narrow-Band Detector at LEBRA

1
Laboratory for Electron Beam Research and Application, Nihon University, 7-24-1 Narashinodai, Funabashi 274-8501, Japan
2
Research Institute of Instrumentation Frontier, National Institute of Advanced Industrial Science and Technology, 1-1-1 Umezono, Tsukuba, Ibaraki 305-8568, Japan
*
Author to whom correspondence should be addressed.
Submission received: 7 April 2020 / Revised: 28 April 2020 / Accepted: 7 May 2020 / Published: 9 May 2020

Abstract

:
This study presents a novel technology to measure electron bunch length with a high time resolution by measuring coherent synchrotron radiation using a narrow-band detector at Laboratory for Electron Beam Research and Application (LEBRA)—an S-band linear accelerator facility for free-electron lasers. The form factor was observed to decrease exponentially with charge—in concordance with the relationship between the intensity of the coherent synchrotron radiation and the magnitude of electron bunch charge—in the region in which the effect of electron bunch charge on bunch length is negligible. The calculated root-mean-square bunch length was observed to agree well with the value determined from the spectral shape obtained. The aforementioned results are expected to be useful in real-time observation of small changes in electron bunches in advanced accelerators.

1. Introduction

The recent development of compact light sources in the terahertz band has led to the frontier research field of terahertz wave spectroscopy. Several vibration modes exist in the terahertz region characteristic of molecules, and measurement of terahertz wave spectra is widely used to identify materials. A major advantage of a terahertz light source using an accelerator is its high peak power, leading to the development of various light sources such as free-electron lasers (FELs) and coherent radiation [1,2]. With the development of accelerator technology, various techniques have been developed to produce short-pulse electron bunches. Consequently, active research and development of terahertz light sources using accelerators have been conducted [3,4,5,6,7,8,9,10,11]. In particular, at Nihon University, various types of terahertz light sources have been developed over the past decade. At the straight sections of FELs, coherent synchrotron radiation (CSR) and coherent edge radiation (CER) have been developed and implemented, and the produced light has been transmitted to laboratories through FEL beamlines. As these terahertz light sources can be used simultaneously with infrared FELs, they are used for experiments including those involving biologic tissue imaging. Further, at the straight sections of parametric X-ray radiation (PXR), coherent transition radiation (CTR) with a power output of one millijoule per macro-pulse has been developed and implemented, which can be used in laboratories via PXR beamlines. Additionally, prospective application of CTR in product management of tablets is being researched.
A terahertz light source produced in an accelerator also serves as an excellent tool for evaluation of the accelerator. In advanced accelerators like X-ray FELs, the size of an electron bunch is comparable to that of the wavelength of terahertz light. Therefore, it is possible to measure the shape of a bunch by measuring the spectrum of coherent radiation produced by that electron bunch [12,13,14,15,16]. To date, streak cameras and RF deflectors are the only tools that have been developed to measure bunch shapes. However, the time resolution of conventional streak cameras is insufficient to measure sub-ps bunch lengths. Further, electron bunches are often distorted by conventional RF deflectors, making it impossible to non-destructively measure the states of electron bunches prior to FEL oscillation. Additionally, in the case of electron beams with high repetition frequency, such as X-ray FELs using superconducting linear accelerators that are currently under development, it is difficult to measure the bunch length for each micro-pulse via the existing methods.
Given these circumstances, we conducted measurements of bunch length using CSR that was capable of non-destructively observing electron beams. As the light source, we utilized the CSR source in the terahertz band that had been developed at the LEBRA accelerator facility at Nihon University [17,18,19,20,21]. Such bunch length measurements obtained using coherent radiation produced by electron bunches have also been studied and used in several accelerator facilities [12,13,14,15,16]. However, unlike other studies, we succeeded in measuring the root-mean-square (RMS) bunch length with high precision by strictly considering the detector’s characteristic sensitivity during the observation of the coherent radiation. In the present study, we first outline the CSR light source from Nihon University that was used. Following this, we discuss the proposed measurement technology that is capable of detecting small changes in bunch length using the narrow-band characteristic of the detector. On the basis of the results obtained, we conclude that a correlation exists between electron bunch charge and bunch length for high-charge bunches.

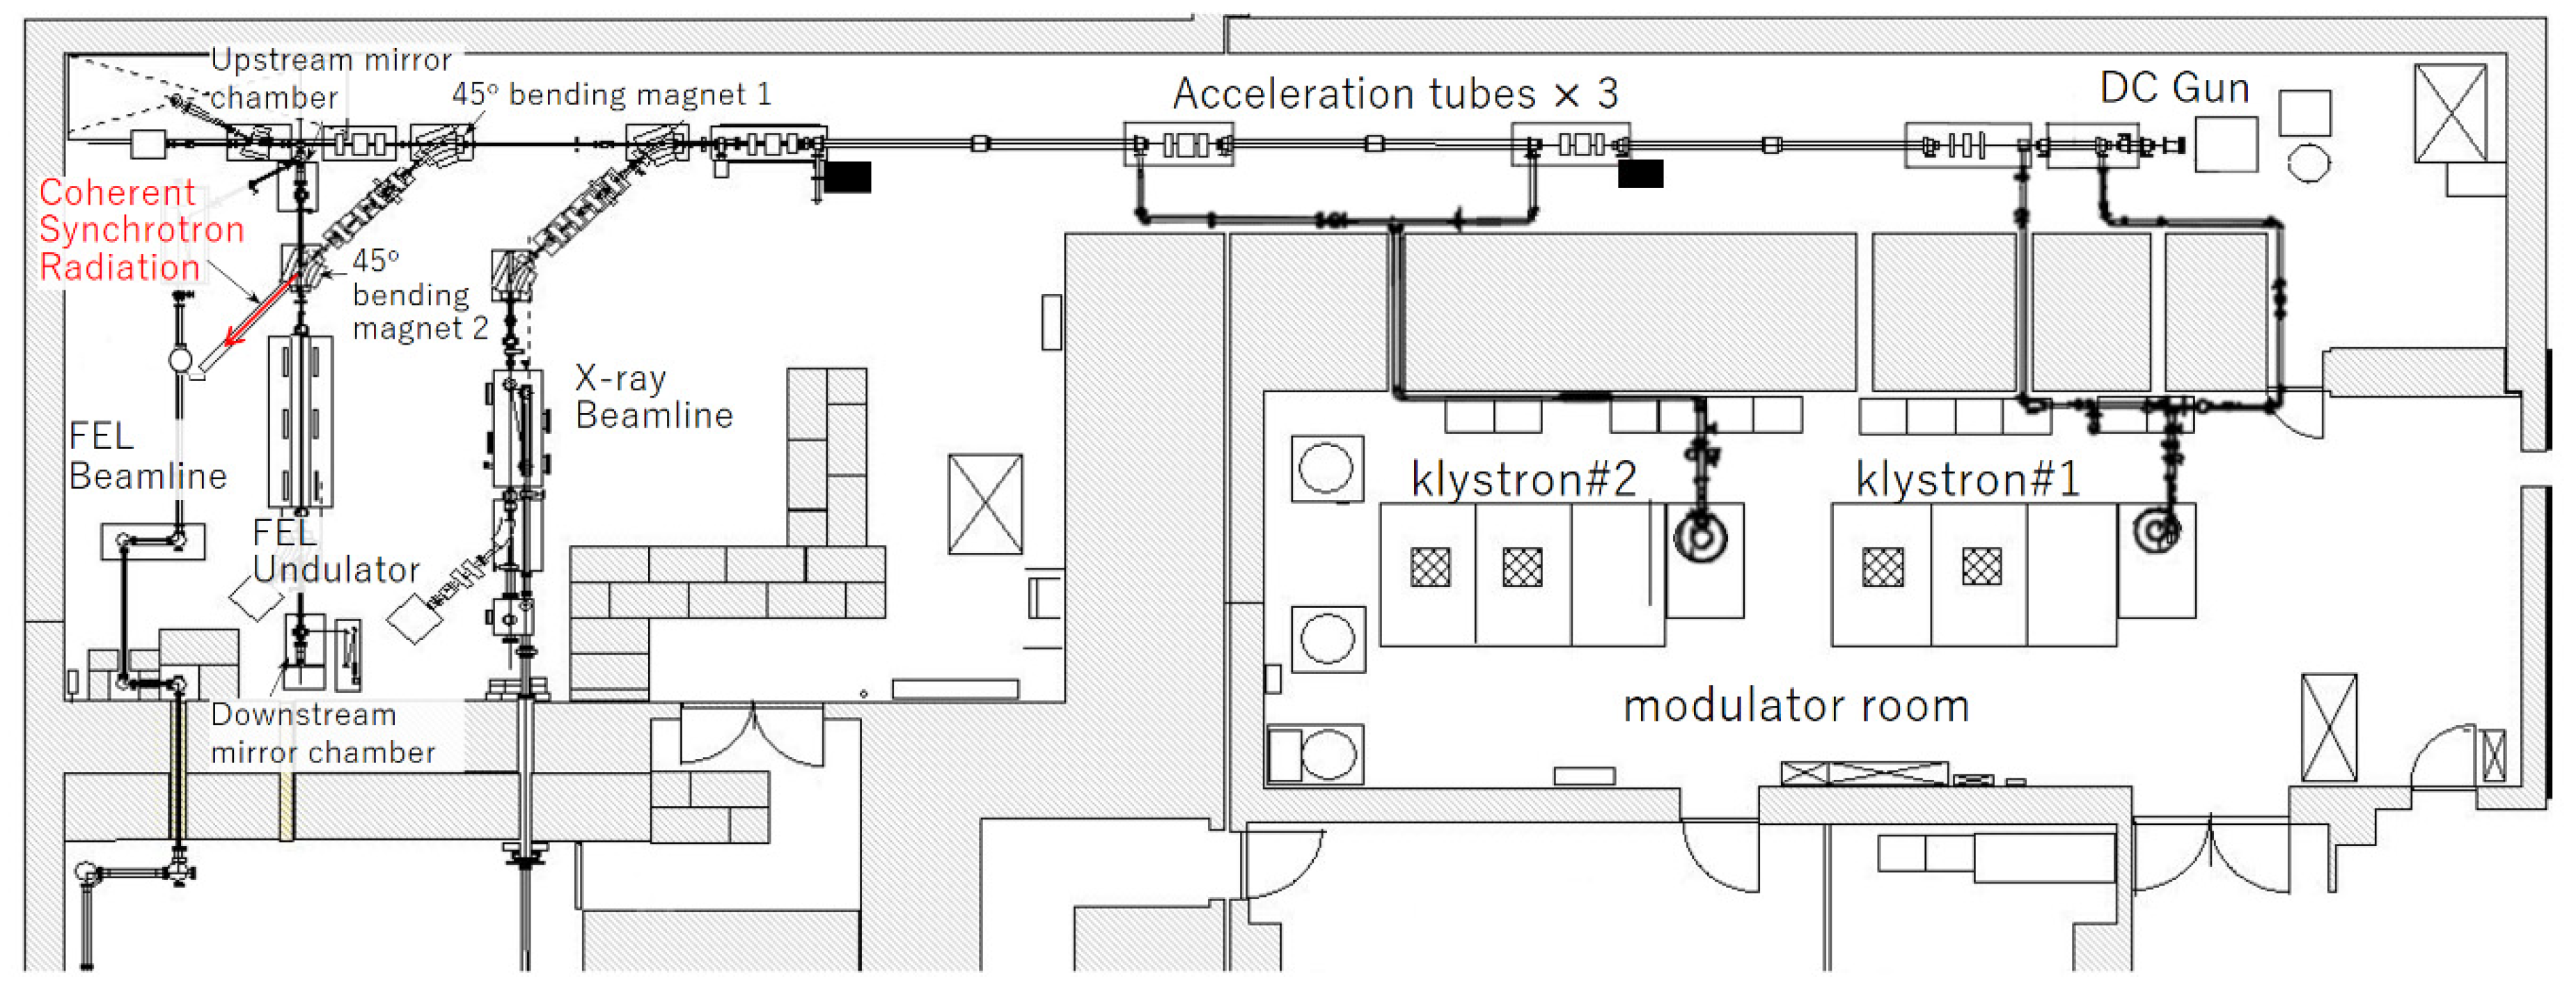
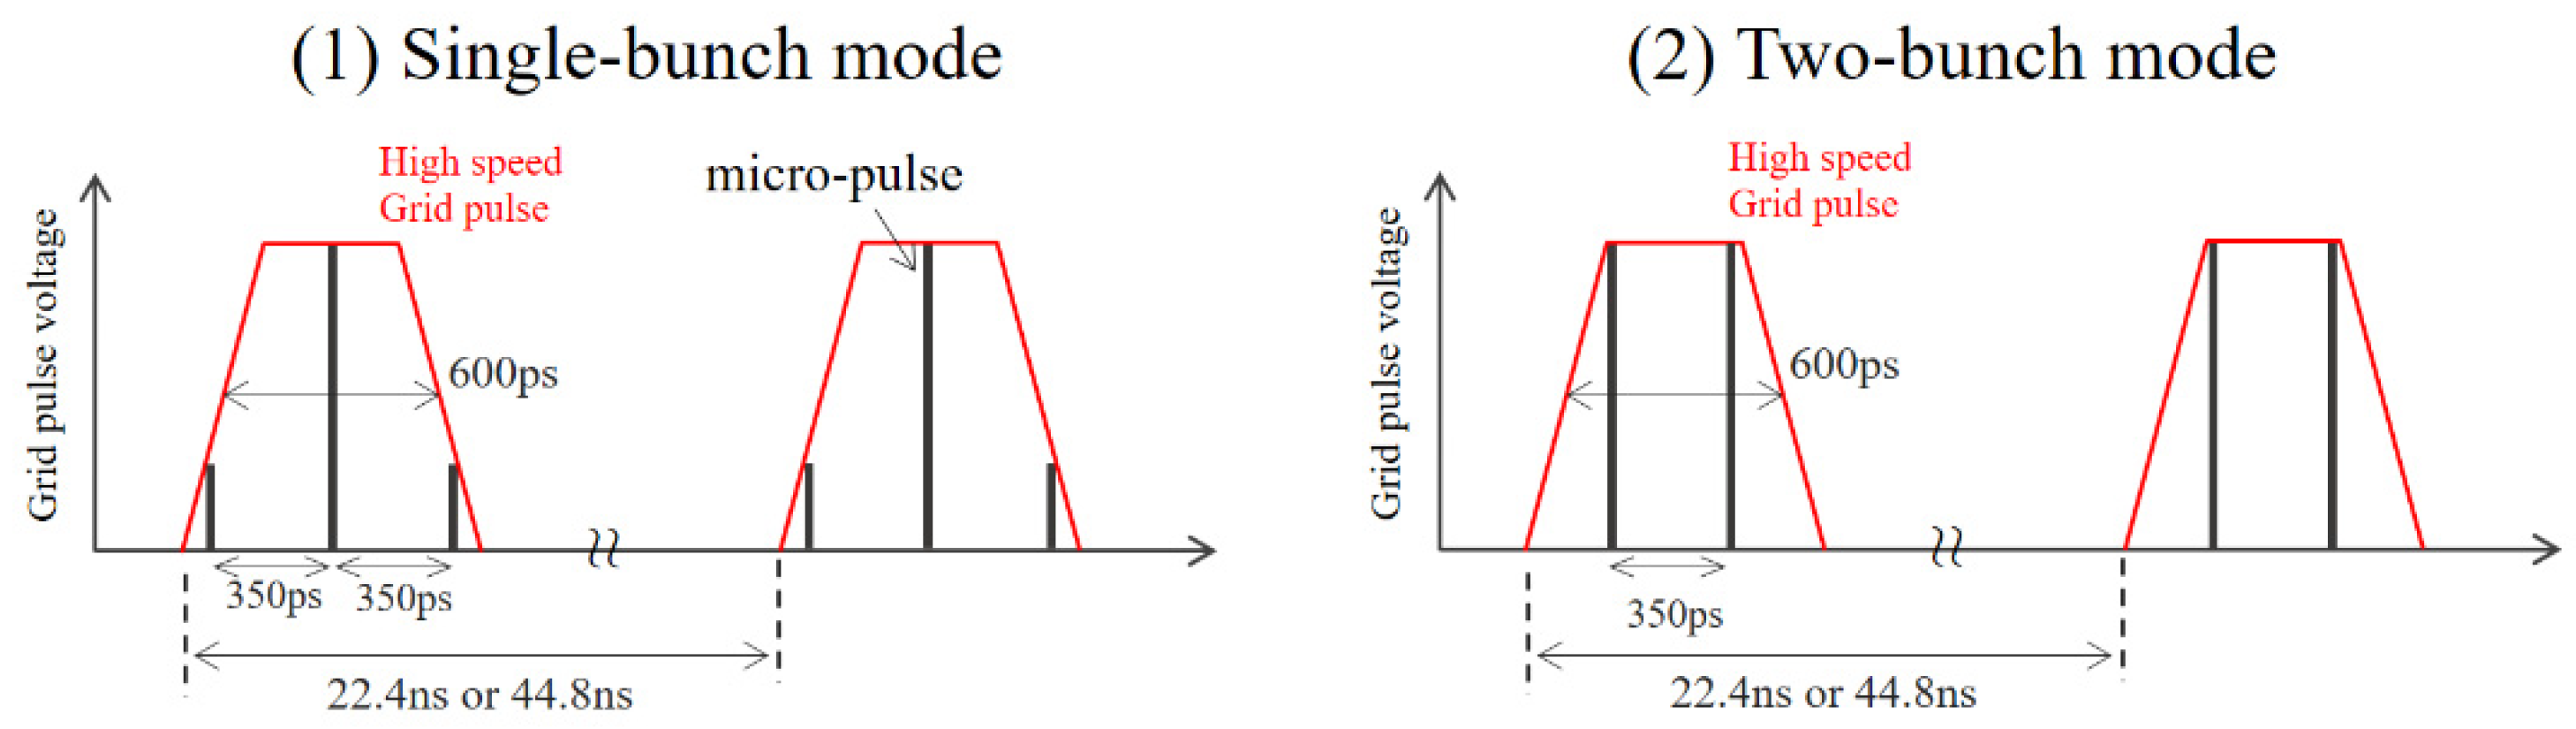
2. Coherent Synchrotron Radiation Source at LEBRA

The LEBRA Linac at Nihon University consists of a DC electron gun of 100 kV, one buncher, three S-Band 4 m acceleration tubes and two high-frequency source klystrons, as depicted in Figure 1. Its operating acceleration frequency is 2856 MHz, the acceleration energy is 40–100 MeV, the repetition rate is 2–10 Hz and the macro-pulse width of the associated beam is 5–20 μs. Besides the normal full-bunch mode operation, the electron gun system is capable of operating in a high-charge burst mode at intervals of 1/64 or 1/128 using a high-speed grid pulser of 600 ps full width at half maximum (FWHM). During full-bunch mode operation, bunches are aligned to produce a peak current of 200 mA and bunch intervals of 350 ps (Figure 2a). During burst-mode operation, it is possible to produce one (single-bunch mode) or two micro-pulses (two-bunch mode) within an interval of 600 ps at a peak current of about 2 A, depending on the operation acceleration frequency and high-speed grid pulse timing (Figure 2b and Figure 3) [19,20,21,22]. The experiments conducted in this study carry out the burst-mode operation in two-bunch mode.
The electron beam produced by the electron gun is accelerated by the linear accelerator, and then transmitted to the FEL 2.4-m undulator after being bent by 90° using two 45-degree bending magnets. The electron beam is bent by a 45-degree bending magnet after passing through the undulator, and then it loses its energy due to the beam dump. When the electron beam passes through the two bending magnets, its bunch length w observed to shorten from 3 ps to less than 1 ps due to pulse compression. The bunch length of the electron beam is monitored using the CSR generated at the entrance of the downstream bending magnet during the compression process. The design bunch length is observed to be about 2 ps [23]. The CSR passes through a straight pipe with a diameter of 20 mm and is ejected from the vacuum chamber through a quartz window. Then, the CSR is reflected by a plane mirror towards a detector set that is at a distance of 1.3–1.5 m from the source point. A schematic of the CSR light source is presented in Figure 4.
For the detection of CSR, the D-band diode detector (Millitech, Inc. USA, DXP-06) with a square antenna and an aperture of H17 mm × V11 mm was used. This detector is a commercially available Schottky barrier zero bias diode type, which is characterized by small, robust and thermally stable [24]. Its sensitivity to CW light source was determined to be approximately 5 mV/10 μW, and the linearity was calibrated by varying the thickness of the BK7 plate. The relative sensitivity spectrum B(f) of a D-band diode detector with a pyramidal horn antenna was measured using a terahertz wave beamline in the L-band linac at the Institute for Integrated Radiation and Nuclear Science at Kyoto University [25]. As depicted in Figure 5, the diode detector used exhibited a sensitivity in the range of 0.08–0.17 THz, making it appropriate for use in spectroscopy measurements. The output of the D-band diode detector was measured using an oscilloscope located at an approximate distance of 30 m in the laboratory. The rise time of the measurement system was observed to be approximately 1.3 ns, making it difficult to distinguish the micro-pulses from each other during operation in the full-bunch mode. However, during operation in the burst mode, the time change of the THz wave could be measured because the interval time of the micro-pulse was sufficiently wider than that in the full-bunch mode. The results also confirmed that the CSR beam reflected in the vacuum chamber of the bending magnet was emitted into the atmosphere through a vacuum window [17]. The frequency of the obtained CSR was measured to be between approximately 0.1 to 0.2 THz and its power per macro-pulse was measured to be approximately 0.4 μJ in this frequency region. The absorption at the quartz window during CSR extraction was ascertained to be negligible at frequencies below 0.2 THz [26,27]. Further, based on the HITRAN database (high resolution transmission molecular absorption database) [28], the influence of the air absorption was expected to be negligible in the frequency range between 0.1 and 0.2 THz.

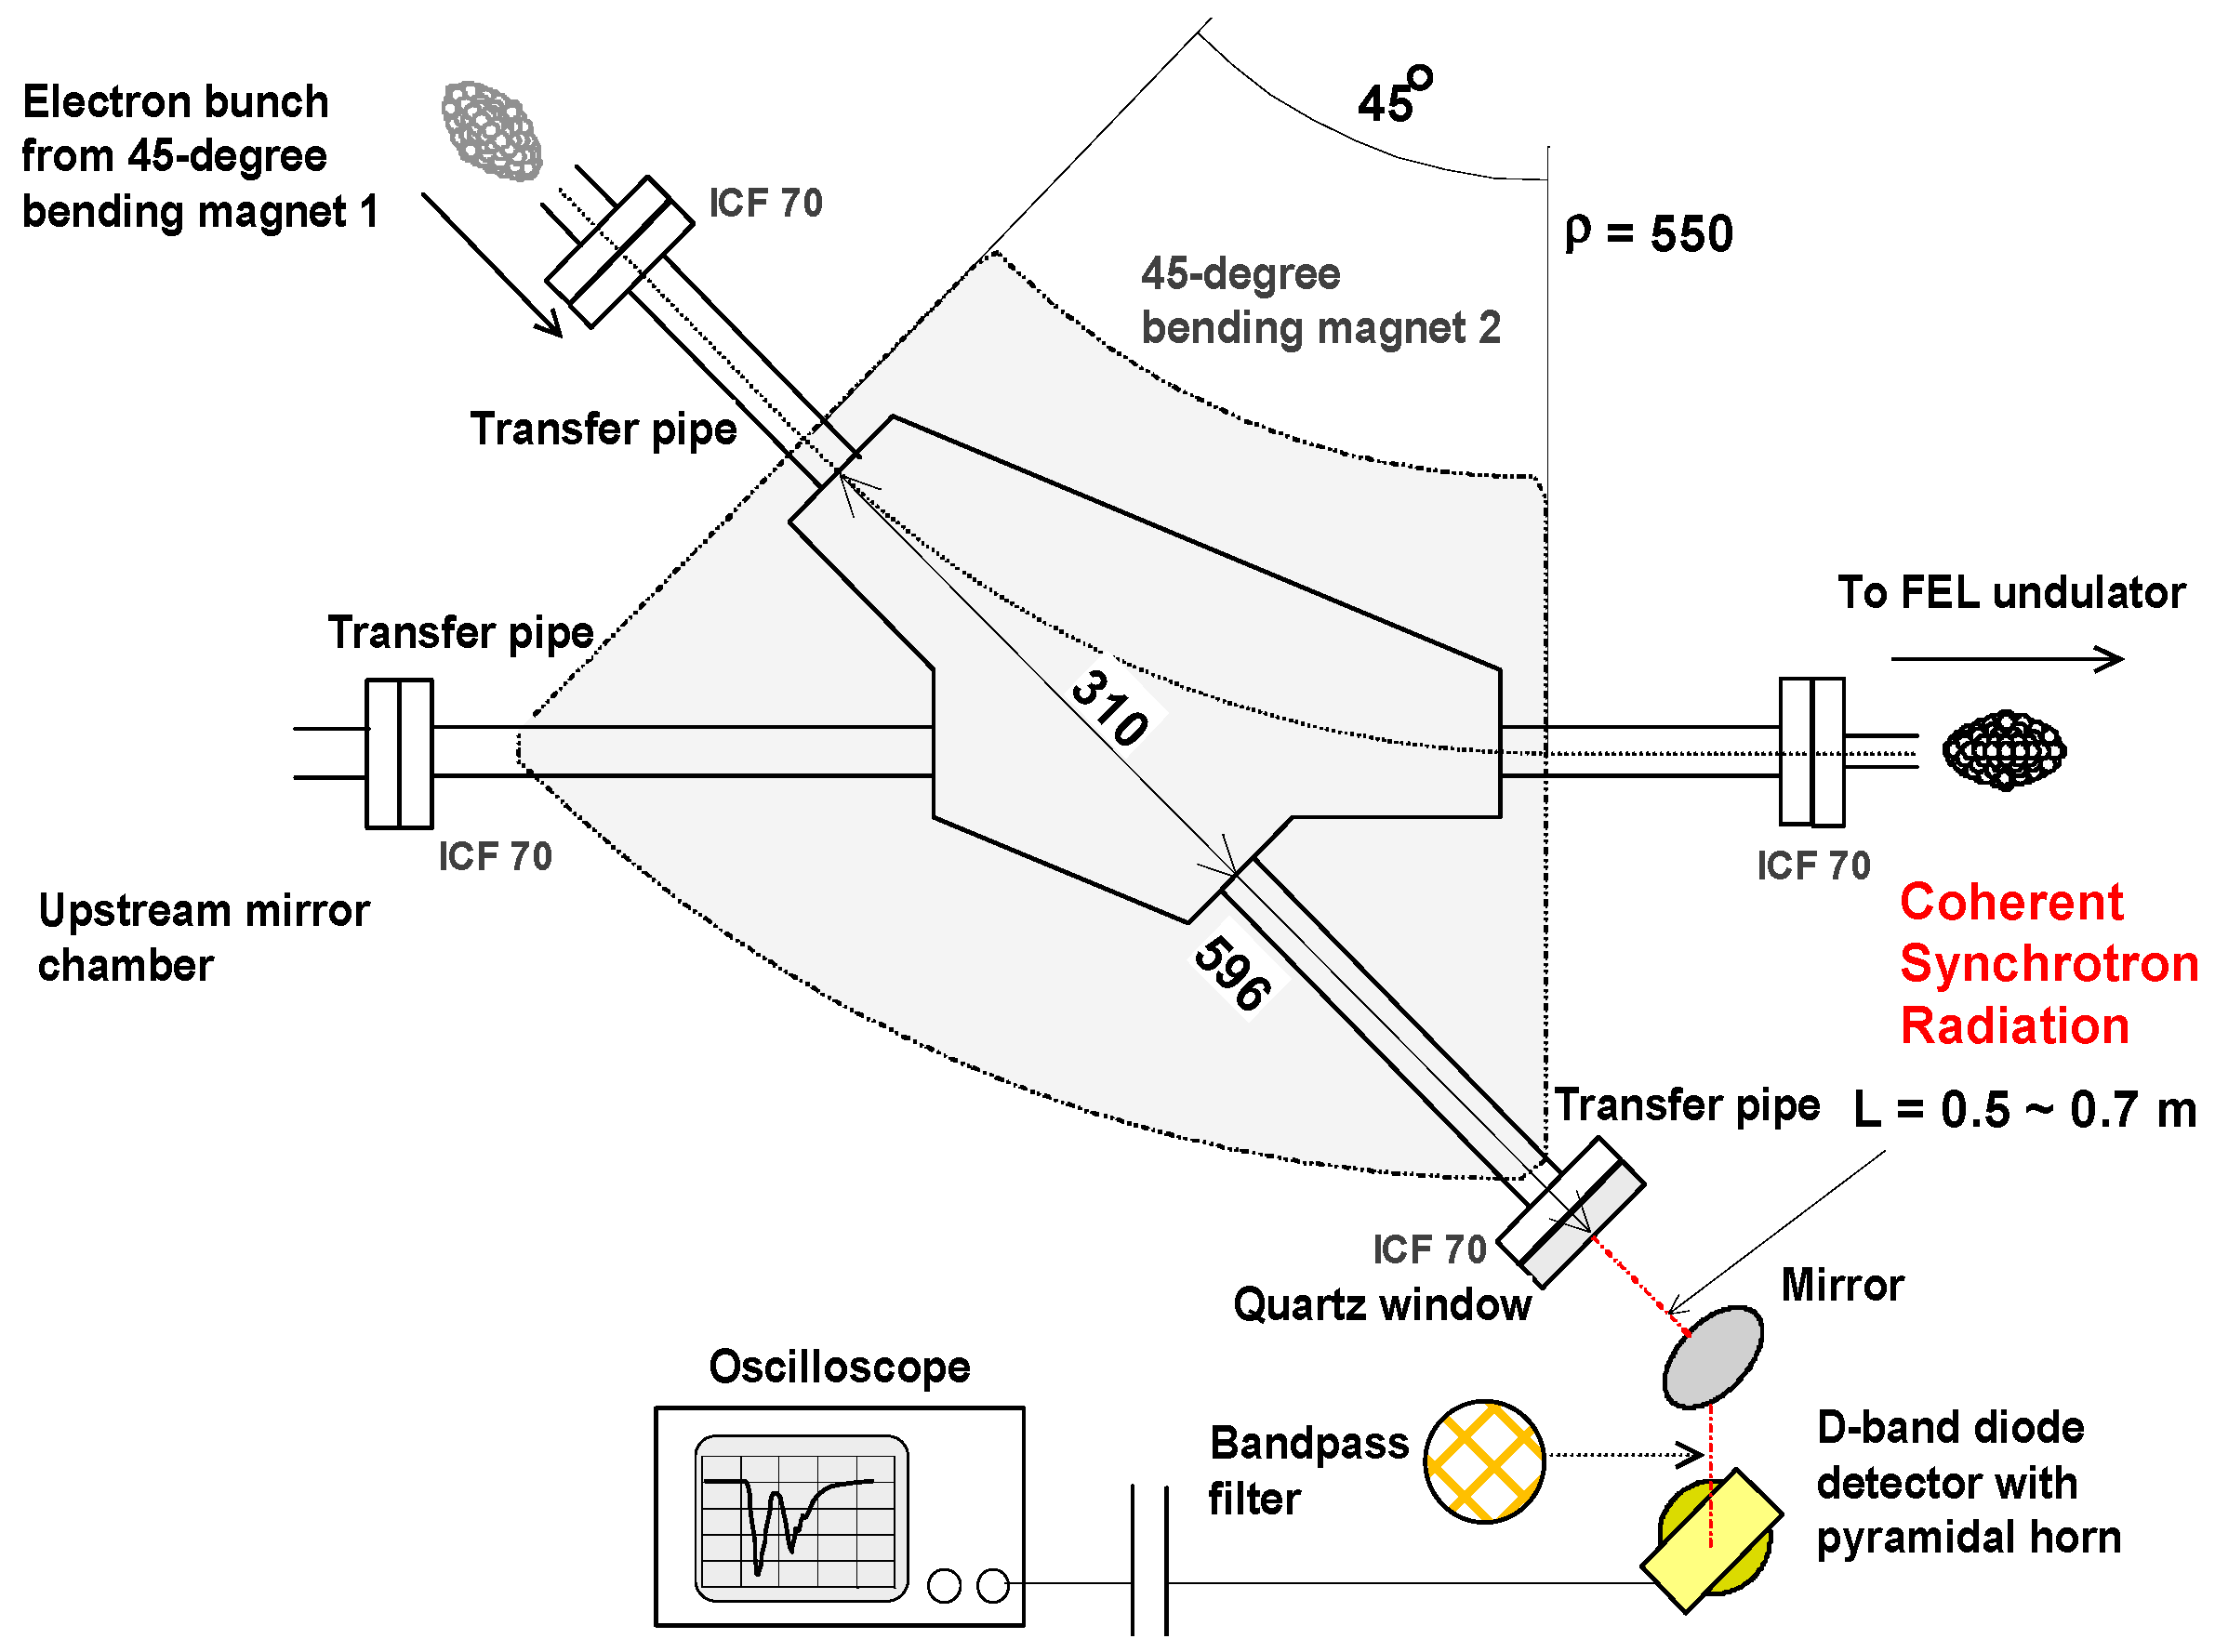
3. Bunch Length Measurement of CSR Power with Narrow-Band Detector

Assuming that there are N electrons in a bunch, the intensity spectrum of the CSR is given by the following equation using the intensity spectrum Ie(f) of the CSR generated by one electron [29].
I ( f ) = N I e ( f ) + N ( N 1 ) F ( f ) I e ( f ) ,
where F(f) denotes the form factor and f denotes a frequency of the CSR. The form factor is a dimensionless number, not exceeding 1, defined by the following equation:
F ( f ) = |   d z S ( z ) e x p ( i 2 π f z c ) | 2 ,
where S(z) denotes a normalized electron density function. If the number of electrons is sufficiently large and 1/N << F(f), then Equation (1) can be approximated by the following equation:
I ( f ) N 2 F ( f ) I e ( f )
If the bunch shape is known, F(f) can be calculated as a function of the bunch length. A method of evaluation of the bunch length of an electron beam by measuring the powers of associated wake fields or the transition radiation at multiple frequencies has been developed based on a simple method of measurement of bunch length [15,16]. Although this technique is easily affected by the bunch shape, it can be applied in the real-time measurement of the bunch length. Due to this advantage, we evaluated the bunch lengths corresponding to the observations of the CSR at LEBRA via this measurement technique. Based on previous measurements, it was known beforehand that the distribution of the electron bunch shapes corresponding to LEBRA was very close to a Gaussian one [23]. Therefore, as radiation intensity is a function of wavelength, the contributions of the wavelengths to bunch length are observed to gradually accumulate during the measurement of the intensity using the detector. Although the sensitivity range of the D-band diode detector is relatively narrow, we used the band-pass filter with a transmission center frequency of 0.09 THz to further narrow it down. Figure 6 depicts the transmission characteristic T(f) of the band-pass filter over an extended range of frequencies. As is evident, it was only possible to extract the component of CSR corresponding to 0.08–0.10 THz by combining the D-band diode detector and a band-pass filter. As mentioned above, the diode detector can, in principle, measure the bunch length per micro-pulse of the electron beam because of its extremely short response time (about 1.3 ns).
The intensity of the CSR measured using the diode detector is given by
P BPF f L f H d f N 2 B ( f ) F ( f ) I e ( f ) ,
where fL and fH denote the lower and upper limits of transmission frequency corresponding to the band-pass filter, respectively. In this case, if the width of B(f) is sufficiently narrow compared to the variation in F(f)Ie(f), the intensity of the CSR can be approximately expressed by
P BPF N 2 B ¯ ( f c ) F ¯ ( f c ) I e ¯ ( f c ) Δ f ,
where fc denotes the frequency at which the measured CSR intensity is the maximum and Δf denotes the full width at half maximum of B(f). The bar above each symbol indicates its average value within the band of B(f). In the case in which the bandwidth of the diode detector is constant, the values of B ¯ and I e ¯ are also constant. Therefore, the value obtained by dividing PBPF by N2, that is, the value obtained by dividing the CSR intensity by the square of the charge, is equal to the variation in F ¯ with respect to the magnitude of the charge.
In the case in which the electron-bunch charge is low, as in the case of the full-bunch mode, it is expected that the bunch length will not change even if the magnitude of charge is varied. During curve fitting using the square of the magnitude of the charge in the region in which the electron bunch charge is less than 30 ps in the full-bunch mode, the fitting coefficient of determination, R2, was ascertained to be 0.9999, as depicted in Figure 7. This demonstrates very close agreement.
The datum at 32 pC was observed to deviate from this fitting curve by more than one standard deviation, leading to the expectation that the value of F ¯ is prone to change in the region above 30 pC. We further measured the relationship between the magnitude of the charge and the CSR intensity PBPF during burst mode corresponding to large magnitudes of charge. Charge saturation was observed at around 0.65 nC/2 bunches, as depicted in Figure 8. In other words, the CSR power is not proportional to the square of the charge in the burst mode where the amount of charge per micro-pulse is high. This can be attributed to the increase in bunch length due to a space-charge effect as the electron-bunch charge increases. The bunch lengthening caused by the space-charge effect is often observed for short electron bunches whose bunch lengths are less than 1 ps [30].
According to the literature, when the magnitude of electron bunch charge exceeds a threshold, qth, the bunch length σ increases following the equation [30]:
σ 2 = σ th 2 + σ th 2 ( q q th q th ) n ,   q > q th ,
where σth denotes the bunch length at the threshold magnitude of the electron bunch charge. If the distribution of electron bunches is Gaussian, as is the case with LEBRA at Nihon University, the relationship between the form factor F at a certain wavelength and the bunch length is expressed by [6].
F ( f , σ ) = e x p ( 4 π 2 f 2 c 2 σ 2 ) .
By substituting Equation (6) into Equation (7), the mean form factor over the band range of the diode detector, when q >> qth, can be expressed by
F ¯ ( f c , σ ) F ¯ ( f c , σ th ) e x p [ 4 π 2 f c 2 σ th 2 c 2 ( q q th ) n ] .
During the performance of measurement in the region where the magnitude of the electron bunch charge exceeds the threshold charge amount, the argument of the exponential function of Equation (8) can be calculated. The charge dependence of the form factor then becomes possible to be evaluated.
Hence, based on Figure 8, the dependences of the horizontal and vertical polarization components of PBPF/q2 on qn were investigated. As depicted in Figure 9, assuming n = 2/3, the value of PBPF/q2 was observed to decrease exponentially.
During curve fitting using Equation (8), n = 0.64 ± 0.04 was obtained for the horizontal polarization component and n = 0.68 ± 0.02 was obtained for the vertical component. This elucidated the following approximate relationship between bunch length and magnitude of charge:
σ q 1 3 .
The difficulty in accurately measuring the value of radiation intensity makes it difficult to evaluate the form factor based solely on the measurement of radiation intensity. Generally, RMS bunch length is evaluated by measuring the spectra of coherent radiation and conducting curve fitting for the spectra based on Equations (1) and (7). For LEBRA, during preliminary measurement using the spectrum, the RMS bunch length was observed to be 1.9 ps in the full-bunch mode during which the magnitude of the electron-bunch charge was observed to be 30 pC or less. Further, the bunch length was ascertained to be 2.9 and 3.1 ps corresponding to charge magnitudes of 0.49 nC/2 bunches and 0.60 nC/2 bunches in burst mode, respectively. If the standard value of RMS bunch length (i.e., the bunch length at a certain electron-bunch charge magnitude) is known in advance, the RMS bunch length at other charge amounts can be estimated using Equation (8). Figure 10 depicts the RMS bunch length evaluated for the data of vertical polarization with smaller errors than those presented in Figure 9, using q = 0.49 nC/2 bunches at the bunch length of 2.9 ps. As we have indicated above, the accuracy of the data used in the evaluation is n = 0.68 ± 0.02. As depicted in Figure 10, the bunch length corresponding to the charge of about 0.62 nC/2 bunches was 3.1 ps. This verifies that the value is consistent with the bunch length corresponding to the charge of about 0.60 nC/2 bunches evaluated using the spectra.
Generally, the band region of a diode detector is sufficiently narrow compared to the variation in F(f)Ie(f). However, as depicted in Figure 11, when the diode detector used in LEBRA was evaluated, B(f)F(f)Ie(f) was observed to attain its maximum value at approximately 0.1 THz, and the FWHM was measured to be approximately 23 GHz, i.e., the peak positions and the spectrum shapes are nearly unchanged. As a result, it did not differ much corresponding to bunch lengths in the range of 2.6–3.3 ps. Therefore, it was deemed appropriate to use Equation (8) during the form factor evaluation corresponding to this measurement. Additionally, the data presented in Figure 11 suggests that variations in the bunch length could be measured with high sensitivity by using a narrow-band diode detector corresponding to each bunch length.

4. Conclusions

In this study, we evaluated RMS bunch lengths in full-bunch mode and in burst mode using the CSR at LEBRA at Nihon University. Corresponding to regions in which CSR intensity was observed to not be proportional to the square of the magnitude of the electron bunch charge, the form factor was observed to decrease exponentially with the charge magnitude. Further, using the fact that the form factor was observed to decrease exponentially with the square of the bunch length, we performed precise evaluations of the variations in bunch length. In this method, the commercially available product-based detector can be used to easily evaluate the change in bunch length for each micro-pulse. Currently, the development of self-amplified spontaneous emission X-ray FELs are being actively promoted. Further, the development of X-ray FEL oscillators using energy-recovery linacs are also under popular consideration. Our results are expected to be applicable to the precise evaluation of FEL gain with respect to changes in the magnitude of the charge.
At LEBRA at Nihon University, the development of high-power terahertz light sources using various coherent radiations is currently being carried out. For CER light sources in the straight section of FEL beamlines, it is possible to observe CER simultaneously with FELs by inserting a hole-coupled mirror that separates CER and FELs. In the future, we plan to elucidate the effect of FELs on the electron bunch by using the bunch length measurement method proposed in this study.

Author Contributions

Methodology, N.S.; software, K.H.; investigation, T.S., N.S., K.H., T.T., Y.H. and K.N.; writing—original draft preparation, T.S. and N.S.; writing—review and editing, T.S. and N.S.; funding acquisition, N.S. All authors have read and agreed to the published version of the manuscript.

Funding

This work was supported by JSPS KAKENHI JP19H04406.

Acknowledgments

We would like to express our gratitude for the help of Takahashi of the Research Reactor Institute, Kyoto University for measuring the sensitivity curve of the D-band diode detector.

Conflicts of Interest

The authors declare no conflict of interest.

References

  1. Elias, L.R. Free-electron laser research at the University of California, Santa Barbara. IEEE J. Quantum Electron. 1987, 23, 1470–1475. [Google Scholar] [CrossRef]
  2. Nakazato, T.; Oyamada, M.; Niimura, N.; Urasawa, S.; Konno, O.; Kagaya, A.; Kato, R.; Kamiyama, T.; Torizuka, Y.; Nanba, T.; et al. Observation of coherent synchrotron radiation. Phys. Rev. Lett. 1989, 63, 1245. [Google Scholar] [CrossRef] [PubMed]
  3. Abo-Bakr, M.; Feikes, J.; Holldack, K.; Kuske, P.; Peatman, W.B.; Schade, U.; Wüstefeld, G.; Hübers, H.-W. Brilliant, Coherent Far-Infrared (THz) Synchrotron Radiation. Phys. Rev. Lett. 2003, 90, 094801. [Google Scholar] [CrossRef] [PubMed]
  4. Gensch, M.; Bittner, L.; Chesnov, A.; Delsim-Hashemi, H.; Drescher, M.; Faatz, B.; Feldhaus, J.; Fruehling, U.; Geloni, G.; Gerth, C.; et al. New infrared undulator beamline at FLASH. Infrared Phys. Technol. 2008, 51, 423. [Google Scholar] [CrossRef]
  5. Sei, N.; Kuroda, R.; Yasumoto, M.; Toyokawa, H.; Ogawa, H.; Koike, M.; Yamada, K. Measurement of intense coherent synchrotron radiation at frequencies around 0.1 THz using the compact S-band linac. J. Appl. Phys. 2008, 104, 114908. [Google Scholar] [CrossRef]
  6. Carr, G.L.; Martin, M.C.; McKinney, W.R.; Jordan, K.; Neil, G.R.; Williams, G.P. High-power terahertz radiation from relativistic electrons. Nature 2002, 420, 153. [Google Scholar] [CrossRef]
  7. Kim, K.J.; Shvyd’ko, Y.; Reiche, S. A Proposal for an X-Ray Free-Electron Laser Oscillator with an Energy-Recovery Linac. Phys. Rev. Lett. 2008, 100, 244802. [Google Scholar] [CrossRef] [Green Version]
  8. Emma, P.; Akre, R.; Arthur, J.; Bionta, R.; Bostedt, C.; Bożek, J.; Brachmann, A.; Bucksbaum, P.; Coffee, R.; Decker, F.-J.; et al. First lasing and operation of an ångstrom-wavelength free-electron laser. Nat. Photonics 2010, 4, 641. [Google Scholar] [CrossRef]
  9. Pile, D. First light from SACLA. Nat. Photonics 2011, 5, 456. [Google Scholar] [CrossRef]
  10. Hajima, R. Energy Recovery Linacs for Light Sources. Rev. Accel. Sci. Technol. 2010, 3, 121. [Google Scholar] [CrossRef]
  11. Bilderback, D.H.; Sinclair, C.; Gruner, S.M. Technical Report: The Status of the Energy Recovery Linac Source of Coherent Hard X-rays at Cornell University. Synchrotron Radiat. News 2006, 19, 30–35. [Google Scholar] [CrossRef]
  12. Roux, R.; Couprie, M.-E.; Hara, T.; Bakker, R.; Visentin, B.; Billardon, M.; Roux, J. The Super-ACO FEL dynamics measured with a streak camera. J. Nucl. Instrum. Methods Phys. Res. Sect. A 1997, 393, 33–37. [Google Scholar] [CrossRef]
  13. Sei, N.; Yamada, K.; Ogawa, H.; Yasumoto, M.; Mikado, T. Electron Beam Qualities with and without Free Electron Laser Oscillations in the Compact Storage Ring NIJI-IV. Jpn. J. Appl. Phys. 2003, 42, 5848. [Google Scholar] [CrossRef]
  14. Lihn, H.; Kung, P.; Settakom, C.; Wiedemann, H.; Bocek, D. Measurement of subpicosecond electron pulses. Phys. Rev. E 1996, 53, 6413. [Google Scholar] [CrossRef] [Green Version]
  15. Ieiri, T. A real time bunch-length monitor using the beam spectrum and measurements of bunch lengthening. Nucl. Instrum. Methods Phys. Res. Sect. A 1993, 329, 371. [Google Scholar] [CrossRef]
  16. Otake, Y.; Maesaka, H.; Matsubara, S.; Inoue, S.; Yanagida, K.; Ego, H.; Kondo, C.; Sakurai, T.; Matsumoto, T.; Tomizawaakurai, H.; et al. Beam monitor system for an x-ray free electron laser and compact laser. Phys. Rev. Spéc. Top. Accel. Beams 2013, 16, 042802. [Google Scholar] [CrossRef] [Green Version]
  17. Sei, N.; Ogawa, H.; Hayakawa, K.; Tanaka, T.; Hayakawa, Y.; Nakao, K.; Sakai, T.; Nogami, K.; Inagaki, M. Observation of intense terahertz-wave coherent synchrotron radiation at LEBRA. J. Phys. D Appl. Phys. 2013, 46, 045104. [Google Scholar] [CrossRef]
  18. Sei, N.; Ogawa, H.; Hayakawa, K.; Tanaka, T.; Hayakawa, Y.; Nakao, K.; Sakai, T. Measurement of a bunch length of a relativistic electron beam using a narrow-band diode detector in a terahertz region. J. Jpn. Soc. Infrared Sci. Technol. 2015, 25, 97. (In Japanese) [Google Scholar]
  19. Hayakawa, Y.; Sato, I.; Hayakawa, K.; Tanaka, T.; Nakazawa, H.; Yokoyama, K.; Kanno, K.; Sakai, T.; Ishiwata, K.; Enomoto, A.; et al. First lasing of LEBRA FEL at Nihon University at a wavelength of 1.5 μm. Nucl. Instrum. Methods Phys. Res. Sect. A 2002, 483, 29. [Google Scholar] [CrossRef]
  20. Nakao, K.; Hayakawa, K.; Tanaka, T.; Hayakawa, Y.; Sakai, T.; Sato, I.; Nogami, K.; Inagaki, M. Analysis on variation factors of optical powerat the LEBRA FEL. In Proceedings of the FEL, Liverpool, UK, 23–28 August 2009; Volume 675. Available online: http://accelconf.web.cern.ch/AccelConf/FEL2009/papers/wepc75.pdf (accessed on 6 April 2020).
  21. Hayakawa, Y.; Sato, I.; Hayakawa, K.; Tanaka, T.; Yokoyama, K.; Kanno, K.; Sakai, T.; Ishiwata, K.; Nakao, K.; Hashimoto, E. Characteristics of the fundamental FEL and the higher harmonic generation at LEBRA. Nucl. Instrum. Methods Phys. Res. Sect. A 2003, 507, 404. [Google Scholar] [CrossRef]
  22. Nakao, K.; Tanaka, T.; Hayakawa, K.; Hayakawa, Y.; Nogami, K.; Inagaki, M. Lasing of FEL with the burst mode beam at LEBRA Nihon University. In Proceedings of the 8th Annual Meeting of Particle Accelerator Society of Japan, Tsukuba, Japan, 1–3 August 2011; Volume 1051. Available online: https://www.pasj.jp/web_publish/pasj8/proceedings/poster/TUPS072.pdf (accessed on 6 April 2020). (In Japanese).
  23. Yokoyama, K.; Sato, I.; Hayakawa, K.; Tanaka, T.; Hayakawa, Y.; Nakao, K. Measurement of electron bunch length at LEBRA. In Proceedings of the 1st Annual Meeting of Particle Accelerator Society of Japan and 29th Linear Accelerator Meeting in Japan, Funabashi, Japan, 4–6 August 2004; Volume 602. Available online: https://www.pasj.jp/web_publish/pasj1_lam29/WebPublish/5P58.pdf (accessed on 6 April 2020). (In Japanese).
  24. Smiths Interconnect on the Web (The Current Model Number is DET-06). Available online: https://www.smithsinterconnect.com/products/multi-function-rf-systems/mixers-and-detectors/general-purpose-detector-(det)/ (accessed on 24 April 2020).
  25. Takahashi, T.; Takami, K. Observation of THz coherent transition radiation from single-bunch beam at KURRI-LINAC as an intense pulsed light source. Infrared Phys. Technol. 2008, 51, 363. [Google Scholar] [CrossRef]
  26. Grischkowsky, D.; Keiding, S.; Van Exter, M.P.; Fattinger, C. Far-infrared time-domain spectroscopy with terahertz beams of dielectrics and semiconductors. J. Opt. Soc. Am. B 1990, 7, 2006. [Google Scholar] [CrossRef]
  27. Mira, N.; Robert, E.M. Terahertz Time-Domain Spectroscopy for Material Characterization. Proc. IEEE 2007, 95, 1658. [Google Scholar] [CrossRef]
  28. HITRAN on the Web. Available online: http://hitran.iao.ru/ (accessed on 29 February 2020).
  29. Jackson, J.D. Longitudinal plasma oscillations. J. Nucl. Energy 1960, 1, 171. [Google Scholar] [CrossRef]
  30. Kan, K.; Yang, J.; Kondoh, T.; Norizawa, K.; Yoshida, Y. Effects of emittance and space-charge in femtosecond bunch compression. Nucl. Instrum. Methods Phys. Res. Sect. A 2008, 597, 126. [Google Scholar] [CrossRef]
Figure 1. Layout of the LEBRA linac at Nihon University.
Condensedmatter 05 00034 g001
Figure 2. Pattern diagrams of full-bunch mode and burst-mode.
Condensedmatter 05 00034 g002
Figure 3. High-speed grid pulse timing of burst-mode operations for single and two-bunch modes.
Condensedmatter 05 00034 g003
Figure 4. Outline of CSR measurement equipment at LEBRA.
Condensedmatter 05 00034 g004
Figure 5. Measurement results of sensitivity characteristics for the D-band diode detector.
Condensedmatter 05 00034 g005
Figure 6. Measurements of the transmission characteristics corresponding to the band-pass filter.
Condensedmatter 05 00034 g006
Figure 7. Relation between electron charge and radiation intensity.
Condensedmatter 05 00034 g007
Figure 8. Relationship between the magnitude of electron charge and CSR intensity PBPF during burst mode.
Condensedmatter 05 00034 g008
Figure 9. Dependence of PBPF/q2 on q2/3 corresponding to the horizontal and vertical polarization components.
Condensedmatter 05 00034 g009
Figure 10. RMS bunch length evaluated for vertical polarization data in Figure 9.
Condensedmatter 05 00034 g010
Figure 11. Relation between frequency and B(f)F(f)Ie(f).
Condensedmatter 05 00034 g011

