1. Introduction
Lithium fluoride (LiF) is a radiation-sensitive material in which ionizing radiations, such as charged particles (ions and electrons) and photons (EUV, X-rays, and γ-rays), can efficiently generate primary and aggregate color centers (CCs) that are stable at room temperature. The 2D imaging LiF detectors rely on the photoluminescence of radiation-induced electronic defects, known as CCs, in particular F
2 and F
3+ defects, which consist of two electrons bound to two and three close anion vacancies, respectively. These defects have almost overlapping broad absorption bands (M band) peaked at about 450 nm [
1] and therefore, they can be simultaneously excited with a single pump wavelength in the blue spectral interval. On the other hand, they exhibit two different Stokes-shifted broad emission bands in the green (F
3+) and red (F
2) spectral ranges [
1]. Several peculiar features of such solid-state LiF luminescent detectors, i.e., very high spatial resolution [
2,
3] over a large field of view, wide dynamic range [
4], versatility and simplicity of use, and sensitivity of the optical fluorescence reading technique, make them very promising and attractive for X-ray imaging applications [
5]. LiF-based imaging detectors have been proposed and tested by using several X-ray sources, such as laboratory sources [
3,
5,
6] and large-scale facilities [
7], for soft X-ray microscopy of biological specimens [
8], phase contrast imaging [
9], and for X-ray beam characterizations [
5]. LiF crystals and films were used as imaging detectors for 2D visualization of pulsed soft [
10] and hard [
4] X-ray FEL beam. Moreover, volumetric detection for 3D X-ray imaging applications by using radiation-induced defects in several insulating materials, such as LiF crystal [
11] and phosphate glass [
12] at different X-ray energies and sources, is a topical task nowadays. Investigations of luminescent materials for 3D dose mapping and imaging of ionizing radiations are crucial for dosimetry and optical data storage applications. In this paper, LiF crystals irradiated with 8 keV monochromatic X-rays and with the broadband white beam spectrum of a synchrotron bending magnet at the synchrotron light source of the Karlsruhe Institute of Technology (KIT, Germany) have been investigated with confocal optical systems: fluorescence microscopy and Raman micro-spectroscopy. The 3D reconstruction of the X-ray-induced CC distributions has been performed with both confocal techniques, obtaining fluorescence and Raman mapping of X-ray colored volumes.
2. Materials and Methods
Commercial LiF crystals in the form of squared plates polished on both surfaces were irradiated at the synchrotron light source of KIT. A LiF crystal (5 × 5 mm
2, 0.5 mm thickness, in the following referred to as LiFC1) was irradiated with the broadband white beam spectrum of a synchrotron bending magnet and a LiF crystal (10 × 10 mm
2, 1 mm thickness, in the following referred to as LiFC2) was irradiated with the 8 keV monochromatic X-ray beam. The crystals were placed on axis of the synchrotron beam with the possibility of movement in the X and Y directions perpendicularly to the beam axis, and they were irradiated at normal angle of incidence. The LiFC1 sample was irradiated with the broadband white beam (3–40 keV) with a flux of 10
16 ph/s. When the beamline works in white-beam mode, the only optical component that is positioned in the beam path is a 500-μm thick polished beryllium window. The attenuation exerted by the Be-window as well as the contribution of the air gap between the shutter and the sample were considered to calculate the photon flux impinging on the LiFC1 sample, which was estimated to be around 2 × 10
13 ph/(s·mm
2). In the irradiation of the LiFC1 sample, a commercial test pattern X500-200-30 (Xradia, Pleasanton, CA, USA), consisting of 330-nm thick gold mask deposited on a (500 × 500) μm
2 Si
3N
4 window, was positioned at a distance of 26 cm from the exit of the beam (at 29 m from the irradiation source). The propagation distance between the test pattern and the LiFC2 sample was set equal to 17.5 cm, thus performing a lensless projection imaging experiment [
13,
14]. To impress the X-ray image of the test pattern on the LiFC1 detector, the test pattern was irradiated with several exposure times between 1 s and 60 s. The beam size was set equal to (800 × 800) μm
2. The LiFC2 sample was also irradiated by the monochromatic 8 keV X-ray beam for 112 s on a uniform area of 4 × 4 mm
2, with an estimated dose of about 6 Gy/s.
The Photoluminescence (PL) and Photoluminescence Excitation (PLE) spectra of the X-ray irradiated LiF crystals were collected at room temperature (RT) with a Horiba Scientific Fluorolog-3 spectrofluorimeter Model FL3-11, equipped with a 450 W Xenon lamp, automatic slits, single-grating excitation, emission spectrometers, and a photomultiplier for PL signal detection, adopting a front-face detecting geometry. The optical absorption measurements of the irradiated LiF crystals were performed by using a Perkin-Elmer Lambda 1050 spectrophotometer at normal incidence. The spectral range was set to 190–1000 nm with 1-nm resolution.
Both irradiated LiF plates store volumetric information through local generation of stable CCs produced by X-rays along the crystal depth. After irradiation, LiF crystals (LiFC1 and LiFC2) were analyzed by a confocal laser scanning microscope (CLSM) operating in fluorescence mode and by a confocal laser scanning Raman micro-spectrometer. In the case of the CLSM reading system (Nikon 80i-C1), the LiF crystals were illuminated by a 445-nm continuous laser (with nominal output power of 1.5 mW) pumping in the CC absorption band peaked at about 450 nm. The spectrally-integrated PL signal was detected by photomultipliers. The CLSM is a significant evolution of the conventional optical microscope. By scanning along the Z optical axis, the CLSM performs an optical sectioning of the observed sample by using a pinhole in front of the detector positioned in a conjugate plane with respect to the focus one and detecting only signals from the in-focus plane by eliminating signals from out-of-focus ones. The optical sectioning allows obtaining a tri-dimensional (3D) reconstruction of the sample [
13]. In previous works, the CLSM system in fluorescence mode was used as reading system to detect 2D high-spatial-resolution and high-contrast X-ray images stored in irradiated LiF crystal detectors [
7,
14]. In this work, the optical sectioning capabilities have been exploited to reconstruct the 3D depth distribution of the CCs in the colored volumes. The 2D and 3D Raman maps were measured by a Raman spectrometer combined with a confocal microscope (Horiba XploRA Plus) by exciting with a 532-nm wavelength laser. When a Raman spectrometer is combined with a confocal optical microscope, it is possible to acquire the information of a complete Raman spectrum in each point of the 2D and 3D maps by scanning the sample in XYZ directions.
3. Results and Discussion
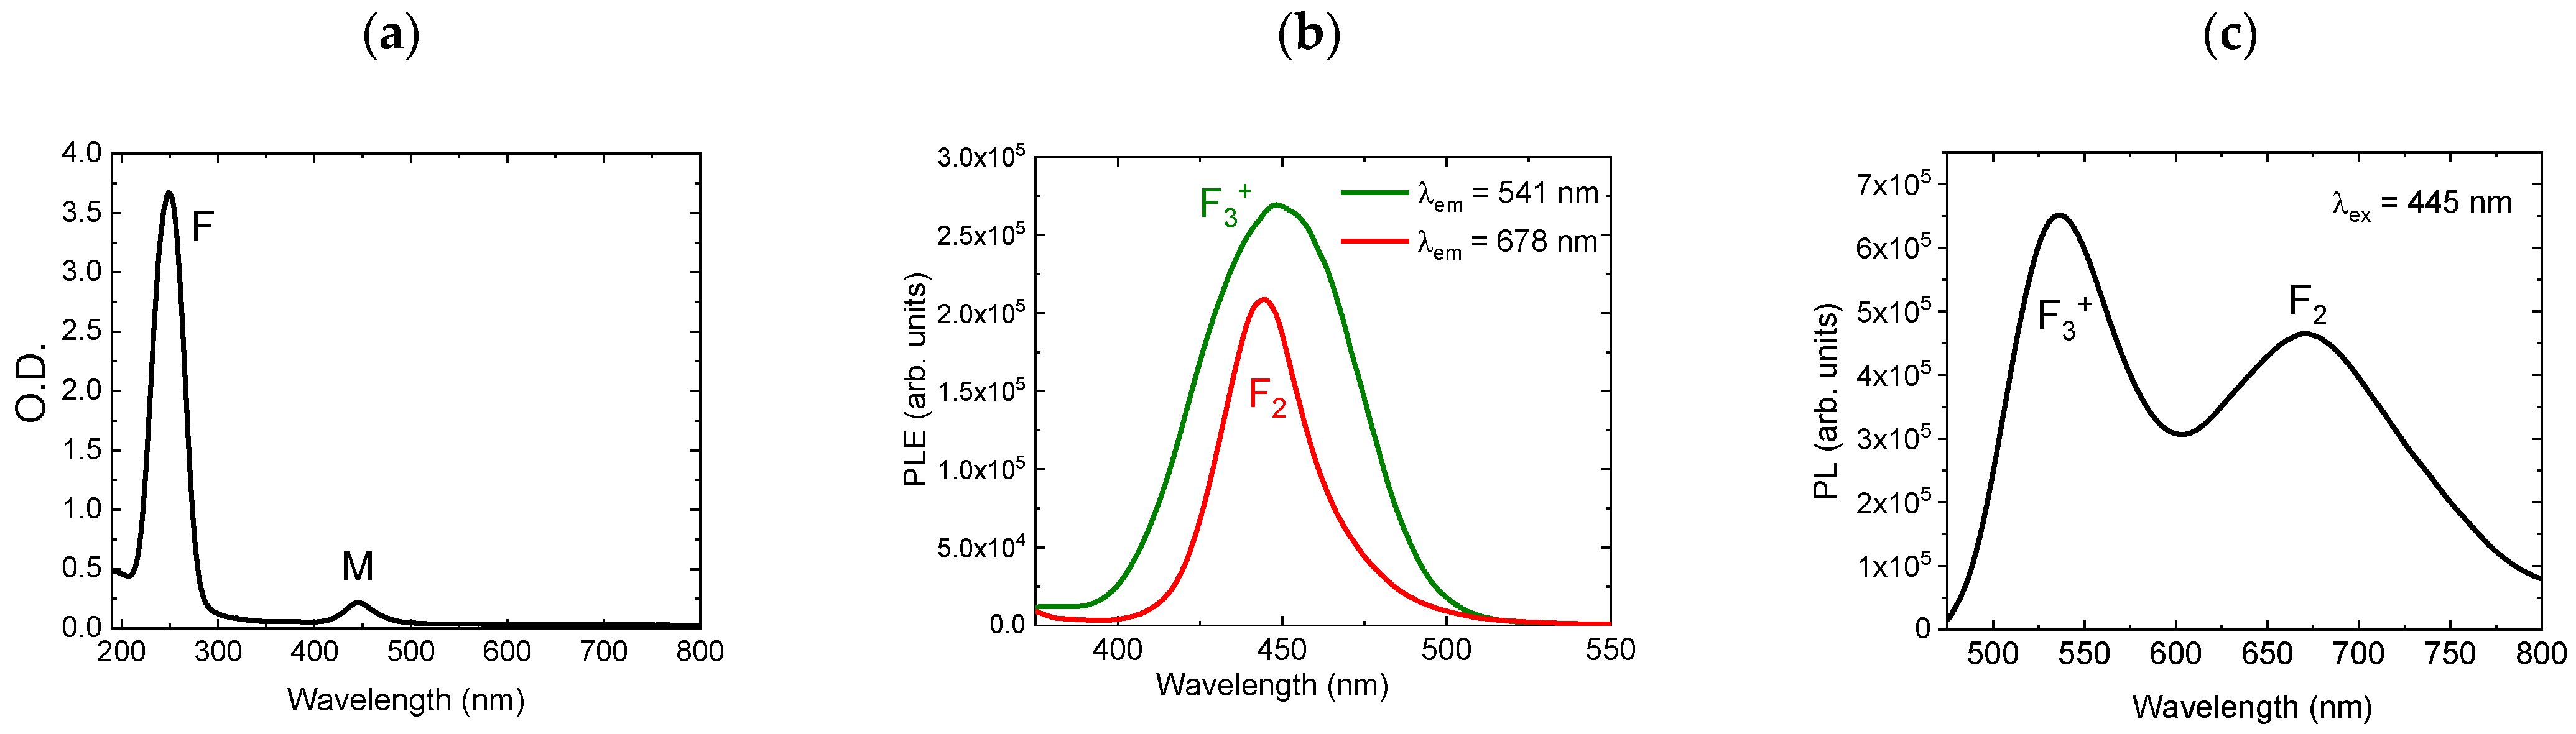
Figure 1a shows the optical absorption spectrum in optical density units (O.D) of the LiF crystal (LiFC2) irradiated with 8 keV X-rays on a uniform area. The formation of stable primary F centers and aggregate defects was inferred by the presence of the main F and M absorption bands.
Figure 1b shows the PLE spectra of the sample LiFC2 acquired at two different emission wavelengths (541 nm and 678 nm) corresponding to F
3+ and F
2 CCs, respectively. The PLE spectra show the excitation wavelength for which the PL emission of F
2 and F
3+ defects is optimized. The results demonstrate that for both CCs a blue light is preferred for efficiently exciting their PL emission in the red and green spectral ranges. In this regard,
Figure 1c reports the PL spectrum of the LiFC2 sample acquired at the excitation wavelength of 445 nm, which consists in the overlapping of the two broad emission bands in the green and red spectral intervals due to F
3+ and F
2 CCs, respectively.
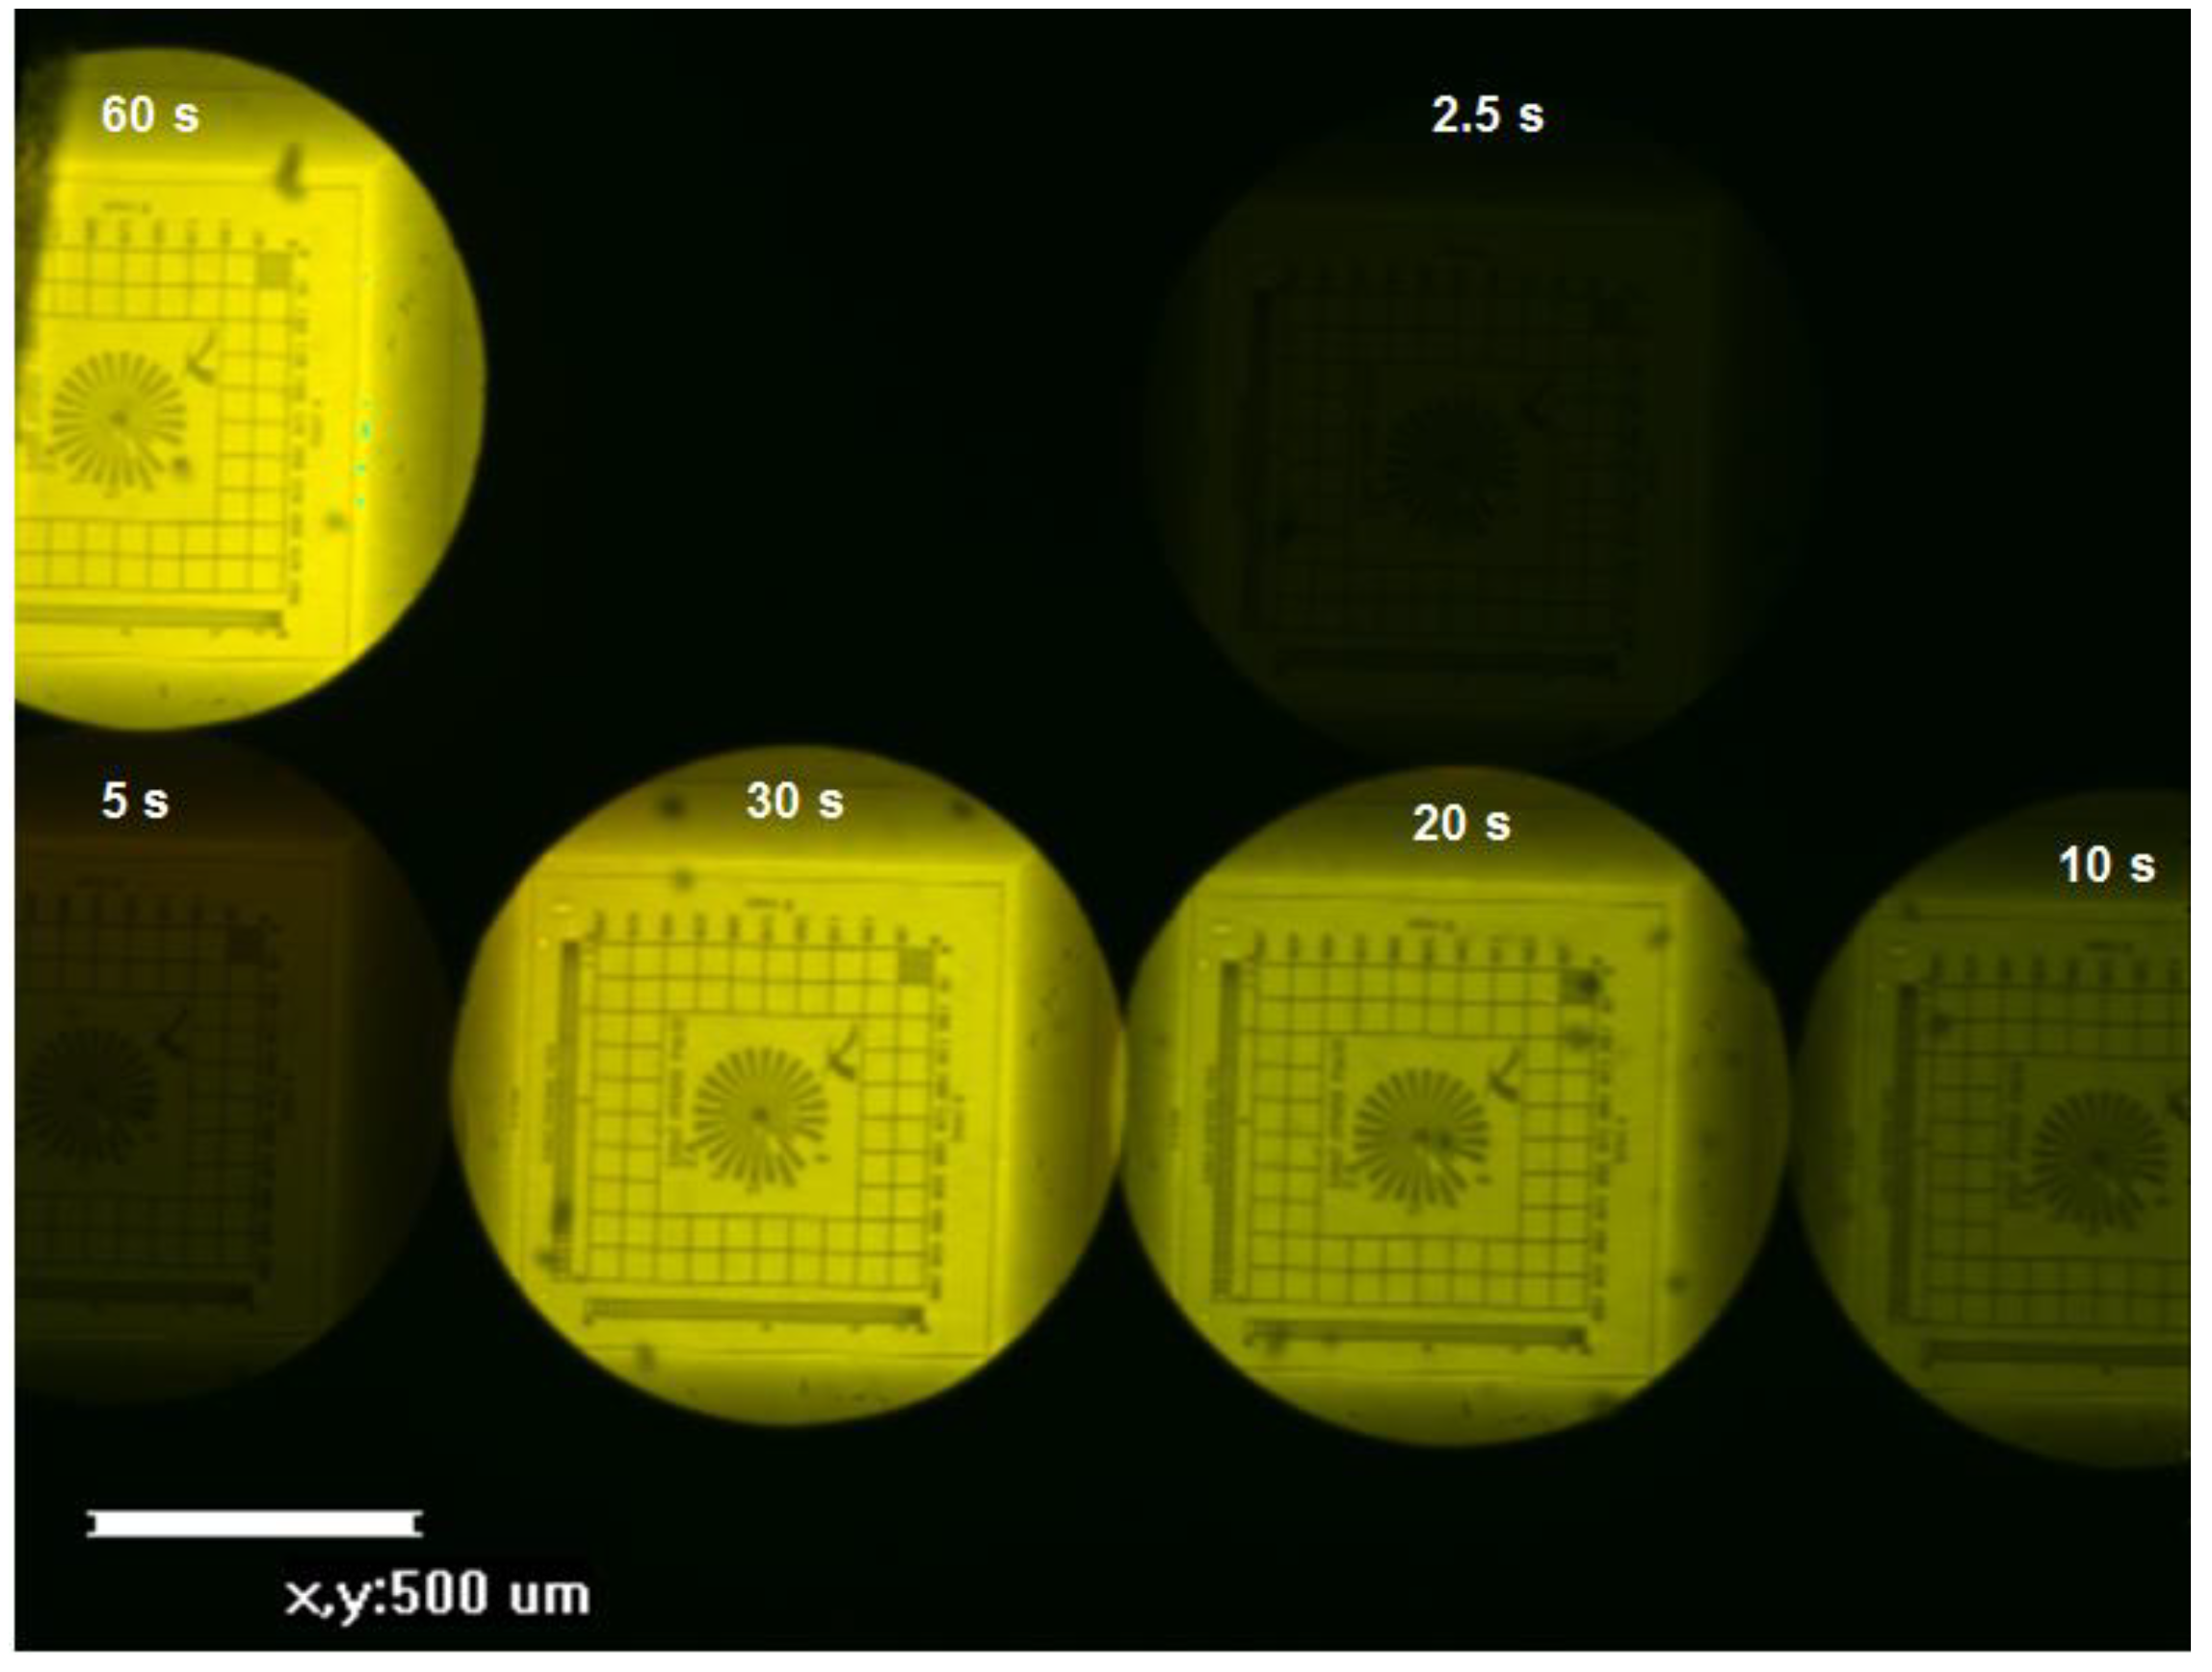
Figure 2 shows the fluorescence images (overlapping F
3+ and F
2 CC signals) of the same test pattern stored in the LiFC1 sample irradiated with the broadband white beam at different exposure times and detected with the confocal fluorescence microscope. For each circular spot, the position was obtained by moving the LiF crystal in the X and Y directions perpendicularly to the beam axis and the irradiation was performed at different X-ray exposure times. This picture, obtained by using a low-magnification objective of the fluorescence microscope, demonstrates that LiF detectors are able to store X-ray images in a large field of view with high spatial resolution, as also reported in
Figure 3. The high dynamic range of the detector is demonstrated by its capability to store images with very different exposure times and it is limited by the dynamic range of the reading system (12 bit). In a previous paper [
7], the absorption and PL intensities of F
3+ and F
2 CCs as functions of irradiation times were investigated and the linear behavior of both signals was observed.
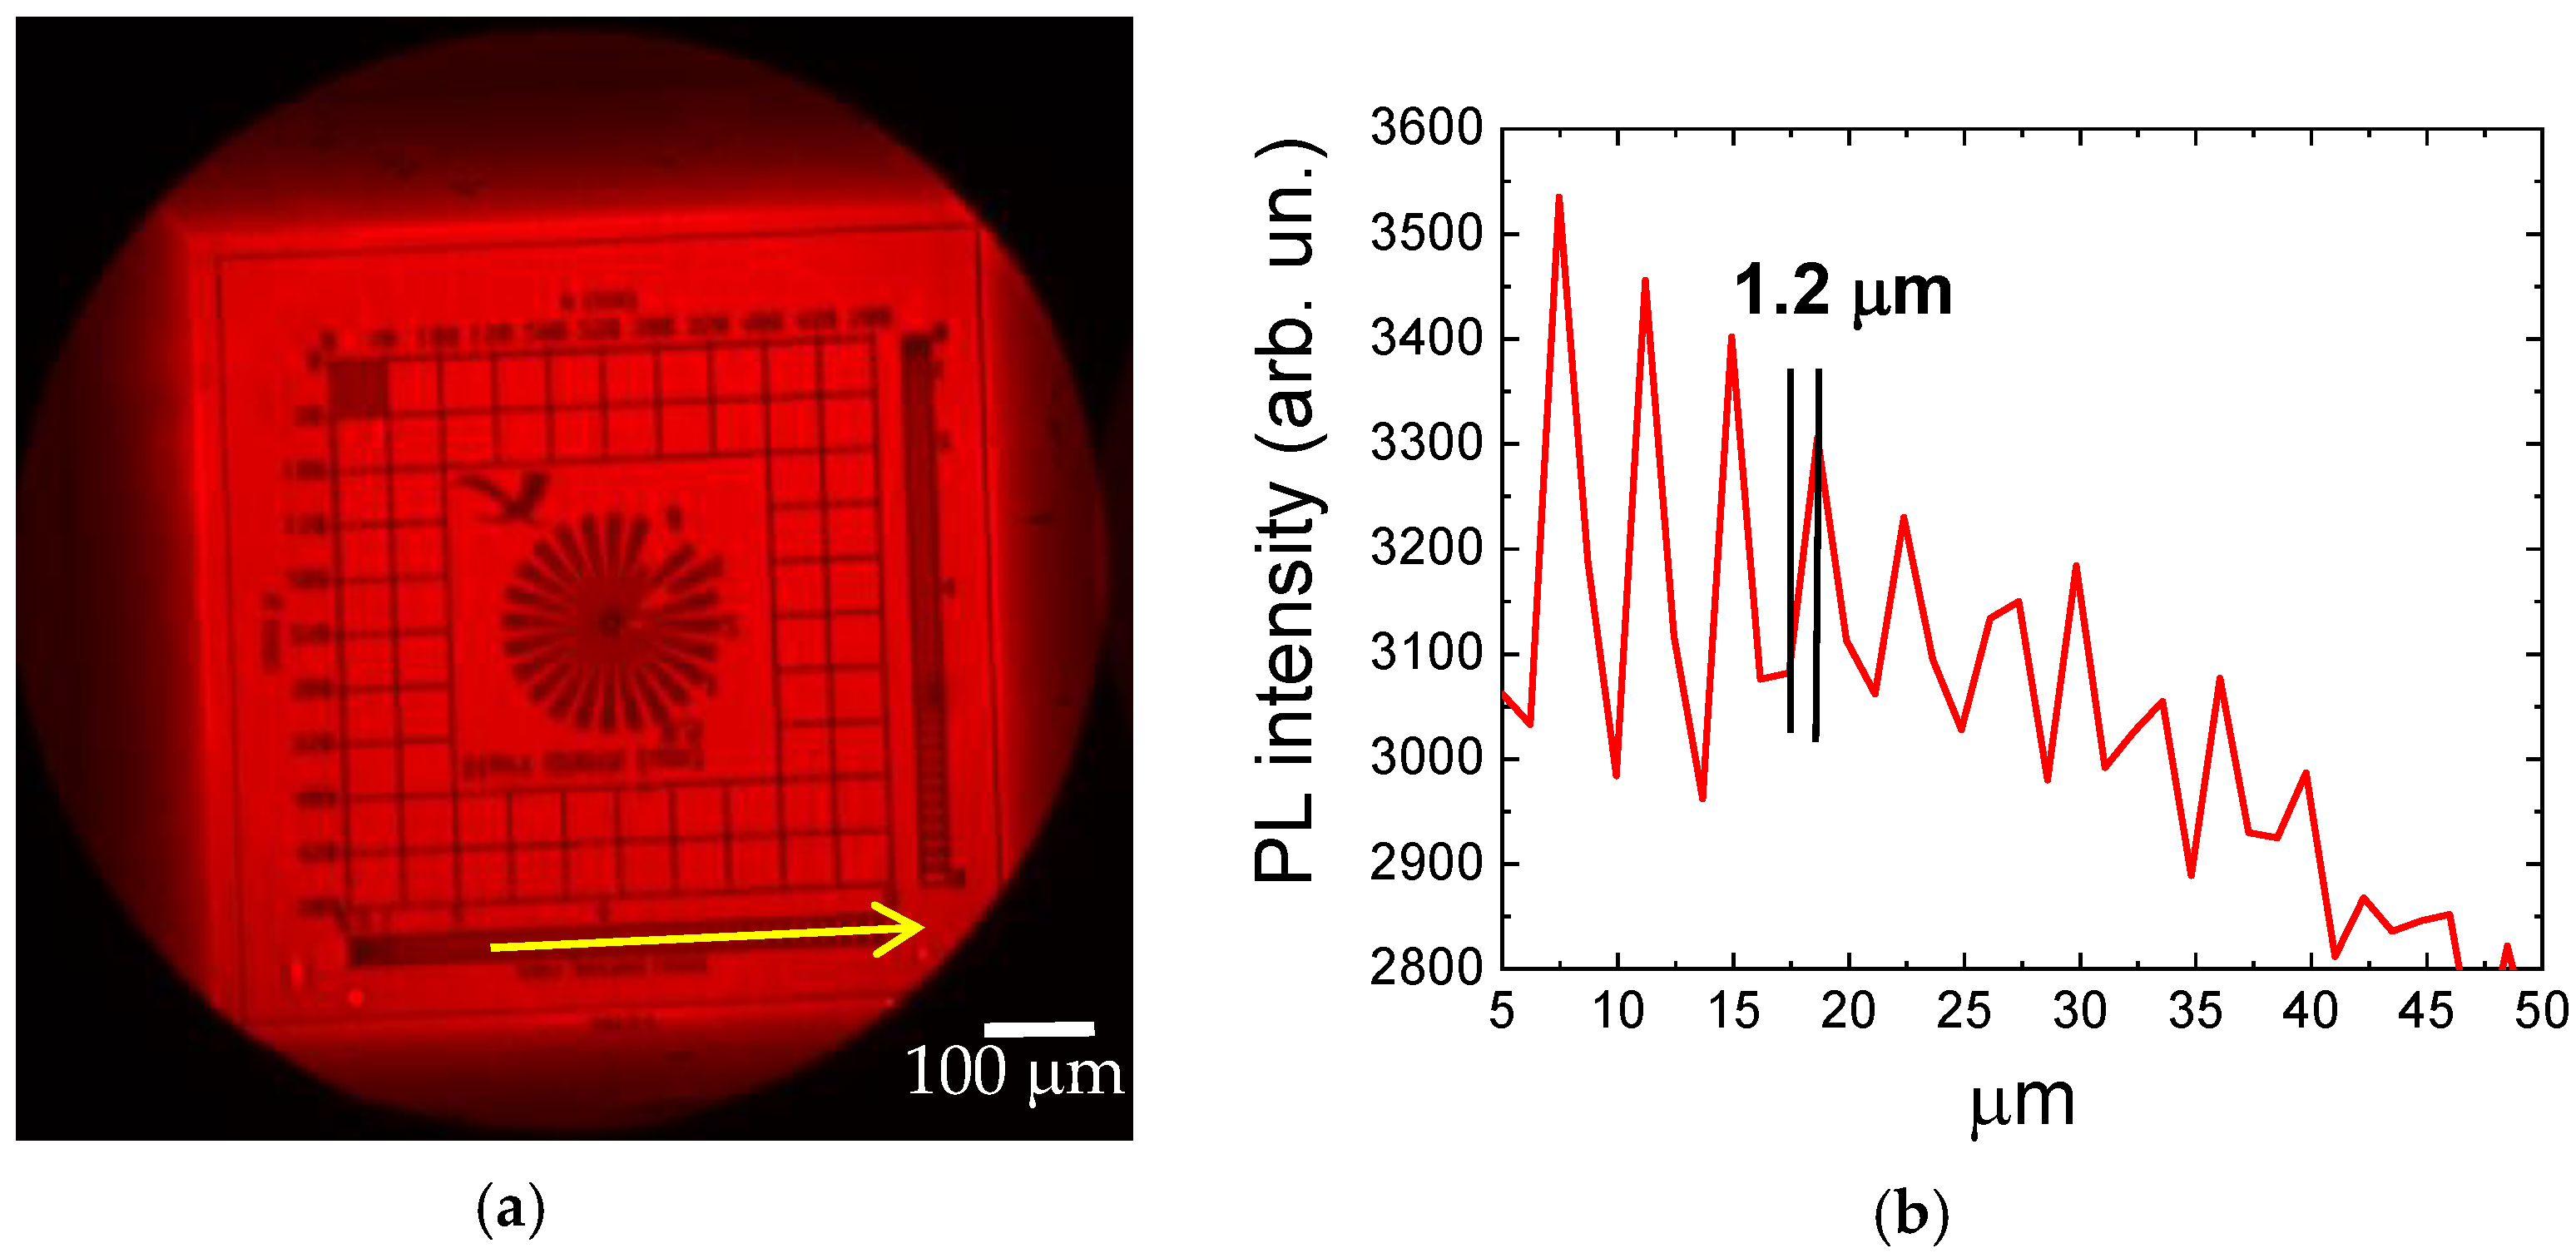
Figure 3a shows the red (F
2) photoluminescent 2D image acquired by the CLSM of the irradiated LiF crystal LiFC1 storing the projected image of the test pattern obtained by irradiating for 30 s with the white broadband X-ray beam.
Figure 3b reports the intensity profile of the PL signal along a periodic structure of the test pattern with decreasing period; it may be observed that the micrometric details of the pattern X-ray image stored in the LiF crystal are well resolved.
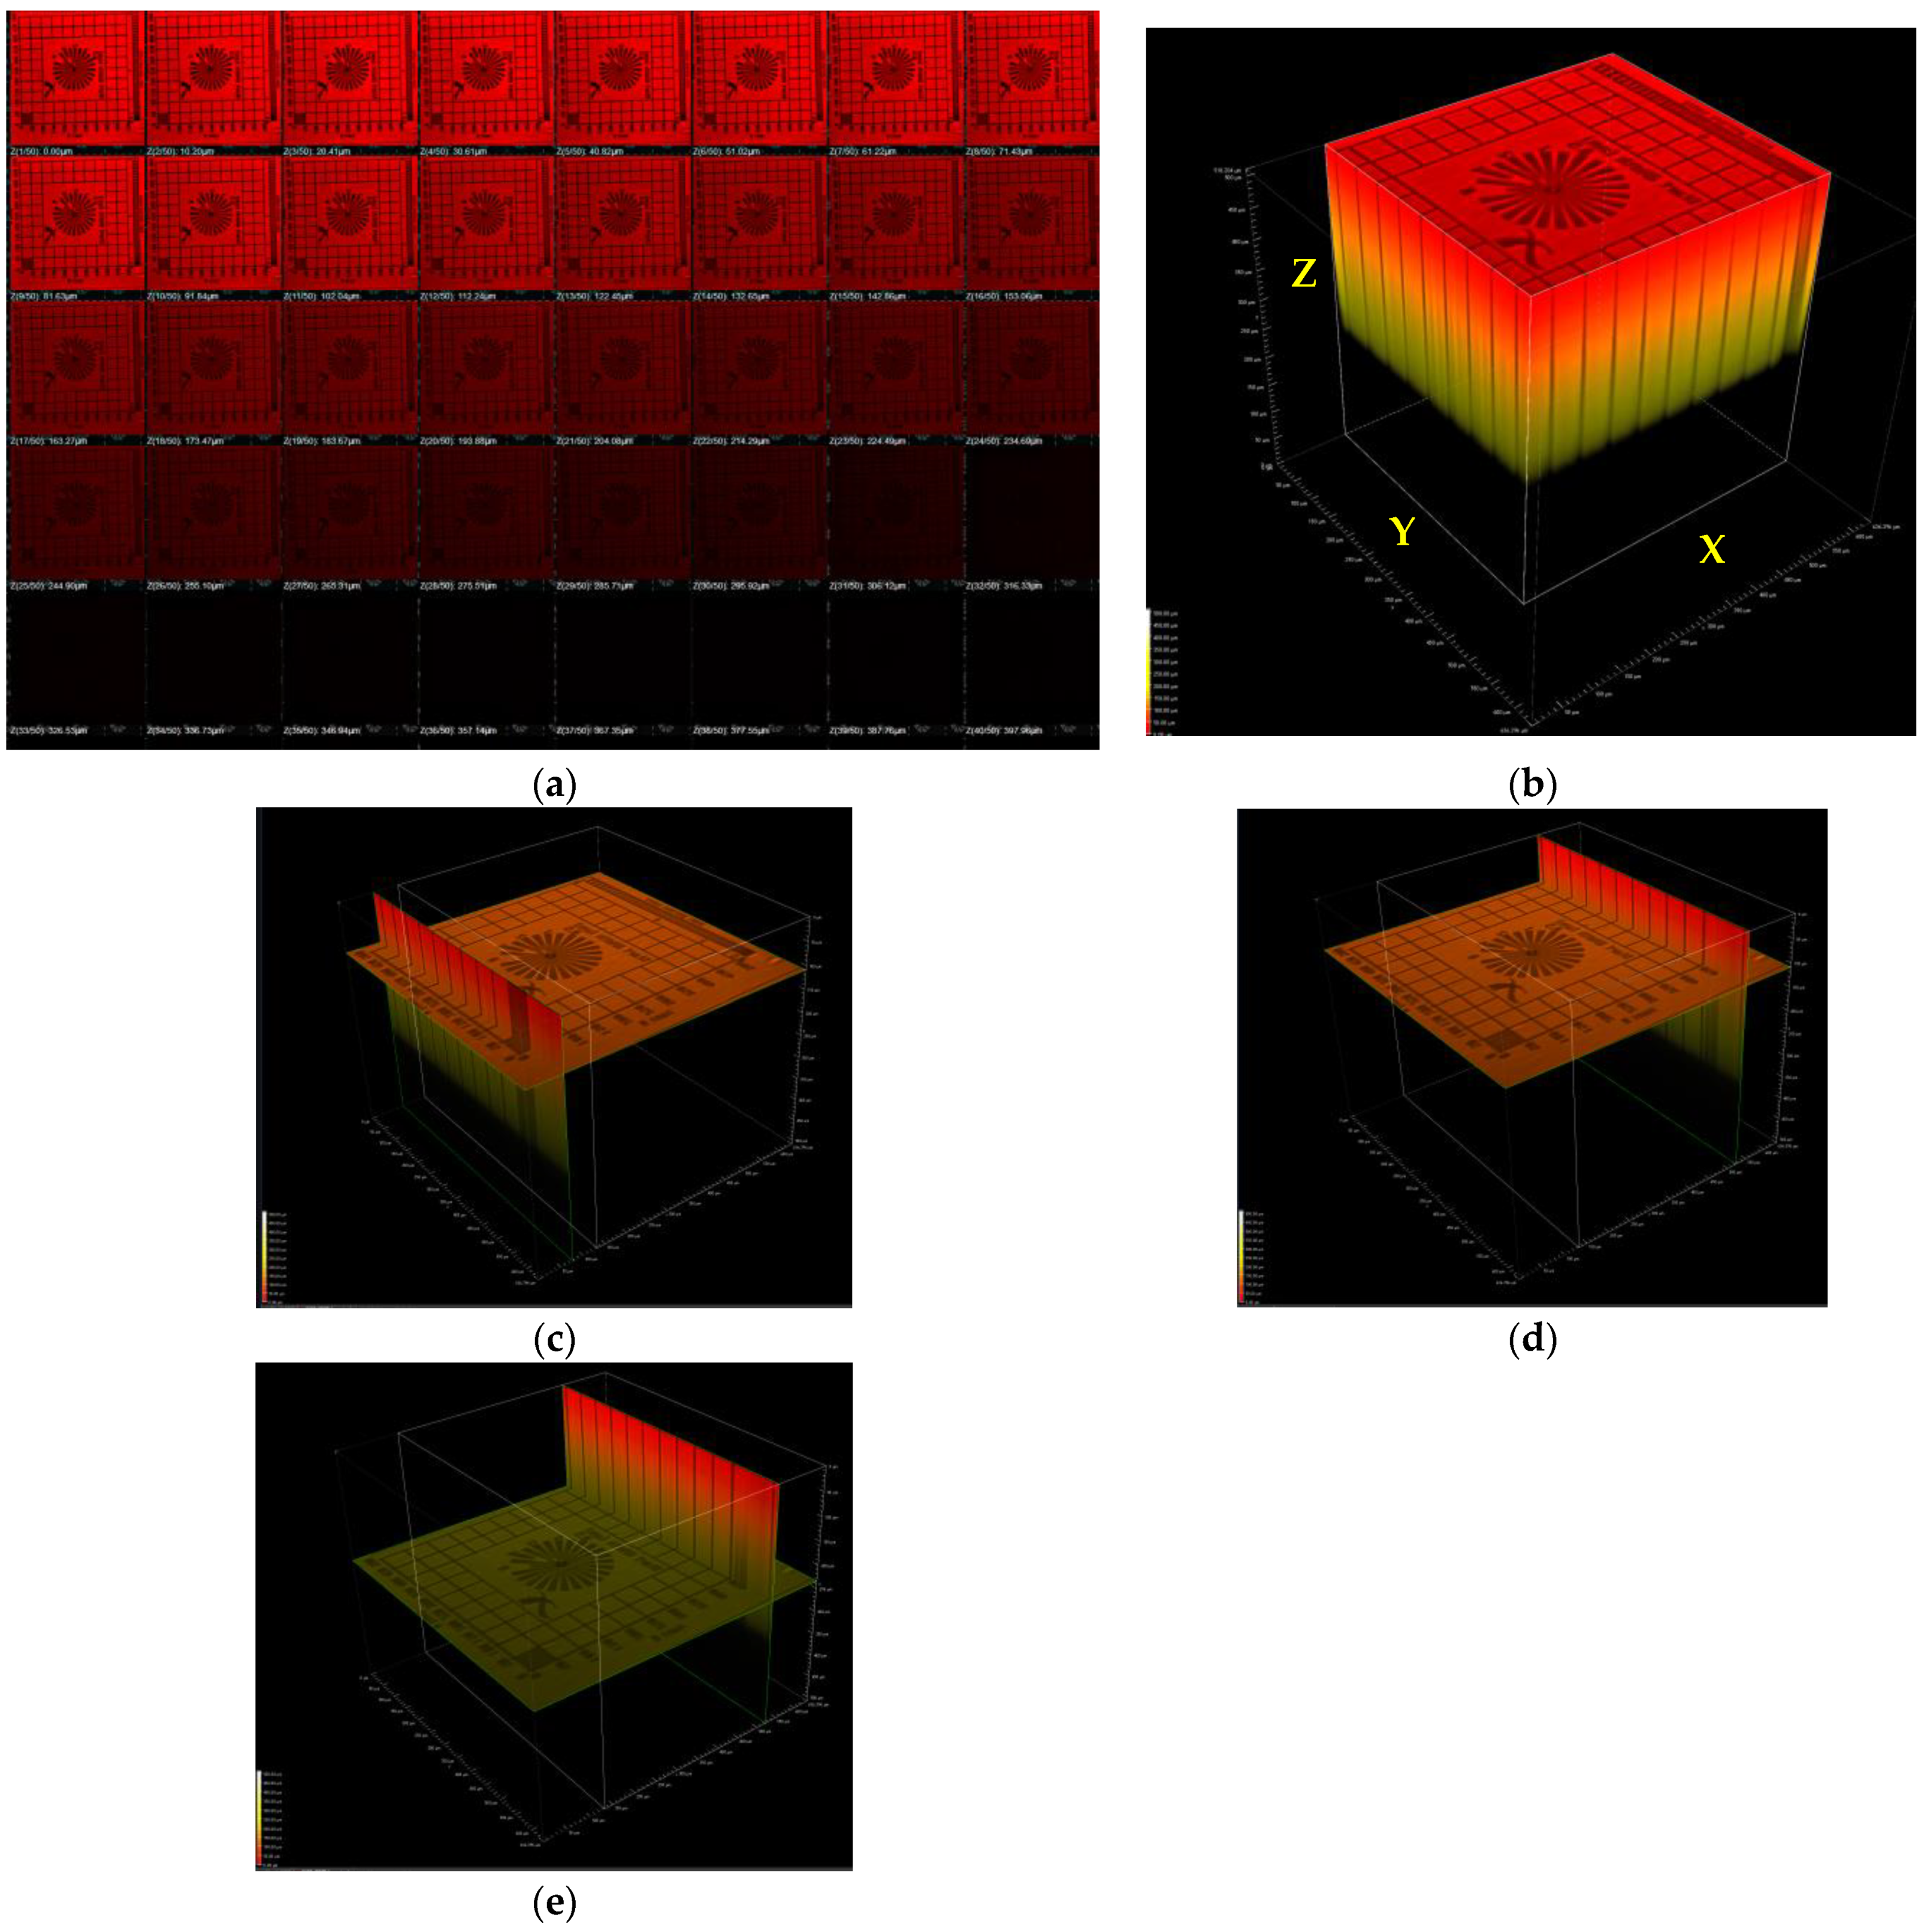
By using the optical sectioning operation of the CLSM system along the optical Z axis by controlled spatial increments, several slices along the colored volume of the irradiated 500-μm thick LiF crystal were obtained. A set of red (F
2 CCs) 2D images at different Z positions detected in fluorescence mode are shown in
Figure 4a. The software of the confocal microscope, after acquisition of the 2D slices, performs a 3D reconstruction of the images (
Figure 4b) and it can show Z sections along X, Y directions of the acquired volume as reported in
Figure 4c–e. Results in
Figure 4 clearly show that the X-ray image of the pattern is well resolved along the thickness of the irradiated LiF crystal.
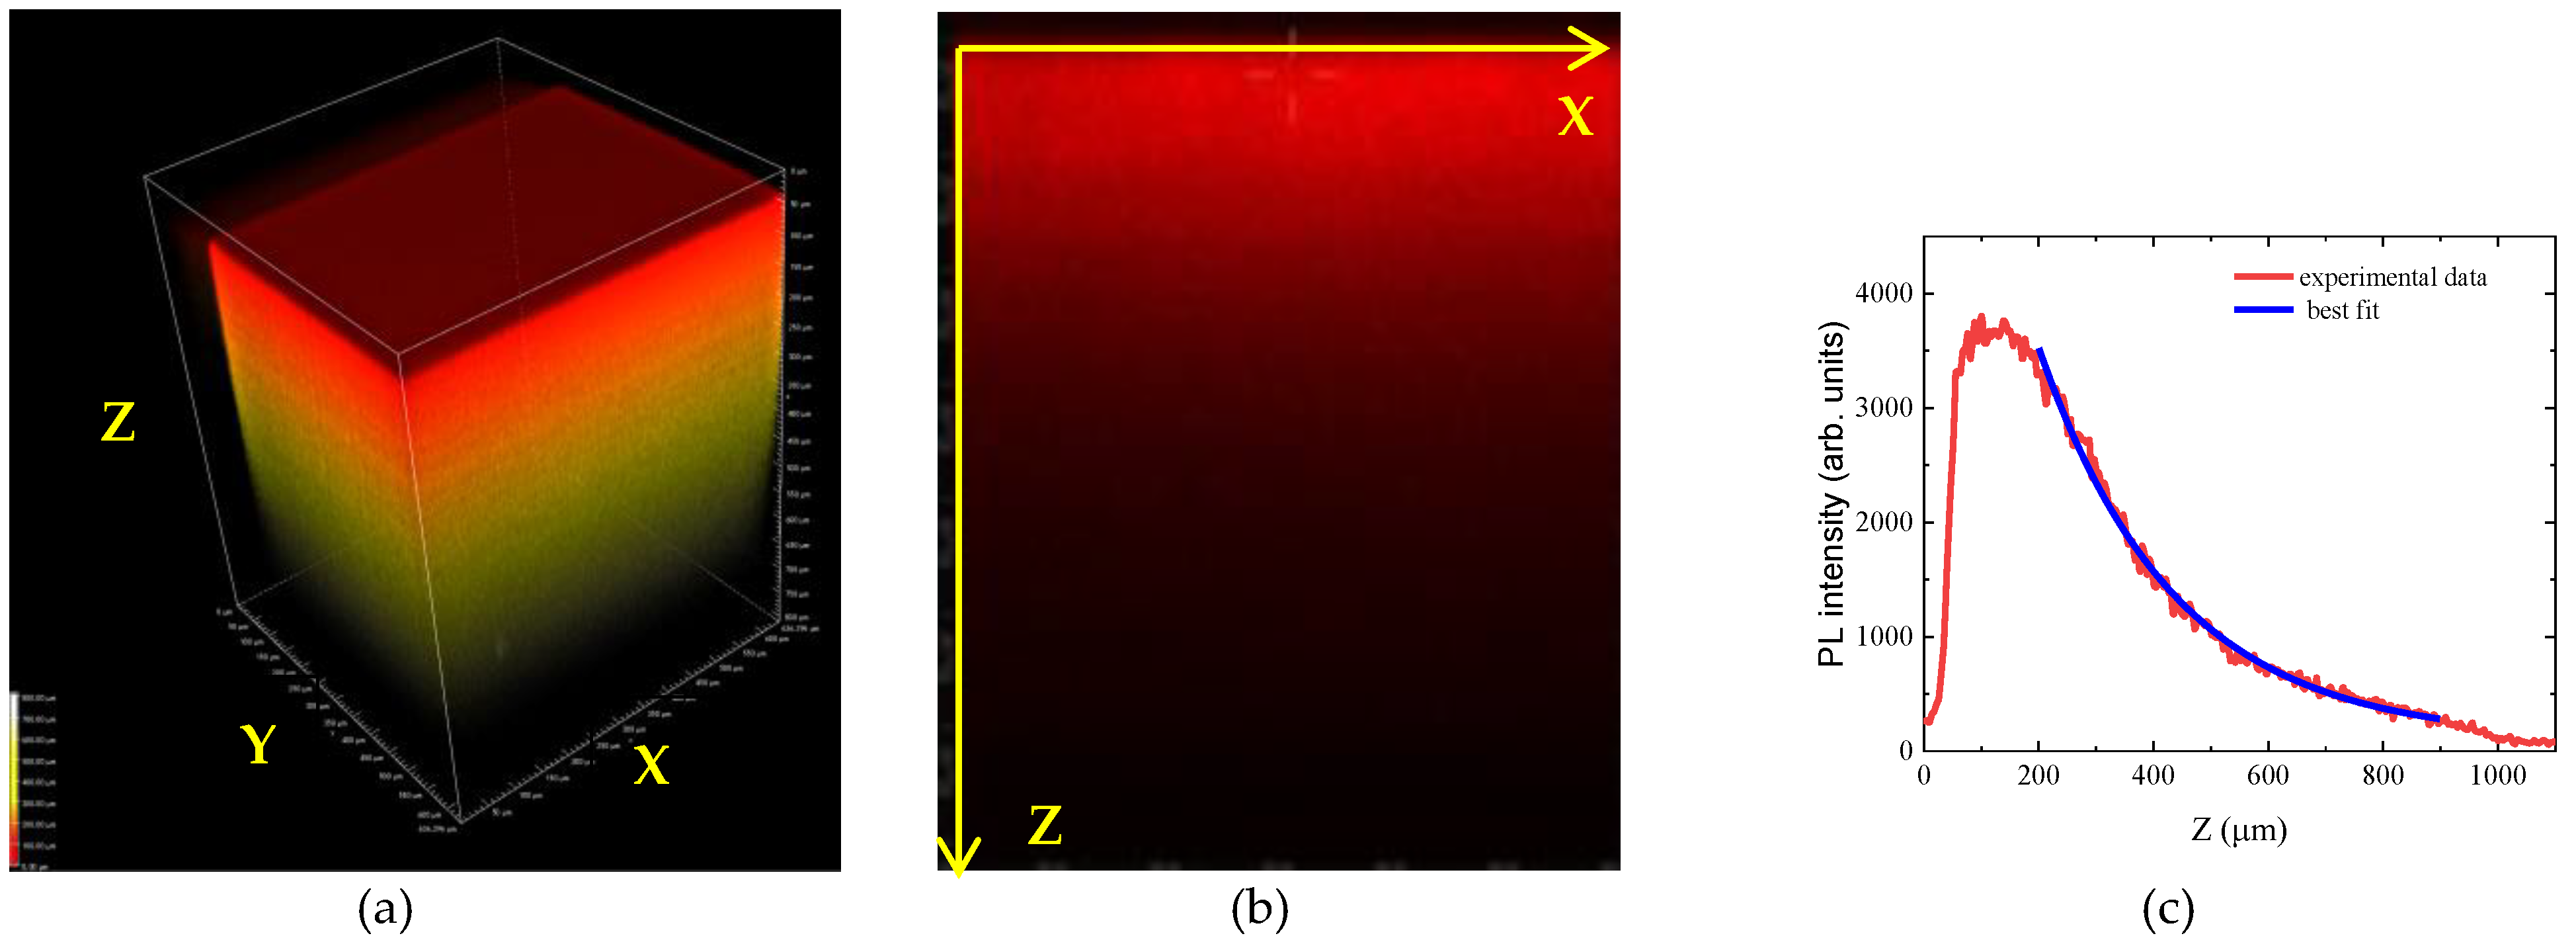
Figure 5a reports the 3D reconstruction (XY = 636 × 636 μm
2, Z = 1 mm) of the colored volume obtained by detecting the F
2 PL signal of the 8 keV X-ray irradiated LiF crystal on a uniform area (sample LiFC2) by means of the CLSM. A selected XZ slice of the 3D reconstruction showing the Z distribution of the F
2 fluorescence intensity along the thickness of the LiF crystal (1 mm) is shown in
Figure 5b.
Figure 5c reports the PL intensity profile along the Z scan optical axis of the 3D image reported in
Figure 5b. According to the X-ray transmission properties in solids [
15], the energy deposition of the X-ray beam exponentially decreases along the penetration depth in LiF. Assuming that CC concentrations are proportional to the deposited energy, the confocal fluorescence microscope is an appropriate technique to investigate the X-ray colored profile along the crystal thickness (Z direction). The experimental F
2 PL profile (red curve) is shown in
Figure 5c together with its best fit with a single exponential curve (blue curve), a value of (236 +/− 3) μm, corresponding to the 1/e of the maximum, being obtained. The theoretical X-ray attenuation length in LiF corresponding to an X-ray energy of ~8 keV is 331 μm [
15]. Since possible re-absorption phenomena of pumping laser by CCs or reabsorption of the CC PL during CLSM Z-scanning measurements could occur in this 3D characterization, a comparison with the confocal Raman micro-spectrometer was performed.
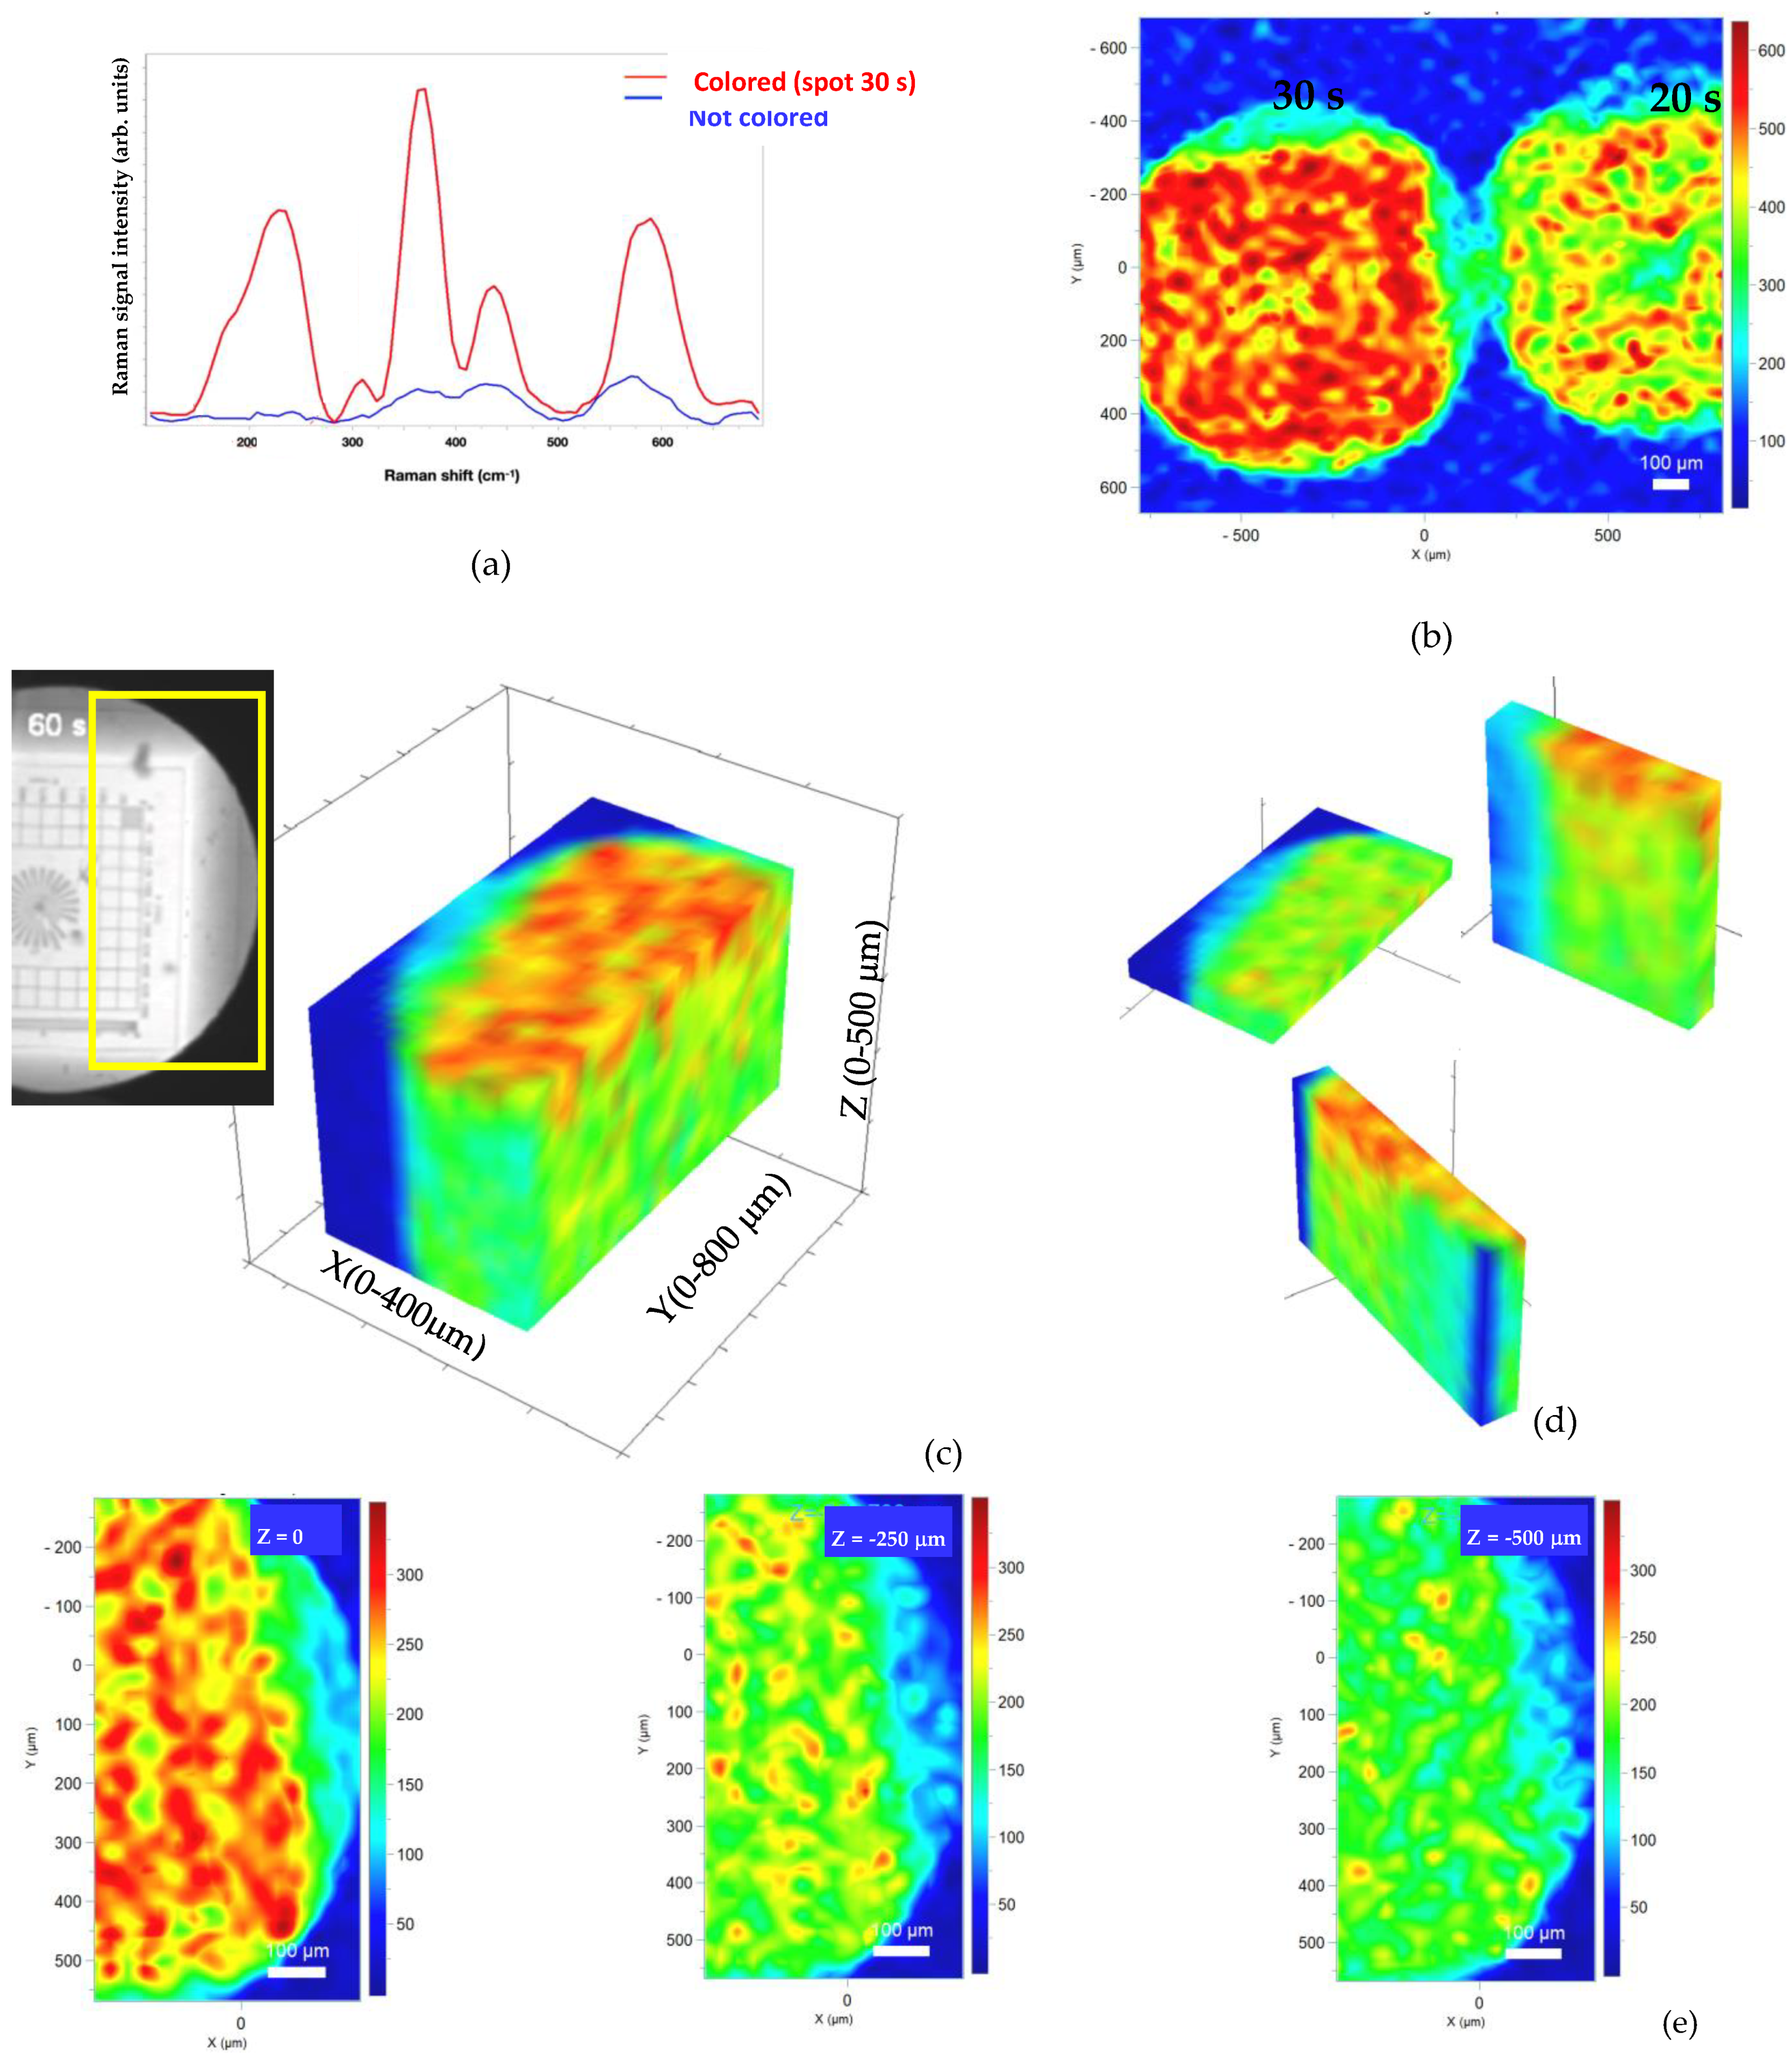
The results of the comparison between the Raman spectrum acquired with a 532-nm excitation wavelength in a point of a colored area of the LiF crystal (LiFC1) irradiated by the white beam (exposure time 30 s) and the one acquired in a point of a not-colored region are shown in
Figure 6a. It is evident that the presence of aggregated color centers produces the appearance of the first order peak of the LiF Raman spectrum.
Figure 6b reports a 2D Raman map of an area of the LiFC1 with two colored spots obtained with X-ray exposure times of 30 s and 20 s. The Raman map is obtained by scanning the sample in a prefixed grid and using the band peak intensity at about 220 cm
−1 as contrasting parameter. In
Figure 6b, a higher Raman signal for the spot with the higher irradiation time is evident. By using the optical sectioning of the confocal Raman spectrometer, several 2D Raman maps along the colored volume of the irradiated 500-μm thick LiF crystal were acquired. A 3D Raman map (
Figure 6c) of a selected region (XY = 400 × 800 μm
2, Z = 0–500 μm, Z step = 30 μm) of the spot irradiated for 60 s (highlighted in the yellow rectangle on the fluorescence image in the inset on the left) has been obtained (nominal excitation laser power of 75 mW).
Figure 6d reports XY, XZ, YZ slices of the
Figure 6c.
Figure 6e reports 2D (XY) Raman map slices for Z = 0 (top surface), Z = −250 μm and Z = −500 μm (bottom surface).
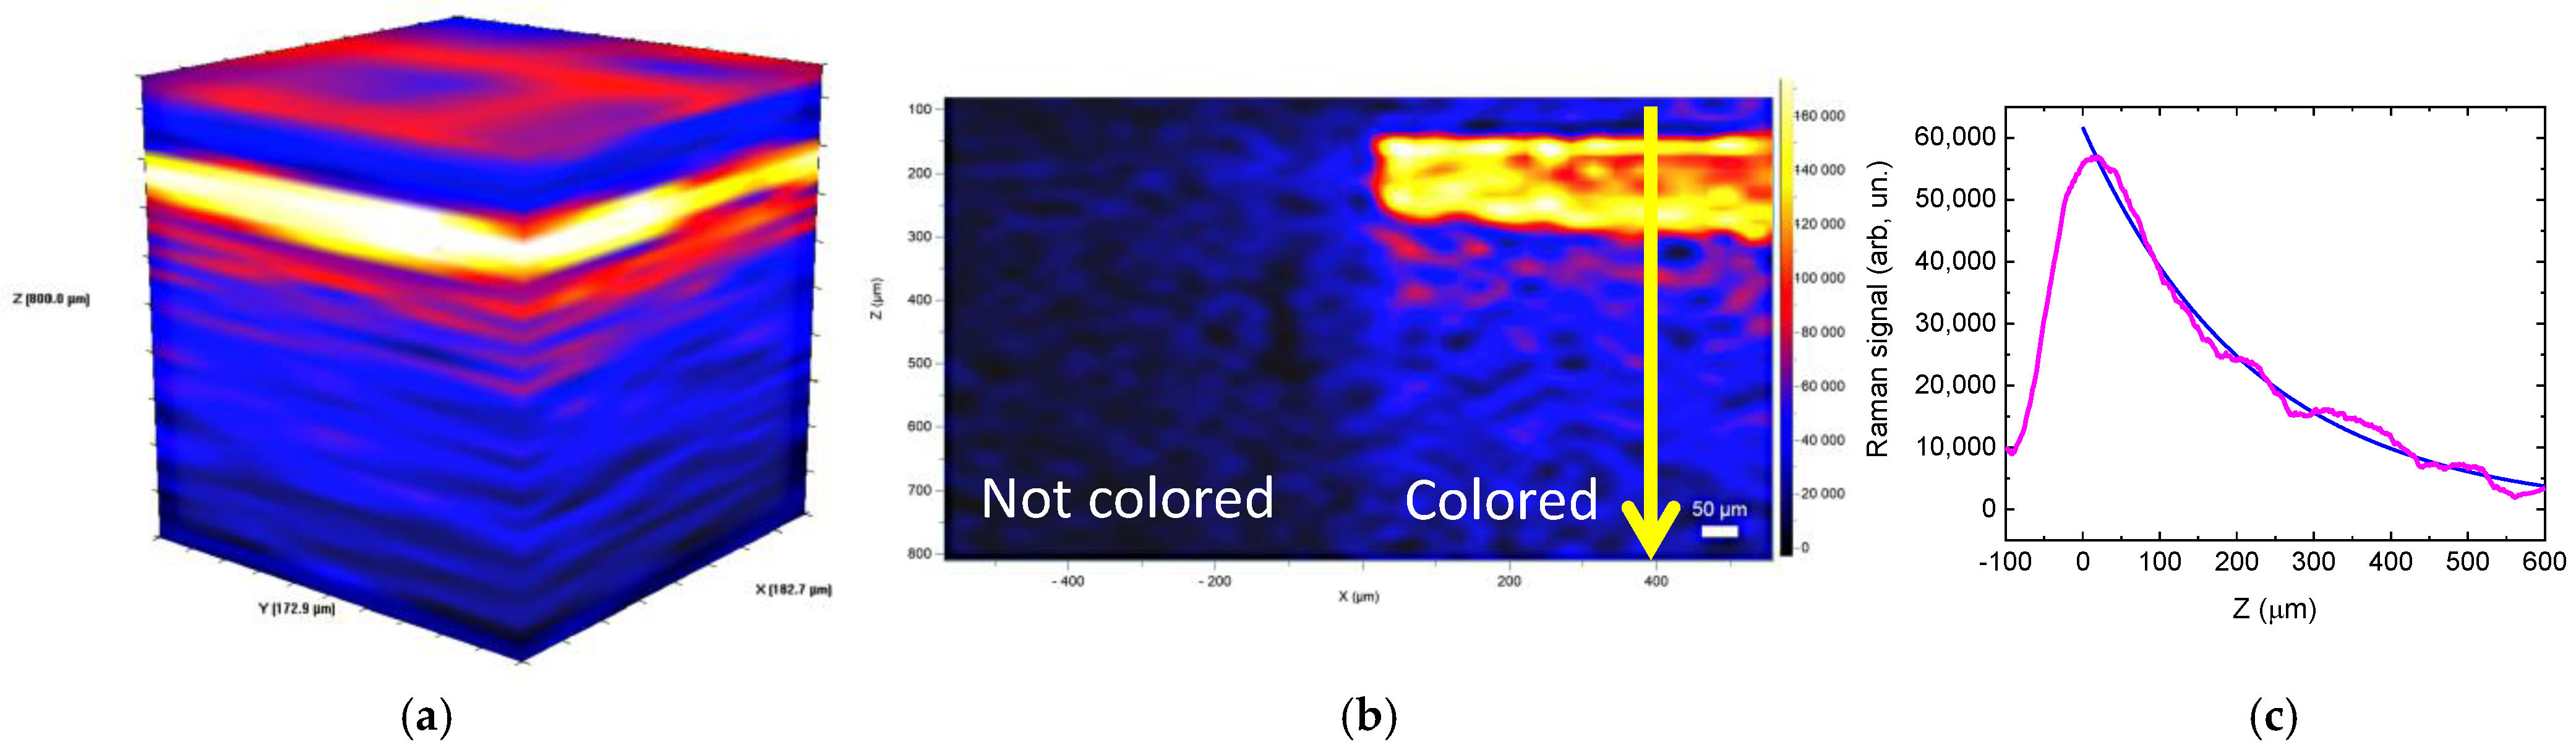
Figure 7a reports the 3D Raman maps (XY = 182 × 172 μm
2, Z = 0–1 mm) of the uniform colored area of the 1000-μm thick LiF crystal (LiFC2) irradiated with 8 keV X-rays and obtained by using the optical sectioning of the confocal Raman spectrometer along the optical Z axis. An XZ slice of the Raman map is reported in
Figure 7b for a region containing irradiated and not irradiated areas. The absence of the Raman signal for the not-colored region is evident. The Raman intensity profile along the Z direction (yellow arrow) for the colored region (magenta curve) is reported in
Figure 7c together with its best fit with a single exponential curve (blue curve). A value of (221 +/− 3) μm corresponding to the 1/e of the maximum, was obtained. This value is close to that obtained with red fluorescence signal in the CLSM systems (see
Figure 5c). Further investigations regarding optical sectioning of the confocal systems applied to X-ray colored LiF crystals are in progress.


 ,
, 


