Article

Exploring the Utility of Diffusing Wave Spectroscopy (DWS) as a Novel Tool for Early Detection of Stability Issues in Cosmetic Emulsions

Department of Chemical Engineering, Manhattan College, New York, NY 10471, USA
*
Author to whom correspondence should be addressed.
Submission received: 21 August 2021 / Revised: 24 October 2021 / Accepted: 25 October 2021 / Published: 28 October 2021
(This article belongs to the Special Issue Feature Papers in Cosmetics in 2021)

Abstract

:
In the current cosmetic and personal care industry, it is of great importance to have a technique that detects instabilities quickly and effectively, as consumers are demanding more innovative and sustainable ingredients. Diffusing wave spectroscopy (DWS) is a potential solution as it is a modern optical technique that can measure the spatial movement of particles or droplets in an emulsion—i.e., the mean square displacement (MSD), as a function of time. In the current investigation, systematic visual and diffusion behavior emulsion stability studies over a 3-h period on jojoba and avocado oil emulsions containing varying equal percentages of cocamidopropyl betaine (CAPB) and sodium lauryl ether sulfate (SLES) were conducted. The turbid emulsions studied had differing stabilities with unknown instability mechanisms to further explore if diffusing wave spectroscopy can offer a fast and early identification of problem cosmetic formulations. It was observed that, for emulsions displaying instability from 4 to 123 h, the greater the change in the MSD values over a 3-h period, the greater the instability of the emulsion. For all systems, the MSD values lowered and shifted to the right from hour 0 to hour 3. We conjecture that the emulsion droplets began to aggregate, potentially growing and giving rise to larger particles. The increasing particle size was the cause for the slowing down of the dynamics and thus diffusion, giving rise to the lowering of the MSD values. Our findings indicate that by testing an emulsion over a 3-h period, it is possible to determine whether it will be a problem formulation using DWS. Studies into this technology should be continued on a wider range of emulsions with known instability mechanisms to further our understanding of using DWS as a vital emulsion instability detector.

1. Introduction

The stability of various cosmetic emulsion types is a critical quality control/performance criteria of skin care and other cosmetic emulsion-based products. It is one of the first conditions that must be evaluated when developing new ingredients (after toxicity and cosmetic elegance) [1]. As a result, a fast and effective stability analysis is becoming increasingly more important as formulators are exploring a vast number of innovative, more sustainable ingredients to meet consumer expectations of having more naturally derived and sustainable cosmetics. This requires exploring novel characterization techniques that would potentially detect instabilities much more rapidly and allow for the fast identification of problem formulations.
Emulsions are metastable dispersions and are composed of two or more immiscible liquid phases. Depending on their composition and type—i.e., oil-in-water (O/W) or water-in-oil (W/O)—emulsions can be manipulated according to their intended application [2]. To create a stable emulsion, emulsifiers such as surfactants, amphiphilic polymers, or small particles are commonly employed; shelf-life may also be increased via modification of emulsion droplet size and poly dispersity [2,3,4,5,6]. Destabilization can occur via several processes such as flocculation, coalescence, creaming or sedimentation, and Ostwald ripening [1,2]. It begins at the microscopic level, depends generally on the composition and microstructure of the emulsions, and can vary from product to product, but visible changes in the final emulsion product may only be realized after long-term storage [2,7,8]. Many factors can lead to instabilities which are often difficult to identify, which is why it is important to have analytical tools that can predict the stability based on a microstructural analysis [1,2].
Typically, emulsion stability is determined by several different tests—such as bulk rheology measurements at varying temperatures, temperature cycling, and particle size tracking using dynamic light scattering (DLS); A list of all the relevant symbols and acronyms used throughout the text are shown in Table S1. DLS measures the emulsion droplet size by illuminating the sample with a laser and analyzing the light that is scattered back out by particles. The scattered light then creates a speckled pattern on the detector which changes over time due to the Brownian motion of the particles, and the stability of a sample is determined by tracking this change in motion [9]. It has been proven to be a powerful tool for the study of dynamic processes in simple and complex fluids, but a significant limitation of DLS is the lack of a general scheme for applying it to systems that exhibit strong multiple scattering [10].
Diffusing wave spectroscopy (DWS) is a modern optical technique that was developed in the 1980s. It was derived from DLS to allow for the measurements of thermally driven dynamics in strongly scattering media [11,12,13,14]. This technique can be employed as an optical rheology tool with numerous applications to study the particle motion, structure, dynamics, and linear viscoelastic properties—and thus the stability—of complex fluids such as colloids, foams, gels, microemulsions, and other systems characterized by strong multiple light scattering [12,13,14]. DWS belongs to the family of spectroscopies in the time domain, and it addresses the slow dynamics by determining the time correlation function of the intensity of coherent light after it has been multiply scattered inside the sample [15]. With this being said, a benefit of this technique is that it allows for the measurement of the dynamics over a large range of time scales (10−7–10 s) and at a much shorter length scale (down to ~1 nm) compared to traditional single light scattering techniques [16,17,18]. DWS can also be used to perform non-invasive microrheology, where the rheological properties are determined on the micron scale without altering the sample [19,20,21].
Diffusing wave spectroscopy is employed only for turbid samples, and for samples of this type, it is necessary to calculate the intensity autocorrelation function, g₁(τ), of the multiple scattered light, which is obtained by correlating the scattering intensity with itself [14]. A major aspect to the theory of DWS is the description of the transport of light within the diffusion approximation, which allows us to acquire explicit expressions for the autocorrelation function for different experimental geometries [10]. This is done by considering the diffuse propagation of the photons along paths of different lengths, s [14]. Each of the path lengths contributes to the function in a specific way and the weight of that contribution is dependent on the path length distribution [14]. For a given cuvette size and transmission geometry, this function has been found to be dependent on the transport mean free path, l*, that characterizes the scattering and diffusive transport of light through the sample, the absorption length, lₐ, and the diffusion coefficient, D, of the Brownian particles [10,14]. The transport mean free path is also dependent on two parameters, the particle size and concentration, and can be evaluated separately by various experimental measurements, or by comparing the optical properties of the sample with another sample whose l* is either known or can be calculated [10,14]. Once this value is determined, DWS can directly measure the diffusion coefficient and absorption length.
To study the bead motion, and thus the stability in a viscous or viscoelastic matrix, the internal dynamics are given by the particle mean square displacement (MSD), <Δr²(τ)> [17]. It represents the spatial movement of particles or droplets as a function of time and is related to the viscoelastic properties of the system [2]. This spatial movement of the particles depends on their size, as well as the interactions with the surrounding medium that may include a polymer network [2,22,23]. Several functions have been developed to fit MSD data from DWS [20,24,25,26]. Niederquell et al. [2] employed a modified version of the original Bellour function (describes the motion of particles in different media with up to three different regimes), to study a series of model emulsions containing xanthan to gain insights into the microstructural changes in emulsions, which are relevant for physical stability. To extract the dynamic properties of the sample using DWS, one first needs to determine the properties above to obtain the MSD values. The MSD of particles in concentrated suspensions is measured at times sufficiently short, and with spatial measurements close to sub-nanometer level, using a broad range of frequencies (0.1 Hz–10 MHz) and lag times to observe the transient nature of hydrodynamic interactions [18,22]. The time evolution of the MSD describes the random Brownian motion of a tracer in a fluid suspension of identical particles and provides a quantitative measure of the particle dynamics in a concentrated suspension, thus capturing the system behavior exhibited [27].
This present research aims to further explore if the sensitive detection of changes in diffusion behavior during emulsion physical instability events can offer a fast and early identification of problem cosmetic formulations. It was of further interest to test range of oil-in-water traditional simple cosmetic emulsions. The different emulsion systems tested using DWS consisted of either jojoba or avocado oil stabilized by a combination of cocamidopropyl betaine (CAPB) and sodium lauryl ether sulfate (SLES). Visual stability tests were employed along with the DWS tests to observe at what time the emulsions fully phase separated. Once the separation period was determined, the emulsions were tested from initial homogenization to 3 h at hour intervals to observe how the dynamics vary to determine if this technique can act as a quick and early detector of instability within emulsions.

2. Materials and Methods

2.1. Materials

Cooking grade avocado oil was obtained from Spectrum Culinary, and jojoba oil was obtained from Evonik Industries (Essen, Germany). The surfactants Chembetaine ACB (CAPB) and Sulfochem es-1 (SLES) were obtained from the Lubrizol Corporation (Bowling Green, OH, USA). The active surfactant concentrations for CAPB and SLES were 35 wt % and 25 wt %, respectively.

2.2. Sample Preparation

All emulsions were formulated and contained in airtight glass polypropylene containers, which were protected from light, and stored at room temperature (25 ± 3 °C). The net weight of each emulsion was 5 g. The turbid emulsions shown in Table 1 and Table 2 consisted of either jojoba or avocado oil, both CAPB and SLES surfactants, and deionized water. The turbid samples were prepared by first pipetting the appropriate oil into the glass vial, and each turbid emulsion contained 15 wt % oil. The two surfactants, CAPB and SLES, were then added to the sample, and for every sample, equal percentages of CAPB and SLES ranging from 2.5–4 wt % were used to create a total emulsifier concentration of 5–8 wt % depending on the emulsion. After both surfactants were added, the samples were stirred using an overhead laboratory stirrer maintained at 750 rpm and 25 °C for 15 min. This was done to homogenize the oil and surfactants before adding water, as this method promotes phase stability in the emulsion. Then the deionized water was added to emulsion, and the sample was stirred for another 15 min at 25 °C. All samples rested for an additional 15 min after the second stirring period prior to all measurements to decrease foaming.

2.3. Diffusing Wave Spectroscopy Testing

Emulsion properties were tested using a Diffusing Wave Spectroscopy (DWS) Rheolab from LS Instruments Inc. (Fribourg, Switzerland). Prior to DWS analysis, the emulsions were equilibrated for 15 min at 25 °C in the measuring chamber as done by Niederquell et al. All transmission measurements were performed in triplicate for every time period at 25 °C for 400 s with 100 s of echo duration. Each emulsion was tested after initial formulating, resting, and equilibration period was competed, which will be referred to as hour 0, to hour 3 for a combined 3-h period of testing. Tests were performed with 5 mm cuvettes from LS Instruments for the turbid emulsions. Once the appropriate amount of sample was pipetted into the cuvette and capped to protect it from contamination, it was kept in the cuvette until the testing period completed. Each cuvette was rinsed with acetone and DI water between testing the different emulsions and handled using gloves to ensure no residue remained.

3. Results

3.1. Visual Stability Tests

The visual stability tests were performed prior to DWS measurements to assess the physical stability for the jojoba and avocado oil emulsions are shown in Figure 1 and Figure 2, respectively, with the total emulsifier concentration increasing from 5.4–8 wt % and 5–8 wt %, respectively, going from left to right. All samples shown were homogenized simultaneously and left undisturbed for the entire period that the images were taken. When looking at the jojoba oil samples in Figure 1, it was observed that after the initial formulation, all samples are relatively stable. After the first hour elapsed, both the 5.4 and 6 wt % surfactant concentration samples became unstable. After 3 h, it was observed that the 6.5 wt % emulsion had begun to cream visually as well. By hour 26, it was observed that the 5.4 and 6 wt % emulsions had become fully unstable, and that the 7 wt % emulsion had started to become unstable. At 123 h, the 7.4 wt % emulsion showed signs of instability, and the 6.5 wt % emulsion had become completely unstable. Within the time range observed, the 8 wt % emulsion had not shown any signs of instability.
For the avocado oil samples shown in Figure 2, again, after the initial formulation at hour 0, no signs of instability were observed for any of the emulsions. After the first hour had elapsed, the 5 wt % emulsion had become completely unstable. By hour 3, both the 5.6 and 6 wt % emulsions had begun to show signs of visual creaming, and by hour 5 it was observed that the 6.5 wt % emulsion began to display slight instability. By hour 29, the 5.6–6.5 wt % emulsions had all become completely unstable. After 47 h, the 7 and 7.4 wt % emulsions had begun to become unstable, with the 7 wt % showing greater instability, indicating its’ separation had begun earlier to the 7.4 wt % sample. After 51 h, it was observed that the 8 wt % avocado oil emulsion, in contrast to the 8 wt % jojoba oil emulsion, became unstable.

3.2. Diffusing Wave Spectroscopy (DWS) Tests

For each transmission measurement test, two parameters were obtained from DWS, the mean square displacement (MSD) values versus the lag time (s), and the ratio between the path length or size of the cuvette (L) and the transport mean free path (l*), (L/l*). The MSD values represent the Brownian motion or the spatial movement of particles or droplets as a function of time and can help show change in the system dynamics, and the L/l* values give insight on the distance in which the particles were able to move without being interupted. In this study, these values were obtained using the patented Echo DWS technology from LS Instruments [28].

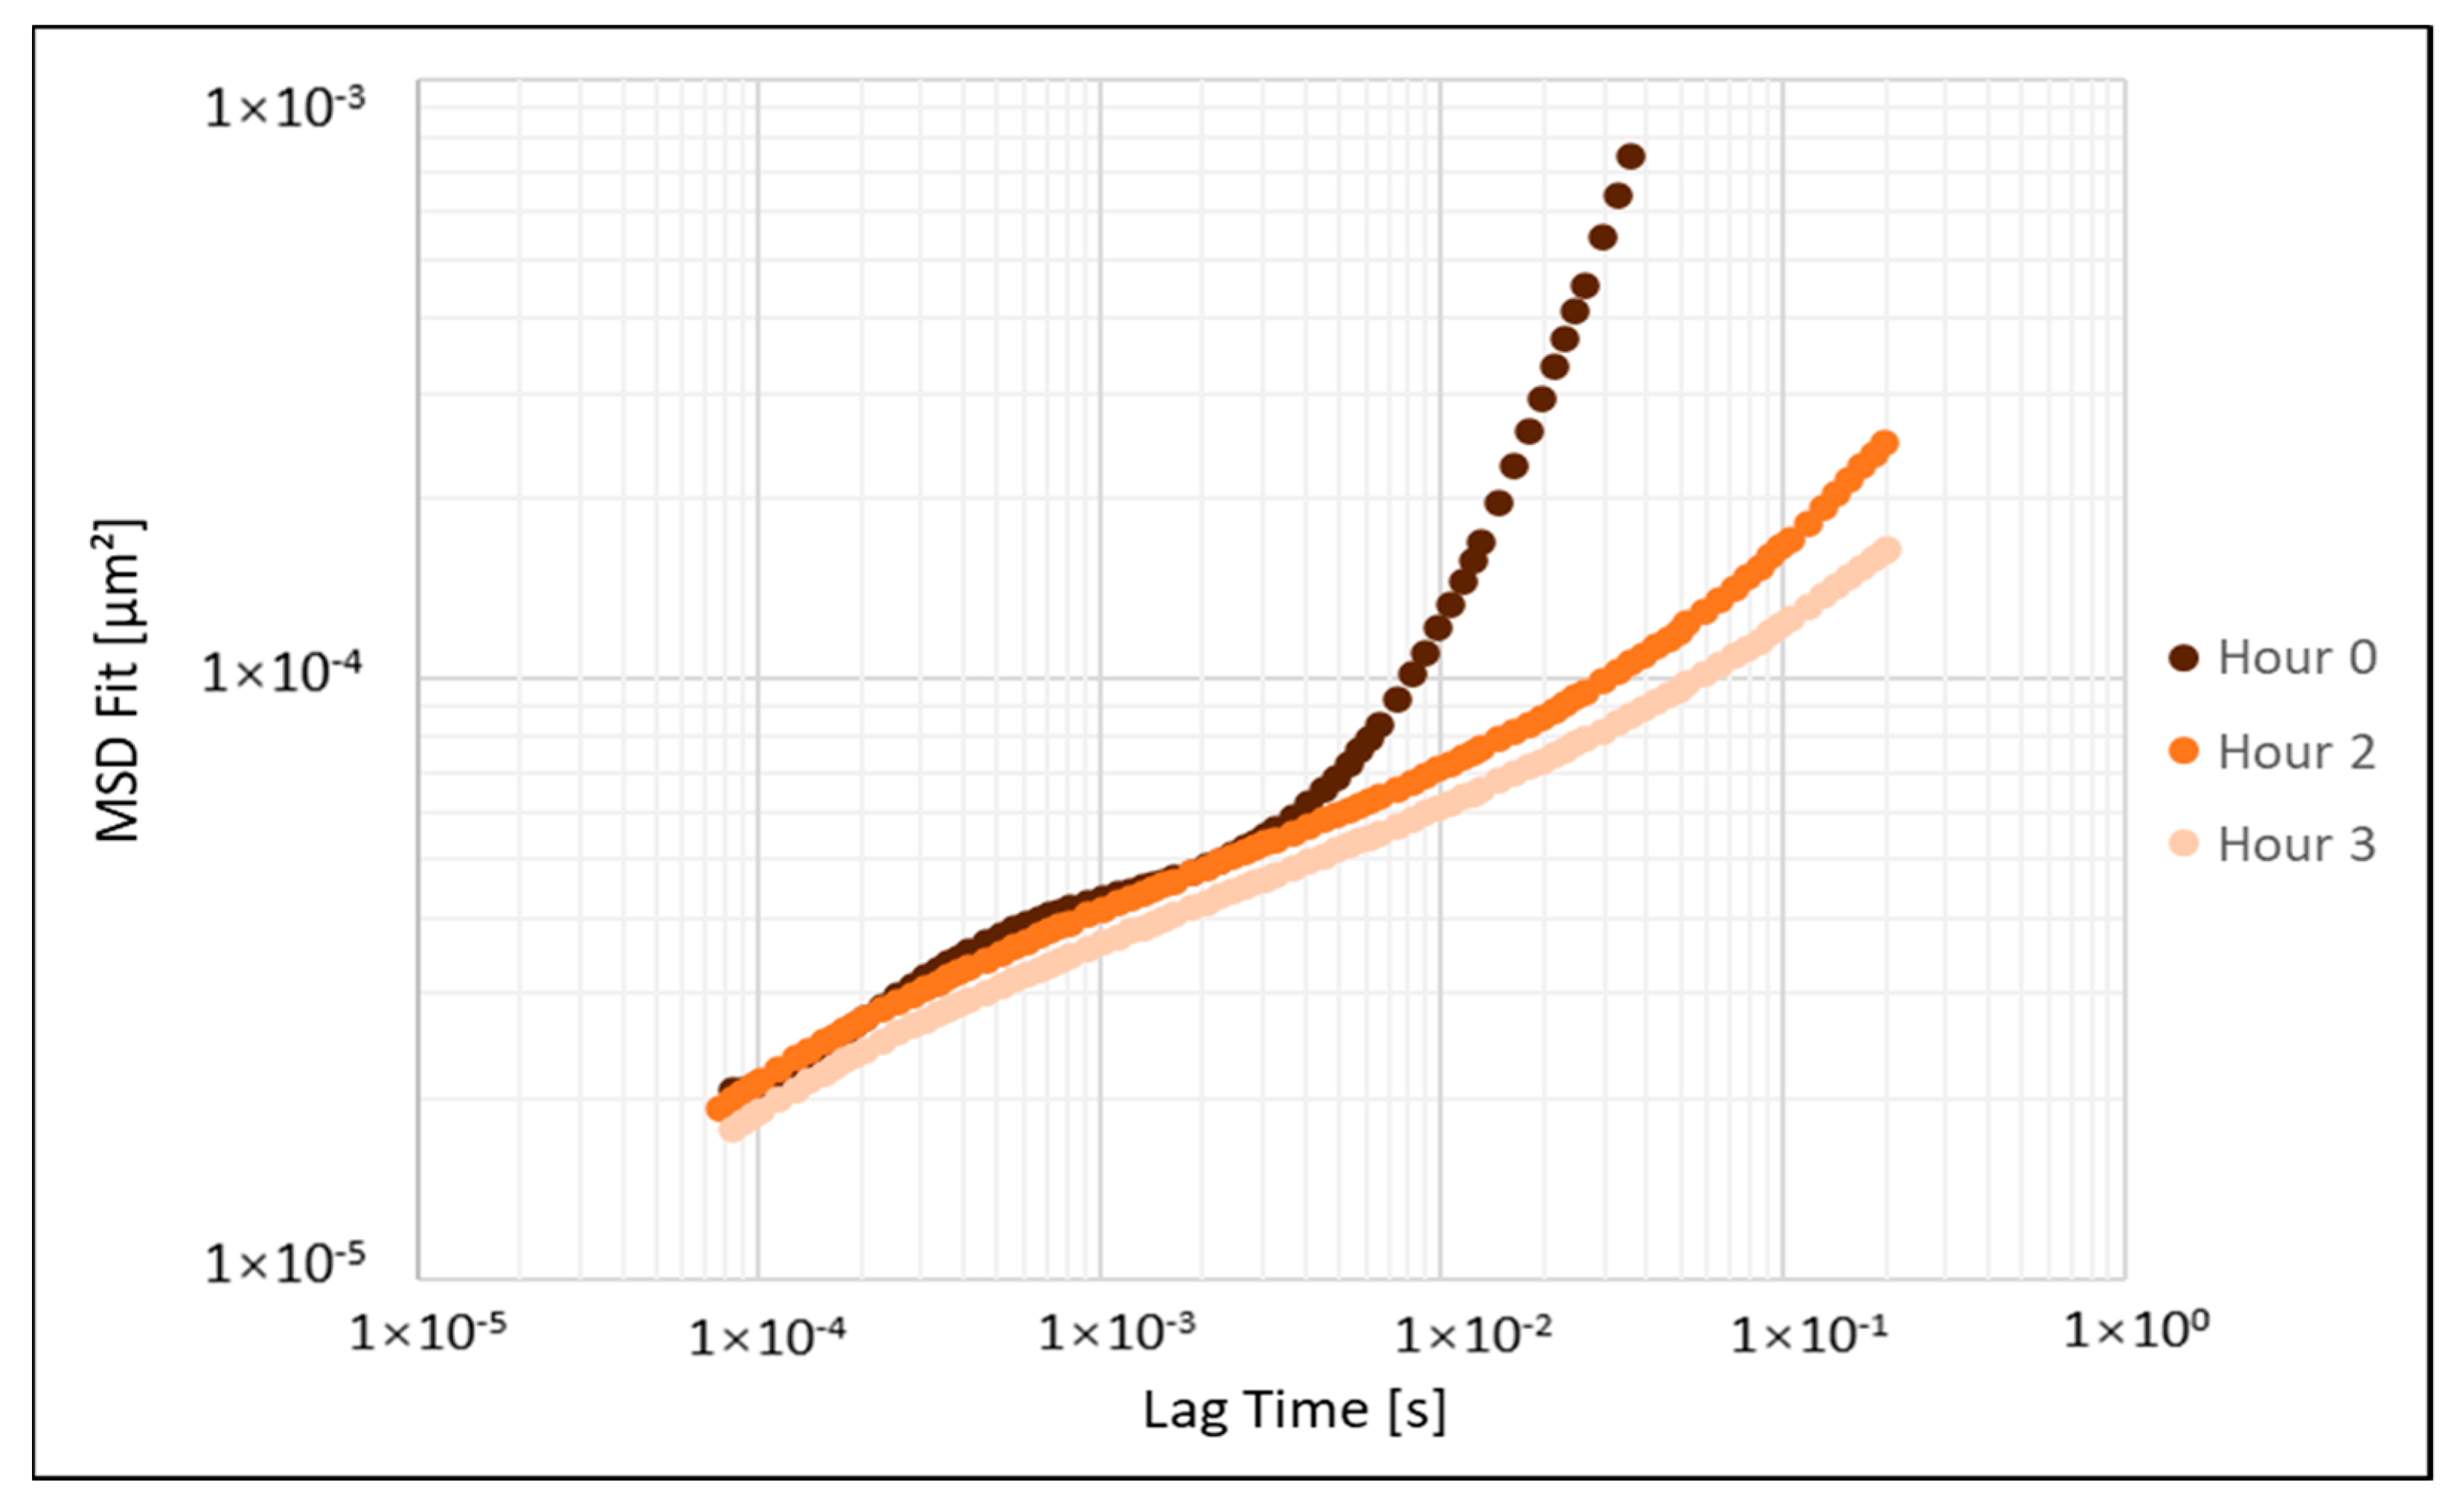
3.2.1. Jojoba Oil Emulsions MSD Values

The mean square displacement (MSD) results for the 6.5, 7.4, and 8 wt % CAPB and SLES jojoba oil emulsions are shown in Figure 3, Figure 4 and Figure 5, respectively. These three samples were chosen out of the six jojoba oil emulsions tested during the visual stability experiments to observe three ends of the stability extremes. One was chosen that separated relatively quickly, one in the middle, and another that was observed to be the most stable. For the samples that were known to phase separated over a period, the general trend observed in the MSD in Figure 3 and Figure 4 was that the MSD values dropped in value and shifted slightly to the right. Out of the three samples, the 6.5 wt % emulsion was found to be the least stable from the visual stability tests, becoming completely unstable after 3 h. As seen in Figure 3, it displayed the largest drop in the MSD values over the period. For the 7.4 wt % emulsion shown in Figure 4, it can be observed how the stability of the 7.4 wt % emulsion has increased compared to the 6.5 wt % emulsion by looking at the change in the trend of the MSD values from hour 0 to 3. There was a dramatic drop for the 6.5 wt % emulsion, whereas for the 7.4 wt % emulsion, the values are similar up until 1.0 × 10⁻² (s), when the MSD values spike for the emulsion at hour 0, showing how the change occurs and differs for the intermediate stability emulsion. For the 8 wt % emulsion shown in Figure 5, over the time period the visual stability tests were conducted, no visual instability was observed, but as seen in the MSD values from 0 to 3 h, a similar trend was seen. It was observed that the MSD values also shifted to the right over this period, but at the initial lag times, the MSD values were higher at 3 h compared to 0 h, but as the lag time increased, the MSD values began to drop below those at hour 0. This resulted in an overall drop in the MSD values from hour 0 to hour 3 for the 8 wt % jojoba oil emulsion. Although this was the smallest drop observed and no visual instability was seen in 123 h, this indicated that this emulsion may potentially become unstable over much longer times.

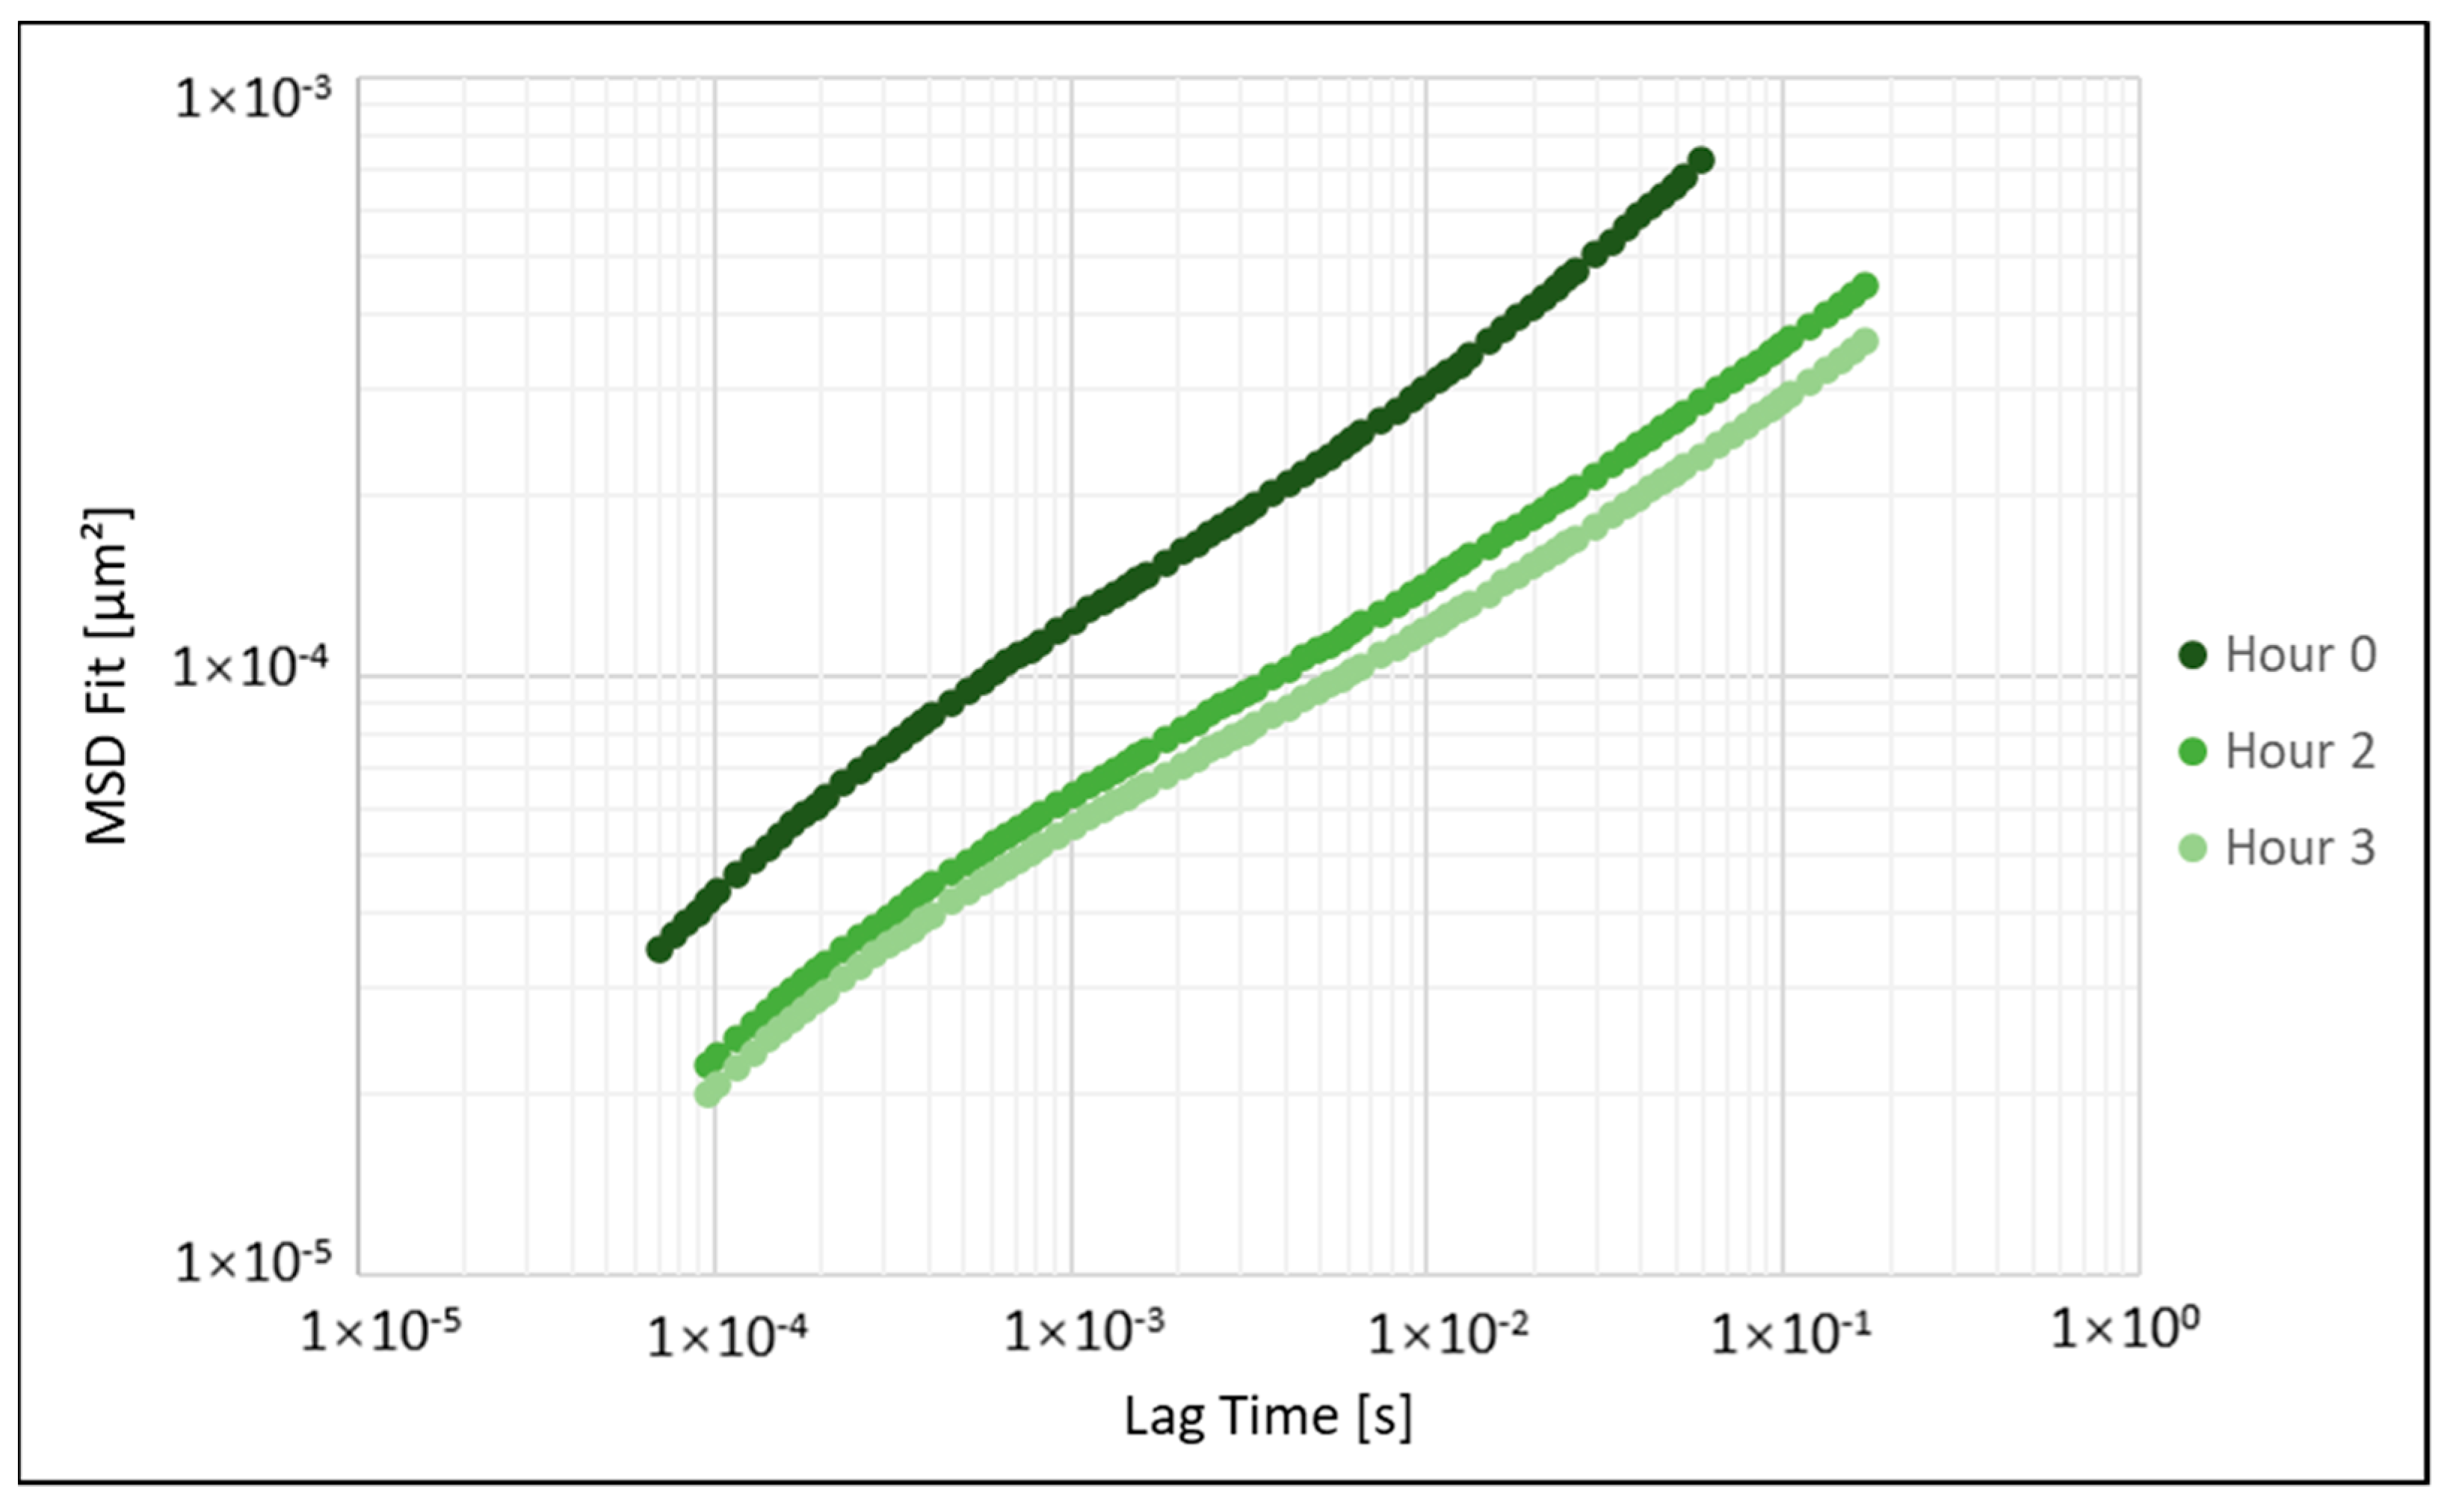
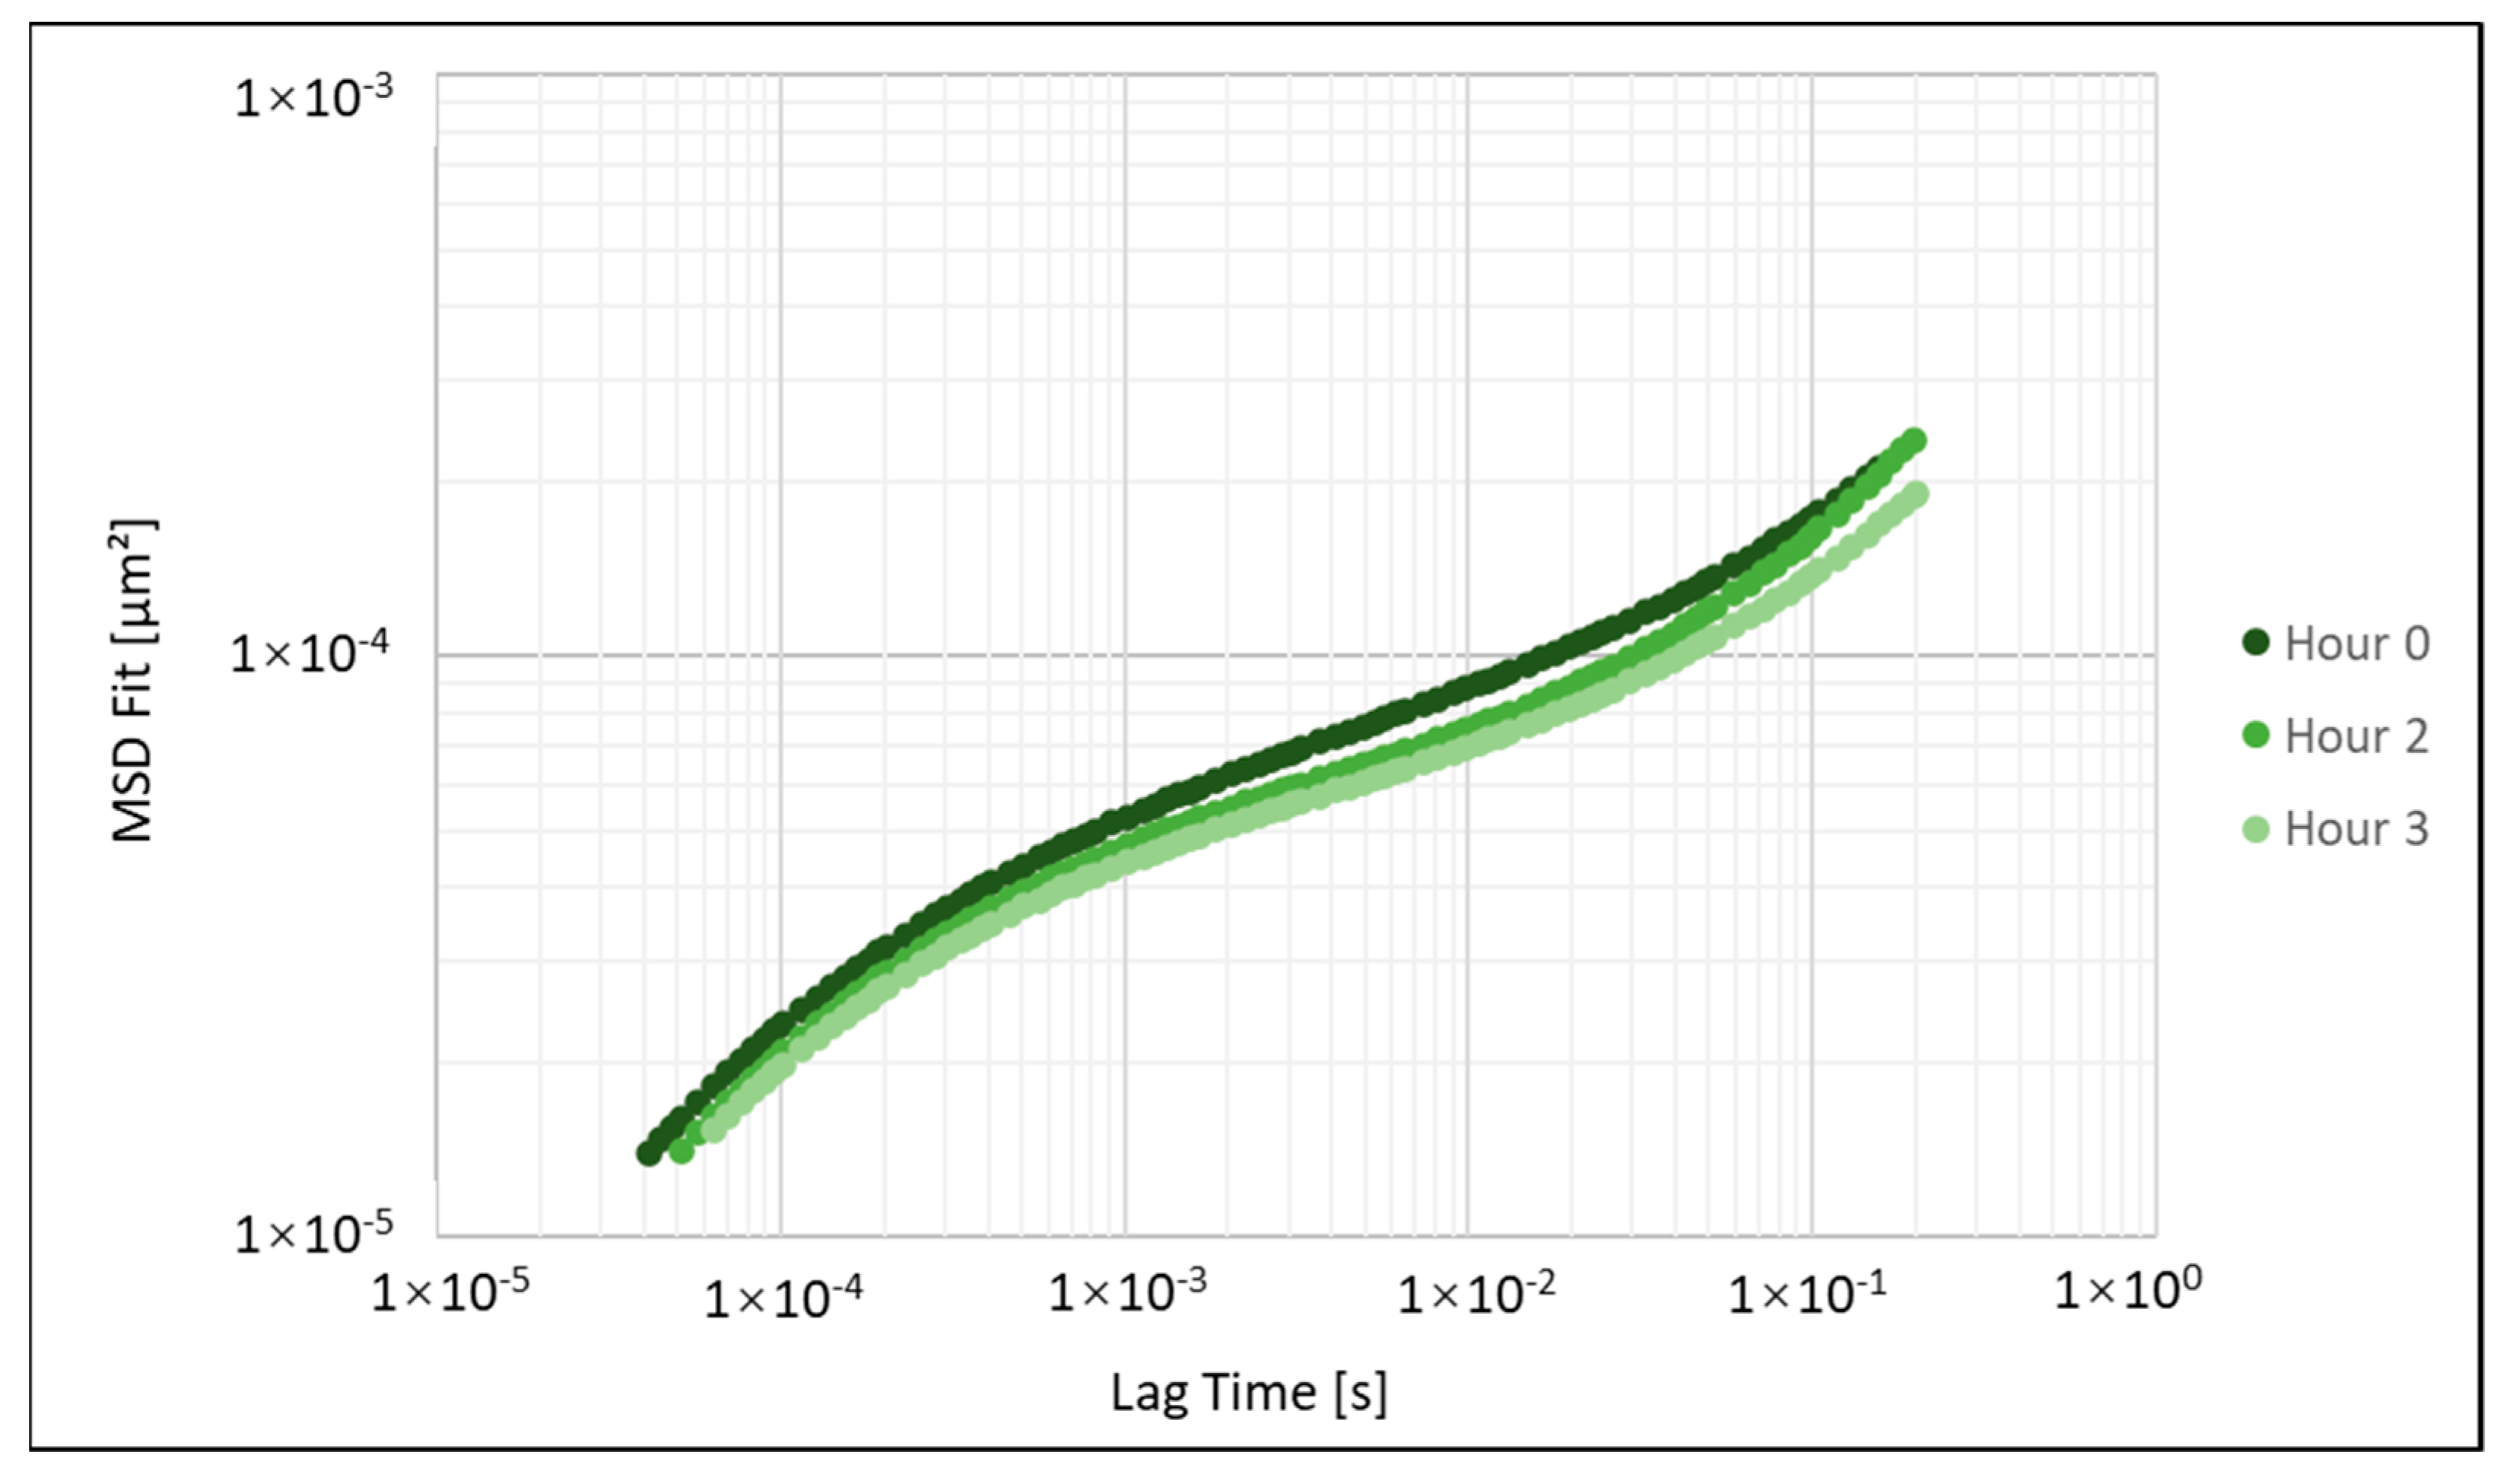
3.2.2. Avocado Oil Emulsion MSD Values
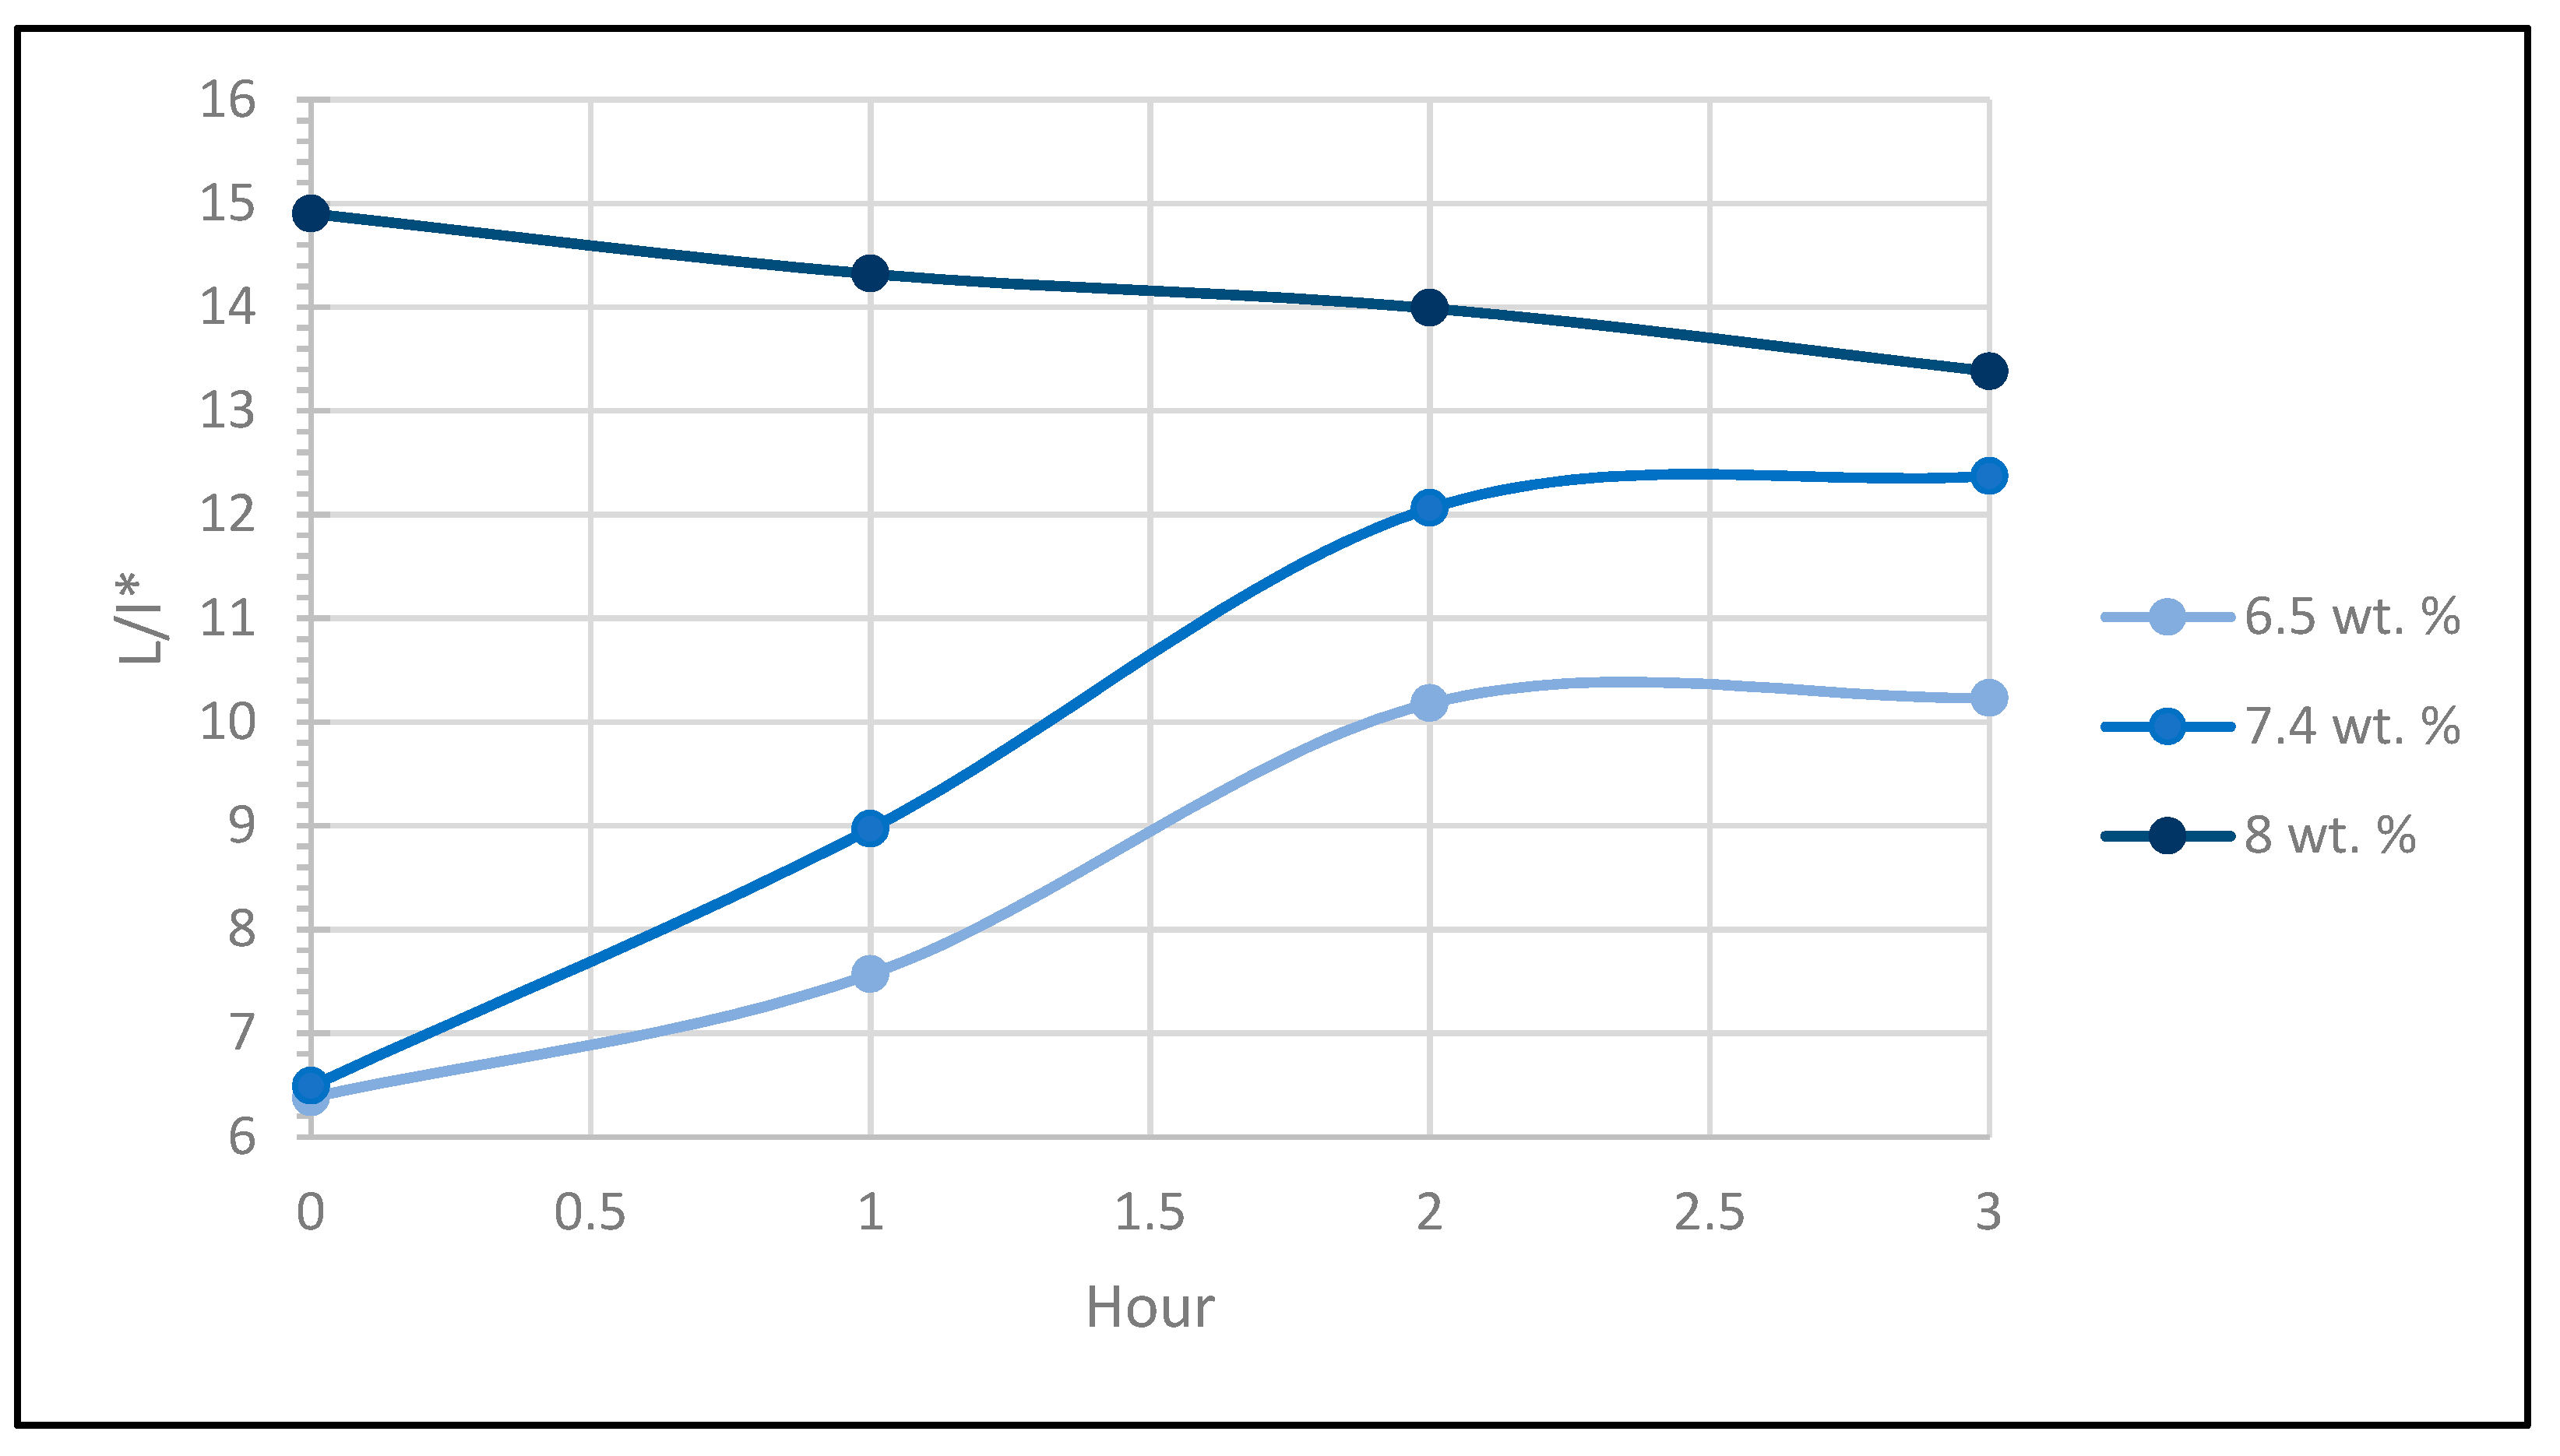
The MSD results for the 6.5, 7, and 7.4 wt % CAPB and SLES avocado oil emulsions are shown in Figure 6, Figure 7 and Figure 8, respectively. Again, these three samples were chosen out of the avocado oil emulsions tested during the visual stability experiments to observe three ends of the stability extremes. For every avocado oil emulsion tested, it was observed that, similarly to the jojoba oil emulsions, from hour 0 to hour 3, the MSD values decreased and shifted to the right. Out of the three samples, again, the 6.5 wt % emulsion was found to be the least stable from the visual stability tests, showing instability after 5 h. As seen in Figure 6, it displayed the largest drop in the MSD values from hour 0 to hour 3. For the 7 wt % emulsion shown in Figure 7, it was observed that at hour 3, the MSD values were initially greater compared to hour 0, but after a lag time of 6.66 × 10⁻⁴ s, the MSD values of hour 3 drop below those of hour 0, resulting in a comparatively smaller average percentage drop from hour 0 to 3. The 7.4 wt % avocado oil emulsion shown in Figure 8 differed from the 7 wt % emulsion, in that the MSD values at hour 3 were lower than hour 0 for all lag times. For this sample, it was observed that the MSD values had a larger average drop in value, which was interesting considering this emulsion was observed to be the most stable out of all the avocado oil emulsions, showing signs of instability after 47 h, whereas the 7 wt % emulsion showed signs of instability prior to hour 47.

3.2.3. L/l* Values

For all tests a glass cuvette with a 5 mm path length (L) was used, and from the transmission measurements the transport mean free path (l*) was determined. The L/l* values obtained for the jojoba and avocado oil emulsions are shown in Figure 9 and Figure 10, respectively. For the jojoba oil emulsions, it was observed that out of the three samples, the 8 wt % L/l* values were the highest and varied the least. This correlated with the MSD findings that also showed the least variation. The photon transport path can be related to average droplet size and the relatively constant l* shows no major structural changes, but it can be seen that, for the 8 wt %, that the L/l* value continues to drop slightly as time goes on. The 6.5 and 7.3 wt % emulsions followed a similar trend, with the 7.4 wt % having higher L/l* values for the entire period. For these samples, upon initial formulation, both have very similar L/l* values. As time goes on, the gap between the two widens as their L/l* values continually increase until hour 2. By hour 3, both samples appear to plateau in their L/l* values.
For the avocado oil emulsions shown in Figure 10, similar trends were observed. The 7.4 wt % emulsion was the most stable out of the three avocado oil emulsions tested, and although the L/l* values fluctuated over the period, they remained relatively constant, with a slight decrease, further showing that this was the most stable sample of the three. The 7 wt % emulsion displayed a different trend compared to the other two. For this emulsion, the L/l* values consistently dropped over the entire period. The 6.5 wt % emulsions L/l* value increased until hour 2, then plateaued, with an overall increase from hour 0 to 3, and had significantly lower L/l* values during hours 0–2 compared to the other two avocado oil emulsions.

4. Discussion

The current investigation is an initial study aimed to further explore if the sensitive detection of changes in diffusion behavior during emulsion instability events can offer a fast and early identification of problem cosmetic formulations. It is of crucial interest to develop and explore novel characterization techniques that would detect instabilities much more rapidly and identify problem formulations because of the increased demand for more innovative naturally derived ingredients that have less impact on the environment from consumers. Specifically, these ingredients include tea extracts, hemp, or avocado oil, in which extensive studies have been done to determine their stability and growing popularity [29,30,31]. The stability of cosmetic emulsions is one of the first conditions to be evaluated, which is why a rapid and effective technique is needed to keep up with trends within the cosmetic industry.
The two oil-in-water emulsion types studied were comprised of 15 wt % jojoba or avocado oil, with equal weight percentages of CAPB and SLES surfactants ranging in a combined total of 6.5 wt % to 8 wt %. These surfactants were chosen as they are two commonly used surfactants in cosmetics emulsions today [32]. Visual stability tests were performed prior to all DWS measurements to determine at what time each emulsion began to show signs of instability. The changes in the diffusion behavior were investigated by performing transmission measurements in triplicates and observing the changes in the emulsions mean square displacement (MSD) values over a 3-h period. The MSD values represent the spatial movement of particles or droplets as a function of time and can be related to the viscoelastic properties of the system. The movement of the droplets depends on their size and interactions with the surrounding medium and based on our results, this property can help quickly deduct whether an emulsion will become unstable.
Visual stability tests showed that for every emulsion, as the emulsifier concentrations were increased, the overall stability of the emulsions increased as expected. The trend observed from the diffusion behavior tests for the jojoba oil emulsions was that the MSD values lowered and shifted to the right for each emulsion, or the dynamics slowed down over the period. This meant that the diffusion within the emulsion slowed from the initial formulation at hour 0 to hour 3. Overall, for the jojoba oil emulsions it was observed that the change in the MSD values over a 3-h period, corresponded to the visual stability of the emulsion. That being, the less stable the emulsion was, the greater the change in the MSD values observed.
For the avocado oil emulsions, a similar trend was observed with the exception of the 7 wt % emulsion, in that it had the smallest change in the MSD values from hour 0 to hour 3 but was observed to be the second most stable avocado oil emulsion tested. This was due to the major difference compared to other two emulsions where the MSD values at hour 3 of the emulsion were slightly higher than the values at hour 0 for a portion of the lag time period. Again, the overall trend observed was the lowering of the MSD values or the slowing down of the dynamics within the emulsions from the initial formulation at hour 0 to hour 3. The more unstable the avocado oil emulsion system was, the larger the drop was in the MSD values over the time period, with the exception of the 7 wt % sample that had the lowest change out of the three. It is worth mentioning again that all measurements at each hour were performed in triplicate, and for both emulsion systems, the overall stability corresponded to the reproducibility of the triplicate set. The more stable emulsions had a smaller variation between the three MSD data sets obtained at each hour, further showing how sensitive this detection is and how one can see with just one run changes within an emulsion can be observed.
From the MSD trend seen for both emulsion types, we infer that it indicates that the emulsion droplets potentially began to aggregate by flocculation or increase in size by coalescence due to the fusion of smaller droplets into larger ones, but the true instability mechanism is not known at this time. The increasing particle size was the cause for the slowing down of the dynamics and diffusion, giving rise to the lowering of the MSD values. This hypothesis is furthered when observing the change in the transport mean free path for the 6.5 and 7.4 wt % jojoba oil emulsions, and the 6.5 wt % avocado oil emulsion. These three emulsions displayed a similar trend in the L/l* data as well as in their MSD values. It was observed that the transport mean free path, l*, decreased from hour 0 to hour 3. This indicates that molecules became closer, meaning molecule radii increased, causing the space between the emulsion molecules to decrease, causing them to run into one another more often, thus decreasing the l* values. For the other samples tested, the l* values were observed to increase, indicating that a different instability mechanism could potentially be occurring within the systems. It is also worth noting that the potential instability of the 8 wt % jojoba oil emulsion was further confirmed when observing the change in the transport free mean path, where it did not remain constant throughout the period. This change helps further push the hypothesis made by looking at the MSD values for this sample, that although no visual instability was observed over the time range tested, this sample will most likely become unstable over time. The transmission measurements from this technology can help show that, by observing the changes within the mean square displacement (MSD) values over just a short period, one can predict whether an emulsion will become unstable. The transmission mean free path, l*, can be used in combination with the MSD measurements to further conclude stability hypotheses and to gain further insights on the potential instability mechanism and dynamics within the emulsion. This initial work will be furthered in the next phases of the investigation in which DWS will be used in combination with other more commonly used stability techniques to build upon our understanding of the technique, as well as to confirm our findings in this initial study.

5. Conclusions

At this time, it cannot be said exactly what type of instability mechanisms were occurring within these systems, but it can be seen that the mean square displacement and transmission mean free path results lead us to conclude that, for different emulsion formulations with varying or different instability mechanisms, DWS can serve as a fast and suitable mechanism to predict and show whether an emulsion has the potential to become unstable over a 3-h period. As this is the first phase of this investigation, further studies should be carried out over longer time periods using different emulsion types as well as emulsions with known instability mechanisms to determine and confirm the trends observed and to observe whether specific instability mechanisms demonstrate unique MSD trends. In the next phase of this investigation, DWS should be used in combination with rheology and particle sizing techniques, such as a rheometer and microscopy since a downside of this mechanism is that it cannot easily provide information on size distribution or polydispersity [33]. Using these techniques in the next phases of the investigation can help further corroborate our findings and build upon our understanding of this technique’s ability to predict stability.
Although size distribution and rheology parameters were not investigated throughout the period, from the results shown it can be observed that this technology may be the solution to the need for a fast instability detector to meet the increasing demands for newer, more eco-friendly, or biodegradable ingredients and products from the consumers. Cosmetic formulators have to evaluate whether natural or plant-derived ingredients can replace current synthetic ones that may negatively affect the environment quickly and effectively as the market demands a quick turnaround on producing new products. This methodology will allow them to quickly tests these ingredients in new formulations within a day to determine their stability.

Supplementary Materials

The following are available online at https://0-www-mdpi-com.brum.beds.ac.uk/article/10.3390/cosmetics8040099/s1, Table S1: List of symbols and acronyms throughout the text in order of appearance.

Author Contributions

Conceptualization, S.A. and M.K.; Methodology, S.A. and M.K.; Formal analysis, S.A. and M.K.; Investigation, M.K. and G.B.; Data curation, M.K. and G.B.; Writing—original draft preparation, S.A., G.B. and M.K.; Writing—review and editing, S.A., G.B. and M.K.; Supervision, S.A. All authors have read and agreed to the published version of the manuscript.

Funding

This research received no external funding.

Institutional Review Board Statement

Not applicable.

Informed Consent Statement

Not applicable.

Data Availability Statement

The data presented in this study are available on request from the corresponding author.

Acknowledgments

Manhattan College acknowledges the contribution of LS Instruments Inc. (Fribourg, Switzerland) for providing the necessary equipment, and the Lubrizol Corporation (Bowling Green, OH, USA) for providing the surfactants Chembetaine ACB (CAPB) and Sulfochem es-1 (SLES).

Conflicts of Interest

The authors declare no conflict of interest. The funders had no role in the design of the study; in the collection, analyses, or interpretation of data; in the writing of the manuscript, or in the decision to publish the results.

References

  1. André, V.; Willenbacher, N.; Debus, H.; Börger, L.; Fernandez, P.; Frechen, T.; Rieger, J. Prediction of emulsion stability: Facts and myth. Cosmet. Toilet. Manuf. Worldw. 2003, 102, 220–231. [Google Scholar]
  2. Niederquell, A.; Machado, A.H.E.; Kuentz, M. A Diffusing Wave Spectroscopy Study of Pharmaceutical Emulsions for Physical Stability Assessment. Int. J. Pharm. 2017, 530, 213–223. [Google Scholar] [CrossRef]
  3. Dickinson, E. Hydrocolloids at interfaces and the influence on the properties of dispersed systems. Food Hydrocoll. 2003, 17, 25–39. [Google Scholar] [CrossRef]
  4. McClements, D.J. Food Emulsions: Principles, Practice, and Techniques, 3rd ed.; CRC Press: Boca Raton, FL, USA, 1999; pp. 11–26. [Google Scholar]
  5. Robins, M.M.; Hibberd, D.J. Emulsion flocculation and creaming. In Modern Aspects of Emulsion Science; Binks, B.P., Ed.; The Royal Society of Chemistry: Cambridge, UK, 1998; pp. 115–144. [Google Scholar]
  6. Tadros, T.F. Emulsion formation, stability, and rheology. In Emulsion Formation and Stability, Topics in Colloid and Interface Science (VCH); Tadros, T.F., Ed.; Wiley-VCH-Verlag GmbH & Co. KGaA: Weinheim, Germany, 2013; pp. 1–75. [Google Scholar]
  7. Herrera, M. Analytical Techniques for Studying the Physical Properties of Lipid Emulsions, Springer Briefs in Food, Health, and Nutrition, 1st ed.; Springer: New York, NY, USA, 2012. [Google Scholar]
  8. McClements, D.J. Critical review of techniques and methodologies for characterization of emulsion stability. Crit. Rev. Food Sci. Nutr. 2007, 47, 611–649. [Google Scholar] [CrossRef] [PubMed]
  9. Emulsions: Applications and Analysis. Anton Paar Wiki. Available online: https://wiki.anton-paar.com/en/emulsions-applications-and-analysis/ (accessed on 6 May 2021).
  10. Pine, D.J.; Weitz, D.A.; Zhu, J.X.; Herbolzheimer, E. Diffusing-Wave Spectroscopy: Dynamic Light Scattering in the Multiple Scattering Limit. J. Phys. 1990, 51, 2101–2127. [Google Scholar] [CrossRef] [Green Version]
  11. Maret, G.; Wolf, P.E. Multiple light scattering from disordered media. The effect of brownian motion of scatterers. Eur. Phys. J. B 1987, 65, 409–413. [Google Scholar]
  12. Pine, D.J.; Weitz, D.A.; Chaikin, P.M.; Herbolzheimer, E. Diffusing Wave Spectroscopy. Phys. Rev. Lett. 1988, 60, 1134–1137. [Google Scholar] [CrossRef] [Green Version]
  13. Wu, X.-L.; Pine, D.J.; Chaikin, P.M.; Huang, J.S.; Weitz, D.A. Diffusing-wave spectroscopy in a shear flow. J. Opt. Soc. Am. B 1990, 7, 15–20. [Google Scholar] [CrossRef]
  14. Zhang, C.; Reufer, M.; Gaudino, D.; Scheffold, F. Improved Diffusing Wave Spectroscopy Based on the Automatized Determination of the Optical Transport and Absorption Mean Free Path. Korea-Aust. Rheol. J. 2017, 29, 241–247. [Google Scholar] [CrossRef] [Green Version]
  15. Salerni, F.; Orsi, D.; Santini, E.; Liggieri, L.; Ravera, F.; Cristofolini, L. Diffusing Wave Spectroscopy for Investigating Emulsions: II. Characterization of a Paradigmatic Oil-in-Water Emulsion. Colloids Surf. A Physicochem. Eng. Asp. 2019, 580, 123724. [Google Scholar] [CrossRef]
  16. Scheffold, F.; Schurtenberger, P. Light Scattering Probes of Viscoelastic Fluids and Solids. Soft Mater. 2003, 1, 139–165. [Google Scholar] [CrossRef]
  17. Weitz, D.A.; Pine, D.J. Diffusing-wave spectroscopy. In Dynamic Light Scattering: The Method and Some Applications; Brown, W., Ed.; Oxford University Press: New York, NY, USA, 1993; pp. 652–720. [Google Scholar]
  18. Zhu, J.X.; Durian, D.J.; Müller, J.; Weitz, D.A.; Pine, D.J. Scaling of Transient Hydrodynamic Interactions in Concentrated Suspensions. Phys. Rev. Lett. 1992, 68, 2559–2562. [Google Scholar] [CrossRef] [PubMed] [Green Version]
  19. Squires, T.M.; Furst, E.M. Microrheology, 1st ed.; Oxford University Press: New York, NY, USA, 2017. [Google Scholar]
  20. Mason, T.G.; Weitz, D.A. Optical Measurements of Frequency-Dependent Linear Viscoelastic Moduli of Complex Fluids. Phys. Rev. Lett. 1995, 74, 1250–1253. [Google Scholar] [CrossRef]
  21. Waigh, T.A. Advances in the microrheology of complex fluids. Rep. Prog. Phys. 2016, 79, 074601. [Google Scholar] [CrossRef] [PubMed]
  22. Moschakis, T. Microrheology and particle tracking in food gels and emulsions. Curr. Opin. Colloid Interface Sci. 2013, 18, 311–323. [Google Scholar] [CrossRef]
  23. ten Grotenhuis, E.; Paques, M.; van Aken, G.A. The Application of Diffusing-Wave Spectroscopy to Monitor the Phase Behavior of Emulsion–Polysaccharide Systems. J. Colloid Interface Sci. 2000, 227, 495–504. [Google Scholar] [CrossRef]
  24. Bellour, M.; Skouri, M.; Munch, J.-P.; Hébraud, P. Brownian motion of particles embedded in a solution of giant micelles. Eur. Phys. J. E 2002, 8, 431–436. [Google Scholar] [CrossRef] [PubMed]
  25. Dasgupta, B.R.; Tee, S.-Y.; Crocker, J.C.; Frisken, B.J.; Weitz, D.A. Microrheology of polyethylene oxide using diffusing wave spectroscopy and single scattering. Phys. Rev. E 2002, 65, 051505. [Google Scholar] [CrossRef] [PubMed] [Green Version]
  26. van Zanten, J.H.; Rufener, K.P. Brownian Motion in a Single Relaxation Time Maxwell Fluid. Phys. Rev. E 2000, 62, 5389–5396. [Google Scholar] [CrossRef]
  27. Pusey, P.N.; Tough, R.J. Particle Interactions. In Dynamic Light Scattering: Applications of Photon-Correlation Spectroscopy; Pecora, R., Ed.; Plenum Press: Plenum, NY, USA, 1981; pp. 85–180. [Google Scholar]
  28. LS Instruments: Echo DWS. Available online: https://lsinstruments.ch/en/theory/diffusing-wave-spectroscopy-dws/echo-dws (accessed on 17 September 2021).
  29. Kowalska, M.; Ziomek, M.; Żbikowska, A. Stability of cosmetic emulsion containing different amount of hemp oil. Int. J. Cosmet. Sci. 2015, 37, 408–416. [Google Scholar] [CrossRef]
  30. Garbossa, W.A.C.; Campos, P.M.B.G.M. Euterpe oleracea, Matricaria chamomilla, and Camellia sinensis as promising ingredients for development of skin care formulations. Ind. Crop. Prod. 2016, 83, 1–10. [Google Scholar] [CrossRef]
  31. Koch, W.; Zagórska, J.; Marzec, Z.; Kukula-Koch, W. Applications of Tea (Camellia Sinensis) and Its Active Constituents in Cosmetics. Molecules 2019, 24, 4277. [Google Scholar] [CrossRef] [Green Version]
  32. Naves, L.; Dhand, C.; Almeida, L.; Lakshminarayanan, R.; Ramakrishna, S.; Soares, G. Poly(lactic-co-glycolic) acid drug delivery systems through transdermal pathway: An overview. Prog Biomater 2017, 6, 1–11. [Google Scholar] [CrossRef] [PubMed] [Green Version]
  33. Badruddoza, A.Z.M.; MacWilliams, S.V.; Sebben, D.; Krasowska, M.; Beattie, D.; Durian, D.J.; Ferri, J.K. Diffusing wave spectroscopy (DWS) methods applied to double emulsions. Curr. Opin. Colloid Interface Sci. 2018, 37, 74–87. [Google Scholar] [CrossRef]
Figure 1. 15 wt % jojoba oil emulsions’ visual stability. From left to right samples are 5.4 wt %, 6 wt %, 6.5 wt %, 7 wt %, 7.4 wt %, and 8 wt % total CAPB and SLES emulsifier concentrations.
Cosmetics 08 00099 g001
Figure 2. 15 wt % avocado oil emulsions’ visual stability. From left to right samples are 5 wt %, 5.6 wt %, 6 wt %, 6.5 wt %, 7 wt %, 7.4 wt %, and 8 wt % total CAPB and SLES emulsifier concentrations.
Cosmetics 08 00099 g002
Figure 3. 3.25 wt % CAPB, 3.25 wt % SLES, 15 wt % jojoba oil emulsion variation in MSD values over a 3-h period.
Cosmetics 08 00099 g003
Figure 4. 3.7 wt % CAPB, 3.7 wt % SLES, 15 wt % jojoba oil emulsion variation in MSD values over a 3-h period.
Cosmetics 08 00099 g004
Figure 5. 4 wt % CAPB, 4 wt % SLES, 15 wt % jojoba oil emulsion variation in MSD values over a 3-h period.
Cosmetics 08 00099 g005
Figure 6. 3.25 wt % CAPB, 3.25 wt % SLES, 15 wt % avocado oil emulsion variation in MSD values over a 3-h period.
Cosmetics 08 00099 g006
Figure 7. 3.5 wt % CAPB, 3.5 wt % SLES, 15 wt % avocado oil emulsion variation in MSD values over a 3-h period.
Cosmetics 08 00099 g007
Figure 8. 3.7 wt % CAPB, 3.7 wt % SLES, 15 wt % avocado oil emulsion variation in MSD values over a 3-h period.
Cosmetics 08 00099 g008
Figure 9. L/l* values for 6.5 wt %, 7.4 wt %, and 8 wt % CAPB and SLES, 15 wt % jojoba oil emulsions over 3-h period.
Cosmetics 08 00099 g009
Figure 10. L/l* values for 6.5 wt %, 7 wt %, and 7.4 wt % CAPB and SLES, 15 wt % avocado oil emulsions over 3-h period.
Cosmetics 08 00099 g010
Table 1. Jojoba Oil Emulsion Formulations.
Continuous Phasewt %Dispersed Phasewt %Surfactantwt %Surfactantwt %
Deionized Water79.6Jojoba Oil15SLES2.7CAPB2.7
7933
78.53.253.25
783.53.5
77.63.73.7
7744
Table 2. Avocado Oil Emulsion Formulations.
Continuous Phasewt %Dispersed Phasewt %Surfactantwt %Surfactantwt %
Deionized Water80Avocado Oil15SLES2.5CAPB2.5
79.42.82.8
7933
78.53.253.25
783.53.5
77.63.73.7
7744
Publisher’s Note: MDPI stays neutral with regard to jurisdictional claims in published maps and institutional affiliations.

