
Reasonable Limiting of 7-Day Incidence per Hundred Thousand and Herd Immunization in Germany and Other Countries


1
Institut für Theoretische Physik, Lehrstuhl IV: Weltraum-und Astrophysik, Ruhr-Universität Bochum, D-44780 Bochum, Germany
2
Institut für Theoretische Physik und Astrophysik, Christian-Albrechts-Universität zu Kiel, Leibnizstr. 15, D-24118 Kiel, Germany
3
Polymer Physics, Department of Materials, ETH Zurich, CH-8093 Zurich, Switzerland
*
Authors to whom correspondence should be addressed.
COVID 2021, 1(1), 130-136; https://0-doi-org.brum.beds.ac.uk/10.3390/covid1010012
Submission received: 14 June 2021
/
Revised: 10 July 2021
/
Accepted: 12 July 2021
/
Published: 14 July 2021
Abstract
:Based on hospital capacities, facts from past experience with the coronavirus disease 2019 (COVID-19) virus and the number of dark infections during the second wave (), a reasonable limiting value of for the 7-day incidence per 100,000 persons (MSDIHT) and a second wave herd immunization threshold fraction value of in Germany were calculated. If the MSDIHT is held below this limiting value, the German hospital system can cope with the number of new seriously infected persons without any triage decisions. On the basis of the SIRV epidemics model, the classical threshold values for herd immunization were calculated for 18 countries. For these countries, the dates regarding when herd immunization against the second COVID-19 wave will be reached were estimated.
1. Introduction
In Germany the imposition of nonpharmaceutical interventions (NPIs) leading to partial and total lockdowns have been justified by goverment agencies with values of the so-called monitored 7-day incidence per persons—hereafter referred to as MSDIHT—exceeding either 50 or 200, respectively. The MSDIHT is given by the number of new infections found per 100,000 persons over the most recent 7 days. With estimated costs for each lockdown day of about 444 million euros [1,2], two issues are of great importance: (1) the calculation of a reasonable MSDIHT value based on the medical capacity of Germany, and (2) reliable calculations of the percentages of infected and vaccinated persons in Germany for herd immunization, which would remove the justification for any lockdown measures.
In this work we first discuss (Section 3.1) how reasonable the values 50 and 200 are, based on the hospital capacities in Germany, the facts we know from our past experience with the COVID-19 virus and the number of dark infections D. However, due to incomplete testing, the MDIHT does not agree with the true 7-day incidence per persons value (hereafter referred to as SDIHT value), which is greater by the dark number factor D. In Germany this dark number for the first COVID-19 wave has been estimated [3] to be about by modeling simultaneusly the monitored death and infection rates during the first COVID-19 wave. Due to more complete testing during the second Corona wave, including in particular, tests of younger people at schools, this dark number has been reduced. However, the straightforward comparison of the monitored death and infection rates, accounting for the characteristic time delay of 14 days between the former and the latter, indicates that the dark number during the second wave is still about [4]. As the appearance of a third Corona wave never showed up clearly in the monitored death rates in Germany (only in the monitored but highly incomplete rate of new infections), we do not consider such a third wave here.
Secondly, the calculation of the herd immunization percentage requires the careful determination of the so-called basic reproduction number of the COVID-19 pandemic. We address this in the second part of this note (Section 3.2).
In our considerations we use scaled quantities so that our method explicitly used for Germany can also be applied to other countries or smaller regions in a country. We emphasize that throughout our investigation we used medical parameter values averaged over a large population size which do not represent regional fluctuations.
2. Methods
Including its emergency reserves, Germany in total has about breathing apparati or intensitive treatment beds, of which, however, only percent are available for the treatment of seriously infected persons (SIPs) with COVID-19. The parameter b scales the number of breathing apparati or intensive treatment beds in units of 50,000 so that for Germany ; for another country with, e.g., 5000 beds, then the parameter b would be . The majority of these beds are used for other emergency patients with strokes, heart attacks and/or cancer in the terminal stage, and a substantial number of beds cannot be used because of the lack of sufficiently well-trained nursing personel.
The breathing apparati are on average occupied by seriously infected persons (SIPs) in intensive hospital care for about days, where m stands for the number of months. Below we use the value , but we keep the m-dependence to the estimated values. Consequently, every day breathing apparati are available for new SIPs.
From our past experience with the COVID-19 virus [4,5] we know that about 20 percent of the number I of newly infected persons per day have symptoms (the other 80 percent have mild or no symptons), 5% have to be hospitalized, and percent (h hereafter is adopted to be unity) need access to breathing apparati. Of these SIPS eventually every second person dies from the virus within the 30 m days of intensive care which then corresponds to a mortality rate of . The German health system therefore can cope with newly infected persons per day.
The time evolutions of pandemic diseases in populations of large sizes are well captured by the standard susceptible-infectious-recovered/removed (SIR) epidemic model; for reviews see references [6,7], which recently [8] has been generalized by introducing the fourth compartment V of vaccinated persons and the vaccination rate that regulates the relation between susceptible and vaccinated persons.
3. Results and Discussion
3.1. MSDIHT Value
Germany has a population of million persons, corresponding to with 100,000 persons. The maximum capable incidence value per 100,000 persons in Germany is then given by . Consequently, the corresponding true SDIHT is given by
By adopting the second wave dark number value , we find that
is a reasonable value. This is significantly larger than the value of 50. If the MSDIHT is held below this limiting value given in Equation (2), the German hospital system can cope with the number of new seriously infected persons without any triage decisions.
Several comments are appropriate:
- 1.
- Germany has already experienced very high values of the SDIHT during the second wave without a breakdown of hospital capacity and without any triage decisions. A maximum death rate of 1100 per day has been reported, which with a fatality rate of corresponds to per day and an SDIHT of .
- 2.
- If in the future one would stick to an MSDIHT value of 50, it means that only about one third of the medical capacity in Germany would be used for the intensive treatment of COVID-19 SIPs, even with a low percentage of breathing apparati used for these persons.
- 3.
- Only with more accurate and complete testing of the population could the dark number of be reduced. In this case a higher MSDIHT value would be possible, which at most equals the SDIHT value of Equation (1). Such a high limiting value would spare Germany from its currently imposed strict lockdown. The costs for such extensive and complete testing campaigns are highly justified, as they are orders of magnitude below the estimated economical costs of each lockdown day of about 444 million euros.
- 4.
- The adopted fatality rate of implies that in the worst case (without the now available vaccination campaigns of the population), the total number of COVID-19 fatalities is million persons in Germany. This large number is about half of the typical annual number of deaths in Germany, and it is getting reduced further not only by the ongoing vaccination program [8], but also by the obvious advantage that comes with the decrease of the dark number, the knowledge of being infected or not.
- 5.
- A significantly higher SDIHT-value is possible if a greater than 20 percent fraction of breathing apparati can be made available for the treatment of seriously infected persons (SIPs). E.g., a value of 43 percent, so that , results in an SDIHT-value of 600. The greatest hindrance for such an enhancement in is the lack of enough suitably trained nursing staff caused by the inattractive pay for these personel. We suggest enhancing the attractiveness of these jobs by paying an annual COVID-bonus of euros per year for nursing personel treating SIPs. With one nurse taking care of two SIPs in an 8 h working shift, for around-the-clock treatment nurses per SIP are needed, so for SIPS in total, nurses are needed. The annual cost for their COVID-bonus would be 630 million euros per year or million euros per day, corresponding to less than percent of the daily lockdown costs of 444 million euros. From an economical point of view, this would be a very wise investment in the German health system.
3.2. Herd Immunization
According to the SIR model [9,10,11,12,13], herd immunization is achieved if the sum of removed/recovered (R) and vaccinated (V) fractions in a population exceeds the classical threshold value:
where denotes the basic reproduction number. We assume that the vaccinations are 100 percent effective and treat the population that has survived natural infection and the vaccinated population on equal grounds.
Recently, Ganasegaran et al. [14] and Kwok et al. [15] have advocated to use in Equation (3), instead of the basic reproduction number , the time-varying effective reproduction number in order to account for nonpharmaceutical interventions implemented before the start of secondary waves. We do not follow this approach here mainly for two reasons: (1) It has been shown before [16] that all effective reproduction factors calculated with the Gaussian distribution model, which approximates the SIR-time distribution very well, decrease from the base reproduction number at the beginning of the outburst. Consequently, the use of provides an upper limit for the threshold value H. (2) With the pandemic SIR modeling in the relevant semi-time case [8,17], each new emergent wave is treated like a new pandemic outbreak with its own new base reproduction number that differs from the base reproduction numbers of earlier waves and accounts for nonpharmaceutical interventions used in the meantime.
The basic reproduction number is defined [18,19] as the average number of secondary infections produced when one infected individual is introduced into a host population where everyone is susceptible. Therefore, is identical to the value of the effective reproduction factor at the starting time of the outbreak. In terms of the SIR model [17], this model should then obey the initial condition that one infection occurs at time . Using the box-shaped serial interval distribution and the analytical SIR-solution with a constant time-independent ratio of the recovery () to infection rate (), the basic reproduction number for this type of COVID-19 virus has been derived [20] as
where
As detailed in [20], Equations (4) and (5) result from inserting the asymptotic behavior at early times in terms of the daily rate of new infections and the box-shaped serial interval distribution with a duration of 13.5 days into the formula for the effective reproduction factor [21]. The results for the first COVID-19 wave in 71 countries have been reported before [20]. Here we repeat this determination for the second COVID-19 waves in the 18 countries listed in Table 1.
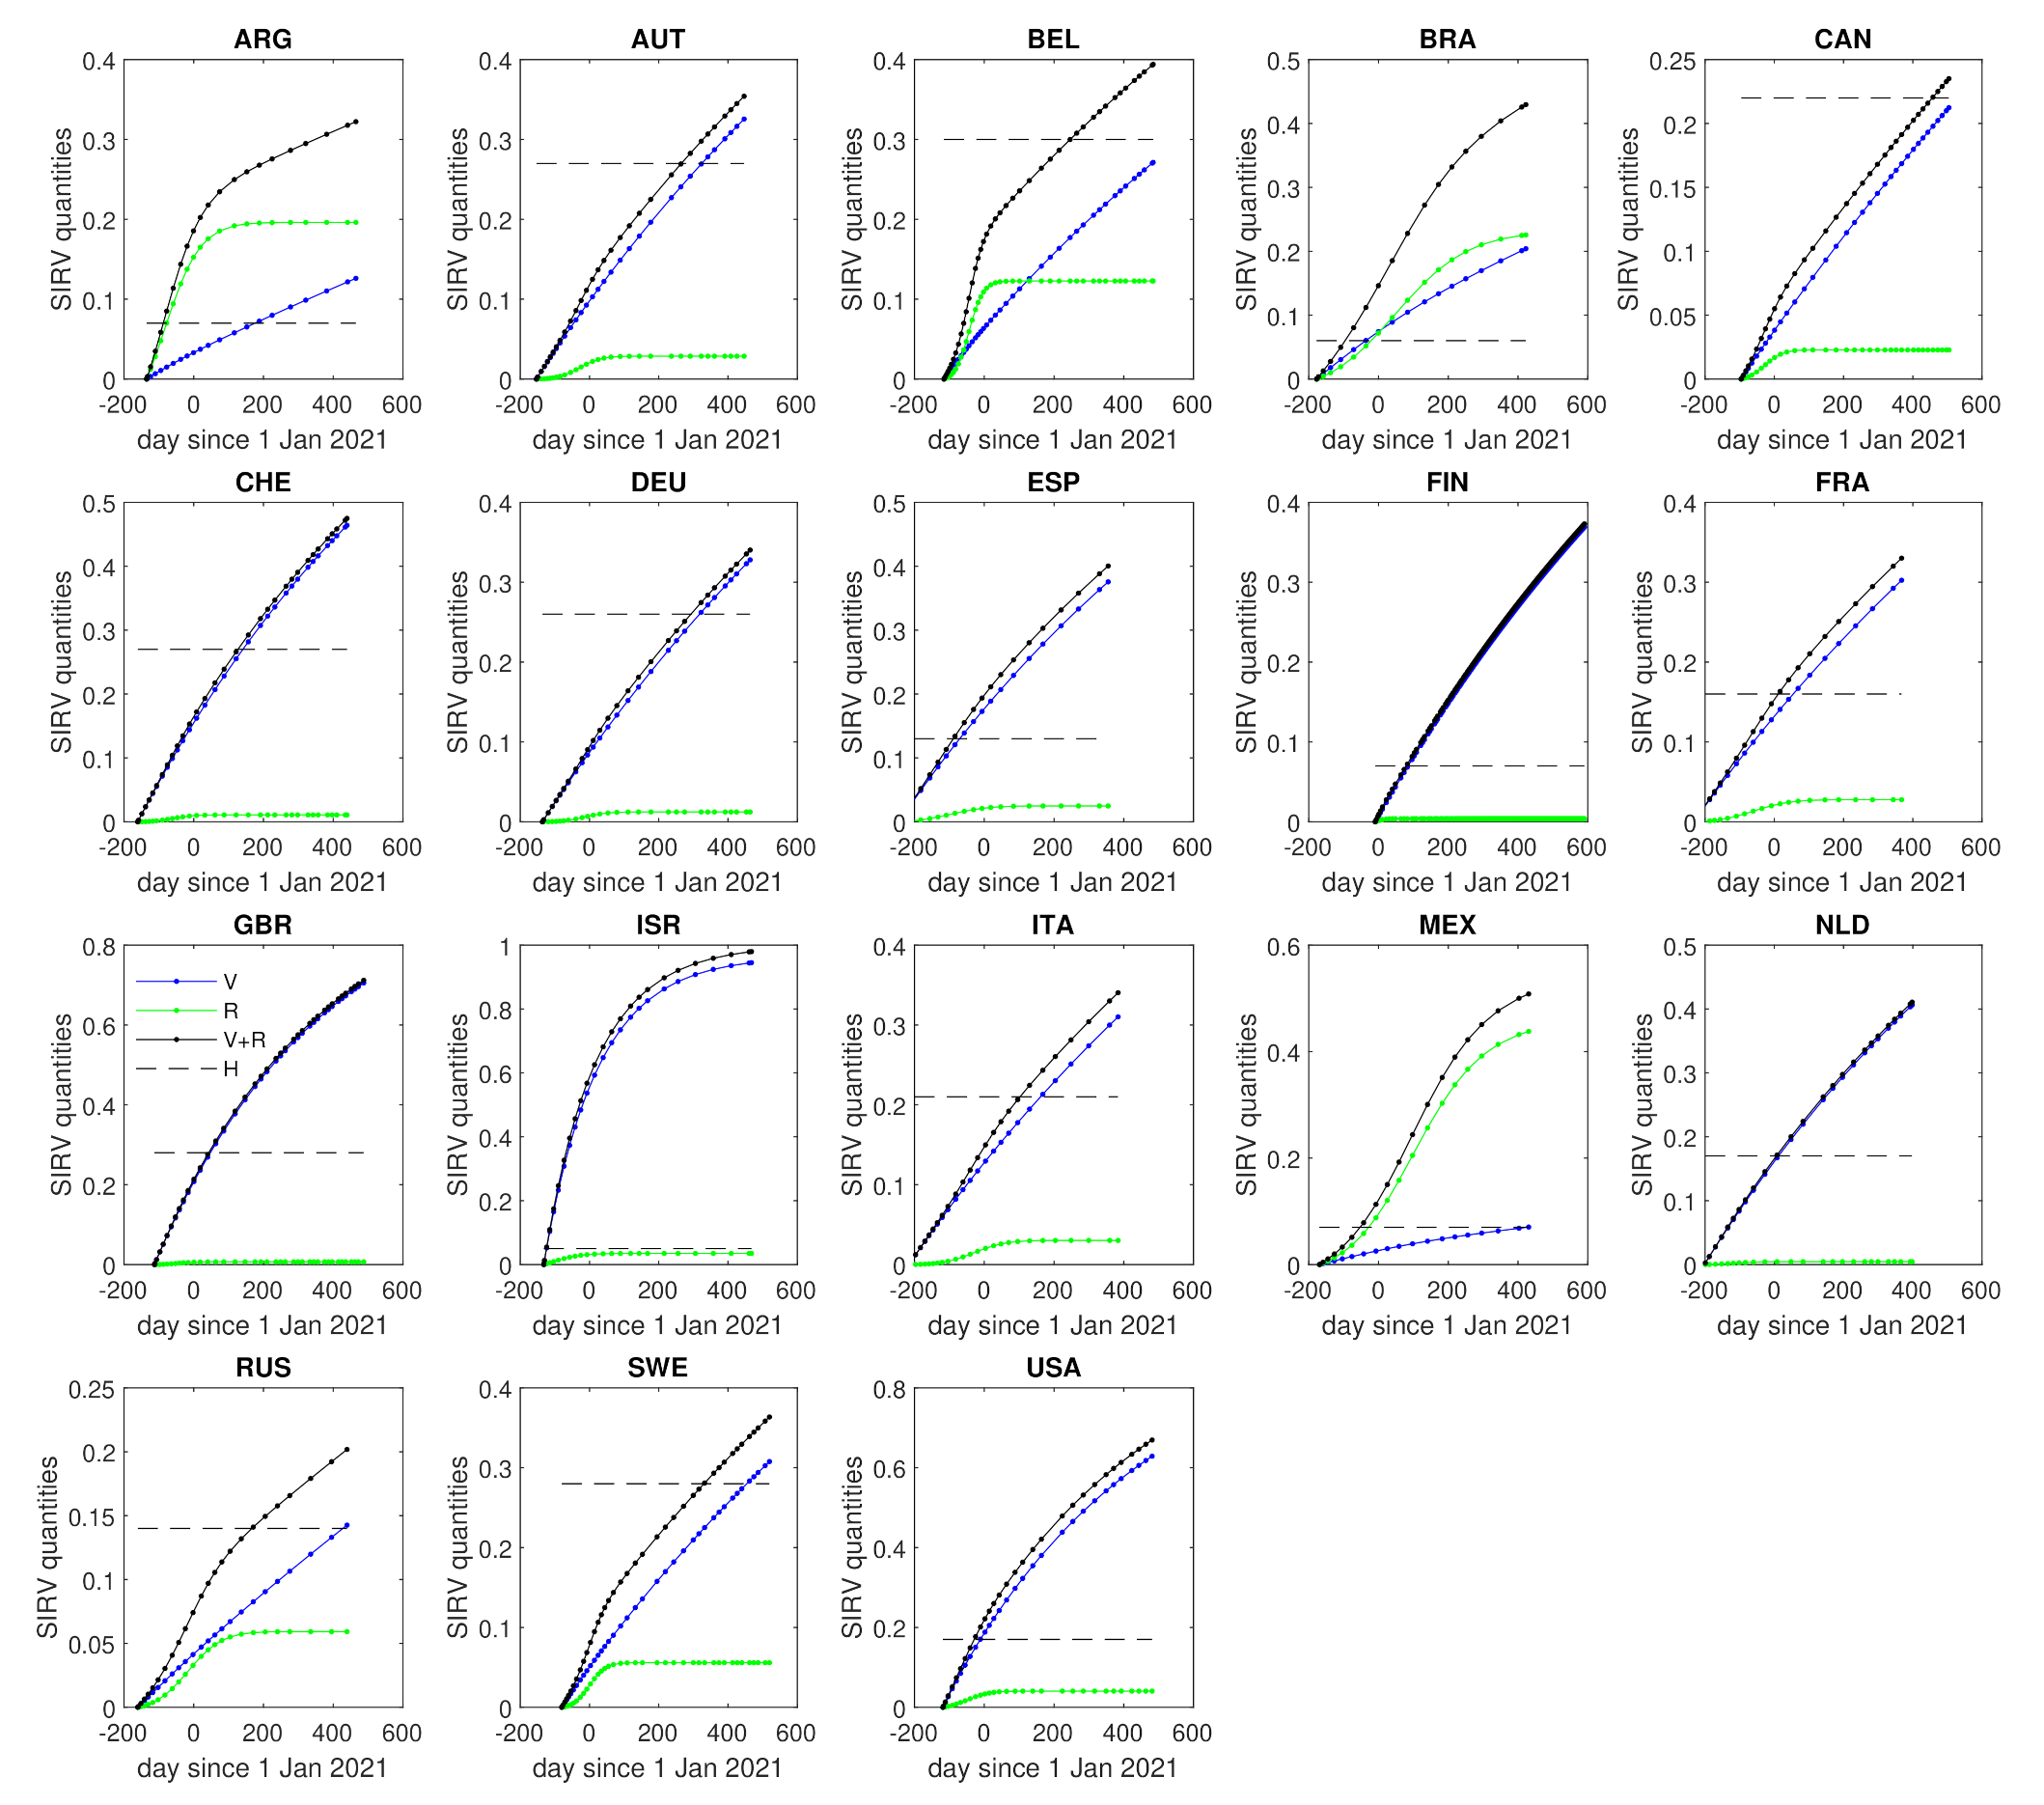
For all 18 countries, we then used the SIRV-model [8] to calculate the real-time dependence of the vaccination () and the recovered/recovered () fractions and their sums , which then are contrasted with the individual threshold values. The results are shown in Figure 1. As the panels indicate, e.g., in Israel, Great Britain and Switzerland herd immunization against the second wave of COVID-19 has already been achieved, −124, 63 and 157 days after 1 January 2021, corresponding to 30 August 2020, 4 March 2021 and 6 June 2021, respectively, whereas in Germany and Belgium this will occur on 18 November 2021 and 22 September 2021, respectively. Herd immunization times for all 18 countries are included in Table 1. We emphasize that our herd immunization threshold value only holds for the second-wave-type COVID-19 virus. Our forecast is not valid if a more agressive COVID-19 virus mutant for which the currently used vaccine is less effective or even ineffective is operating.
4. Summary and Conclusions
Knowledge of a reasonable MSDIHT value based on the medical capacities of countries and the value of the herd immunization threshold value for the second COVID-19 waves in different countries are important both for imposing nonpharmaceutical interventions, leading to partial and total lockdowns, and their later partial and total lifting. Here these two values have been calculated based on the hospital capacities, facts from past experience with the COVID-19 virus and the numbers of dark infections for 18 different countries. For Germany with a second wave dark number of , a reasonable limiting value of for the monitored 7-day incidence per persons value (MSDIHT) and a second wave herd immunization threshold fraction value of have been calculated. As scaled quantities for the hospital capacities have been used, our method for determining the MSDIHT value, explicitly illustrated for Germany, can also be applied to other countries or smaller regions in each country. The classical herd immunization threshold value H was calculated from the basic reproduction number of second COVID-19 waves in 18 different countries. The recently developed the SIRV-epidemics model [8] then allowed us to contrast the real time dependence of the sum of the fractions of vaccinated and recovered/recovered persons with the threshold values. For 18 different countries, we calculated the dates for which herd immunization against the second COVID-19 waves is reached.
Our analysis was based on a number of assumptions: (i) , as calculated from the semi-time SIR-modeling, is the appropriate entry factor for Equation (3),; (ii) we assumed that vaccinations are 100 percent effective; (iii) we treated the population that survived natural infection and the vaccinated population on equal grounds. It is, however, still unclear how effective the vaccines will be in the future, particularly if new mutants take over. The herd immunity threshold H is increasing with decreasing efficacy, as discussed, e.g., in [22].
Author Contributions
Conceptualization, R.S.; methodology, R.S. and M.K.; software, M.K.; writing—original draft preparation, R.S.; writing—review and editing, R.S. and M.K. All authors have read and agreed to the published version of the manuscript.
Funding
This research received no external funding.
Institutional Review Board Statement
Not applicable.
Informed Consent Statement
Not applicable.
Data Availability Statement
The data for and k collected in Table 1 had been retrieved on 23 May 2021 from the Supplementary website https://www.complexfluids.ethz.ch/cgi-bin/covid19-waveII of [20]. The vaccination rates v were obtained from https://github.com/owid/covid-19-data/blob/master/public/data/vaccinations/vaccinations.csv (accessed on 23 May 2021).
Conflicts of Interest
The authors declare no conflict of interest.
References
- Dorn, F.; Fuest, C.; Göttert, M.; Krolage, C.; Lautenbacher, S.; Link, S.; Peichl, A.; Reif, M.; Sauer, S.; Stöckli, M.; et al. Die Volkswirtschaftlichen Kosten des Corona-Shutdown für Deutschland: Eine Szenarienrechnung; ifo-Schnelldienst; Ifo-Institute: Munich, Germany, 2020; Volume 4, p. 29. [Google Scholar]
- Beznoska, M.; Hentze, T.; Hüther, M. Zum Umgang mit den Corona Schulden; IW-Policy paper 7/21; Institut der Deutschen Wirtschaft: Cologne, Germany, 2021. [Google Scholar]
- Schlickeiser, R.; Kröger, M. Dark numbers and herd immunity of the first Covid-19 wave and future social interventions. Epidem. Int. J. 2020, 4, 000152. [Google Scholar]
- Schlickeiser, R.; Schlickeiser, F. A gaussian model for the time development of the Sars-Cov-2 corona pandemic disease. Prrdictions for Germany made on March 30. Physics 2020, 2, 164–170. [Google Scholar] [CrossRef]
- Schüttler, J.; Schlickeiser, R.; Schlickeiser, F.; Kröger, M. Covid-19 predictions using a Gauss model, based on data from April 2. Physics 2020, 2, 197–202. [Google Scholar] [CrossRef]
- Estrada, E. COVID-19 and SARS-CoV-2. Modeling the present, looking at the future. Phys. Rep. 2020, 869, 1–51. [Google Scholar] [CrossRef] [PubMed]
- Keeling, M.J.; Rohani, P. Modeling Infectious Diseases in Humans and Animals; Princeton University Press: Princeton, NJ, USA, 2008. [Google Scholar]
- Schlickeiser, R.; Kröger, M. Analytical modeling of the temporal evolution of epidemics outbreaks accounting for vaccinations. Physics 2021, 3, 386–426. [Google Scholar] [CrossRef]
- John, T.J.; Samuel, R. Herd immunity and herd effects: New insights and definitions. Eur. J. Epidemiol. 2000, 16, 601. [Google Scholar] [CrossRef] [PubMed]
- Garnett, G.P. Role of herd immunity in determining the effect of vaccines against sexually transmitted disease. J. Infect. Dis. 2005, 191 (Suppl. 1), 97–106. [Google Scholar] [CrossRef] [PubMed] [Green Version]
- Perisic, A.; Bauch, C.T. Social contact networks and disease eradicability under voluntary vaccination. PLoS Comput. Biol. 2009, 5, e1000280. [Google Scholar] [CrossRef] [PubMed] [Green Version]
- Rodpothong, P.; Auewarakul, P. Viral evolution and transmission effectiveness. World J. Virol. 2012, 1, 131–134. [Google Scholar] [CrossRef] [PubMed]
- Britton, T.; Ball, F.; Trapman, P. A mathematical model reveals the influence of population heterogeneity on herd immunization to SARS-CoV-2. Science 2020, 369, 846–849. [Google Scholar] [CrossRef] [PubMed]
- Ganasegeran, K.; Ch’ng, A.S.H.; Looi, I. What is the estimated COVID-19 reproduction number and the proportion of the population that needs to be immunized to achieve herd immunity in Malaysia? A mathematical epidemiology synthesis. Covid 2021, 1, 13–19. [Google Scholar] [CrossRef]
- Kwok, K.O.; Lai, F.; Wei, W.I.; Wong, S.Y.S.; Tang, J.W.T. Herd immunity—Estimating the level required to halt the COVID-19 epidemics in affected countries. J. Infect. 2020, 80, e32–e33. [Google Scholar] [CrossRef] [PubMed]
- Kröger, M.; Schlickeiser, R. Gaussian doubling times and reproduction factors of the COVID-19 pandemic disease. Front. Phys. 2020, 8, 276. [Google Scholar] [CrossRef]
- Schlickeiser, R.; Kröger, M. Analytical solution of the SIR-model for the temporal evolution of epidemics: Part B. Semi-time case. J. Phys. A 2021, 54, 175601. [Google Scholar] [CrossRef]
- Anderson, R.M.; May, R.M. Infectious Diseases of Humans; Oxford University Press: Oxford, UK, 1992. [Google Scholar]
- Delamater, P.L.; Street, E.J.; Leslie, T.F.; Yang, Y.T.; Jacobsen, K.H. Complexity of the basic reproduction number (R0). Emerg. Inf. Dis. 2019, 25, 1. [Google Scholar] [CrossRef] [PubMed] [Green Version]
- Schlickeiser, R.; Kröger, M. First consistent determination of the basic reproduction number for the first Covid-19 wave in 71 countries from the SIR-epidemics model with a constant ratio of recovery to infection rate. Glob. J. Sci. Front. Res. 2020, 20, 37–43. [Google Scholar] [CrossRef]
- Fraser, C. Estimating individual and household reproduction numbers in an emerging epidemic. PLoS ONE 2007, 2, e758. [Google Scholar] [CrossRef] [PubMed]
- Kadkhoda, K. Herd Immunity to COVID-19. Alluring and Elusive. Am. J. Clin. Pathol. 2021, 155, 471–472. [Google Scholar] [CrossRef] [PubMed]
Figure 1.
Real-time dependencies of the fractions of vaccinated () (solid blue) and recovered/removed () (solid green) persons and their sum (solid black) in comparison with the second wave herd immunization threshold value (dashed black) for the countries listed in Table 1.
Figure 1.
Real-time dependencies of the fractions of vaccinated () (solid blue) and recovered/removed () (solid green) persons and their sum (solid black) in comparison with the second wave herd immunization threshold value (dashed black) for the countries listed in Table 1.


Table 1.
Results from the analysis of second pandemic waves in selected countries based on data from = 23 May 2021 (see data availability statement at the end of this document). The columns contain the infection rate , the ratio of the initial recovery to infection rate, the ratio of the initial vaccination to infection rate, the net infection number , the basic reproduction number , the herd immunization threshold value H and the calculated predicted herd immunization time (number of days after 1 January 2021). We have included into this table all those 18 countries listed at our data source that (i) have clearly entered a second wave, and (ii) have populations well above inhabitants (on 23 May 2021).
| Country | k | b | x | H | |||
|---|---|---|---|---|---|---|---|
| ARG | 0.125 | 0.912 | 0.0022 | 0.15 | 1.08 | 0.07 | −78 |
| AUT | 0.520 | 0.905 | 0.0013 | 0.67 | 1.37 | 0.27 | 291 |
| BEL | 0.551 | 0.896 | 0.0011 | 0.77 | 1.44 | 0.30 | 265 |
| BRA | 0.046 | 0.790 | 0.0099 | 0.13 | 1.07 | 0.06 | −71 |
| CAN | 1.018 | 0.962 | 0.0004 | 0.52 | 1.28 | 0.22 | 458 |
| CHE | 0.458 | 0.894 | 0.0023 | 0.66 | 1.36 | 0.27 | 157 |
| DEU | 0.559 | 0.915 | 0.0012 | 0.64 | 1.35 | 0.26 | 322 |
| ESP | 0.175 | 0.876 | 0.0046 | 0.29 | 1.15 | 0.13 | −84 |
| FIN | 3.858 | 0.997 | 0.0002 | 0.16 | 1.08 | 0.07 | 83 |
| FRA | 0.228 | 0.886 | 0.0027 | 0.35 | 1.19 | 0.16 | 17 |
| GBR | 0.389 | 0.867 | 0.0053 | 0.70 | 1.39 | 0.28 | 63 |
| ISR | 0.050 | 0.855 | 0.1283 | 0.10 | 1.05 | 0.05 | −124 |
| ITA | 0.289 | 0.873 | 0.0022 | 0.50 | 1.27 | 0.21 | 130 |
| MEX | 0.038 | 0.712 | 0.0044 | 0.15 | 1.08 | 0.07 | −43 |
| NLD | 0.397 | 0.929 | 0.0022 | 0.38 | 1.20 | 0.17 | 8 |
| RUS | 0.337 | 0.933 | 0.0008 | 0.30 | 1.16 | 0.14 | 171 |
| SWE | 0.652 | 0.922 | 0.0010 | 0.69 | 1.38 | 0.28 | 332 |
| USA | 0.218 | 0.868 | 0.0081 | 0.39 | 1.21 | 0.17 | −25 |
Publisher’s Note: MDPI stays neutral with regard to jurisdictional claims in published maps and institutional affiliations. |
© 2021 by the authors. Licensee MDPI, Basel, Switzerland. This article is an open access article distributed under the terms and conditions of the Creative Commons Attribution (CC BY) license (https://creativecommons.org/licenses/by/4.0/).
Share and Cite
MDPI and ACS Style
Schlickeiser, R.; Kröger, M. Reasonable Limiting of 7-Day Incidence per Hundred Thousand and Herd Immunization in Germany and Other Countries. COVID 2021, 1, 130-136. https://0-doi-org.brum.beds.ac.uk/10.3390/covid1010012
AMA Style
Schlickeiser R, Kröger M. Reasonable Limiting of 7-Day Incidence per Hundred Thousand and Herd Immunization in Germany and Other Countries. COVID. 2021; 1(1):130-136. https://0-doi-org.brum.beds.ac.uk/10.3390/covid1010012
Chicago/Turabian StyleSchlickeiser, Reinhard, and Martin Kröger. 2021. "Reasonable Limiting of 7-Day Incidence per Hundred Thousand and Herd Immunization in Germany and Other Countries" COVID 1, no. 1: 130-136. https://0-doi-org.brum.beds.ac.uk/10.3390/covid1010012