Article

Computer Simulation of the Incorporation of V2+, V3+, V4+, V5+ and Mo3+, Mo4+, Mo5+, Mo6+ Dopants in LiNbO3

by
Romel Menezes Araujo
1,2,
Emanuel Felipe dos Santos Mattos
1,
Mário Ernesto Giroldo Valerio
3 and
Robert A. Jackson
4,*
1
Chemistry Coordination/IPISE/PIC, Pio Decimo College, Campus Jabotiana, Aracaju-SE 49027-210, Brazil
2
Research Institute—Instituto de Pesquisa, Tecnologia e Negócios-IPTN, Aracaju-SE 49095000, Brazil
3
Physics Department, Federal University of Sergipe, Campus Universitário, São Cristovão-SE 491000-000, Brazil
4
Lennard-Jones Laboratories, School of Chemical and Physical Sciences, Keele University, Keele, Staffordshire ST5 5BG, UK
*
Author to whom correspondence should be addressed.
Submission received: 10 March 2020 / Revised: 4 May 2020 / Accepted: 6 May 2020 / Published: 1 June 2020
(This article belongs to the Special Issue Recent Progress in Lithium Niobate)

Abstract

:
The doping of LiNbO3 with V2+, V3+, V4+ and V5+ as well as Mo3+, Mo4+, Mo5+ and Mo6+ ions is of interest in enhancing its photorefractive properties. In this paper, possible incorporation mechanisms for these ions in LiNbO3 are modelled, using a new set of interaction potentials fitted to the oxides VO, V2O3, VO2, V2O5 and to LiMoO2, Li2MoO3, LiMoO3, Li2MoO4.

1. Introduction

Ferroelectric lithium niobate is a material that has been extensively studied because of its many technological applications, including optical integrated circuits, electro-optical modulators, optical memories, acoustic filters, high-frequency beam deflectors, frequency converters and holographic volume storage [1,2,3,4,5,6,7,8,9], for which holographic volume storage performance is very important [10,11,12,13,14,15]. This paper looks at the doping of LiNbO3 with vanadium and molybdenum ions in different charge states, with the aim of predicting the optimum location of dopants, and charge compensation mechanisms where needed.
Previous work on vanadium and molybdenum doped lithium niobate has included experimental studies of how its photorefractive properties are enhanced by doping with molybdenum ions [16,17] where it is suggested that the Mo6+ ion dopes at the Nb5+ site. Another study looks at LiNbO3 co-doped with Mg and V, concluding that some of the vanadium dopes at the Nb site in the 5+ charge state, but that V4+Li, V3+Li and V2+Li defects are also observed [18]. Finally, another recent publication [19] has looked at the photorefractive response of Zn and Mo co-doped LiNbO3 in the visible region, and concluded that the presence of Mo6+ ions helps promote fast response and multi-wavelength holographic storage, which is attributed to their occupation of regular niobium sites in the lattice.
In a Density Functional Theory (DFT) study [20], vanadium doping was modelled, and it was concluded that vanadium substitutes at the Li+ site as V4+, but that it dopes at the Nb site as a neutral defect as the Fermi level is increased. In another DFT study [21], molybdenum doping was modelled and it was concluded that the most stable configuration involves doping at the Nb5+ site, in agreement with the previously mentioned experimental studies [16,17]. It is noted that in the DFT studies, predictions were made on the basis of defect formation energies, as opposed to the solution energy approach adopted in this paper.
This paper presents a computer modelling study of V2+, V3+, V4+ and V5+ as well as Mo3+, Mo4+, Mo5+ and Mo6+ doping in LiNbO3 using interatomic potentials. Such calculations enable predictions to be made of the sites occupied by dopant ions, and the form of charge compensation adopted, if needed. These calculations provide information about how the defects behave in the material, and how they influence its properties in the applications mentioned previously. It follows a series of papers by the authors on LiNbO3 doped with a range of ions [22,23,24,25,26,27].

2. Materials and Methods

2.1. Interatomic Potentials

The interatomic potentials used in this work consist of Buckingham potentials, supplemented by an electrostatic term, as given below:
V ( r i j ) = q i q j r i j + A i j exp ( r i j ρ i j ) C i j r i j 6
This expression shows that for each pair of ions it is necessary to determine three parameters: Aij, ρij and Cij, which are constants for each interaction, qi, qj represent the charges of the ions i and j, and rij is the interatomic distance. The parameters are determined by empirical fitting, and formal charges are used for qi and qj. The procedure by which potentials were obtained for LiNbO3 is explained in the work of Jackson and Valério [22], and the derivation of the potentials for the vanadium and molybdenum dopants is described in Section 3.1 below. The potentials for LiNbO3 have been the subject of recent studies on the doping of the structure with rare earth ions [23,24], doping with Sc, Cr, Fe and In [25], metal co-doping [26] and doping with Hf [27]. These papers show that modelling can predict the energetically optimal locations of the dopant ions and calculate the energy involved in the doping process. This paper extends this procedure to the study of V2+, V3+, V4+ and V5+ as well as Mo3+, Mo4+, Mo5+ and Mo6+ doped lithium niobate, with the aim of establishing the optimal doping site and charge compensation scheme for both sets of ions.

2.2. Defect Formation Energies

The calculation of defect formation energies is carried out using the Mott–Littleton approximation [28], in which the crystal is divided into two regions: region I, which contains the defect, and region II, which extends from the edge of region I to infinity. In region I, the positions of the ions are adjusted until the resulting force is zero. The radius of region I is selected such that the forces in region II are relatively weak and the relaxation can be treated according to the harmonic response to the defect (a dielectric continuum). An interfacial region IIa is introduced to treat interactions between region I and region II.

3. Results and Discussion

3.1. Derivation of Interatomic Potential Parameters

It was necessary to derive potential parameters for the dopant oxide structures: VO, V2O3, VO2 and V2O5 as well as LiMoO2, Li2MoO3, Li3MoO4 and Li2MoO4. For V2+-O2−, V3+-O2−, V4+-O2− and V5+-O2− as well as Mo3+-Li+, Mo4+-Li+, Mo5+-Li+, Mo6+-Li+, Mo3+-O2−, Mo4+-O2−, Mo5+-O2− and Mo6+-O2− interactions, a new set of potentials was derived empirically by fitting to the observed structures as shown in Table 1. The O2−-O2− potential was obtained by Sanders et al. [29] and uses the shell model for O [30], which is a representation of ionic polarisability, in which each ion is represented by a core and a shell, coupled by a harmonic spring, and the Li-O potential was taken from [22]. In all cases, the dopant-oxide potentials were obtained by fitting to parent oxide structures.
Table 2 compares experimental and calculated structures of VO [31], V2O3 [32], VO2 [33] and V2O5 [34] oxides as well as LiMoO2 [35], Li2MoO3 [36], Li3MoO4 [37] and Li2MoO4 [38] lithium molybdate structures, using the potentials in Table 1. It is seen that the experimental and calculated lattice parameters differ by less than 1%, confirming that the potentials can be used in further simulations of defect properties. The calculations were carried at 0 K (the default for the modelling code and used in most other theoretical studies) and at 293 K for comparison with room temperature results. In this way, we can see how the structure and energies vary with temperature.

3.2. Defect Calculations

In this section, calculated energies for dopant ions in LiNbO3 are reported. The divalent, trivalent, tetravalent, pentavalent and hexavalent dopants can substitute at Li and Nb sites in the LiNbO3 matrix with charge compensation taking place in a number of ways. The proposed schemes described in the following subsections are written as solid state reactions using the Kroger–Vink notation [39]. This notation appears in the tables in Section 3.2.1, Section 3.2.2, Section 3.2.3, Section 3.2.4 and Section 3.2.5 where the dot/bullet (·) means a net positive charge and the dash/prime (′) means a net negative charge.

3.2.1. Divalent Dopants

The substitution of the divalent dopant V2+ in the Li+ and Nb5+ host sites requires a charge-compensating defect, which can involve Li and Nb vacancies, NbLi anti-sites, interstitial oxygen, self-compensation and oxygen vacancies. The modes of substitution considered for divalent cations are shown in Table 3.
The solution energies for the divalent (V2+) dopant with different charge-compensating mechanisms were evaluated and plotted as a function of the reaction schemes. Based on the lowest energy value, it seems that the incorporation of a divalent (V2+) ion is energetically favourable at the lithium and niobium sites, taking into account the first in relation to the c axis. In schemes (i) and (iv), the energy difference in eV is small at both temperatures in the first neighbours, indicating that it can be incorporated at the lithium site compensated by a lithium vacancy as well as by self-compensation as shown in Figure 1. This can be attributed to the similarity between the ionic radius of V2+, which is 0.79 Å, and those of the Li+ site, which varies between 0.59 and 0.74 Å, and the Nb5+ site, which varies between 0.32 and 0.71 Å [40].

3.2.2. Trivalent Dopants

As with the divalent ion V2+, the trivalent V3+ and Mo3+ dopants can be incorporated at the lithium and niobium sites in the LiNbO3 matrix through various schemes as shown in Table 4 and Table 5. When these ions are substituted at Li and Nb sites, the extra positive charge can, as noted earlier, be compensated by the creation of vacancies, interstitials, anti-site defects or self-compensation.
According to Figure 2 and Figure 3 for the first and second neighbours with respect to the c axis, the trivalent V3+ and Mo3+ ions prefer to occupy both the Li and Nb sites according to scheme (iv) which is also observed in other trivalent ions [23,24,25]. This can be attributed to the similarity between the ionic radius of V3+ which is 0.64 Å and Mo3+ which is 0.67 Å [40] and that of Li+ and Nb5 +. The ionic radius of Li+ varies between 0.59 Å and 0.74 Å and Nb5+ varies from 0.32 Å to 0. 66 Å [40]. All these ionic radii are in relation to the coordination sphere with oxygen atoms.

3.2.3. Tetravalent Dopants

Like other divalent and trivalent cations, tetravalent V4+ and M4+ dopant ions can also substitute at either the Li+ or Nb5+ sites. When these ions substitute at the Li+ and Nb5+ site charge compensation is required, and various schemes involving vacancies, interstitials, anti-sites and self-compensation are adopted, as shown in Table 6 and Table 7.
The results obtained from these calculations are given in Figure 4 and Figure 5. By inspecting these figures, it can be seen that the tetravalent cation V4+ prefers to be incorporated at the Li+ and Nb5+ sites through scheme (iv), while the Mo4+ ion prefers to be incorporated at the niobium site compensated by an oxygen vacancy according to scheme (ix). Similar to the divalent and trivalent dopants, this preference is related to the proximity with the ionic radii of Li+ and Nb5+.

3.2.4. Pentavalent Dopants

For the pentavalent dopants V5+ and Mo5+, no charge compensation is required for the substitution at the Nb5+ host site, but it is required when the substitution is at the Li+ host site, as shown in Table 8 and Table 9.
The solution energies for the pentavalent (V5+) and (Mo5+) dopants with different charge compensation mechanisms were evaluated and plotted as a function of the reaction scheme. Based on the lowest energy value, it seems that the incorporation of pentavalent (V5+) and (Mo5+) ions at an Nb site is energetically more favourable than at an Li site, according to scheme (iv) as shown in Figure 6 and Figure 7 at temperatures 0 K and 293 K. This can be attributed to the similarity between the charge of the V5+ and Mo5+ ions and the Nb5+ host, which can contribute to a small deformation in the lattice and consequently a lower solution energy. Experimental results by Kong et al. [17] and Tian et al. [16] show that substitution occurs at the Nb5+ site.

3.2.5. Hexavalent Dopants

For the hexavalent dopant Mo6+, as with the pentavalent ions, there is no self-compensation mechanism and charge compensation schemes are possible when replacing Li and Nb in the LiNbO3 matrix as shown in Table 10.
The solution energies for the hexavalent (Mo6+) dopants with different charge-compensation mechanisms were evaluated and plotted as a function of the reaction scheme. Based on the lowest energy value, it seems that the incorporation of hexavalent (Mo6+) ions at an Nb site is energetically more favourable than at an Li site, according to scheme (iv) as shown in Figure 8 at temperatures 0 K and 293 K. This can be attributed to the similarity between the ionic radii of Mo6+ ions and the Nb5+ host site (0.32–0.71 Å) [40]. The ionic radii of Mo6+, taking into account the coordination number, vary between 0.42 and 0.67 Å [40], and the small difference between the Mo6+ dopant ions and Nb5+ ions can contribute to a small deformation in the lattice and consequently a lower solution energy. This result reveals that global trends of dopant solution energies are controlled by the combination of dopant ion size [40] and its electrostatic interactions, demonstrating that there is a relation between the energetically preferred site and the types of defect mechanisms involved in the doping process. Experimental results from Kong et al. [17] and Zhu et al. [41] show that substitution occurs at the Nb5+ site.
In all cases, the energy involved in doping was obtained by calculating the solution energy, which includes all terms of the thermodynamic cycle involved in the solution process. For example, the solution energy, Esol, corresponding to the incorporation of V2+ at the Li+ site (second equation in Table 3) is given by:
E Sol = E Def ( 5 M Li + V Nb ) + 2.5 E Latt ( Li 2 O ) + 0.5 E Latt ( Nb 2 O 5 ) 5 E Latt ( MO )
where the Elatt and EDef terms are lattice energies and defect energy.
All energies were normalised by the number of dopants, i.e., the solution energy is divided by the number of dopants involved. For example, for scheme (ii) of Table 3, the energy must be divided by five, since five lithium sites are occupied. This is done because the number of dopants varies for each mechanism. Lattice energies, Elatt, required to calculate the solution energies are given in Table 11.

3.2.6. Summary of Results for Vanadium and Molybdenum Dopants in LiNbO3

In this sub-section, the results presented in the last five subsections are summarised.
Divalent dopants: the calculations predict that, for V2+, self-compensation (simultaneous doping at lithium and niobium sites) and doping at the lithium site with lithium vacancy compensation are most likely. It is noted that V2+Li defects have been observed experimentally [18].
Trivalent dopants: both V3+ and Mo3+ ions are predicted to self-compensate. Experimental data from [18] support V3+ doping at the lithium site, as with V2+.
Tetravalent dopants: here, different behaviour is predicted for vanadium and molybdenum. V4+ is predicted to self-compensate, while Mo4+ is predicted to occupy a niobium site with oxygen vacancy charge compensation. Again, [18] suggests that V4+ can dope at a lithium site.
Pentavalent dopants: both V5+ and Mo5+ are predicted to dope at the niobium site (no charge compensation is needed), agreeing with experimental results [16,17].
Hexavalent dopants: Mo6+ is predicted to dope at the niobium site, with charge compensation by lithium vacancy formation. The occupation of the niobium site is supported by experimental data [16,17,19].

4. Conclusions

This paper has presented a computational study of VO, V2O3, VO2 and V2O5 as well as LiMoO2, Li2MoO3, Li3MoO4 and Li2MoO4 structures doped into LiNbO3. New interatomic potential parameters for VO, V2O3, VO2 and V2O5 as well as LiMoO2, Li2MoO3, Li3MoO4 and Li2MoO4 have been developed. It was found that divalent (V2+), trivalent (V3+, Mo3+) and tetravalent (V4+) ions are more favourably incorporated at the Li and Nb sites through the self-compensation mechanism. The tetravalent (Mo4+) ion is more favourably incorporated at the niobium site, compensated by an oxygen vacancy. The pentavalent ions (V5+, Mo5+) and hexavalent (Mo6+) ion are more favourably incorporated at the Nb site, and the lowest energy schemes involve, respectively, no charge compensation, and for the Mo6+ ion, charge compensation with lithium vacancy. This is shown to be consistent with some experimental data, although future calculations involving finite V5+ and Mo6+ concentrations will be carried out to investigate this further.
Finally, to summarise, in this paper we have looked in detail at vanadium and molybdenum dopants in various charge states in LiNbO3, and through the use of solution energies, identified the energetically favoured sites and charge compensation mechanisms, while comparing the results with available experimental and theoretical work in this field.

Author Contributions

Conceptualisation, R.M.A.; Data curation, R.M.A. and E.F.d.S.M.; Formal analysis, R.A.J.; Supervision, M.E.G.V. and R.A.J.; Validation, M.E.G.V. and R.A.J.; Writing—original draft, R.M.A.; Writing—review & editing, M.E.G.V. and R.A.J. All authors have read and agreed to the published version of the manuscript.
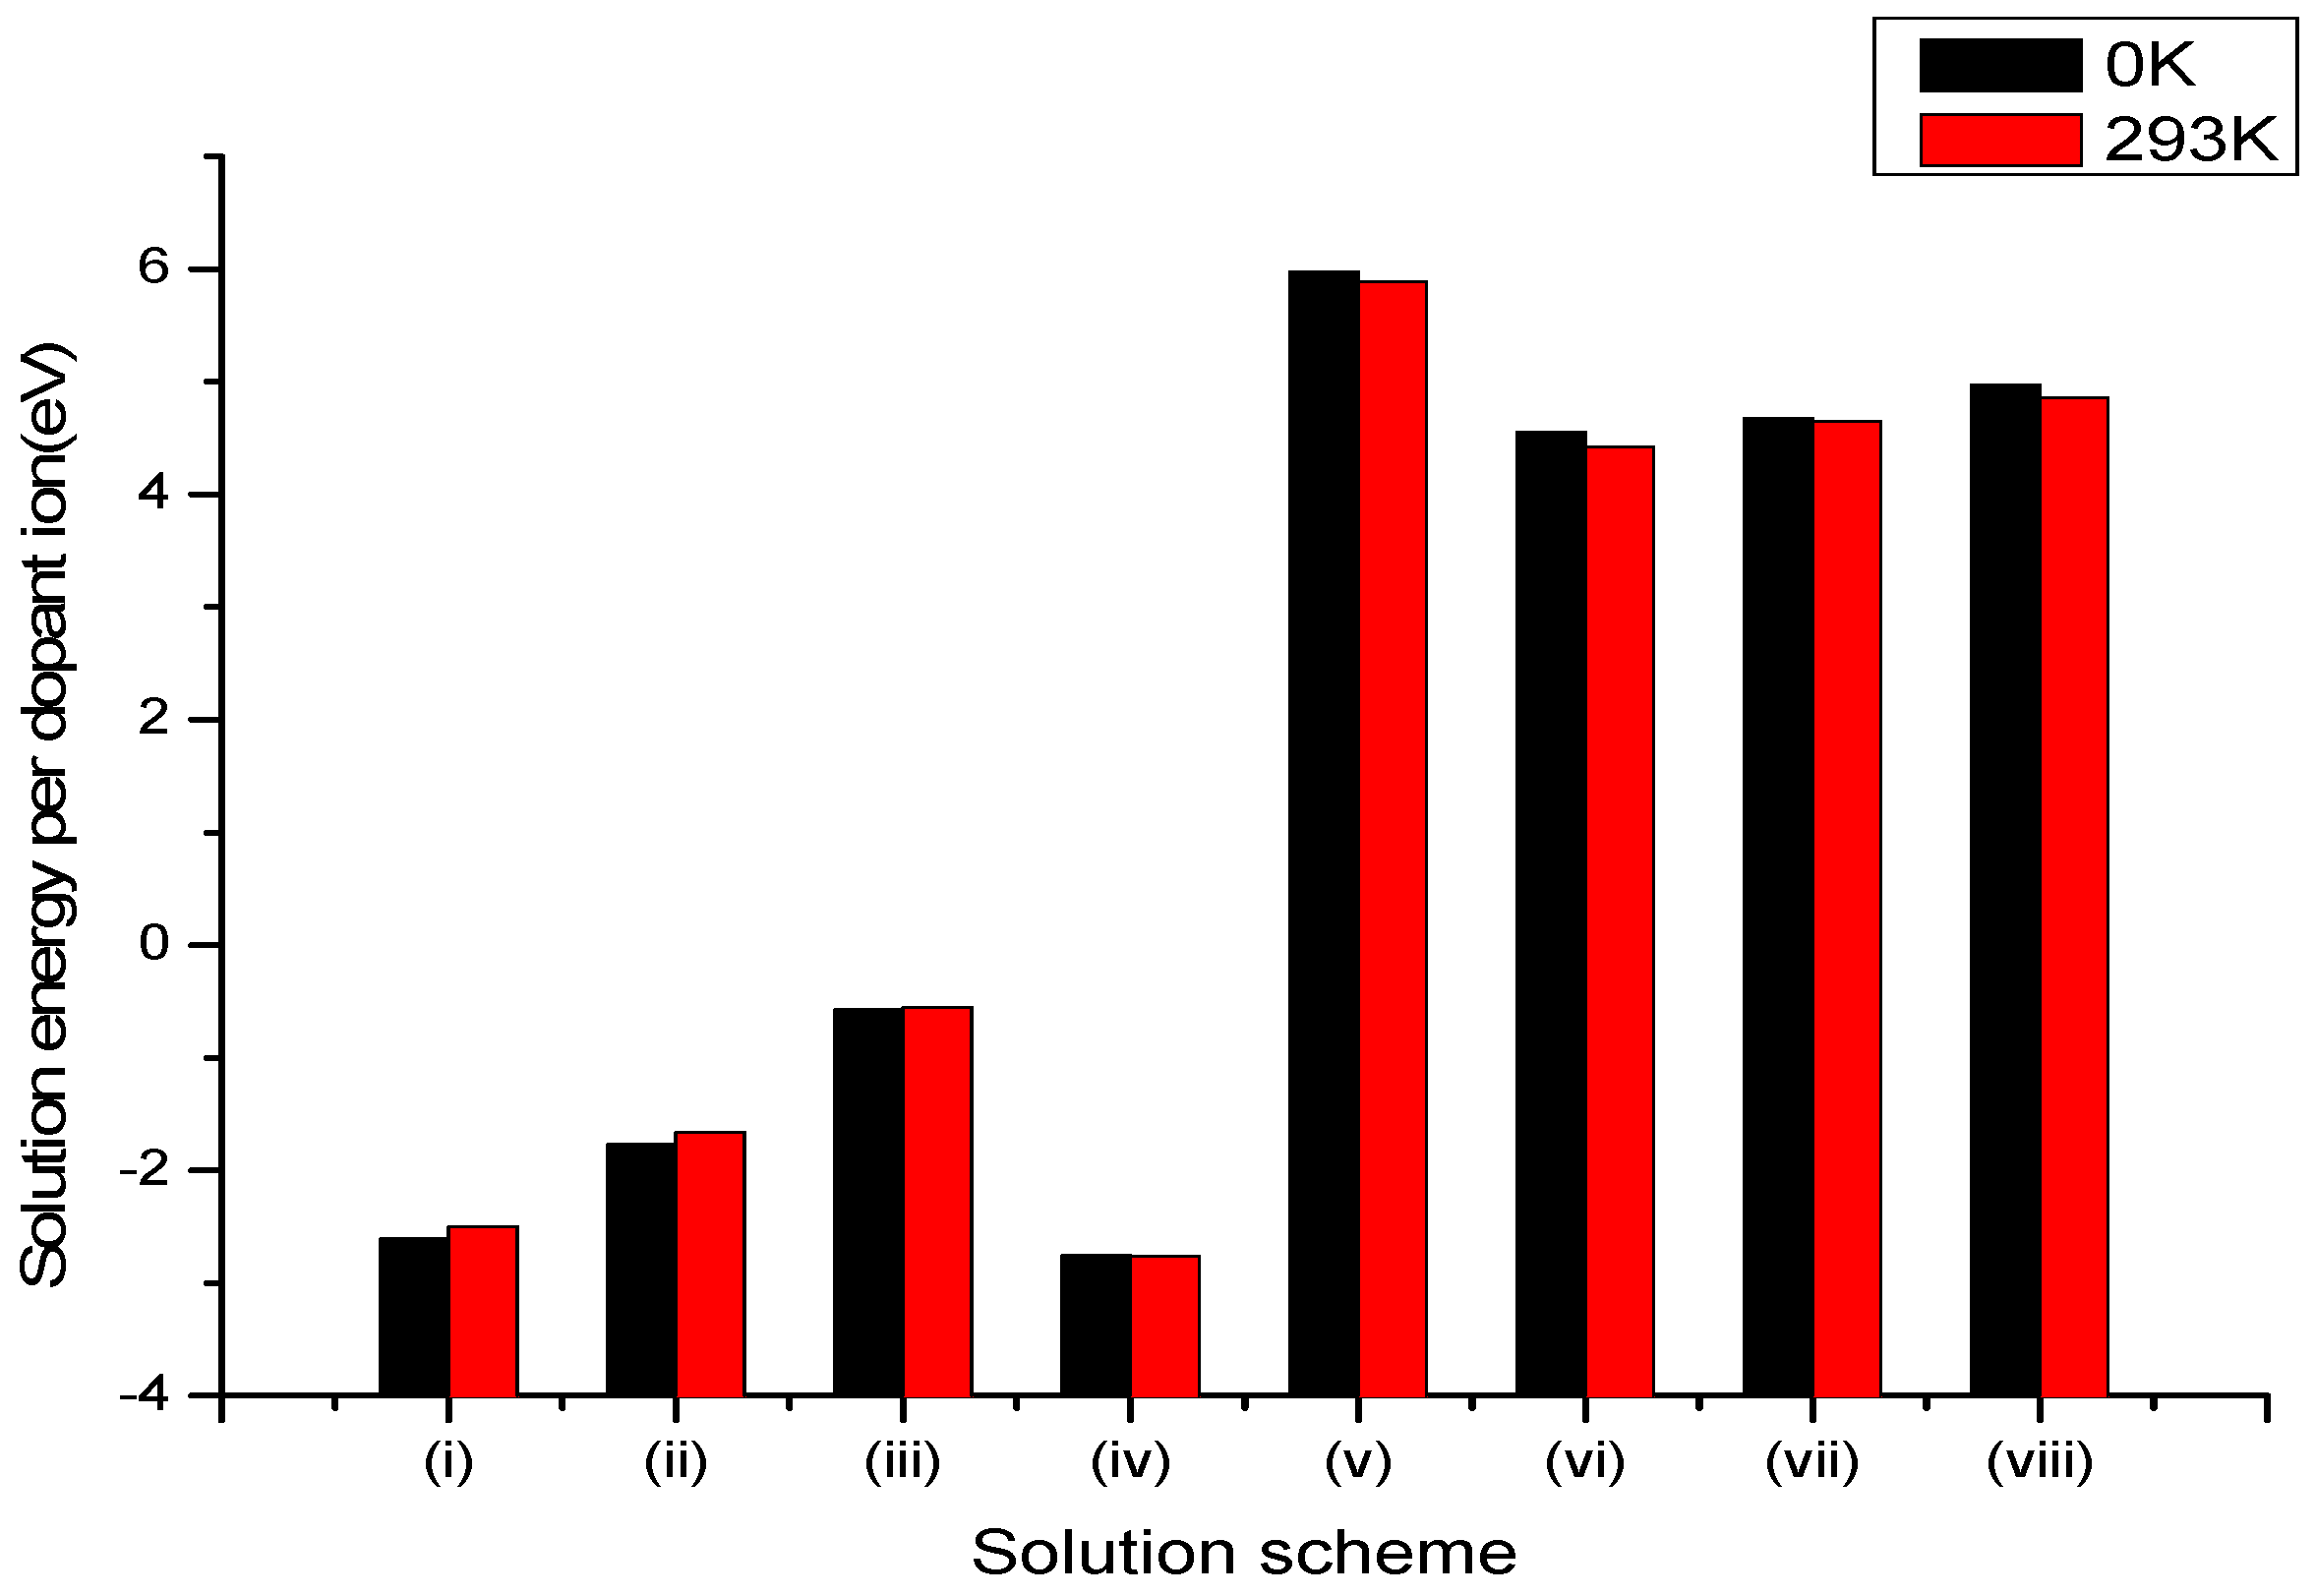
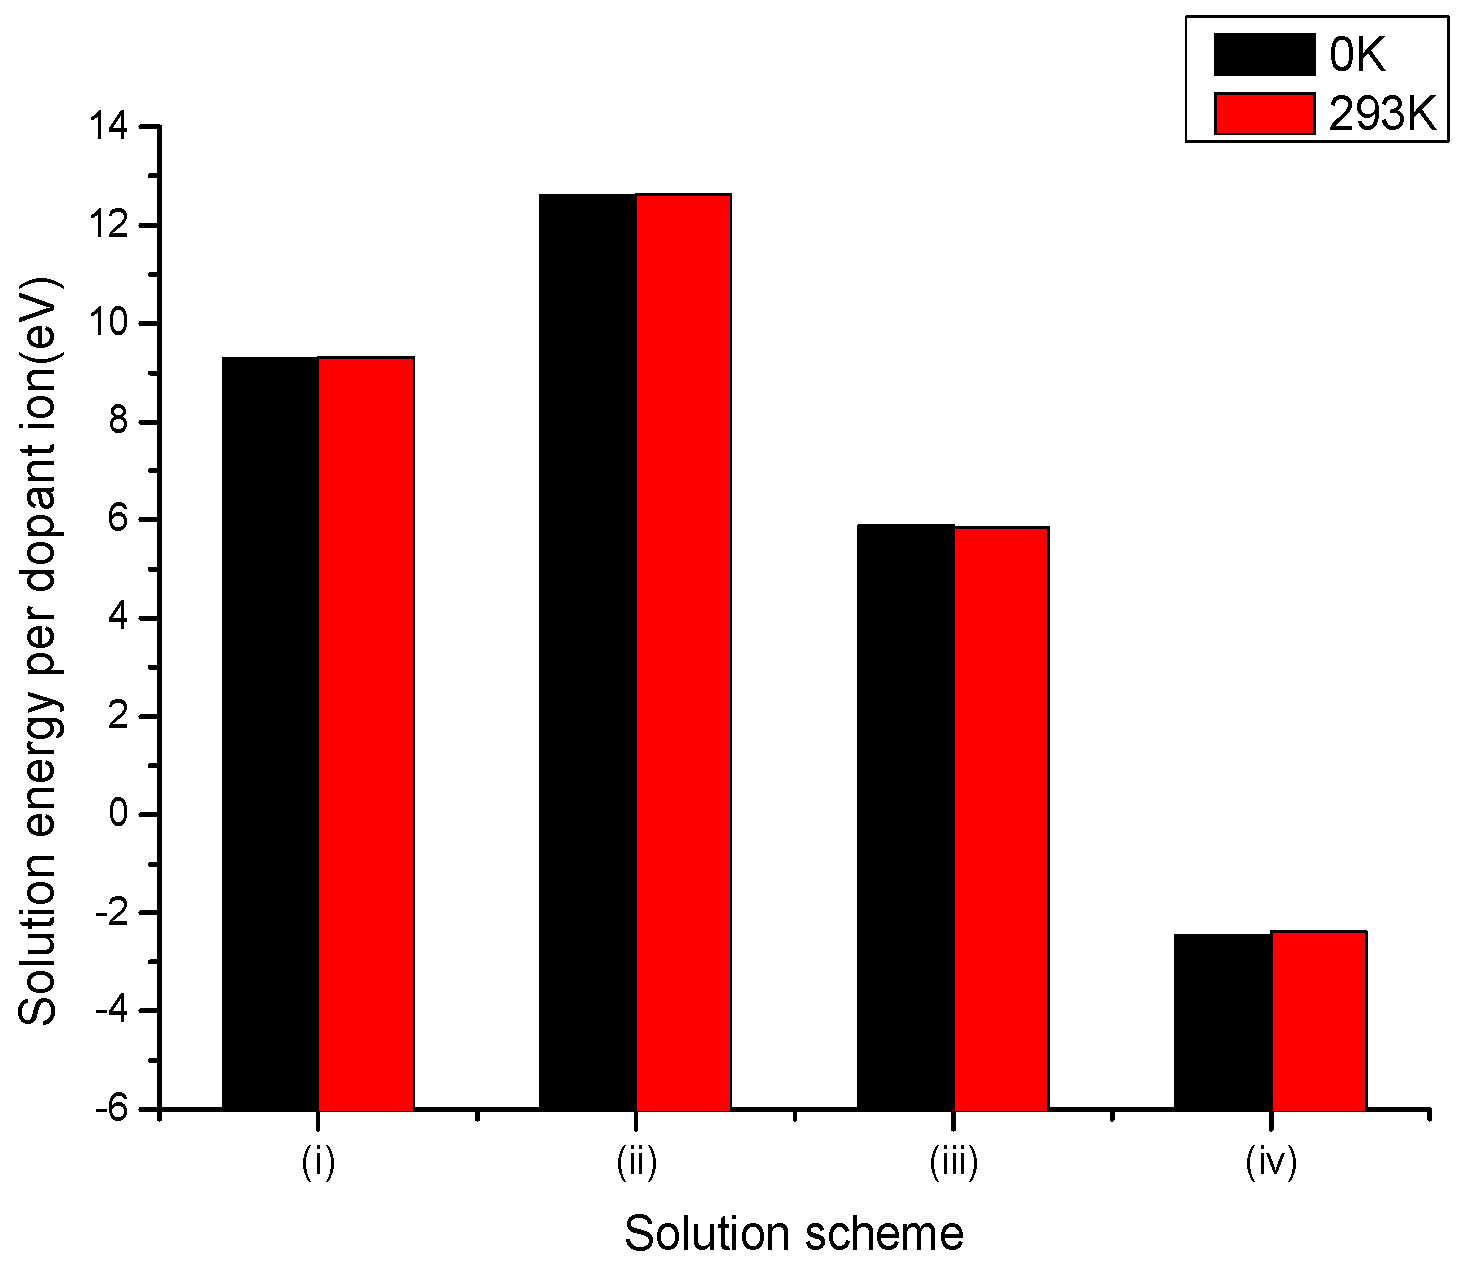
Funding

This research received no external funding.

Acknowledgments

The authors would like to thank the peer reviewers, whose detailed comments have undoubtedly led to major improvements to this paper.

Conflicts of Interest

The authors declare no conflict of interest.

References

  1. Mandula, G.; Rupp, R.A.; Balaskó, M.; Kovács, L. Decay of photorefractive gratings in LiNbO3:Fe by neutron irradiation. Appl. Phys. Lett. 2005, 86, 141107. [Google Scholar] [CrossRef]
  2. Ionita, I.; Jaque, F. Photoconductivity and electron mobility in LiNbO3 co-doped with Cr3+ and MgO. Opt. Mater. 1998, 10, 171–173. [Google Scholar] [CrossRef]
  3. Kaczmarec, S.M.; Bodziony, T. Low symmetry centers in LiNbO3 with Yb and Er. J. Non-Cryst. Solids 2008, 354, 4202–4210. [Google Scholar] [CrossRef]
  4. Kokanyan, E.P.; Razzari, L.; Cristiani, I.; Degiorgio, V.; Gruber, J.B. Reduced photorefraction in hafnium-doped single-domain and periodically poled lithium niobate crystals. Appl. Phys. Lett. 2004, 84, 1880. [Google Scholar] [CrossRef]
  5. Corradi, G.; Meyer, M.; Kovács, L.; Polgár, K. Gap levels of Ti3+ on Nb or Li sites in LiNbO3:(Mg):Ti crystals and their effect on charge transfer processes. Appl. Phys. B 2004, 78, 607–614. [Google Scholar] [CrossRef]
  6. Cantelar, E.; Quintanilla, M.; Pernas, P.L.; Torchia, G.A.; Lifante, G.; Cussó, F. Polarized emission and absorption cross-section calculation in LiNbO3:Tm3+. J. Lumin. 2008, 128, 988–991. [Google Scholar] [CrossRef]
  7. Shura, J.W.; Shina, T.I.; Leea, S.M.; Baekb, S.W.; Yoon, D.H. Photoluminescence properties of Nd: LiNbO3 co-doped with ZnO fiber single crystals grown by micro-pulling-down method. Mater. Sci. Eng. B 2003, 105, 16–19. [Google Scholar] [CrossRef]
  8. Li, S.; Liu, S.; Kong, Y.; Deng, D.; Gao, G.; Li, Y.; Gao, H.; Zhang, L.; Hang, Z.; Chen, S.; et al. The optical damage resistance and absorption spectra of LiNbO3:Hf crystals. J. Phys. Condens. Matter 2006, 18, 3527–3534. [Google Scholar] [CrossRef]
  9. Hesselink, L.; Orlov, S.S.; Liu, A.; Akella, A.; Lande, D.; Neurgaonkar, R.R. Photorefractive materials for nonvolatile volume holographic data storage. Science 1998, 282, 1089–1094. [Google Scholar] [CrossRef]
  10. Camarillo, E.; Murrieta, H.; Hernandez, J.M.; Zoilo, R.; Flores, M.C.; Han, T.P.J.; Jaque, F. Optical properties of LiNbO3:Cr crystals co-doped with germanium oxide. J. Lumin. 2008, 128, 747–750. [Google Scholar] [CrossRef]
  11. Luo, S.; Meng, Q.; Wang, J.; Sun, X. Effect of In3+ concentration on the photorefraction and scattering properties in In: Fe:Cu:LiNbO3 crystals at 532 nm wavelength. Opt. Commun. 2016, 358, 198–201. [Google Scholar] [CrossRef]
  12. Nie, Y.; Wang, R.; Wang, B. Growth and holographic storage properties of In:Ce:Cu:LiNbO3 crystal. Mater. Chem. Phys. 2007, 102, 281–283. [Google Scholar] [CrossRef]
  13. Zhen, X.H.; Li, H.T.; Sun, Z.J.; Ye, S.J.; Zhao, L.C.; Xu, Y.H. Holographic properties of double-doped Zn:Fe:LiNbO3 crystals. Mater. Lett. 2004, 58, 1000–1002. [Google Scholar] [CrossRef]
  14. Wei, Z.; Naidong, Z.; Qingquan, L. Growth and Holographic Storage Properties of Sc, Fe Co-Doped Lithium Niobate Crystals. J. Rare Earth 2007, 25, 775–778. [Google Scholar] [CrossRef]
  15. Xu, C.; Leng, X.; Xu, L.; Wen, A.; Xu, Y. Enhanced nonvolatile holographic properties in Zn, Ru and Fe co-doped LiNbO3 crystals. Opt. Commun. 2012, 285, 3868–3871. [Google Scholar] [CrossRef]
  16. Tian, T.; Kong, Y.; Liu, S.; Li, W.; Wu, L.; Chen, S.; Xu, J. The photorefraction of molybdenum-doped lithium niobate crystals. Opt. Lett. 2012, 37, 2679–2681. [Google Scholar] [CrossRef]
  17. Kong, Y.; Liu, S.; Xu, J. Recent Advances in the Photorefraction of Doped Lithium Niobate Crystals. Materials 2012, 5, 1954–1971. [Google Scholar] [CrossRef] [Green Version]
  18. Saeed, S.; Zheng, D.; Liu, H.; Xue, L.; Wang, W.; Zhu, L.; Hu, M.; Liu, S.; Chen, S.; Zhang, L.; et al. Rapid response of photorefraction in vanadium and magnesium co-doped lithium niobate. J. Phys. D Appl. Phys. 2019, 52, 405303. [Google Scholar] [CrossRef]
  19. Xue, L.; Liu, H.; Zheng, D.; Saeed, S.; Wang, X.; Tian, T.; Zhu, L.; Kong, Y.; Liu, S.; Chen, S.; et al. The Photorefractive Response of Zn and Mo Codoped LiNbO3 in the Visible Region. Crystals 2019, 9, 228. [Google Scholar] [CrossRef] [Green Version]
  20. Fan, Y.; Li, L.; Li, Y.; Sun, X.; Zhao, X. Hybrid density functional theory study of vanadium doping in stoichiometric and congruent LiNbO3. Phys. Rev. B 2019, 99, 035147. [Google Scholar] [CrossRef]
  21. Wang, W.; Liu, H.; Zheng, D.; Kong, Y.; Zhang, L.; Xu, J. Interaction between Mo and intrinsic or extrinsic defects of Mo doped LiNbO3 from first-principles calculations. J. Phys. Condens. Matter 2020, 32, 255701. [Google Scholar] [CrossRef] [PubMed] [Green Version]
  22. Jackson, R.A.; Valerio, M.E.G. A new interatomic potential for the ferroelectric and paraelectric phases of LiNbO3. J. Phys. Condens. Matter 2005, 17, 837. [Google Scholar] [CrossRef]
  23. Araujo, R.M.; Lengyel, K.; Jackson, R.A.; Valerio, M.E.G.; Kovacs, L. Computer modelling of intrinsic and substitutional defects in LiNbO3. Phys. Status Solidi 2007, 4, 1201–1204.22. [Google Scholar] [CrossRef]
  24. Araujo, R.M.; Lengyel, K.; Jackson, R.A.; Kovacs, L.; Valerio, M.E.G. A computational study of intrinsic and extrinsic defects in LiNbO3. J. Phys. Condens. Matter 2007, 19, 046211. [Google Scholar] [CrossRef]
  25. Araujo, R.M.; Valerio, M.E.G.; Jackson, R.A. Computer modelling of trivalent metal dopants in lithium niobite. J. Phys. Condens. Matter 2008, 20, 035201. [Google Scholar] [CrossRef]
  26. Araujo, R.M.; Valerio, M.E.G.; Jackson, R.A. Computer simulation of metal co-doping in lithium niobate. Proc. R. Soc. A 2014, 470, 0406. [Google Scholar] [CrossRef]
  27. Araujo, R.M.; Valerio, M.E.G.; Jackson, R.A. Computer Modelling of Hafnium Doping in Lithium Niobate. Crystals 2018, 8, 123. [Google Scholar] [CrossRef] [Green Version]
  28. Mott, N.F.; Littleton, M.J. Conduction in polar crystals. Electrolytic conduction in solid salts. Trans. Faraday Soc. 1938, 34, 485–499. [Google Scholar] [CrossRef]
  29. Sanders, M.J.; Leslie, M.; Catlow, C.R.A. Interatomic potentials for SiO2. J. Chem. Soc. Chem. Commun. 1984, 1271–1273. [Google Scholar] [CrossRef]
  30. Dick, B.J.; Overhauser, A.W. Theory of the dielectric constants of alkali halide crystals. Phys. Rev. 1958, 112, 90. [Google Scholar] [CrossRef]
  31. Taylor, D. Thermal expansion data. I: Binary oxides with the sodium chloride and wurtzite structures, MO. Trans. J. Br. Ceram. Soc. 1984, 83, 5–9. [Google Scholar]
  32. Luedtke, T.; Weber, D.; Schmidt, A.; Mueller, A.; Reimann, C.; Becker, N.; Bredow, T.; Dronskowski, R.; Ressler, T.; Lerch, M. Synthesis and characterization of metastable transition metal oxides and oxide nitrides. Z. Fuer Krist. Cryst. Mater. 2017, 232, 3–14. [Google Scholar] [CrossRef] [Green Version]
  33. McWhan, D.B.; Marezio, M.; Remeika, J.P.; Dernier, P.D. X-ray diffraction study of metallic VO2. Phys. Rev. B Solid State 1974, 10, 490–495. [Google Scholar] [CrossRef]
  34. Balog, P.; Orosel, D.; Cancarevic, Z.; Schoen, C.; Jansen, M. V2O5 phase diagram revisited at high pressures and high temperatures. J. Alloy. Compd. 2007, 429, 87–98. [Google Scholar] [CrossRef]
  35. Aleandri, L.E.; McCarley, R.E. Hexagonal lithium molybdate, LiMoO2: A close-packed layered structure with infinite molybdenum-molybdenum-bonded sheets. Inorg. Chem. 1988, 27, 1041–1044. [Google Scholar] [CrossRef]
  36. Hibble, S.J.; Fawcett, I.D.; Hannon, A.C. Structure of Two Disordered Molybdates, Li2MoIVO3 and Li4Mo3IVO8, from Total Neutron Scattering. Acta Crystallogr. Sect. B Struct. Sci. 1997, 53, 604–612. [Google Scholar] [CrossRef]
  37. Mikhailova, D.; Voss, A.; Oswald, S.; Tsirlin, A.A.; Schmidt, M.; Senyshyn, A.; Eckert, J.; Ehrenberg, H. Lithium Insertion into Li2MoO4: Reversible Formation of (Li3Mo)O4 with a Disordered Rock-Salt Structure. Chem. Mater. 2015, 27, 4485–4492. [Google Scholar] [CrossRef]
  38. Kolitsch, U. The crystal structures of phenacite-type Li2(MoO4), and scheelite-type LiY(MoO4)2 and LiNd(MoO4)2. Z. Fuer Krist. 2001, 216, 449–454. [Google Scholar] [CrossRef]
  39. Kröger, F.A.; Vink, H.J. The origin of the fluorescence in self-activated ZnS, CdS, and ZnO. J. Chem. Phys. 1954, 22, 250. [Google Scholar] [CrossRef]
  40. Shannon, R.D.; Prewitt, C.T. Revised values of effective ionic radii. Acta Crystallogr. Sect. B Struct. Crystallogr. Cryst. Chem. 1969, 26, 1046–1048. [Google Scholar] [CrossRef]
  41. Zhu, L.; Zheng, D.; Saeed, S.; Wang, S.; Liu, H.; Kong, Y.; Liu, S.; Chen, S.; Zhang, L.; Xu, J. Photorefractive Properties of Molybdenum and Hafnium Co-Doped LiNbO3. Crystals 2018, 8, 322. [Google Scholar] [CrossRef] [Green Version]
Figure 1. Bar chart of solution energies vs. solution schemes for divalent dopant (V2+) at the Li and Nb sites, considering the first neighbours in relation to the c axis.
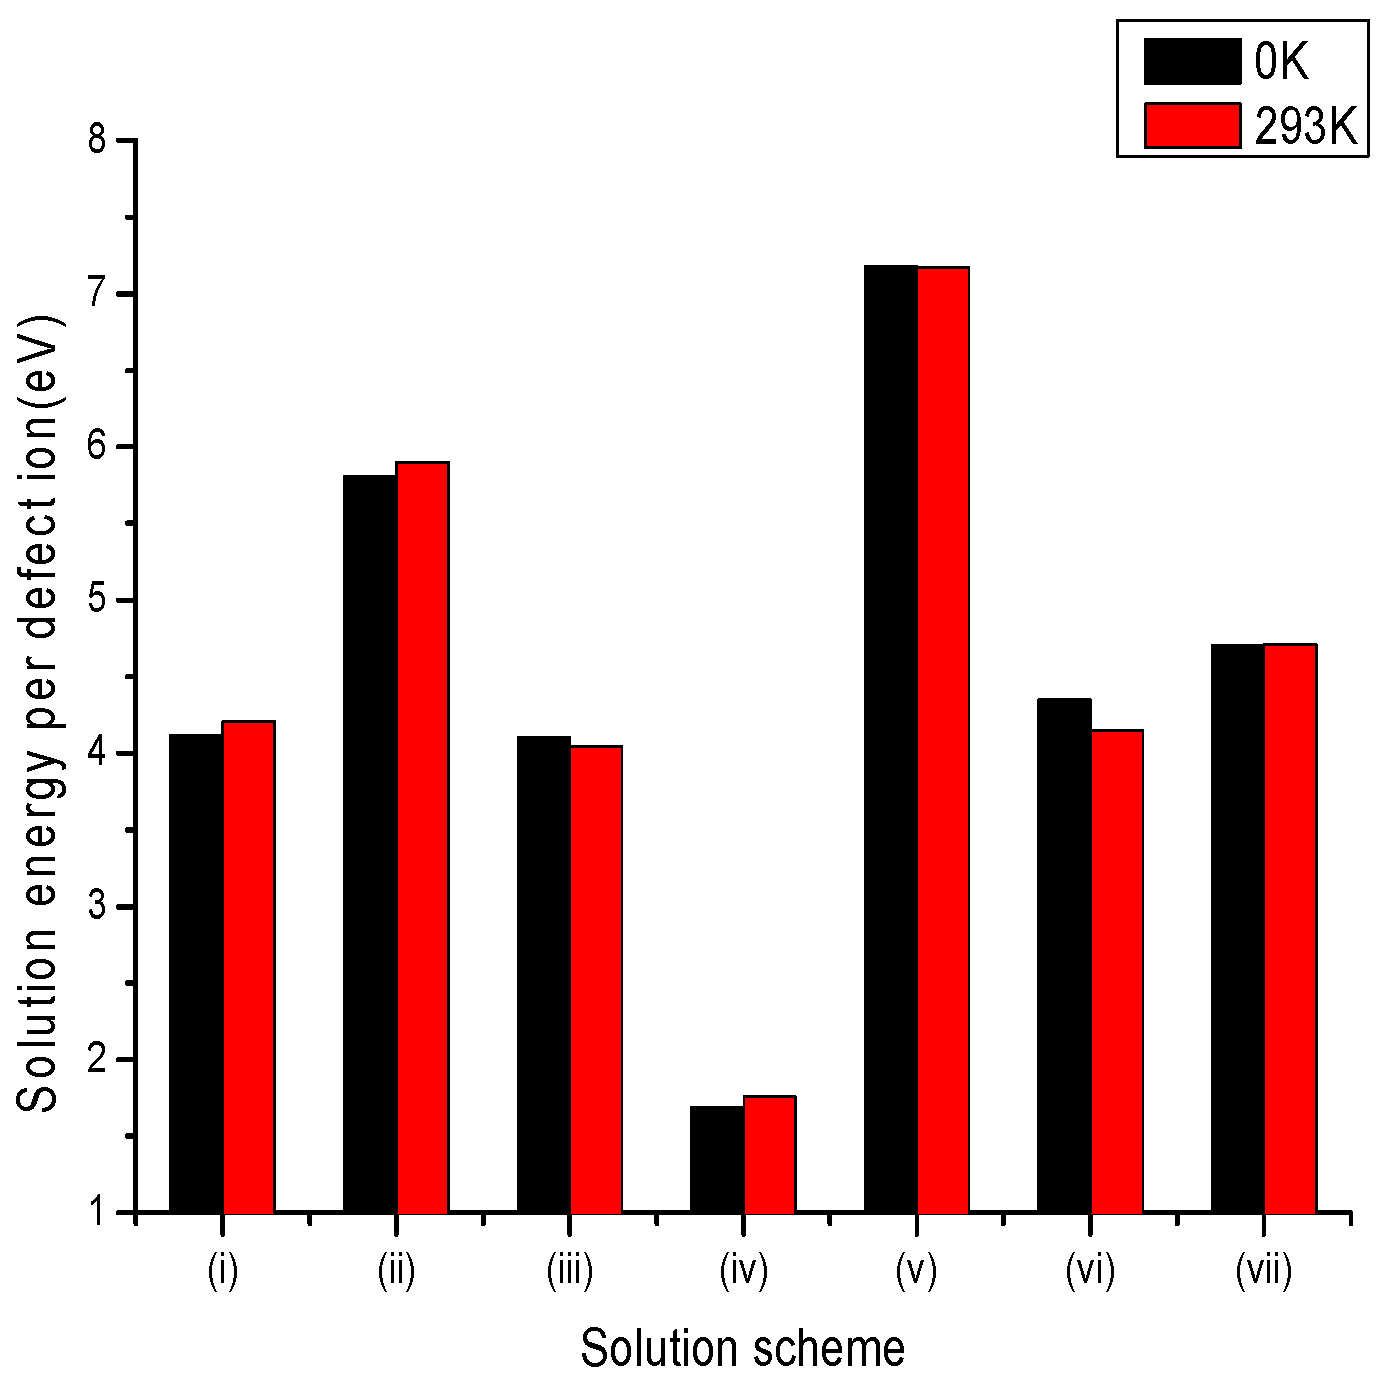
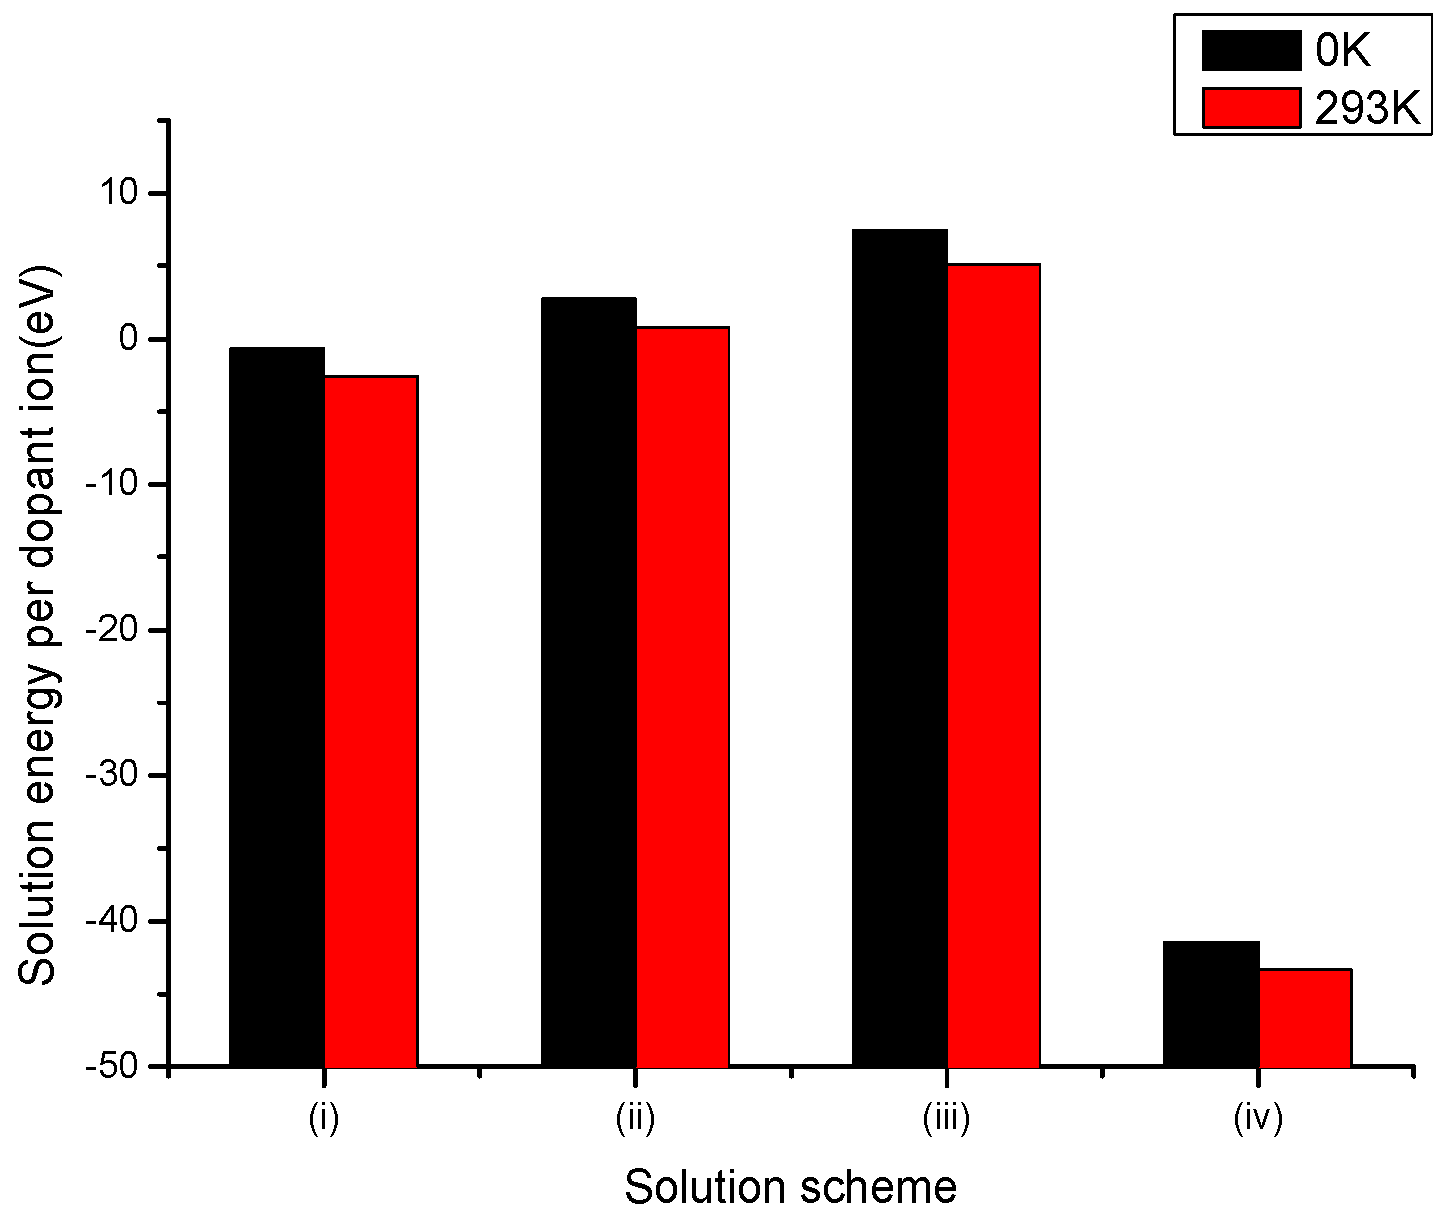
Crystals 10 00457 g001
Figure 2. Bar chart of solution energies vs. solution schemes for trivalent dopant (V3+) at the Li and Nb sites, considering the first neighbours in relation to the c axis.
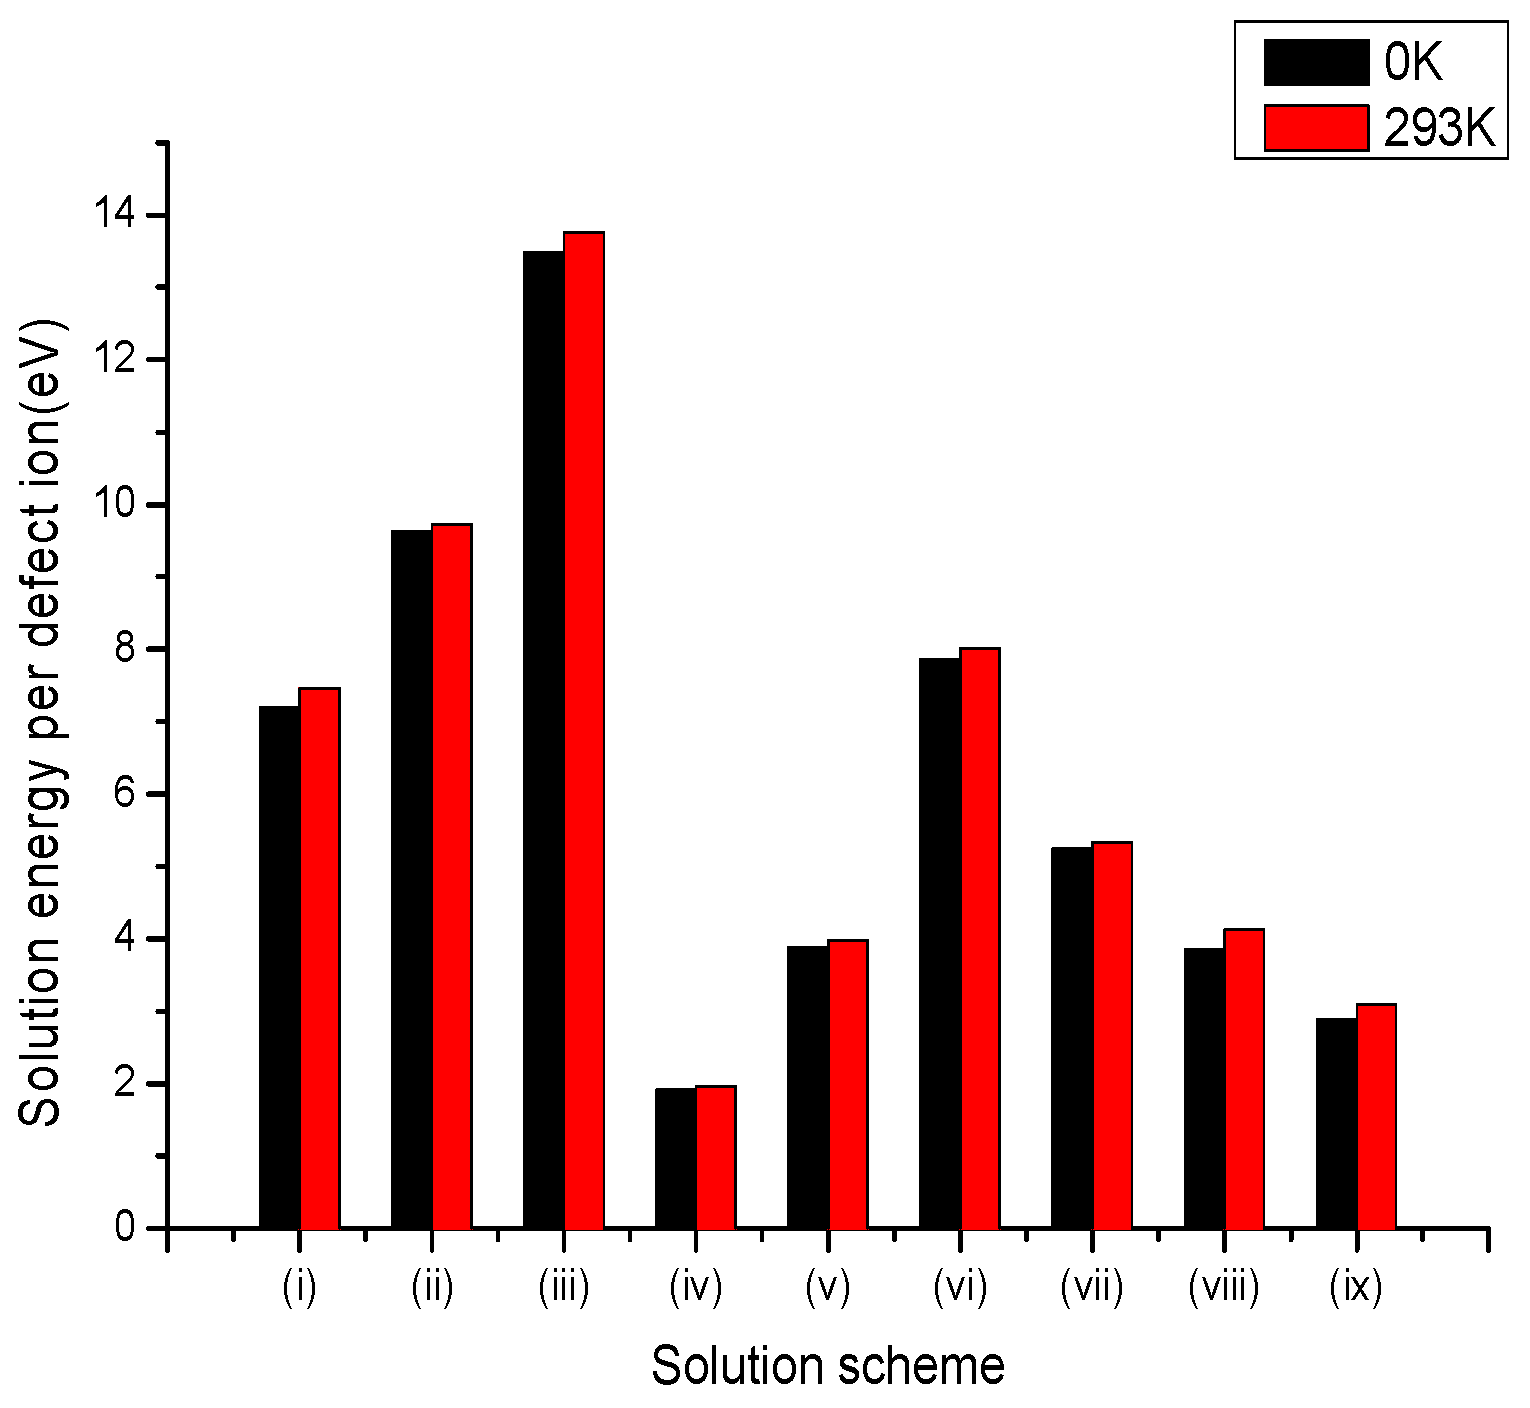
Crystals 10 00457 g002
Figure 3. Bar chart of solution energies vs. solution schemes for trivalent dopant (Mo3+) at the Li and Nb sites, considering the first neighbours in relation to the c axis.
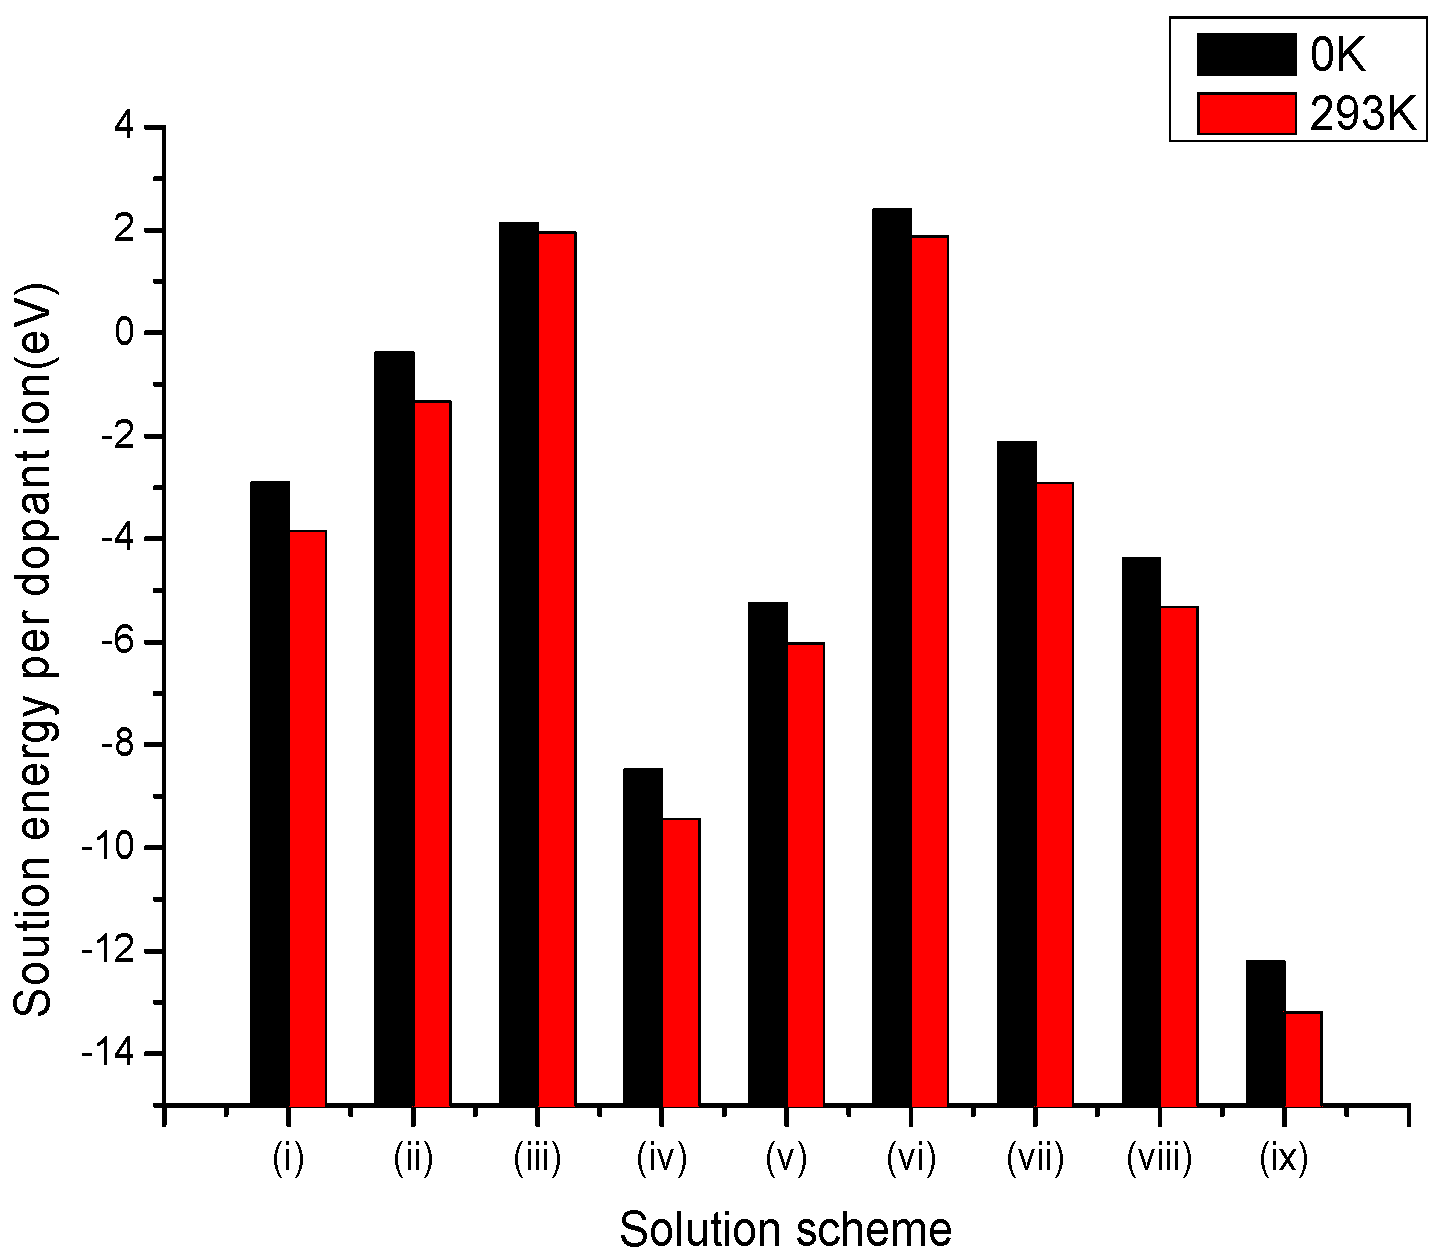
Crystals 10 00457 g003
Figure 4. Bar chart of solution energies vs. solution schemes for tetravalent dopant (V4+) at the Li and Nb sites, considering the first neighbours in relation to the c axis.
Crystals 10 00457 g004
Figure 5. Bar chart of solution energies vs. solution schemes for tetravalent dopant (Mo4+) at the Li and Nb sites, considering the first neighbours in relation to the c axis.
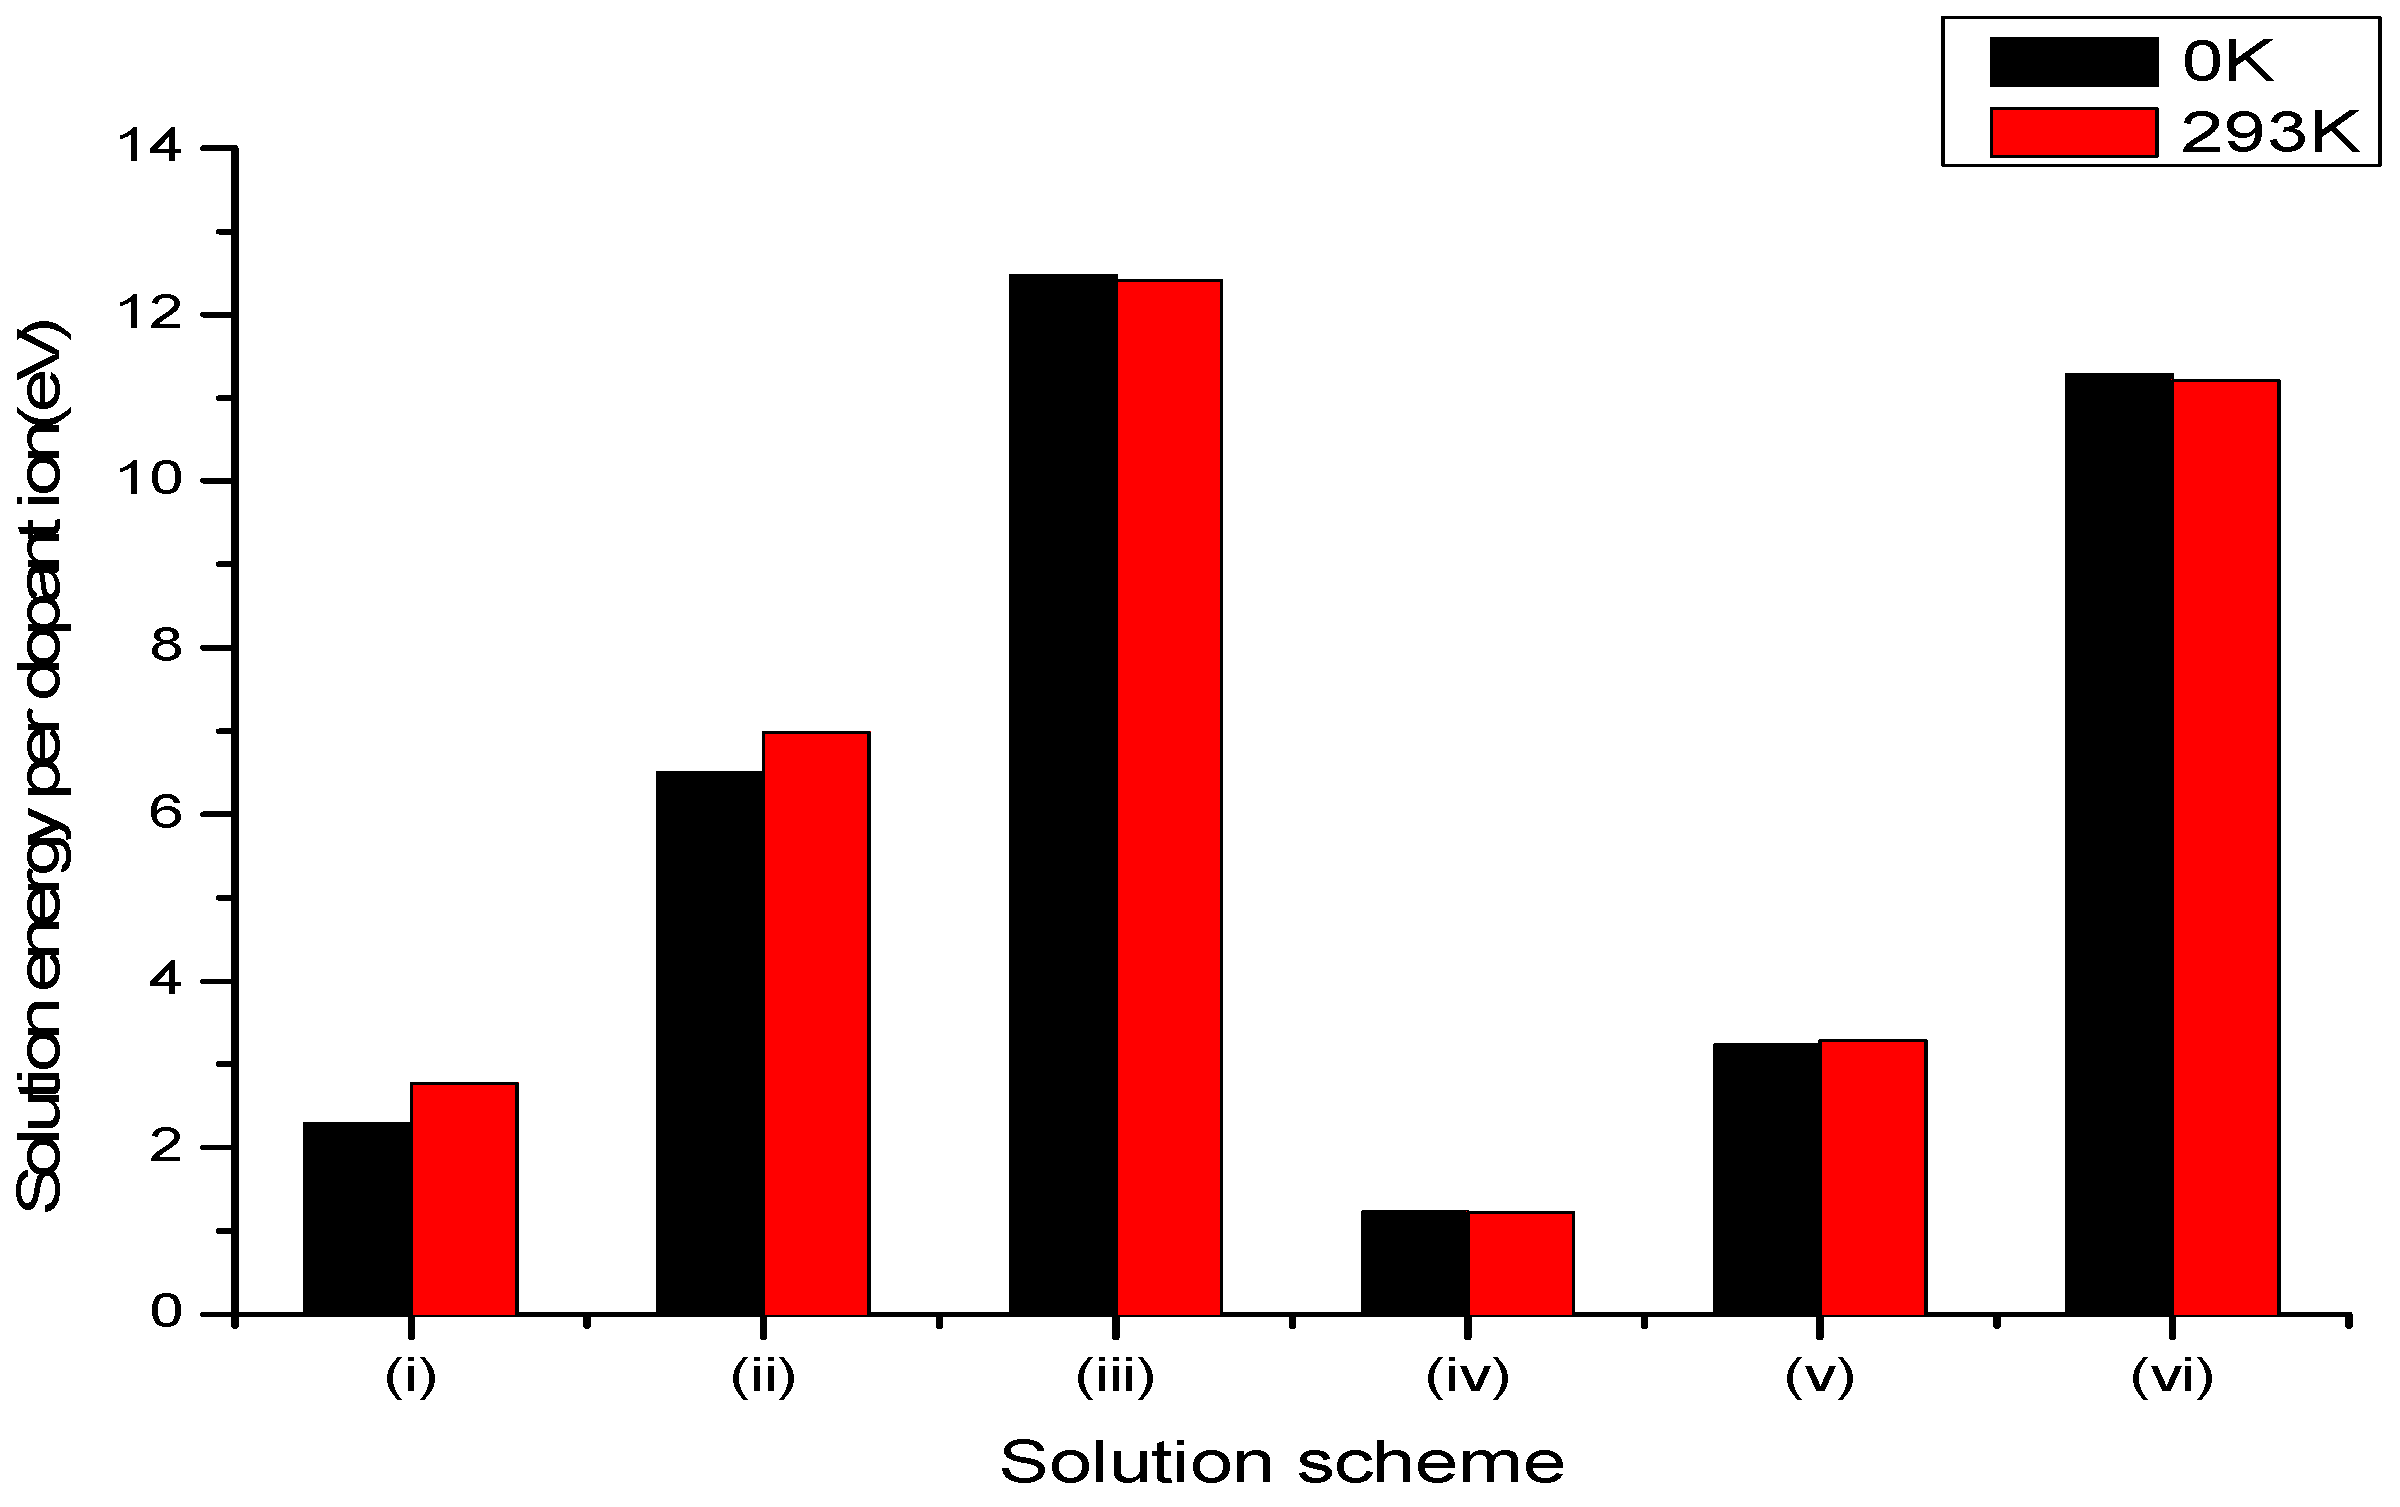
Crystals 10 00457 g005
Figure 6. Bar chart of solution energies vs. solution schemes for pentavalent dopant (V5+) at the Li and Nb sites, considering the first neighbours in relation to the c axis.
Crystals 10 00457 g006
Figure 7. Bar chart of solution energies vs. solution schemes for pentavalent dopant (Mo5+) at the Li and Nb sites, considering the first neighbours in relation to the c axis.
Crystals 10 00457 g007
Figure 8. Bar chart of solution energies vs. solution schemes for hexavalent dopant (Mo6+) at the Li and Nb sites, considering the first neighbours in relation to the c axis.
Crystals 10 00457 g008
Table 1. Interionic potentials obtained from a fit to the VO, V2O3, VO2, V2O5, LiMoO2, Li2MoO3, Li3MoO4 and Li2MoO4 structures.
InteractionAij(eV)ρij(Å)Cij6 eV)
Licore-Oshell950.00.26100.0
Vcore-Oshell293.2400870.4751810.0
Mocore-Licore573.5323250.3696020.0
Mocore-O2−shell3003.790.34740.0
Mocore-Ocore600.2637360.3285580.0
O2−shell-O2−shell22764.00.149027.88
Harmonick(eV Å2)ro(Å)
Vcore-Ocore46.9978331.942956
Mocore-Ocore385.6389862.073074
Species Y(e)
Mocore 3.0 4.0 5.0 6.0
Vcore 2.0 3.0 4.0 5.0
Ocore 0.9
Oshell −2.9
Spring k(Å−2 eV)
Ocore-Ooore 70.0
Table 2. Comparison of calculated (calc.) and experimental (expt.) lattice parameters.
OxideLattice ParameterExp.Calc. (0 K)Δ%Calc. (293 K)Δ%
VOa(Å) = b(Å) = c(Å)4.0678004.1082370.994.106830.98
V2O3a(Å) = b(Å) = c(Å)9.3930009.3047570.909.3463310.94
VO2a (Å) = b(Å)4.5561004.5694830.204.5662120.22
c(Å)2.8598002.8664210.232.8578610.07
V2O5a(Å)11.97190011.996520.2012.012470.33
b(Å)4.7017004.7225610.444.6603430.88
c(Å)5.3253005.3556710.575.3711490.86
Lithium MolybdatesLattice ParameterExp.Calc. (0 K)Δ%Calc. (293 K)Δ%
LiMoO2a(Å) = b(Å)2.8663002.8805280.502.8872460.73
c(Å)15.47430015.4093900.4215.5950240.78
Li2MoO3a(Å) = b(Å)2.8780002.8544430.822.8598090.63
c(Å)14.9119015.0028860.6115.046320.90
Li3MoO4a(Å) = b(Å) = c(Å)4.13894.1077620.754.1069410.77
Li2MoO4a(Å) = b(Å)14.33000014.3013050.2014.3845010.38
c(Å)9.5849.4920670.969.6324130.96
Table 3. Types of defects considered due to M = V2+ incorporation in LiNbO3.
SiteCharge CompensationReaction
Li+Lithium Vacancies(i) MO + 2   Li Li     M Li + V Li + Li 2 O
Niobium Vacancies(ii) 5 MO + 5 Li Li + Nb Nb 5 M Li + V Nb + 2.5 Li 2 O + 0.5 Nb 2 O 5
Oxygen Interstitial(iii) 2 MO + 2 Li Li 2 M Li + O i + Li 2 O
Li+ and Nb5+Self-Compensation(iv) 4 MO + 3   Li Li + Nb Nb     3 M Li + M Nb +   1.5 Li 2 O + 0.5   Nb 2 O 5
Nb5+Lithium Vacancies
and Anti-site ( Nb Li )
(v) MO + 2 Li Li + Nb Nb     M Nb + V Li +   Nb Li + Li 2 O
Anti-site ( Nb Li )(vi) 4 MO + 3 Li Li + 4 Nb Nb   4 M Nb + 3 Nb Li + Li 2 O + LiNbO 3
(vii) 4 MO + 3 Li Li + 4 Nb Nb 4 M Nb + 3 Nb Li + 1.5 Li 2 O + 0.5 Nb 2 O 5
Oxygen Vacancies(viii) 2 MO + 2 Nb Nb + 3 O O   2 M Nb + 3 V O + Nb 2 O 5
Table 4. Types of defects considered due to V3+ incorporation in LiNbO3.
SiteCharge CompensationReaction
Li+Lithium Vacancies(i) 0.5 M 2 O 3 + 3 Li Li   M Li + 2 V Li + 1.5 Li 2 O
Niobium Vacancies(ii) 2.5 M 2 O 3 + 5 Li Li + 2 Nb Nb     5 M Li + 2 V Nb + 2.5 Li 2 O + Nb 2 O 5
Oxygen Interstitial(iii) 0.5 M 2 O 3 + Li Li     M Li + O i + 0.5 Li 2 O
Li+ and Nb5+Self-Compensation(iv) M 2 O 3 + Li Li + Nb Nb     M Li + M Nb +   0.5 Li 2 O + 0.5   Nb 2 O 5
Nb5+Oxygen Vacancies(v) 0.5 M 2 O 3 + Nb Nb + O O   M Nb + V O + 0.5 Nb 2 O 5
Anti-site ( Nb Li )(vi) M 2 O 3 + Li Li + 2 Nb Nb     2 M Nb + Nb Li + LiNbO 3
Lithium Vacancies and Anti-site ( Nb Li )(vii) 0.5 M 2 O 3 + 3 Li Li + Nb Nb   M Nb +   2 V Li + Nb Li + 1.5 Li 2 O
Table 5. Types of defects considered due to Mo3+ incorporation in LiNbO3.
SiteCharge CompensationReaction
Li+Lithium Vacancies(i) LiMoO 2 + 3 Li Li     Mo Li + 2 V Li + 2 Li 2 O
Niobium Vacancies(ii) 5 LiMoO 2 + 5 Li Li + 2 Nb Nb   5 Mo Li + 2 V Nb + 5 Li 2 O + Nb 2 O 5
Oxygen Interstitial(iii) LiMoO 2 + Li Li   Mo Li + O i + Li 2 O
Li+ and Nb5+Self-Compensation(iv) 2 LiMoO 2 + 2 Li Li + Nb Nb   Mo Li + Mo Nb + 1.5 Li 2 O + 0.5 Nb 2 O 5
Nb5+Oxygen Vacancies(v) LiMoO 2 + Nb Nb +   O O Mo Nb + V O + 0.5 Li 2 O + 0.5 Nb 2 O 5
Nb5+Anti-site ( Nb Li )(vi) 2 LiMoO 2 + Li Li + 2 Nb Nb 2 Mo Nb + Nb Li + 1.5 Li 2 O + 0.5 Nb 2 O 5
Nb5+Lithium Vacancies and Anti-site ( Nb Li )(vii) LiMoO 2 + 3 Li Li + Nb Nb   Mo Nb + 2 V Li + Nb Li + 2 Li 2 O
Table 6. Types of defects considered due to M = V4+ incorporation in LiNbO3.
SiteCharge CompensationReaction
Li+Lithium Vacancies(i) MO 2 + 4 Li Li M Li + 3 V Li +   2 Li 2 O
Niobium Vacancies(ii) 5 MO 2 + 5 Li Li + 3 Nb Nb 5 M Li + 3 V Nb +   2.5 Li 2 O + 1.5 Nb 2 O 5
Oxygen Interstitial(iii) 2 MO 2 + 2 Li Li     2 M Li + 3 O i + Li 2 O
Li+ and Nb5+Self-Compensation(iv) 4 MO 2 + Li Li + 3 Nb Nb     M Li + 3 M Nb +   0.5 Li 2 O + 1.5   Nb 2 O 5
Nb5+Anti-site ( Nb Li )(v) 4 MO 2 + Li Li + 4 Nb Nb     4 M Nb + Nb Li + 0.5 Li 2 O + 1.5 Nb 2 O 5
Lithium Vacancies and Anti-site ( Nb Li )(vi) MO 2 + 4 Li Li + Nb Nb     M Nb + 3 V Li + Nb Li +   2 Li 2 O
(vii) 2 MO 2 + 3 Li Li + 2 Nb Nb 2 M Nb + 2 V Li + Nb Li + Li 2 O + LiNbO 3
(viii) 3 MO 2 + 2 Li Li + 3 Nb Nb 3 M Nb + V Li + Nb Li + LiNbO 3
Oxygen Vacancies(ix) 2 MO 2 + 2 Nb Nb + O O   2 M Nb + V O + Nb 2 O 5
Table 7. Types of defects considered due to M=Mo4+ incorporation in LiNbO3.
SiteCharge CompensationReaction
Li+Lithium Vacancies(i) Li 2 MoO 3 + 4 Li Li Mo Li + 3 V Li +   3 Li 2 O
Niobium Vacancies(ii) 5 Li 2 MoO 3 + 5 Li Li + 3 Nb Nb 5 Mo Li + 3 V Nb +   7.5 Li 2 O + 1.5 Nb 2 O 5
Oxygen Interstitial(iii) 2 Li 2 MoO 3 + 2 Li Li     2 Mo Li + 3 O i + 3 Li 2 O
Li+ and Nb5+Self-Compensation(iv) 4 Li 2 MoO 3 + Li Li + 3 Nb Nb     Mo Li + 3 Mo Nb +   4.5 Li 2 O + 1.5   Nb 2 O 5
Nb5+Anti-site ( Nb Li )(v) 4 Li 2 MoO 3 + Li Li + 4 Nb Nb     4 Mo Nb + Nb Li + 4.5 Li 2 O + 1.5 Nb 2 O 5
Lithium Vacancies
and Anti-site ( Nb Li )
(vi) Li 2 MoO 3 + 4 Li Li + Nb Nb     Mo Nb + 3 V Li + Nb Li +   3 Li 2 O
(vii) 2 Li 2 MoO 3 + 3 Li Li + 2 Nb Nb 2 Mo Nb + Nb Li + 2 V Li + 3 Li 2 O + LiNbO 3
(viii) 3 Li 2 MoO 3 + 2 Li Li + 3 Nb Nb 3 Mo Nb + Nb Li + V Li + 3 Li 2 O + 2 LiNbO 3
Oxygen Vacancies(ix) 2 Li 2 MoO 3 + 2 Nb Nb + O O   2 Mo Nb + V O + 2 Li 2 o + Nb 2 O 5
Table 8. Types of defects considered due to M = V5+ incorporation in LiNbO3.
SiteCharge CompensationReaction
Li+Lithium Vacancies(i) 0.5 M 2 O 5 + 5 Li Li M Li + 4 V Li +   2.5 Li 2 O
Niobium Vacancies(ii) 2.5 M 2 O 5 + 5 Li Li + 5 Nb Nb 5 M Li + 4 V Nb +   2.5 Li 2 O + 2 Nb 2 O 5
Oxygen Interstitial(iii) 0.5 M 2 O 5 + Li Li     M Li + 2 O i + 0.5 Li 2 O
Nb5+No Charge
Compensation
(iv) 0.5 M 2 O 5 + Nb Nb   M Nb + 0.5 Nb 2 O 5
Table 9. Types of defects considered due to Mo5+ incorporation in LiNbO3.
SiteCharge CompensationReaction
Li+Lithium Vacancies(i) Li 3 MoO 4 + 5 Li Li Mo Li + 4 V Li +   4 Li 2 O
Niobium Vacancies(ii) 5 Li 3 MoO 4 + 5 Li Li + 4 Nb Nb 5 Mo Li + 4 V Nb +   10 Li 2 O + 2 Nb 2 O 5
Oxygen Interstitial(iii) Li 3 MoO 4 + Li Li     Mo Li + 2 O i + 2 Li 2 O
Nb5+No Charge
Compensation
(iv) Li 3 MoO 4 + Nb Nb     Mo Nb + 1.5 Li 2 O + 0.5 Nb 2 O 5
Table 10. Types of defects considered due to Mo6+ incorporation in LiNbO3.
SiteCharge CompensationReaction
Li+Lithium Vacancies(i) Li 2 MoO 4 + 6 Li Li     Mo Li + 5 V Li + 4 Li 2 O
Niobium Vacancies(ii) Li 2 MoO 4 + Li Li + Nb Nb Mo Li + V Nb + 1.5 Li 2 O + 0.5 Nb 2 O 5
Oxygen Interstitial(iii) 2 Li 2 MoO 4 + 2 Li Li 2 Mo Li + 5 O i + 3 Li 2 O  
Nb5+Lithium Vacancies(iv) Li 2 MoO 4 + Li Li + Nb Nb     Mo Nb + V Li + 1.5 Li 2 O + 0.5 Nb 2 O 5
Niobium Vacancies(v) 5 Li 2 MoO 4 + 6 Nb Nb 5 Mo Nb + V Nb + 5 Li 2 O + 3 Nb 2 O 5
Oxygen Interstitial(vi) 2 Li 2 MoO 4 + 2 Nb Nb 2 Mo Nb + O i + 2 Li 2 O + Nb 2 O 5
Table 11. Lattice energies used in the solution energy calculations (eV).
CompoundLattice EnergyLattice Energy
0 K293 K
LiNbO3−174.45−174.66
Li2O−33.16−32.92
Nb2O5−314.37−313.39
VO−22.06−22.07
V2O3−124.37−124.39
VO2−111.54−111.57
V2O5−315.65−274.18
LiMoO2−98.07−97.09
Li2MoO3−150.38−149.10
Li3MoO4−181.28−178.88
Li2MoO4−234.06−234.12

