Article

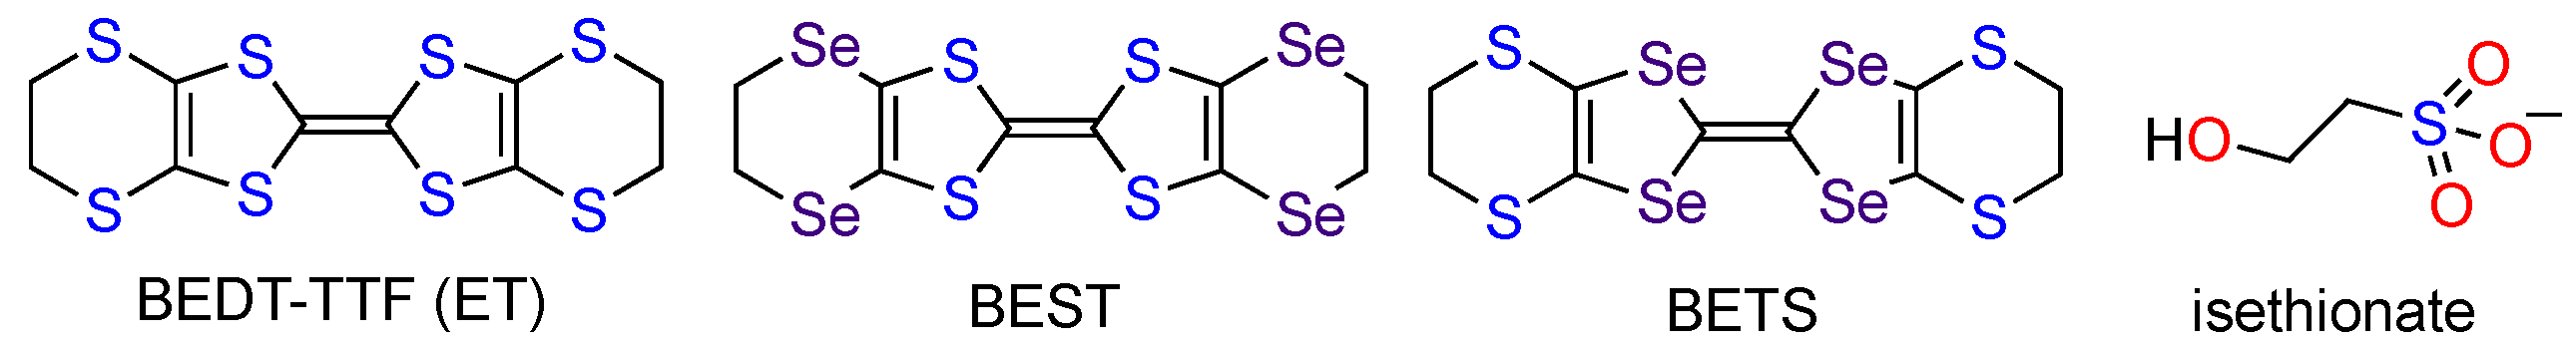
Structures and Properties of New Organic Conductors: BEDT-TTF, BEST and BETS Salts of the HOC2H4SO3 Anion

1
Department of Chemistry, Graduate School of Science, Osaka University, 1-1 Machikaneyama, Toyonaka, Osaka 560-0043, Japan
2
Department of Chemistry, University of Surrey, Guildford, Surrey GU2 7XH, UK
3
Department of Environment and System Sciences, Yokohama National University, 79-7 Tokiwadai, Hodogaya-ku, Yokohama 240-8501, Japan
*
Author to whom correspondence should be addressed.
Submission received: 11 August 2020 / Revised: 25 August 2020 / Accepted: 28 August 2020 / Published: 1 September 2020
(This article belongs to the Special Issue Organic Conductors)

Abstract

:
New bis(ethylenedithio)tetrathiafulvalene (BEDT-TTF)-, bis(ethylenediseleno)tetrathiafulvalene (BEST)- and bis(ethylenedithio)tetraselenafulvalene (BETS)-based organic charge-transfer (CT) salts—α-(BEDT-TTF)3(HOC2H4SO3)2 (1), β-(BEST)3(HOC2H4SO3)2·H2O (2) and α-(BETS)2(HOC2H4SO3)·H2O (3)—have been prepared. Salts 1 and 2 show semiconducting behaviour. Salt 3, which is almost isostructural to α-(BETS)2I3, shows metallic behaviour down to 70 K and then shows a broader metal–insulator transition than that of α-(BETS)2I3. The reason for the difference in behaviour is estimated by the comparison of the Madelung energies of the full set of patterns of possible donor’s charge-ordered and anion’s disordered states.

1. Introduction

Organic conductors have been synthesized by chemists [1,2] and their physical properties have been measured by physicists [3,4] for some time now. Chemists still now prepare many new types of organic conductors with novel structures and molecular features [5]. However, most physicists tend to continue to measure “old-fashioned” organic (super)conductors [3,4]. For example, popular salts are κ-(BEDT-TTF)2Cu(NCS)2 [6], where BEDT-TTF is bis(ethylenedithio)tetrathiafulvalene; κ-(BEDT-TTF)2Cu[N(CN)2]X (X = Cl, Br) [7,8]; θ-(BEDT-TTF)2[MM′(SCN)4] (M = Cs, Rb, Tl; M′ = Zn, Co) [9]; α-(BEDT-TTF)2[AHg(SCN)4] (A = K, NH4) [10,11]; α-(D)2I3 (D = BEDT-TTF [12]; BETS [13], where BETS = bis(ethylenedithio)tetraselenafulvalene); and (TMTSF)2X (X = PF6, AsF6, ClO4, etc., where TMTSF = tetramethyltetrathiafulvalene) [14]. Most of these examples were first made for more than a quarter of a century ago. This may be because organic conductors prepared recently have had more complicated molecular and/or crystal structures, which are definitely interesting for chemists. However, more complication often implies bulkier molecules, which usually leads to poor conductivity. This might prevent physicists from making the measurements because of the difficulty of finding physical properties in which many physicists are interested. In this circumstance, chemists preparing simple organic conductors might be of interest, especially for physicists. Here, we report the BEDT-TTF, BEST (=bis(ethylenediseleno)tetrathiafulvalene) and BETS salts (Scheme 1) of a simple organic anion, isethionate (HOC2H4SO3), the structures and properties of which are reported.

2. Materials and Methods

Electrical resistivity measurements were performed by the conventional four-probe method using a HUSO HECS 994C1 four channel resistivity meter with cooling and heating rates of ≈ 0.5 K/min. The magnetic susceptibilities of polycrystalline samples of the BETS salt (3) were measured from 2 to 300 K using a Quantum Design MPMS-2S SQUID magnetometer. The data were corrected for a contribution from the sample holder (aluminum foil), and the sample’s diamagnetic contribution was estimated from Pascal’s constants. X-ray diffraction data were collected with a Rigaku Rapid II imaging plate system with a MicroMax-007 HF/VariMax rotating-anode X-ray generator with confocally monochromatic MoKα radiation.
BEDT-TTF and isethionic acid sodium salt (HOC2H4SO3Na) were purchased from Tokyo Chemical Industry and Kanto Chemical, respectively, and used without any further purification. BEST and BETS were prepared according to the literature methods [15,16,17]. The electrocrystallisation of BEDT-TTF, BEST and BETS with HOC2H4SO3Na and 18-crown-6 ether in PhCl + 10% of EtOH produced black crystals.
The electronic states of the cationic and neutral donors and anions of 3 were calculated using the GAMESS software package [18] at the BY3LP 6-31G* level (SBKJC core potentials for iodine) using geometries determined by the X-ray analyses. All GAMESS input options used in these calculations are shown in Supporting Information. The input files were prepared using Facio [19,20]. Population analyses were performed using the Multiwfn software package (version 3.6, Beijing Kein Research Center for Natural Science, Beijing, China) [21], which calculated Hirshfeld populations from the output files of GAMESS. The resultant point charges of all the atoms of each molecule were used for Madelung energy calculations, which were performed with the Gulp program package [22] version 5.1, with a “molecule” option to restrict the calculations to only intermolecular Coulombic repulsions; namely, the effect of intramolecular repulsions was excluded.

3. Results

Table 1 shows the crystallographic data of α-(BEDT-TTF)3(HOC2H4SO3)2 (1), β-(BEST)3(HOC2H4SO3)2·H2O (2) and α-(BETS)2(HOC2H4SO3)·H2O (3).

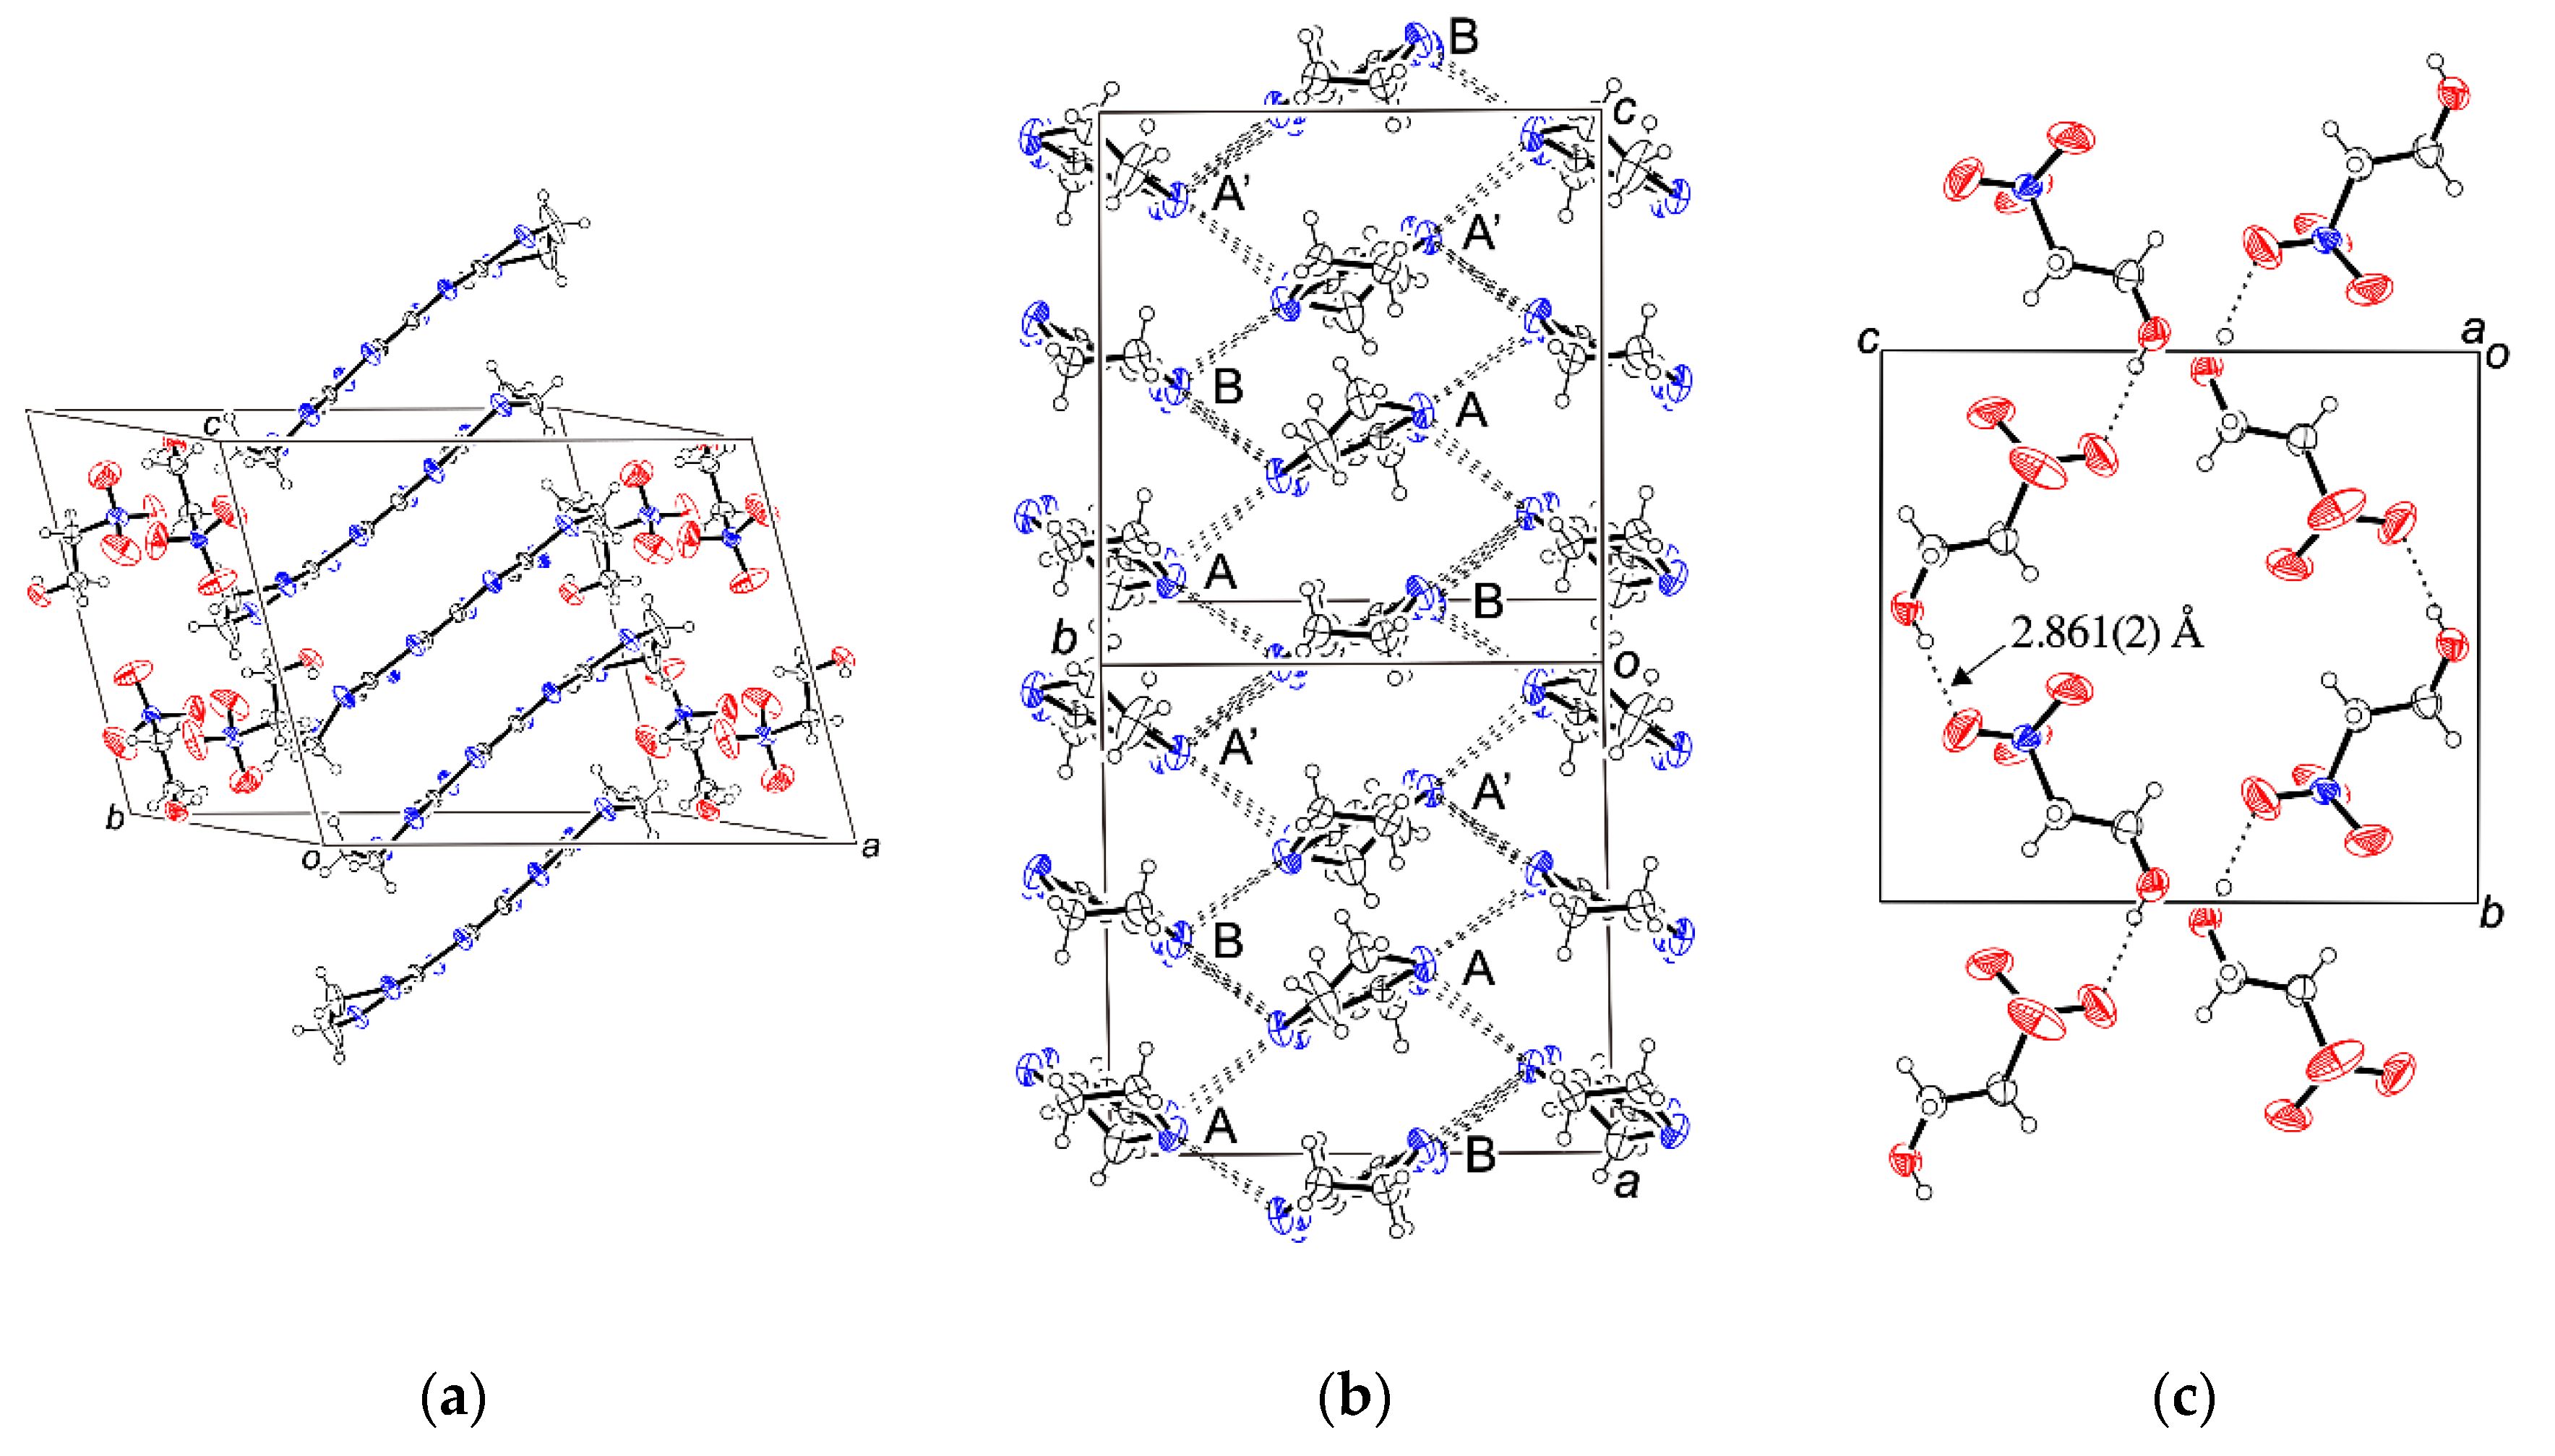
3.1. α-(BEDT-TTF)3(HOC2H4SO3)2 (1)

α-(BEDT-TTF)3(HOC2H4SO3)2 (1) crystallizes in the space group P21/c. One and a half of BEDT-TTF and one isethionate are crystallographically independent. Figure 1a shows the crystal structure of 1. The structure has alternating donor and anion layers propagating along the a axis. The structure of the two-dimensional conducting BEDT-TTF layer possessing an α-type packing motif is shown in Figure 1b. There are many interstack short S···S contacts, suggesting that the salt is a 2D conductor. However, the donor-to-anion ratio of 3:2 indicates that there is a BEDT-TTF trimer, in which two holes are located that form a spin dimer. Therefore, the structure suggests that the salt is a band insulator. Actually, the electrical resistivity measurements (Figure S1) indicate that the salt is a semiconductor with ρRT = 1.15 × 10² Ω·cm and Ea = 190 meV. The molecular arrangement of isethionate in an anionic layer is shown in Figure 1c. Intermolecular hydrogen bonding between the hydroxyl group and an oxygen atom of a nearest neighbor’s sulfo group (O···O = 2.861(2) Å) forms a 1D hydrogen bond chain along the b axis. In addition, there is an inversion centre in the anionic layer, indicating that the anion layer is not polar.

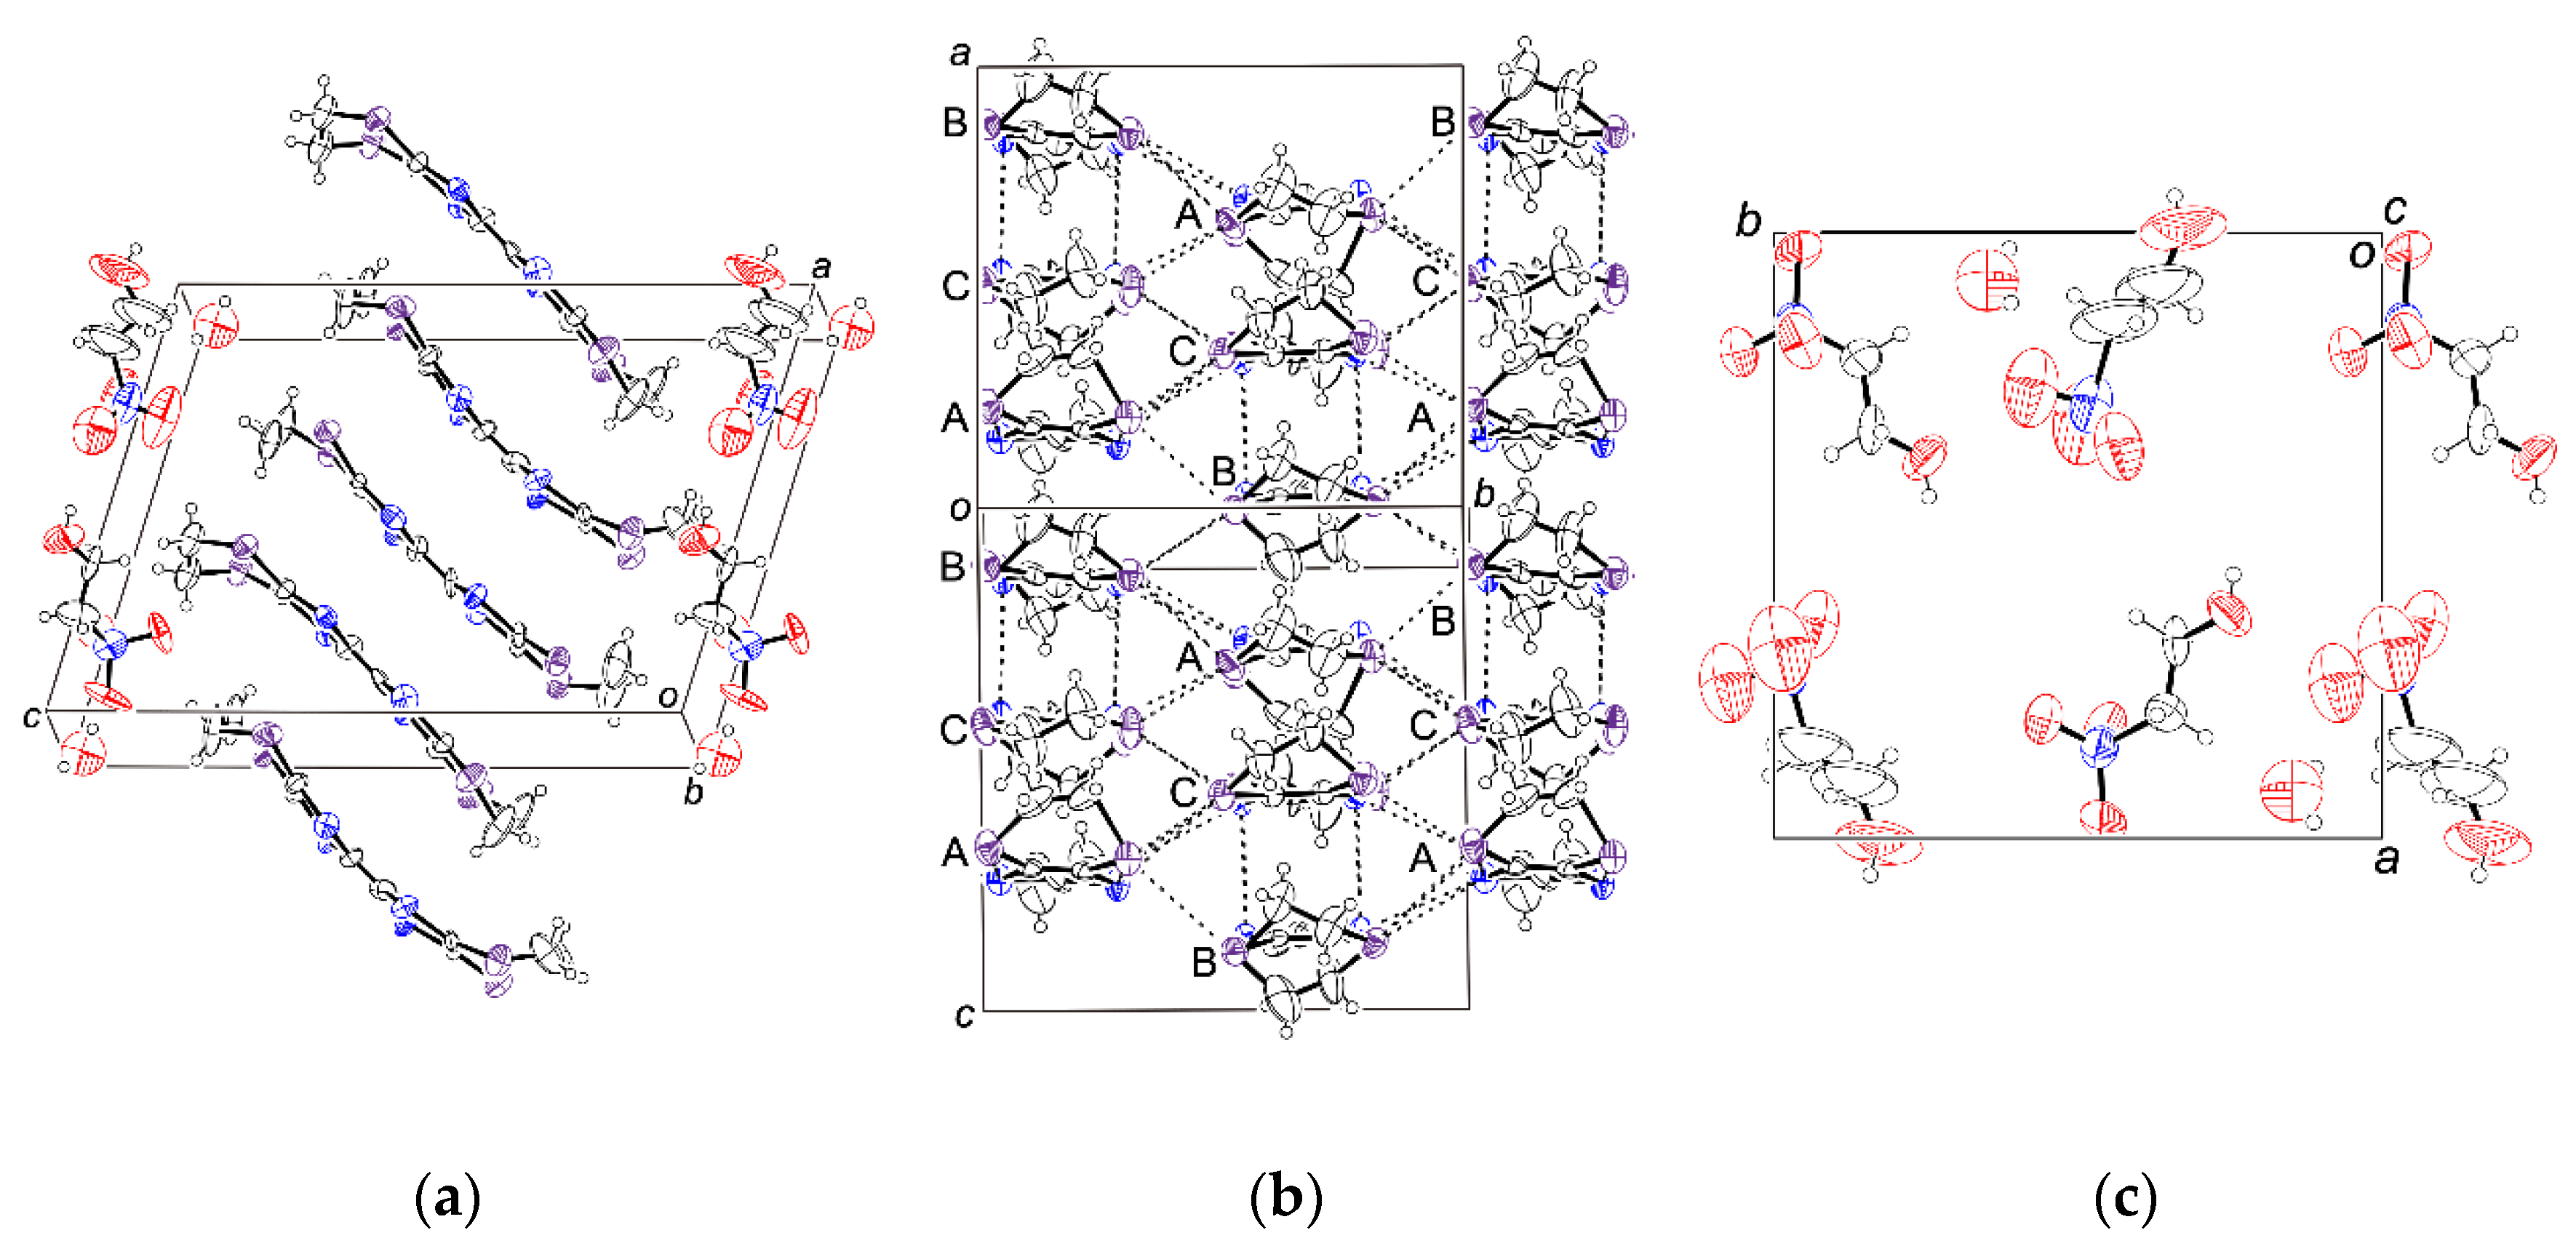
3.2. β-(BEST)3(HOC2H4SO3)2·H2O (2)

Compound 2 has similar cell parameters to 1, as shown in Table 1, but has a different space group (P21) and is not isomorphous with 1. There are three BEST molecules, two isethionate anions and one water molecule, in the asymmetric unit. The crystal structure is shown in Figure 2a. The unit cell consists of alternating donor/anion and water layers along the c axis. The donor layer (Figure 2b) has a β-type packing motif with both intra-and interstack short S···S contacts, suggesting that the salt is a 2D conductor. The ratio of donor to anion is 3:2, indicating that the BEST molecules form into trimers with two holes. In turn, the holes are arranged into spin dimers, which suggests that the salt is a band insulator. The resistivity measurements (Figure S2) indicate that the salt is, in fact, a semiconductor with higher conductivity than 1. Salt 2 has a room temperature resistivity that is approximately two orders of magnitude smaller, ρRT of 4.47 Ω·cm, and approximately a half of the activation energy, Ea of 108 meV, when compared to 1.
Figure 2c shows the structure of the anionic layer. The present R value of 11.6% is relatively high, so we cannot discuss some details of the structure. Several covalent bonds are distorted; therefore, bond length and angle restraints were applied. The space group, P21, is polar, so there are no inversion centres in the anionic layer. However, the anions are arranged to cancel almost all the dipole moments. The only small dipole moment seems to exist along the b axis (see Figure 2c). In addition, the X-ray diffraction measurement at 150 K gave a much more distorted structure, so we have not shown these data.

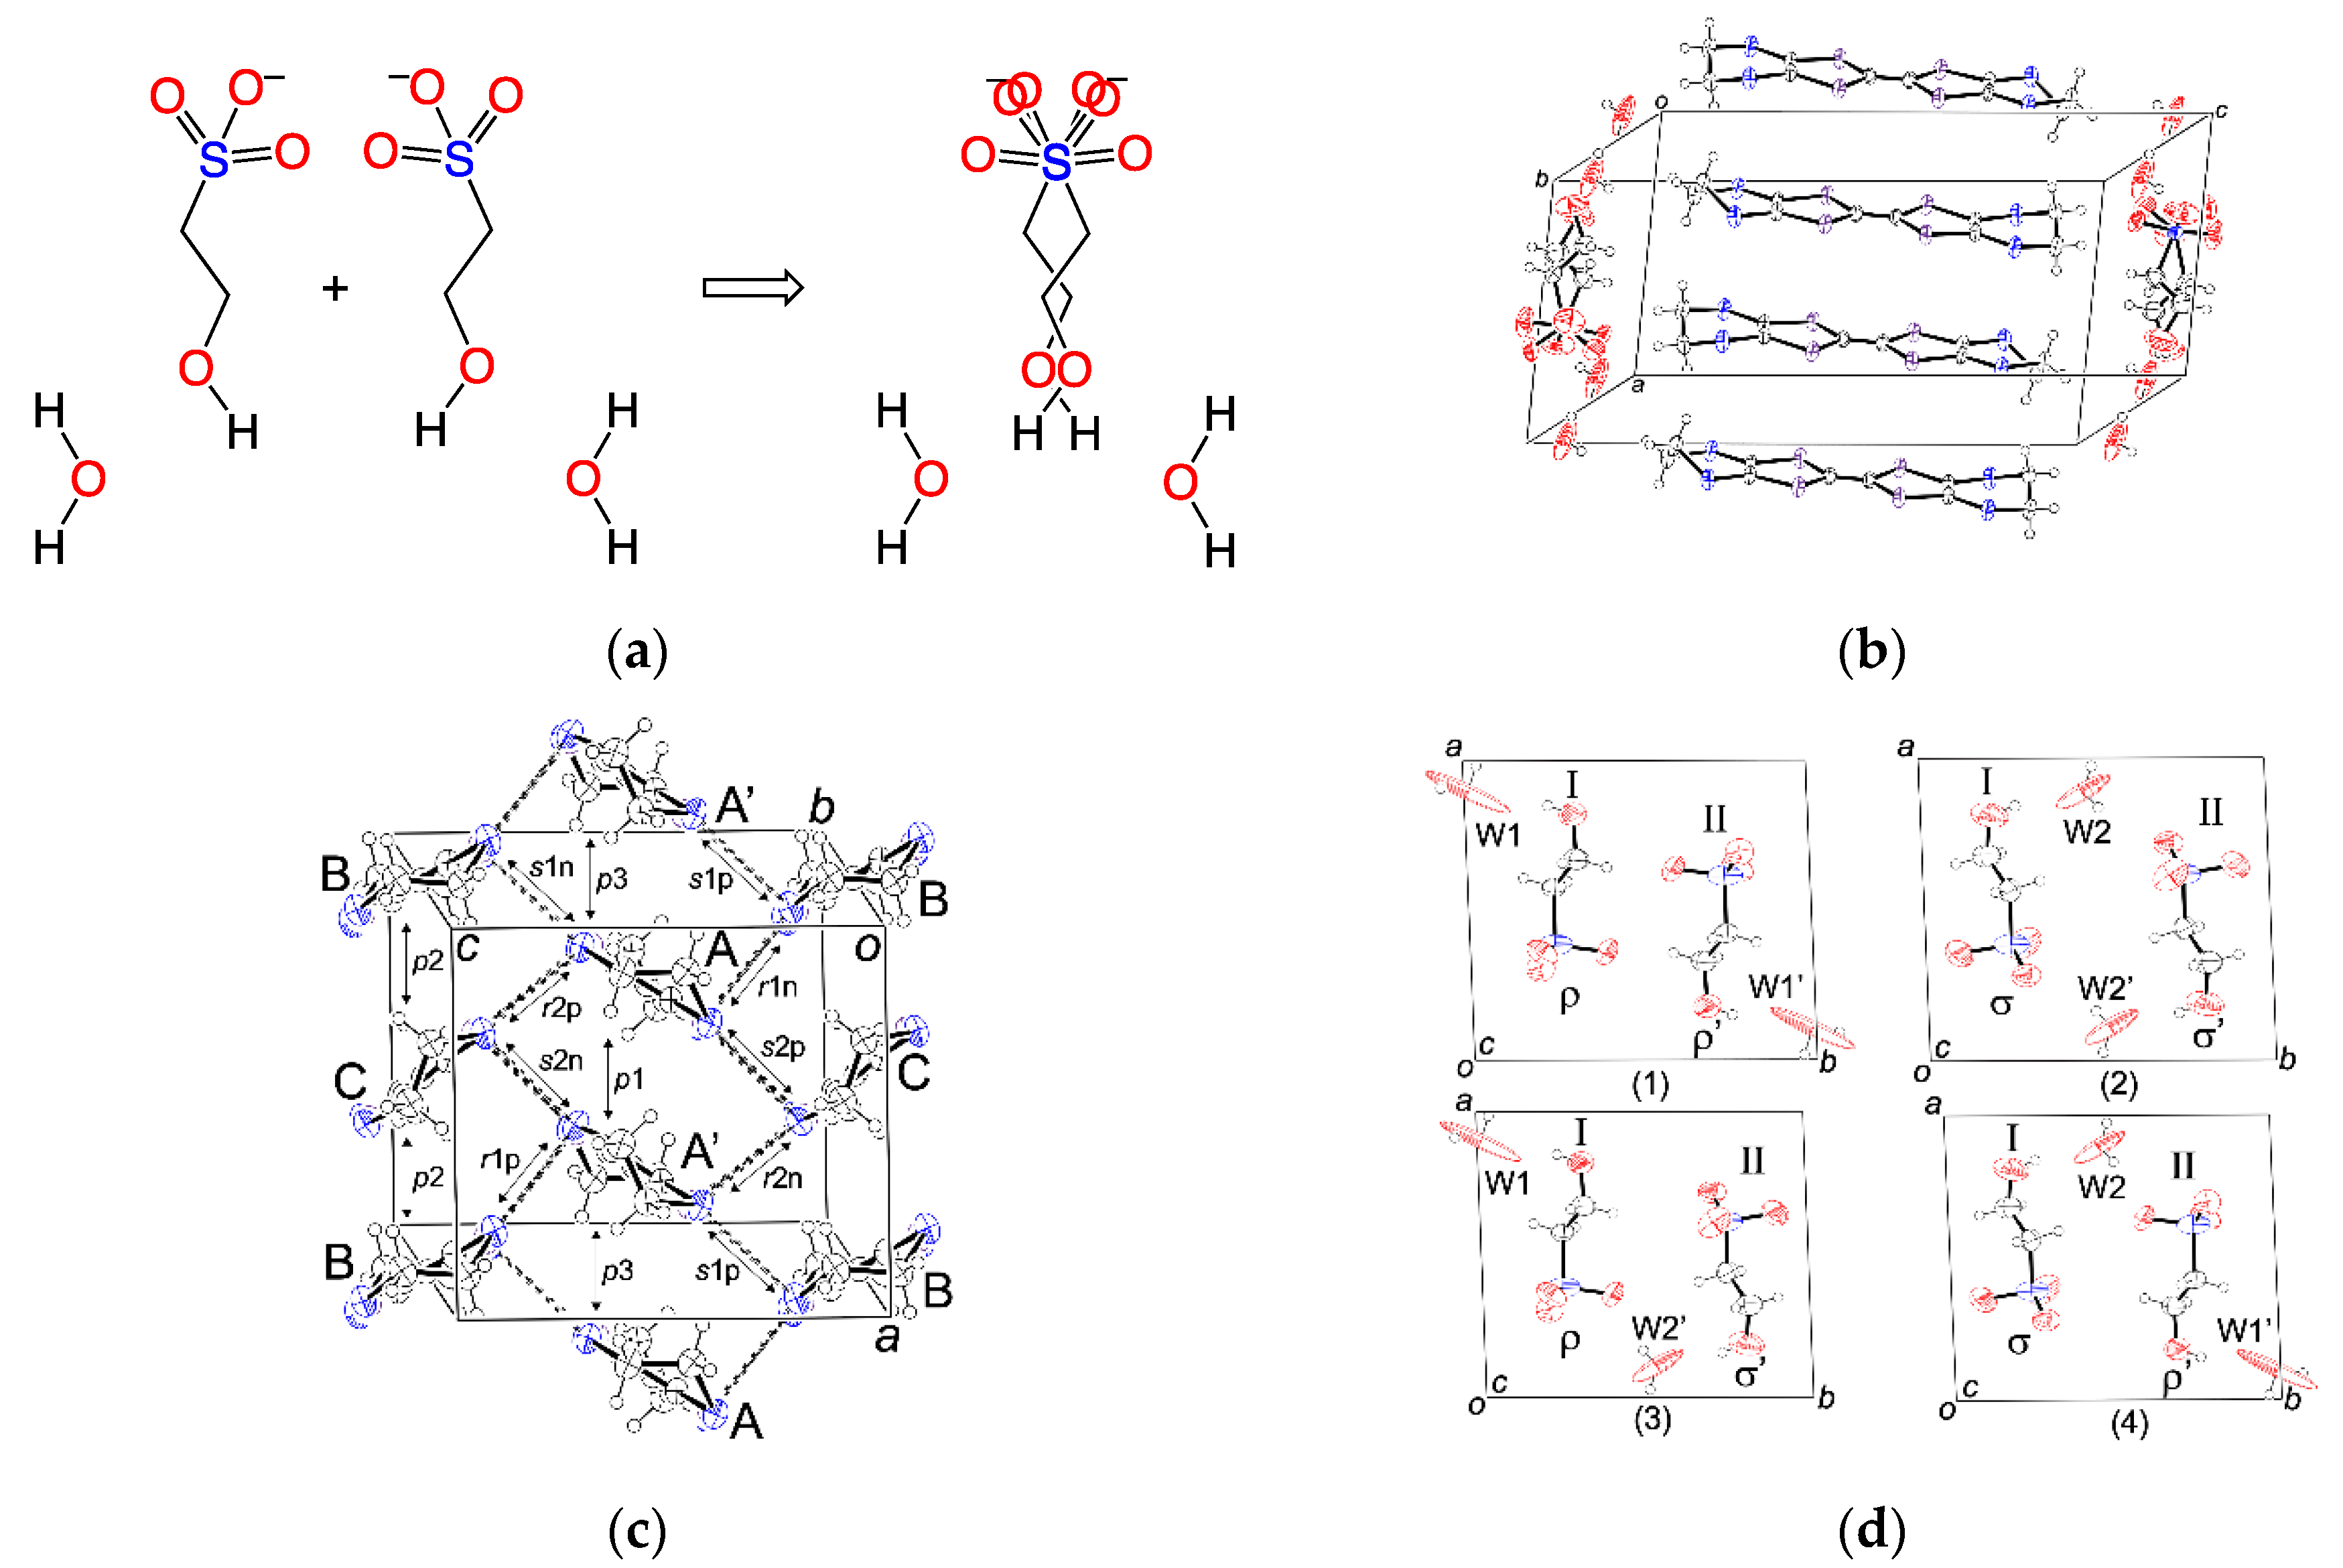
3.3. α-(BETS)2(HOC2H4SO3)·H2O (3)

The asymmetric unit of 3 consists of one (A in Figure 3c) and two halves (B and C) of BETS, one isethionate and one water molecule. The anion and the water molecule are disordered as schematically shown in Figure 3a, in which there are two anions having different conformations, which are superimposed at the same position. The crystal structure is shown in Figure 3b. The space group is P 1 ¯ , so four BETS molecules, two anions and two water molecules exist in the unit cell. Figure 3c shows the packing arrangement of a BETS layer, where A′ is a centrosymmetrically inverted A. The layer has an α-type packing motif with short side-by-side chalcogen–chalcogen contacts, indicating that the salt has 2D conducting layers. The ratio of donor to anion is 2:1 which suggests that the salt would show low resistivity (vide infra). Figure 3d shows a packing arrangement of the anion/water layer. Because there are two molecular configurations (ρ and σ) in the same position and two anion positions (I and II), there are four possible patterns ((1)–(4) in Figure 3d), where ρ′ and σ′ are centrosymmetrically inverted ρ and σ, respectively. In addition, patterns (1) and (2) are centrosymmetric but (3) and (4) are not exactly centrosymmetric.
The donor arrangement (α-type), the numbers of independent BETS molecules (one (A) and two halves (B and C)), and the cell parameters of 3 are quite similar to those of α-(BETS)2I3 [12], suggesting that the transport property of 3 would also be similar. α-(BETS)2I3 shows a metal–insulator (MI) transition at 50 K, and there is a shoulder at 40 K, suggesting another phase transition, below which the resistivity increases more rapidly [13]. The temperature-dependent electrical resistivity of 3 is shown in Figure 4a, where four crystals (Samples A–D) were measured at the same time; therefore, the cooling and heating rates are the same. However, the four samples show a wide variety of temperature dependences, and therefore, the samples were measured again. The resistivity curves of the second run are shown in Figure 4b. The behaviours of samples A, B and C are clearly different from each other. Moreover, each sample shows a different behaviour from the first measurement apart from sample C. The resistivity of almost all experiments shows MI transitions at around 70 K, and shoulders can be seen in some curves at around 30 K. The general behaviours are similar to those of α-(BETS)2I3. However, the ratio of the largest and smallest resistivity values (ρmax/ρmin) of sample C of 3, which shows the sharpest MI transition of all the measured samples, and of α-(BETS)2I3 are 4.6 and 570, respectively. This observation indicates that the MI transition of 3 is much less sharp than that of α-(BETS)2I3.
The temperature-dependent magnetic susceptibility of α-(BETS)2I3 was fitted by χSpin = C/T exp(−∆/kBT) (equation 1) with the gap /kB = 290 K and a Curie constant C = 0.29 emu mol−1 [23]. The magnetic behaviour of 3 (Figure 5) is similar to that of α-(BETS)2I3. The susceptibility decreases with decreasing temperature, where the differences in the susceptibilities between room and low temperatures are approximately 2.7 × 10⁻⁴ emu mol−1, which is 1.0 × 10⁻⁴ emu mol−1 smaller than that of α-(BETS)2I3. The data of 3 cannot be fitted by equation 1 and are closer to a 1D Heisenberg model (green line in Figure 5) with J = −213 K. However, the large deviations do not suggest that the spins on the BETS layer forms a 1D chain. This may indicate that more spins or more itinerant electrons exist at low temperatures in salt 3 when compared to α-(BETS)2I3.
The electronic structure was characterized using extended Hückel tight-binding band structure calculations of the donor layer [24] as shown in Figure 6. The Fermi surfaces are almost the same as for α-(BETS)2I3 [25]. Therefore, 3 and α-(BETS)2I3 have the same electronic structures.

4. Discussion

Although the molecular structures of the triiodide and isethionate BETS salts are very different, the cell parameters of 3 are quite similar, as are the donor arrangements and band structures. The α-(BETS)2I3 salt is isomorphous to α-(BEDT-TTF)2I3, which also shows a MI transition at 135 K (TMI) [12]. Therefore, it is believed that both MI transition mechanisms are similar. The mechanism of the MI transition of α-(BEDT-TTF)2I3 has been widely studied ([12,13,25,26,27,28] and references therein). At room temperature, the positive charges are equally distributed in the BEDT-TTF donor layers. However, below TMI, two BEDT-TTF molecules (A and B) become monocations and two become neutral (A′ and C), which is charge ordering (CO). In addition, the space group changes into the polar space group P1, and the previously crystallographically equivalent A and A′ molecules become independent. The crystal also becomes polar below the transition temperature [29]. Recently, J.-P. Pouget and co-workers reported a more consistent mechanism of the MI transition [27,28], where modulating the strength of the donor–anion hydrogen bonding modified the charges on the HOMOs of the donors; namely, I···H-C hydrogen bonds played a key role in the MI transition. Due to the similar structural and electronic properties, we expect that the salt 3 also shows a similar CO transition.
Figure 7a,b shows the structural relationship between -SO3 of the HOC2H4SO3 anions and the donors. There are no short contacts between donor C (Figure 3) and the anions, suggesting that the negatively charged sulfonate groups are not close to C but are close to A, A′ and B. Therefore, donor C is likely to be neutral or have a small positive charge in the CO state. In our previously reported sulfonate salts with CO ground states [30,31,32], the donor having the shortest S(BEDT-TTF)···O(-SO3) contacts (especially less than 3.1 Å), which are more direct interactions between positive and negative charges than those via the hydrogen bonds [27,28], has the largest positive charge because the state has the largest Coulomb energy. Moreover, as shown in Table 2, of the two anions in the unit cell with ρ and ρ′ conformations, only donor B has two contacts shorter than 3.1 Å. Therefore, in this situation, for example, only donor B becomes charge-rich and A, A′ and C donors become charge-poor molecules. This suggests that the configuration of the anion is relevant in determining the electronic structure of the CO state. Figure 8 shows a schematic diagram of the CO state, which includes six possible CO patterns, (b)–(g), in which C is neutral in patterns (b), (d) and (g). Therefore, one of these three states is likely to be the ground state of 3. In addition, the ground state of α-(BEDT-TTF)2I3 is represented by Figure 8b [26], suggesting that those of α-(BETS)2I3 and 3 would also be depicted by pattern (b). To strengthen this hypothesis, we calculated the Madelung energies of the CO patterns of (b)–(g) (also Table S1). In the calculations, the formula charges of each donor molecule (Q) were fixed to 0 or +1 for (b)–(g), which may be far from the real CO state, in which, normally, 0 < Q < 1. However, we believe that the calculations point to the stability of each CO pattern. The charge distributions in the component molecules were calculated using GAMESS at the BY3LP 6-31G* level for A, B and C donors and all crystallographically independent anions of α-(BEDT-TTF)2I3, α-(BETS)2I3 and 3, respectively. Then, each molecule’s Hirshfeld population analysis was performed using Multiwfn [21]. The resultant point charges (where we did not use the point charges of all H2O molecules in 3 because of the uncertainty of hydrogen atom positions in x-ray crystal structures. We also performed the calculations in which the charges of tentatively oriented all water molecules were included as shown in Table S1. The tendency of the results is similar to that shown in Table 3) were input into Gulp [22] to calculate each Madelung energy using an Ewald method, in which we calculated only the intermolecular Coulomb interactions. The resultant Madelung energies are summarized in Table 3. The anion in 3 has two disordered configurations on a general position, so the Madelung energies were calculated of all possible combinations of each CO pattern (a)–(g), as shown in Figure 8, and each anion arrangement pattern (1)–(4), as shown in Figure 3d.
As shown in Table 3, the Madelung energies of α-(BEDT-TTF)2I3 of four horizontal stripe-type CO patterns (Horizontal) of (b), (c), (f) and (g) are similar and smaller than those of the vertical stripe-type CO patterns (Vertical) of (d) and (e), indicating that Horizontals are more stable than Verticals. However, the difference between the largest and smallest values of the four Horizontals are small (less than 0.25 kJ mol−1) such that we cannot say which is the most stable state. Similarly, the energies of α-(BETS)2I3 of four Horizontals are similar and smaller than those of the Verticals, also indicating that Horizontals are more stable than Verticals, but it cannot be suggested which state is the most stable due to the small difference between the largest and smallest values (<0.20 kJ mol−1). A similar tendency was also observed in 3. The averages of the Madelung energies of (1)–(4) configurations of each CO pattern suggest that Horizontals are more stable than Verticals. However, the difference between the largest and smallest values of the averages of the Horizontals of (b), (c), (f) and (g) are larger than those of the two I3 salts. Those of (c) and (f) are approximately 5 kJ mol−1 smaller than those of (b) and (g), suggesting that (c) or (f) are possible ground states of 3. Indeed, the the difference between the largest and smallest values of the Madelung energies of the (1), (2), (3) and (4) of each CO pattern is 17.7–30.9 kJ mol−1. This indicates that the conformational effect of the anion is energetically more effective than that of the CO patterns of the donor layers. Table 3 indicates that the (c)-(4) (E = −466.2778) and (f)-(3) states (E = −466.2777 kJ mol−1) have the lowest energies, where (c)-(4) is (A′ C σ ρ′) and (f)-(3) is (A C ρ σ′), so centrosymmetircally inverted (c)-(4) is equivalent to (f)-(3) and vice versa. This indicates that the ground state of 3 is (c)-(4) = (f)-(3). However, if the CO pattern and the anion configuration are fixed to (c)-(4) = (f)-(3), at least above TMI, the MI transition of 3 is likely to be as sharp as in α-(BETS)2I3, which is not the case.
The disorder of the anion as shown in Figure 3a is related to the puckering motion of the ethylene group of isethionate. Similar puckering motions are observed in several BEDT-TTF salts [33], in which a puckering motion is seen in the terminal ethylene groups of BEDT-TTF. The motion in ET salts is frozen at around 100 K, where a glass transition occurs, indicating that perfect ordering of the ethylene groups is not realized at the time scale. If the anionic puckering motion in 3 is also frozen to form a glassy state, this is a disordered state where the full set of the configurations of (1)–(4) exist below a certain temperature. Then, the CO pattern is frozen. This type of disorder would provide a relatively large random potential because the Madelung energies (1)–(4) show a larger energy variation than those of (b)–(g). This random potential would depend on the measurement and/or sample conditions. Therefore, it is speculated that this is the reason why the salt 3 shows a broad MI transition and has large variations in the resistivity measurements of repeated samples. In addition, the random potential caused by the disorder of the anion might provide paramagnetic and/or metallic islands below TMI, which have a non-zero magnetic susceptibility. This agrees with the fact that the smallest magnetic susceptibility value at low temperature of 3 is larger than that of α-(BETS)2I3. We anticipate that some samples of 3 show either metallic or insulating behaviours when changing the cooling rates of the resistivity measurement. An emergent, passively even superconducting, phase may arise from the phase boundaries between the metallic and insulating phase, the investigation of which is now in progress.

5. Conclusions

Three purely organic charge-transfer salts—α-(BEDT-TTF)3(HOC2H4SO3)2 (1), β-(BEST)3(HOC2H4SO3)2·H2O (2) and α-(BETS)2(HOC2H4SO3)·H2O (3)—have been prepared Salts 1 and 2 are semiconducting with ρRT of 1.15 × 10² and 4.47 Ω·cm, and Ea of 190 and 108 meV, respectively. Salt 3 is metallic, with a broad MI transition at around 70 K. The HOC2H4SO3 anion in 3 is disordered, the randomness of which appears to make the resistivity behaviour vary as a function of the measured sample, which is supported by Madelung energy calculations.

Supplementary Materials

The following are available online at https://0-www-mdpi-com.brum.beds.ac.uk/2073-4352/10/9/775/s1, GAMESS input options; Figure S1: Temperature dependence of electrical resistivity of 1; Figure S2: Temperature dependence of electrical resistivity of 2; Table S1: Madelung energies of 3 calculated excluding and including the point charges of water molecules.

Author Contributions

H.A. conceived and designed the experiments; K.F. synthesized the BETS molecule; Y.K. synthesized the BEST molecule and all the charge-transfer salts; H.A. and Y.K. participated in all the physical measurements; H.A., S.S.T. and Y.N. wrote and/or reviewed the paper with contributions from all authors. All authors have read and agreed to the published version of the manuscript.

Funding

This research was partially funded by JSPS KAKENHI, grant numbers 17K05751, 17H01144.

Acknowledgments

This article is dedicated to Professor Peter Day. The authors thank Shusuke Yamanaka of Osaka University for helpful discussions on Madelung energy calculations.

Conflicts of Interest

The authors declare no conflict of interest.

References

  1. Williams, J.M.; Ferraro, J.R.; Thorn, R.J.; Carlson, K.D.; Geiser, U.; Wang, H.H.; Kini, A.M.; Whangbo, M.-H. Organic Superconductor (Including Fullerenes) Synthesis, Structure, Properties and Theory; Prentice-Hall: New York, NY, USA, 1992. [Google Scholar]
  2. Mori, T. Electronic Properties of Organic Conductors; Springer: Tokyo, Japan, 2016. [Google Scholar]
  3. Ishiguro, T.; Yamaji, K.; Saito, G. Organic Superconductors, 2nd ed.; Springer: Berlin/Heidelberg, Germany, 1998. [Google Scholar]
  4. Lebed, A. The Physics of Organic Superconductors and Conductors; Springer: Berlin, Germany, 2008. [Google Scholar]
  5. Yamada, J.; Nishikawa, H. Design of Conducting and Superconducting Organic Molecules. In Encyclopedia of Physical Organic Chemistry; Wang, Z., Wille, U., Juaristi, E., Eds.; John Wily & Sons Inc.: Hoboken, NJ, USA, 2017; Volume 3, pp. 2133–2188. [Google Scholar]
  6. Urayama, H.; Yamochi, H.; Saito, G.; Nozawa, K.; Sugano, T.; Kinoshita, M.; Sato, S.; Oshima, K.; Kawamoto, A.; Tanaka, A. A new ambient pressure organic superconductor based on BEDT-TTF with TC higher than 10 K (TC = 10.4 K). Chem. Lett. 1988, 17, 55–58. [Google Scholar] [CrossRef]
  7. Wang, H.H.; Geiser, U.; Williams, J.M.; Mason, J.M.; Perr, J.T.; Heindl, J.E.; Lathrop, M.W.; Love, B.J.; Watkins, D.M.; Yaconi, G.A. Phase selectivity in the simultaneous synthesis of the Tc = 12.8 K (0.3 kbar) organic superconductor κ-(BEDT-TTF)2Cu[N(CN)2]Cl or the semiconductor (BEDT-TTF)Cu[N(CN)2]2. Chem. Mater. 1992, 4, 247–249. [Google Scholar] [CrossRef]
  8. Kini, A.M.; Geiser, U.; Wang, H.H.; Carlson, K.D.; Williams, J.M.; Kwok, W.K.; Vandervoort, K.G.; Thompson, J.E.; Stupka, D.L. A new ambient-pressure organic superconductor, κ-(ET)2Cu[N(CN)2]Br, with the highest transition temperature yet observed (Inductive Onset Tc = 11.6 K, Resistive Onset = 12.5 K). Inorg. Chem. 1990, 29, 2555–2557. [Google Scholar] [CrossRef]
  9. Mori, H.; Tanaka, S.; Mori, T. Systematic study of the electronic state in theta-type BEDT-TTF organic conductors by changing the electronic correlation. Phys. Rev. B 1998, 57, 12023–12029. [Google Scholar] [CrossRef]
  10. Oshima, M.; Mori, H.; Saito, G.; Oshima, K. Crystal Structures and Electrical Properties of BEDT-TTF Salts of Mercury(II) Thiocyanate with and without K Ion. Chem. Lett. 1989, 18, 1159–1162. [Google Scholar] [CrossRef]
  11. Wang, H.H.; Carlson, K.D.; Geiser, U.; Kwok, W.K.; Vashon, M.D.; Thompson, J.E.; Larsen, N.F.; McCabe, G.D.; Hulscher, R.S.; Williams, J.M. A new ambient-pressure organic superconductor: (BEDT-TTF)2(NH4)Hg(SCN)4. Phys. C 1990, 166, 57–61. [Google Scholar] [CrossRef]
  12. Bender, K.; Hennig, I.; Schweitzer, D.; Dietz, K.; Endres, H.; Keller, H.J. Synthesis, Structure and Physical Properties of a Two-Dimensional Organic Metal, Di[bis(ethylenedithiolo)tetrathiofulvalene] triiodide, (BEDT-TTF)+2I3. Mol. Cryst. Liq. Cryst. 1984, 108, 359–371. [Google Scholar] [CrossRef] [Green Version]
  13. Inokuchi, M.; Tajima, H.; Kobayashi, A.; Ohta, T.; Kuroda, H.; Kato, R.; Naito, T.; Kobayashi, H. Electrical and Optical Properties of α-(BETS)2I3 and α-(BEDT-STF)2I3. Bull. Chem. Soc. Jpn. 1995, 68, 547–553. [Google Scholar] [CrossRef]
  14. Jérome, D.; Schulz, H.J. Organic conductors and superconductors. Adv. Phys. 1982, 31, 299–490. [Google Scholar] [CrossRef]
  15. Kato, R.; Kobayashi, H.; Kobayashi, A. Synthesis and Properties of Bis(ethylenedithio)tetraselenafulvalene (BEDT-TSeF) Compounds. Synth. Met. 1991, 42, 2093–2096. [Google Scholar] [CrossRef]
  16. Courcet, T.; Malfant, I.; Pokhodnia, K.; Cassoux, P. Bis(ethylenedithio)tetraselenafulvalene: Short-cut synthesis, X-raycrystal structure andp-electron density distribution. New J. Chem. 1998, 22, 585–589. [Google Scholar] [CrossRef]
  17. Kini, A.N.; Gates, B.D.; Beno, M.A.; Williams, J.M. Bis(ethylenediseleno)tetrathiafulvalene: Convenient One-pot Synthesis and X-Ray Crystal Structure. J. Chem. Soc. Chem. Commun. 1989, 169–171. [Google Scholar] [CrossRef]
  18. Schmidt, M.W.; Baldridge, K.K.; Boatz, J.A.; Elbert, S.T.; Gordon, M.S.; Jensen, J.H.; Koseki, S.; Matsunaga, N.; Nguyen, K.A.; Su, S.; et al. General Atomic and Molecular Electronic Structure System. J. Comput. Chem. 1993, 14, 1347–1363. [Google Scholar] [CrossRef]
  19. Suenaga, M. Facio: New Computational Chemistry Environmrnt for PC GAMESS. J. Comput. Chem. Jpn. 2005, 4, 25–32. [Google Scholar] [CrossRef] [Green Version]
  20. Suenaga, M. Development of GUI for GAMESS/FMO Calculation. J. Comput. Chem. Jpn. 2008, 7, 33–54. [Google Scholar] [CrossRef]
  21. Lu, T.; Chen, F. Multiwfn: A Multifunctional Wavefunction Analyzer. J. Comput. Chem. 2012, 33, 580–592. [Google Scholar] [CrossRef]
  22. Gale, J.D. GULP—A computer program for the symmetry adapted simulation of solids. J. Chem. Soc. Faraday Trans. 1997, 93, 629–637. [Google Scholar] [CrossRef]
  23. Hiraki, K.; Harada, S.; Arai, K.; Takano, Y.; Takahashi, T.; Tajima, N.; Kato, R.; Naito, T. Local Spin Susceptibility of α-D2I3 (D = bis(ethylendithio)tetraselenafulvalene (BETS) and bis(ethylendithio)dithiadiselenafulvalene (BEDT-STF)) Studied by 77Se NMR. J. Phys. Soc. Jpn. 2011, 80, 14715. [Google Scholar] [CrossRef]
  24. Mori, T.; Kobayashi, A.; Sasaki, Y.; Kobayashi, H.; Saito, G.; Inokuchi, H. The Intermolecular Interaction of Tetrathiafulvalene and Bis(ethylenedithio)tetrathiafulvalene in Organic Metals. Calculation of Orbital Overlaps and Models of Energy-band Structures. Bull. Chem. Soc. Jpn. 1984, 57, 627–633. [Google Scholar] [CrossRef]
  25. Kondo, R.; Kagoshima, S.; Tajima, N.; Kato, R. Crystal and Electronic Structures of the Quasi-Two-Dimensional Organic Conductor α-(BEDT-TTF)2I3 and Its Selenium Analogue α-(BEDT-TSeF)2I3 under Hydrostatic Pressure at Room Temperature. J. Phys. Soc. Jpn. 2009, 78, 114714. [Google Scholar] [CrossRef] [Green Version]
  26. Kakiuchi, T.; Wakabayashi, Y.; Sawa, H.; Takahashi, T.; Nakamura, T. Charge Ordering in α-(BEDT-TTF)2I3 by Synchrotron X-ray Diffraction. J. Phys. Soc. Jpn. 2007, 76, 113702. [Google Scholar] [CrossRef] [Green Version]
  27. Pouget, J.-P.; Alemany, P.; Canadell, E. Donor-anion interactions in quarter-filled low-dimensional organic conductors. Mater. Horiz. 2018, 5, 590–640. [Google Scholar] [CrossRef] [Green Version]
  28. Alemany, P.; Pouget, J.-P.; Canadell, E. Essential role of anions in the charge ordering transition of α-(BEDT-TTF)2I3. Phys. Rev. B 2012, 85, 195118. [Google Scholar] [CrossRef]
  29. Yamamoto, K.; Iwai, S.; Boyko, S.; Kashiwazaki, A.; Hiramatsu, F.; Okabe, C.; Nishi, N.; Yakushi, K. Strong Optical Nonlinearity and its Ultrafast Response Associated with Electron Ferroelectricity in an Organic Conductor. J. Phys. Soc. Jpn. 2008, 77, 074709. [Google Scholar] [CrossRef] [Green Version]
  30. Akutsu, H.; Yamada, J.; Nakatsuji, S.; Turner, S.S. A novel BEDT-TTF-based purely organic magnetic conductor, α-(BEDT-TTF)2(TEMPO-N(CH3)COCH2SO3)·3H2O. Solid State Commun. 2006, 140, 256–260. [Google Scholar] [CrossRef] [Green Version]
  31. Akutsu, H.; Yamada, J.; Nakatsuji, S.; Turner, S.S. A New BEDT-TTF-Based Organic Charge Transfer Salt with a New Anionic Strong Acceptor, N,N′-Disulfo-1,4-benzoquinonediimine. Crystals 2012, 2, 182–192. [Google Scholar] [CrossRef] [Green Version]
  32. Akutsu, H.; Ishihara, K.; Yamada, J.; Nakatsuji, S.; Turner, S.S.; Nakazawa, Y. A strongly polarized organic conductor. CrystEngComm 2016, 18, 8151–8154. [Google Scholar] [CrossRef]
  33. Akutsu, H.; Saito, K.; Sorai, M. Phase behavior of the organic superconductors κ-(BEDT-TTF)2Cu[N(CN)2] X (X = Br and Cl) studied by ac calorimetry. Phys. Rev. B 2000, 61, 4346–4352. [Google Scholar] [CrossRef]
Scheme 1. Structural formula of BEDT-TTF, BEST, BETS salts of a simple organic anion, isethionate (HOC2H4SO3).
Crystals 10 00775 sch001
Figure 1. Crystal structure (a); arrangement of the donor layer (b), where dashed lines indicate short S···S contacts (<3.7 Å); and structure of the anionic layer (c) of 1.
Crystals 10 00775 g001
Figure 2. Crystal structure (a); arrangement of the donor layer (b), where dashed lines indicate short S···S, Se···S and Se···Se contacts (<3.70, 3.75 and 3.80 Å, respectively); and structure of the anionic layer (c) of 2.
Crystals 10 00775 g002
Figure 3. (a) A schematic diagram of the disorder of the isethionate anion. (b) Crystal structure. (c) Arrangement of the donor layer, in which donors A, B and C are crystallographically independent and A′ is the centrosymmetrically inverted A. Dashed lines indicate short S···S, Se···S and Se···Se contacts (<3.70, 3.75 and 3.80 Å, respectively). Transfer integrals are labelled as p1, p2, etc. (d) Four possible patterns of the donor layer of 3. The unit cell has two disordered water molecules (W1 and W2) and two isethionate anions (I and II), the latter of which are disordered over two conformations (ρ and σ) as schematically shown in Figure 3a. ρ′ and σ′ are the symmetrically inverted ρ and σ.
Crystals 10 00775 g003
Figure 4. Temperature dependences of electrical resistivity of four crystals of 3, where (a) is the first and (b) is the second run.
Crystals 10 00775 g004
Figure 5. Temperature dependence of magnetic susceptibility of 3. The green solid line is calculated on the basis of a 1D Heisenberg model.
Crystals 10 00775 g005
Figure 6. Band dispersions (left), Fermi surfaces (centre) and overlap integrals (right) of 3. The donor···donor interactions (p1, p2, etc.) are labelled in Figure 3c.
Crystals 10 00775 g006
Figure 7. Interactions between bis(ethylenedithio)tetraselenafulvalene (BETS) and each disordered conformer ((a) ρ and (b) σ) of isethionate in 3, where dotted lines indicate S···O contacts shorter than the van der Waals distance (3.37 Å).
Crystals 10 00775 g007
Figure 8. Schematic diagram of α-type packing arrangement of donor layer. (bg) Schematics of the full set of six possible arrangements of neutral (white) and cationic (dark blue) donor molecules in the conduction plane, where (w x y z) means the molecular charges of A, A′, B and C molecules (see Figure 3c) of w, x, y and z, respectively. Blue (w x y z) and green (w x y z) indicate that the charge-ordered patterns are horizontal and vertical stripes, respectively. The same colours are used in Table 3. (a) A schematic diagram of the non-charge-ordered state, where each molecule has a +1/2 charge (light blue).
Crystals 10 00775 g008
Table 1. Crystallographic data of 1, 2 and 3.
Compound123
Compositionα-(BEDT-TTF)3·(HOC2H4SO3)2β-(BEST)3 (HOC2H4SO3)2·H2Oα-(BETS)2 (HOC2H4SO3)·H2O
FormulaC34H34O8S26C34H36O9S14Se12C22H23O5S9Se8
Fw1404.201213.171287.64
Space GroupP21/cP21P 1 ¯
a (Å)18.6954(7)12.8225(14)9.2422(5)
b (Å)11.2106(4)12.3690(13)10.7806(5)
c (Å)12.8995(5)18.129(2)18.6601(9)
α (°)90.00090.000103.579(7)
β (°)109.300(8)106.653(8)97.219(7)
γ (°)90.00090.00090.455(6)
V3)2551.6(2)2754.7(5)1791.57(17)
Z222
T (K) 290290290
dcalc (g·cm−1)1.8282.3932.387
μ (cm−1)11.36485.30387.198
F(000)143618881222
2θ range (°)4–554–554–55
Total ref.23,70326,05217,212
Unique ref.582712,5468101
Rint0.02510.17530.0607
Parameters307505478
R1 (I > 2σ(I))0.0440.1140.042
wR2 (all data)0.1030.3200.109
S1.0830.9701.064
Δρmax (e Å−3)0.851.681.48
Δρmin (e Å−3)−0.67−1.43−1.05
Flack 0.37(2)
CCDC reference2,022,6212,022,6232,022,624
Table 2. Numbers (N) of effective short S···O contacts (<3.1 Å) of 3 for four possible anion arrangements.
Configurations of AnionsN with Donor A or A′N with Donor BN with Donor C
ρρ′020
σσ′200
ρσ′110
σρ′110
Table 3. Madelung energies of α-(BEDT-TTF)2I3, α-(BETS)2I3 and 3.
α-(BEDT-TTF)2I3
CO pattern *1BEDT-TTF charge Madelung E *4ΔE *5
AA′BC
(b) Horizontal *2+10+10 −442.84540.2540
(c) Horizontal0+10+1 −443.09940.0000
(d) Vertical *3+1+100 −426.121216.9782
(e) Vertical00+1+1 −424.636818.4626
(f) Horizontal+100+1 −443.09120.0082
(g) Horizontal0+1+10 −442.83190.2675
α-(BETS)2I3 ΔE *5
CO patternBETS charge Madelung E
AA′BC
(b) Horizontal+10+10 −414.73770.1976
(c) Horizontal0+10+1 −414.93530.0000
(d) Vertical+1+100 −401.269013.6663
(e) Vertical00+1+1 −399.056915.8784
(f) Horizontal+100+1 −414.92910.0062
(g) Horizontal0+1+10 −414.74110.1942
3, α-(BETS)2(HOC2H4SO3)·H2O ΔE *5
CO patternBETS chargeConfiguration *6Madelung E
AA′BC III
(b) Horizontal+10+10(1)ρρ′−444.359521.9183
“ *7(2)σσ′−441.464824.8130
(3)ρσ′−461.46804.8098
(4)σρ′−459.15547.1224
Average−451.611914.6659
(c) Horizontal0+10+1(1)ρρ′−446.816519.4613
(2)σσ′−448.629817.648
(3)ρσ′−463.96752.3103
(4)σρ′−466.27780.0000
Average−456.42299.8549
(d) Vertical+1+100(1)ρρ′−443.928722.3491
(2)σσ′−416.884349.3935
(3)ρσ′−447.806618.4712
(4)σρ′−447.805518.4723
Average−439.106327.1715
(e) Vertical00+1+1(1)ρρ′−416.492149.7857
(2)σσ′−442.455123.8227
(3)ρσ′−446.873719.4041
(4)σρ′−446.872619.4052
Average−438.173428.1044
(f) Horizontal+100+1(1)ρρ′−446.815219.4626
(2)σσ′−448.628517.6493
(3)ρσ′−466.27770.0001
(4)σρ′−463.96512.3127
Average−456.42169.8562
(g) Horizontal0+1+10(1)ρρ′−444.361421.9164
(2)σσ′−441.466724.8111
(3)ρσ′−459.15837.1195
(4)σρ′−461.46884.8090
Average−451.613814.664
*1 CO patterns = charge-ordering patterns shown in Figure 8; *2 Horizontal = horizontal stripe; *3 Vertical = vertical stripe; *4 kJ mol−1 (unit cell); *5 ΔE = EE (the lowest in the salt); *6 Configuration = Anion Configuration at I and II positions in the unit cell as shown in Figure 3d; *7 A ditto mark.

