Development of AgFeO2/rGO/TiO2 Ternary Composite Photocatalysts for Enhanced Photocatalytic Dye Decolorization


 and
and
Abstract
:
1. Introduction
2. Materials and Methods
2.1. Chemicals and Materials
2.2. Preparation of Graphene Oxide
2.3. Preparation of AgFeO2/rGO/TiO2 Nanocomposite
2.4. Materials Characterizations
2.5. Photocatalytic Performance Evaluation
3. Results
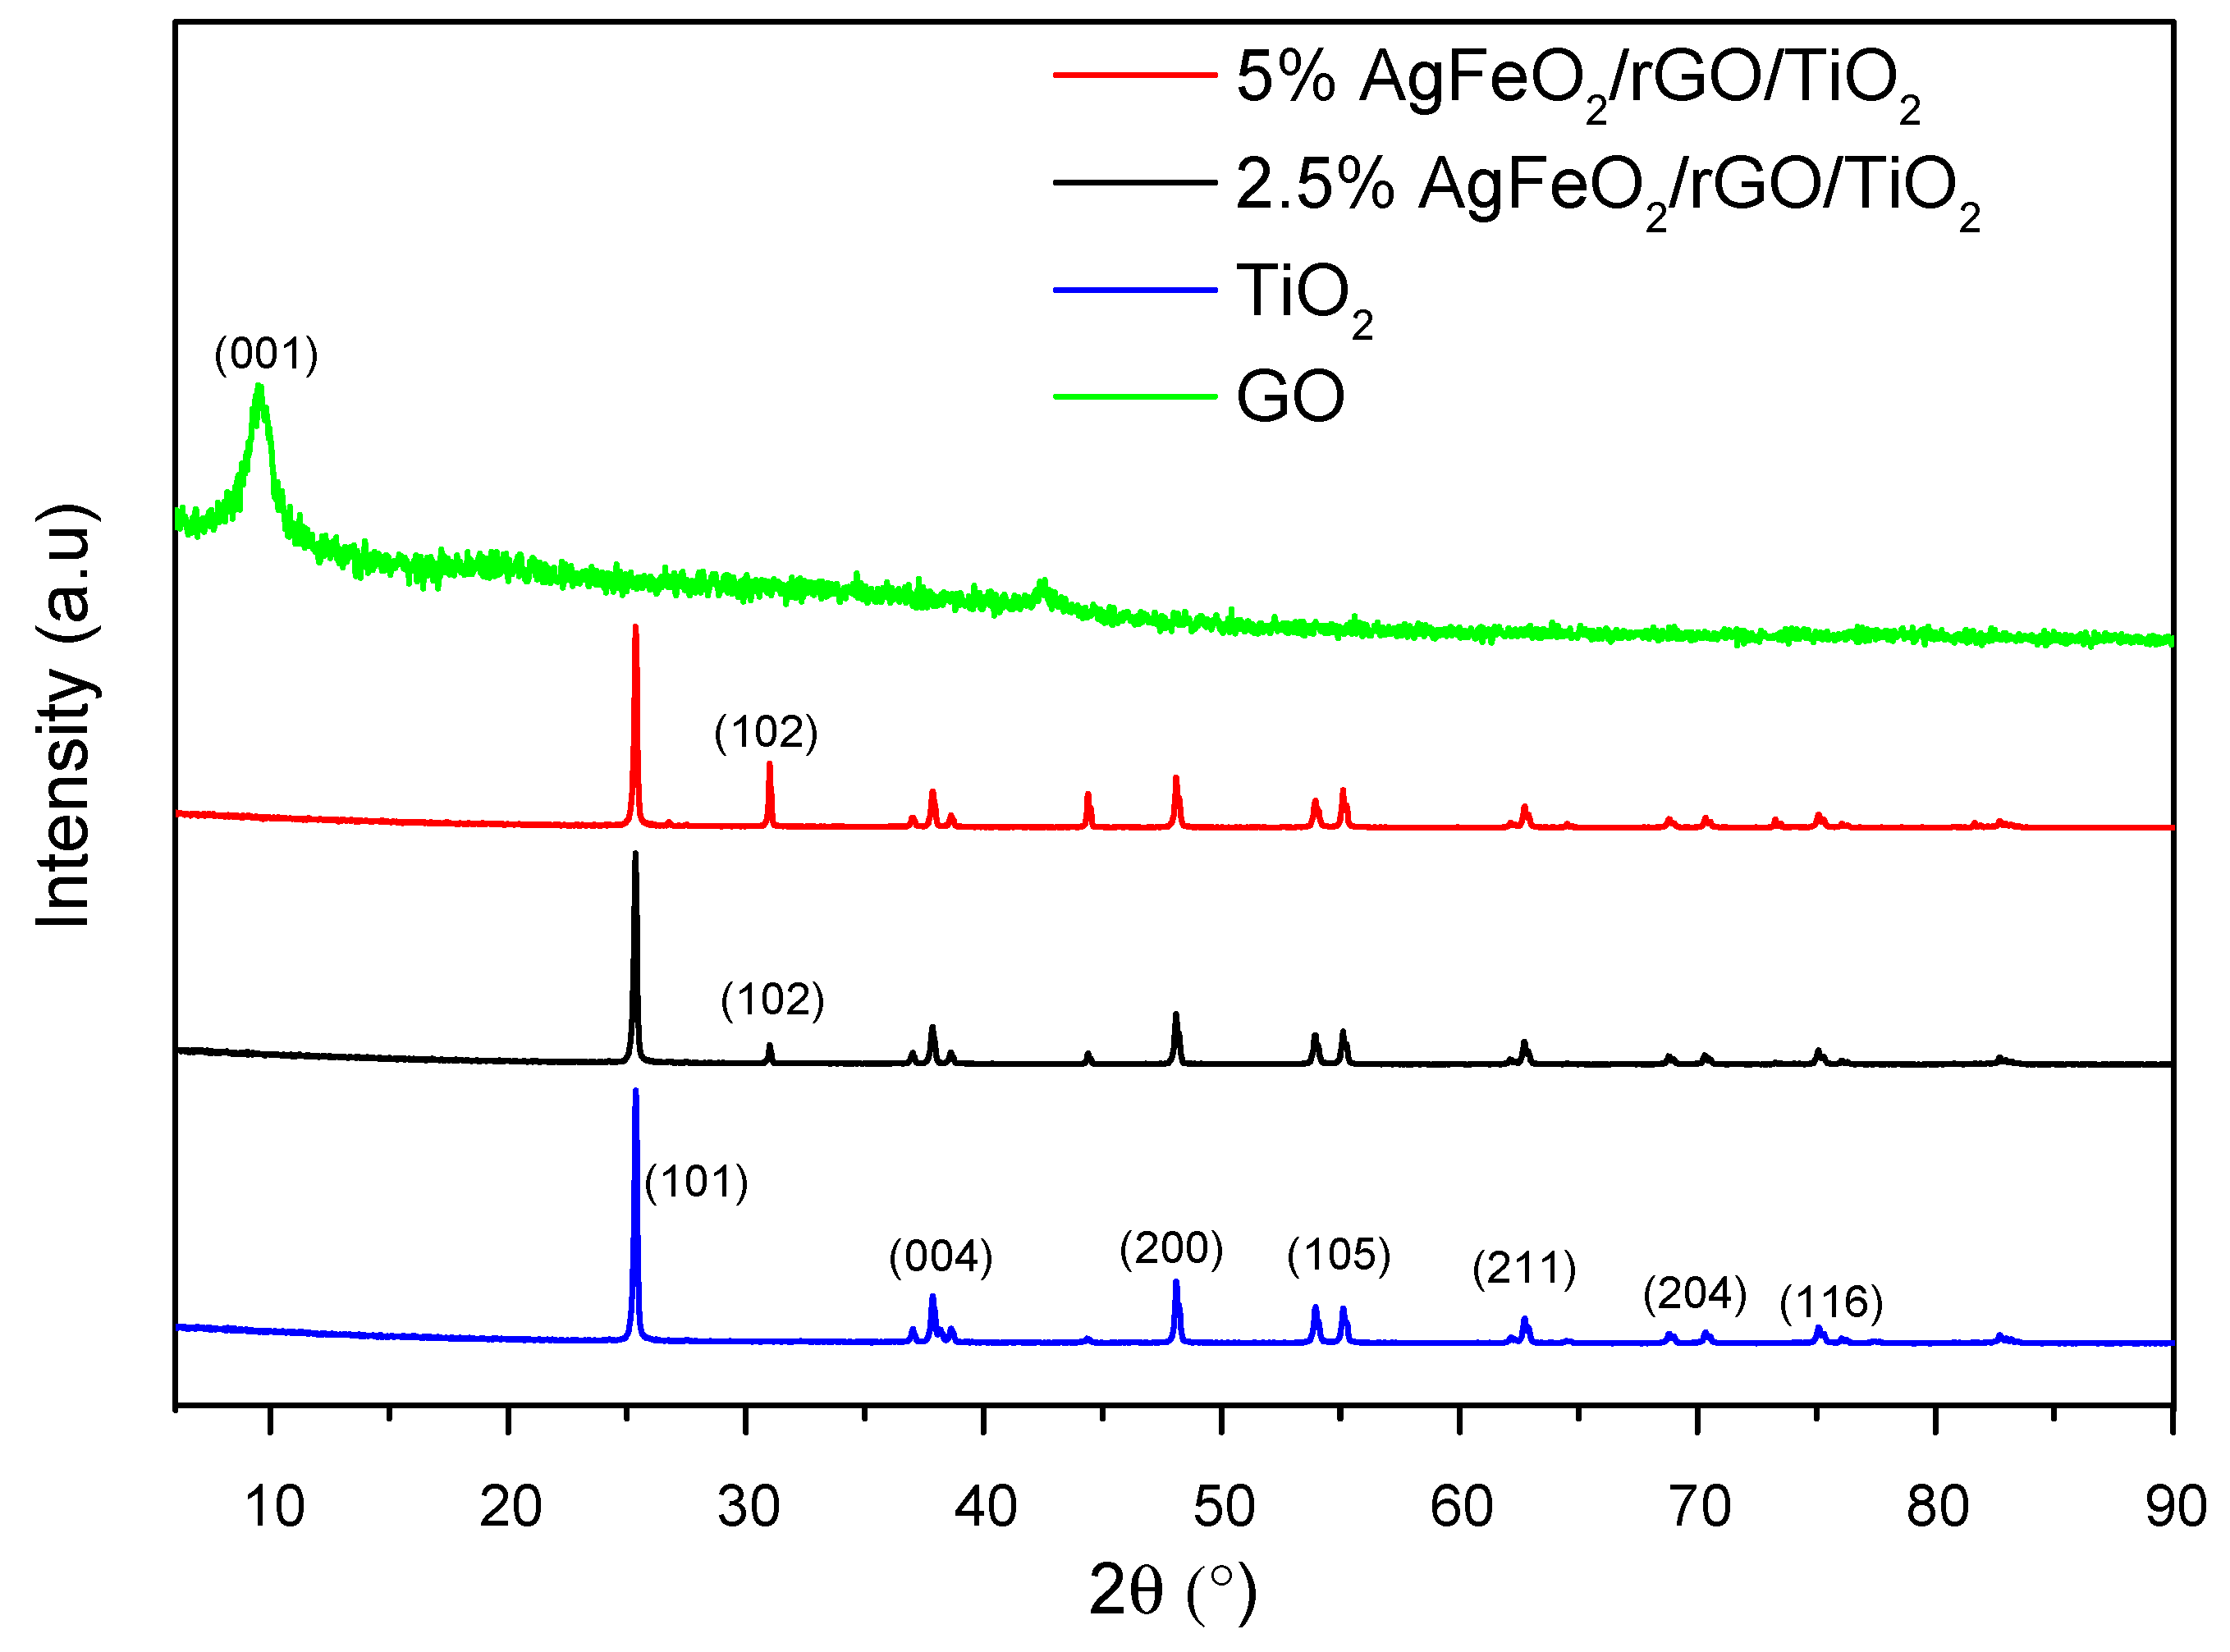
3.1. XRD Analysis
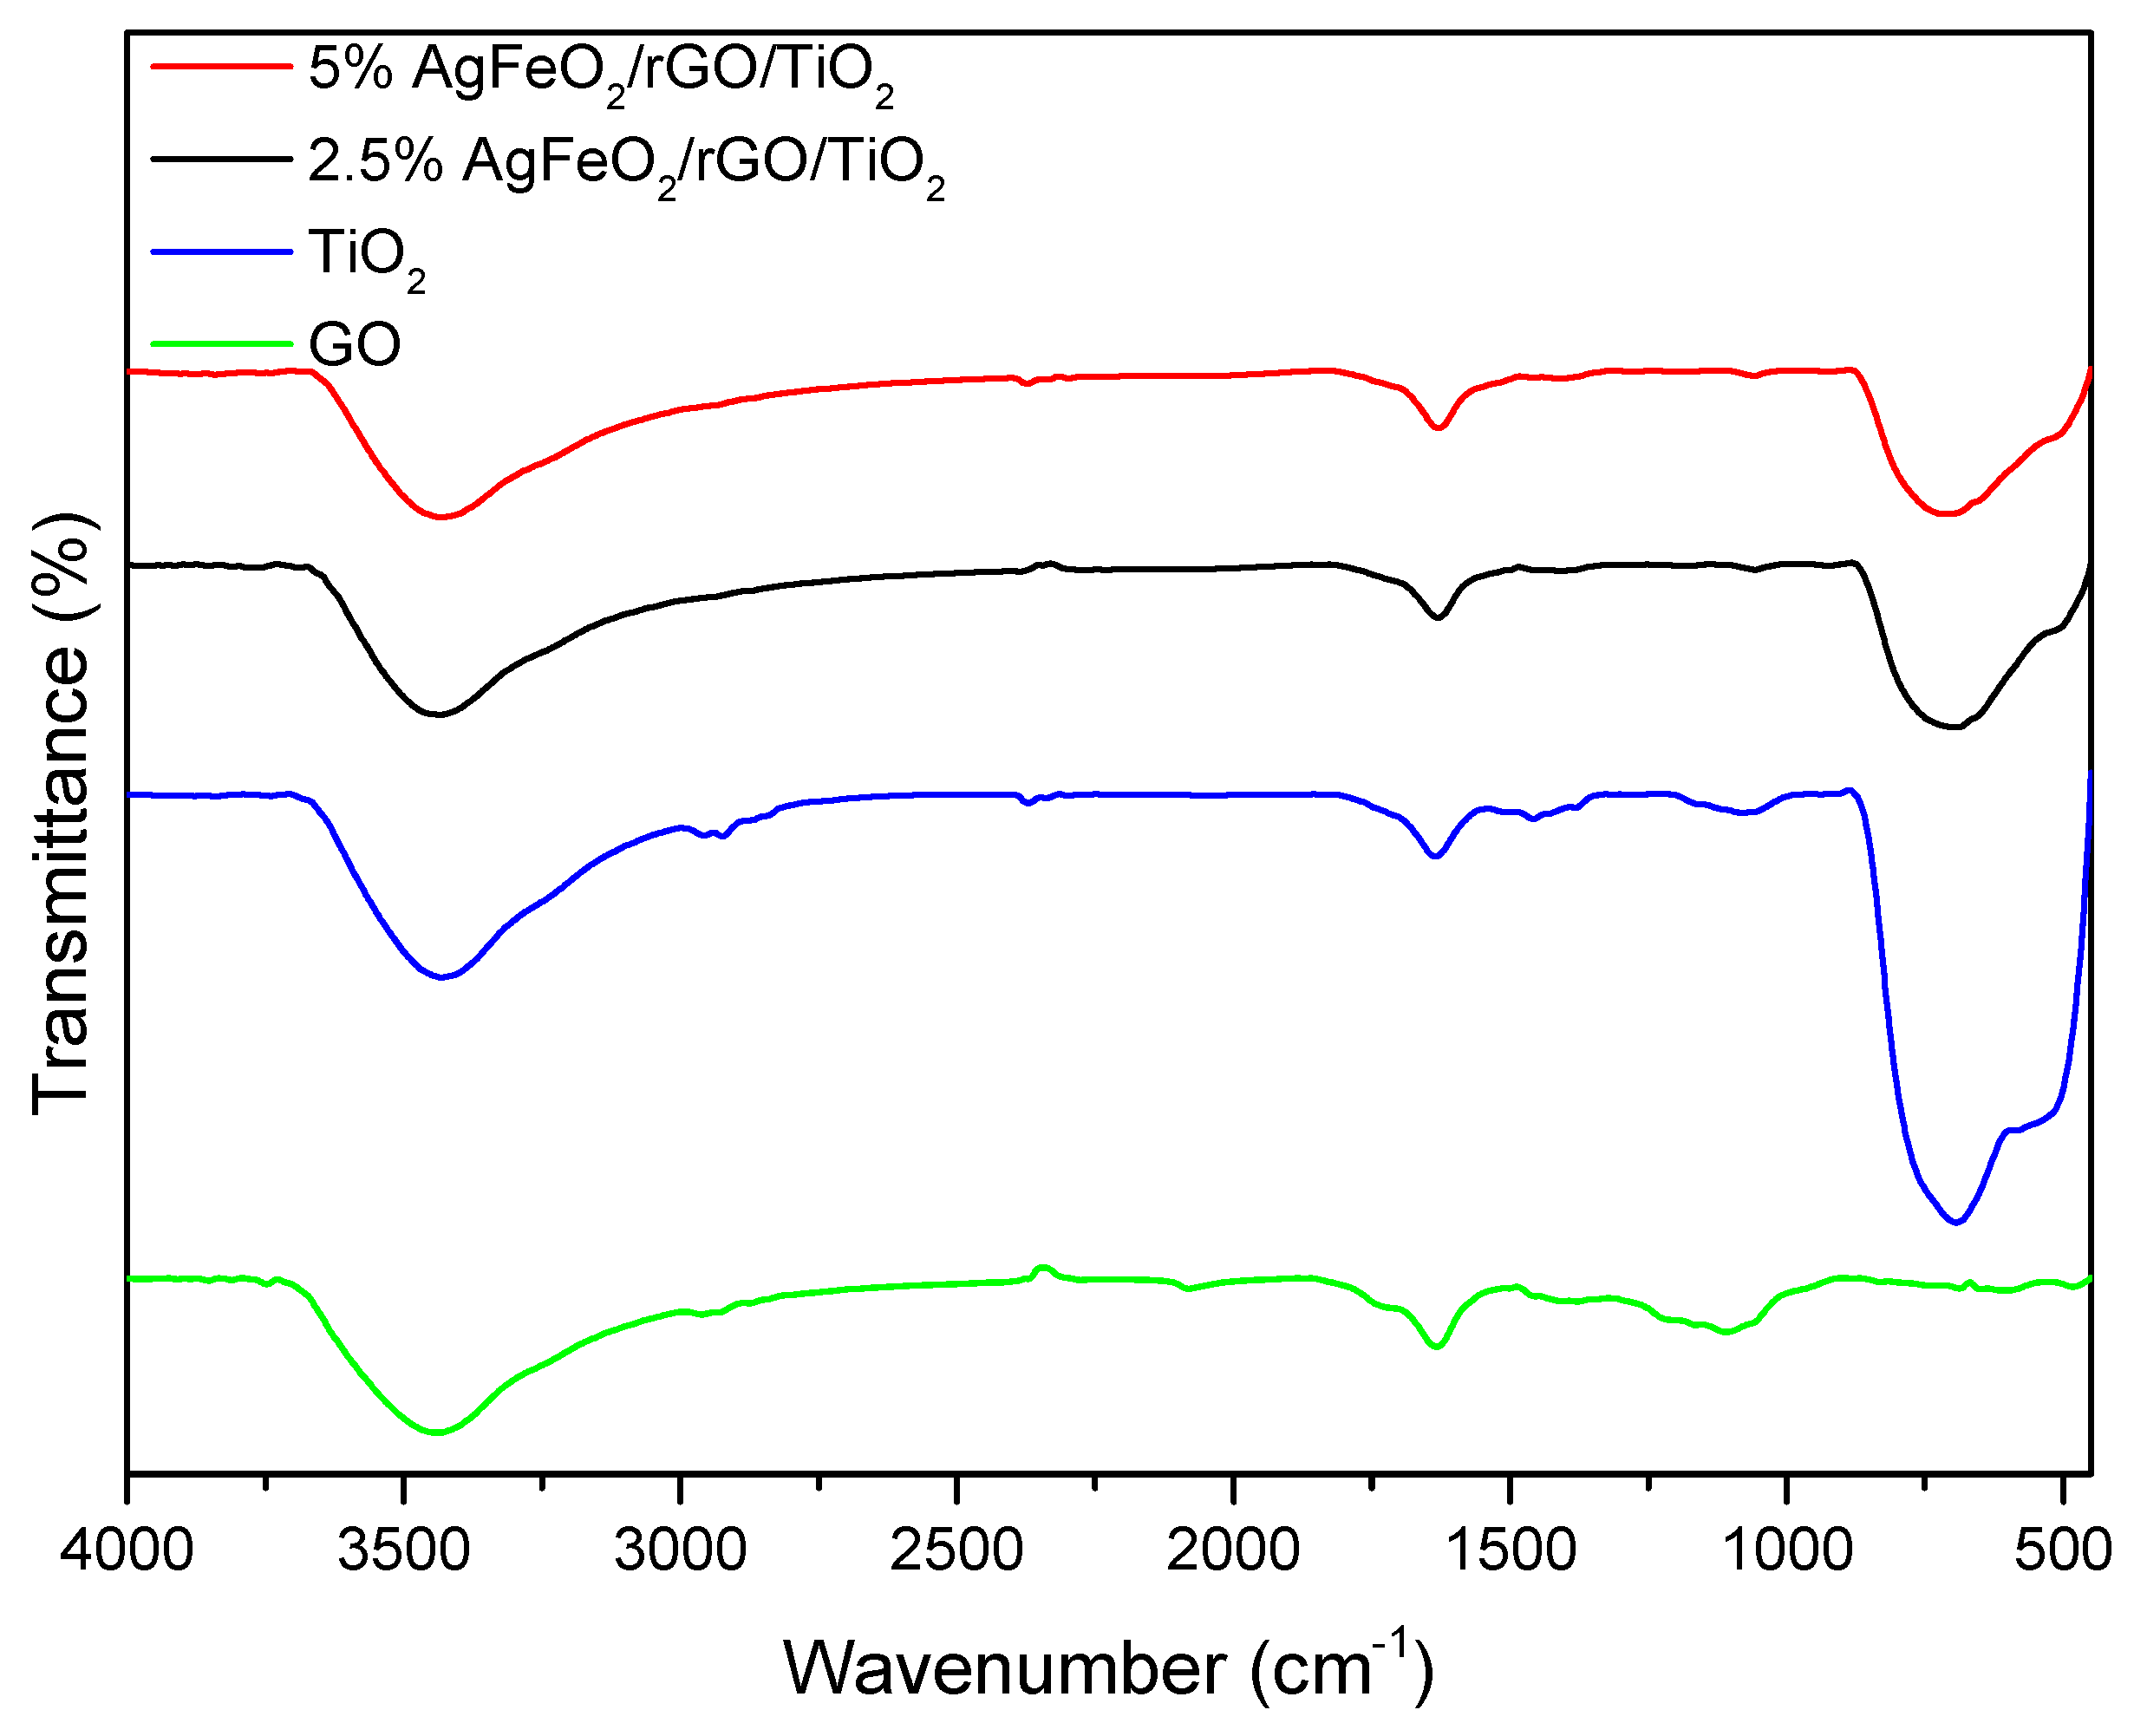
3.2. FTIR Analysis
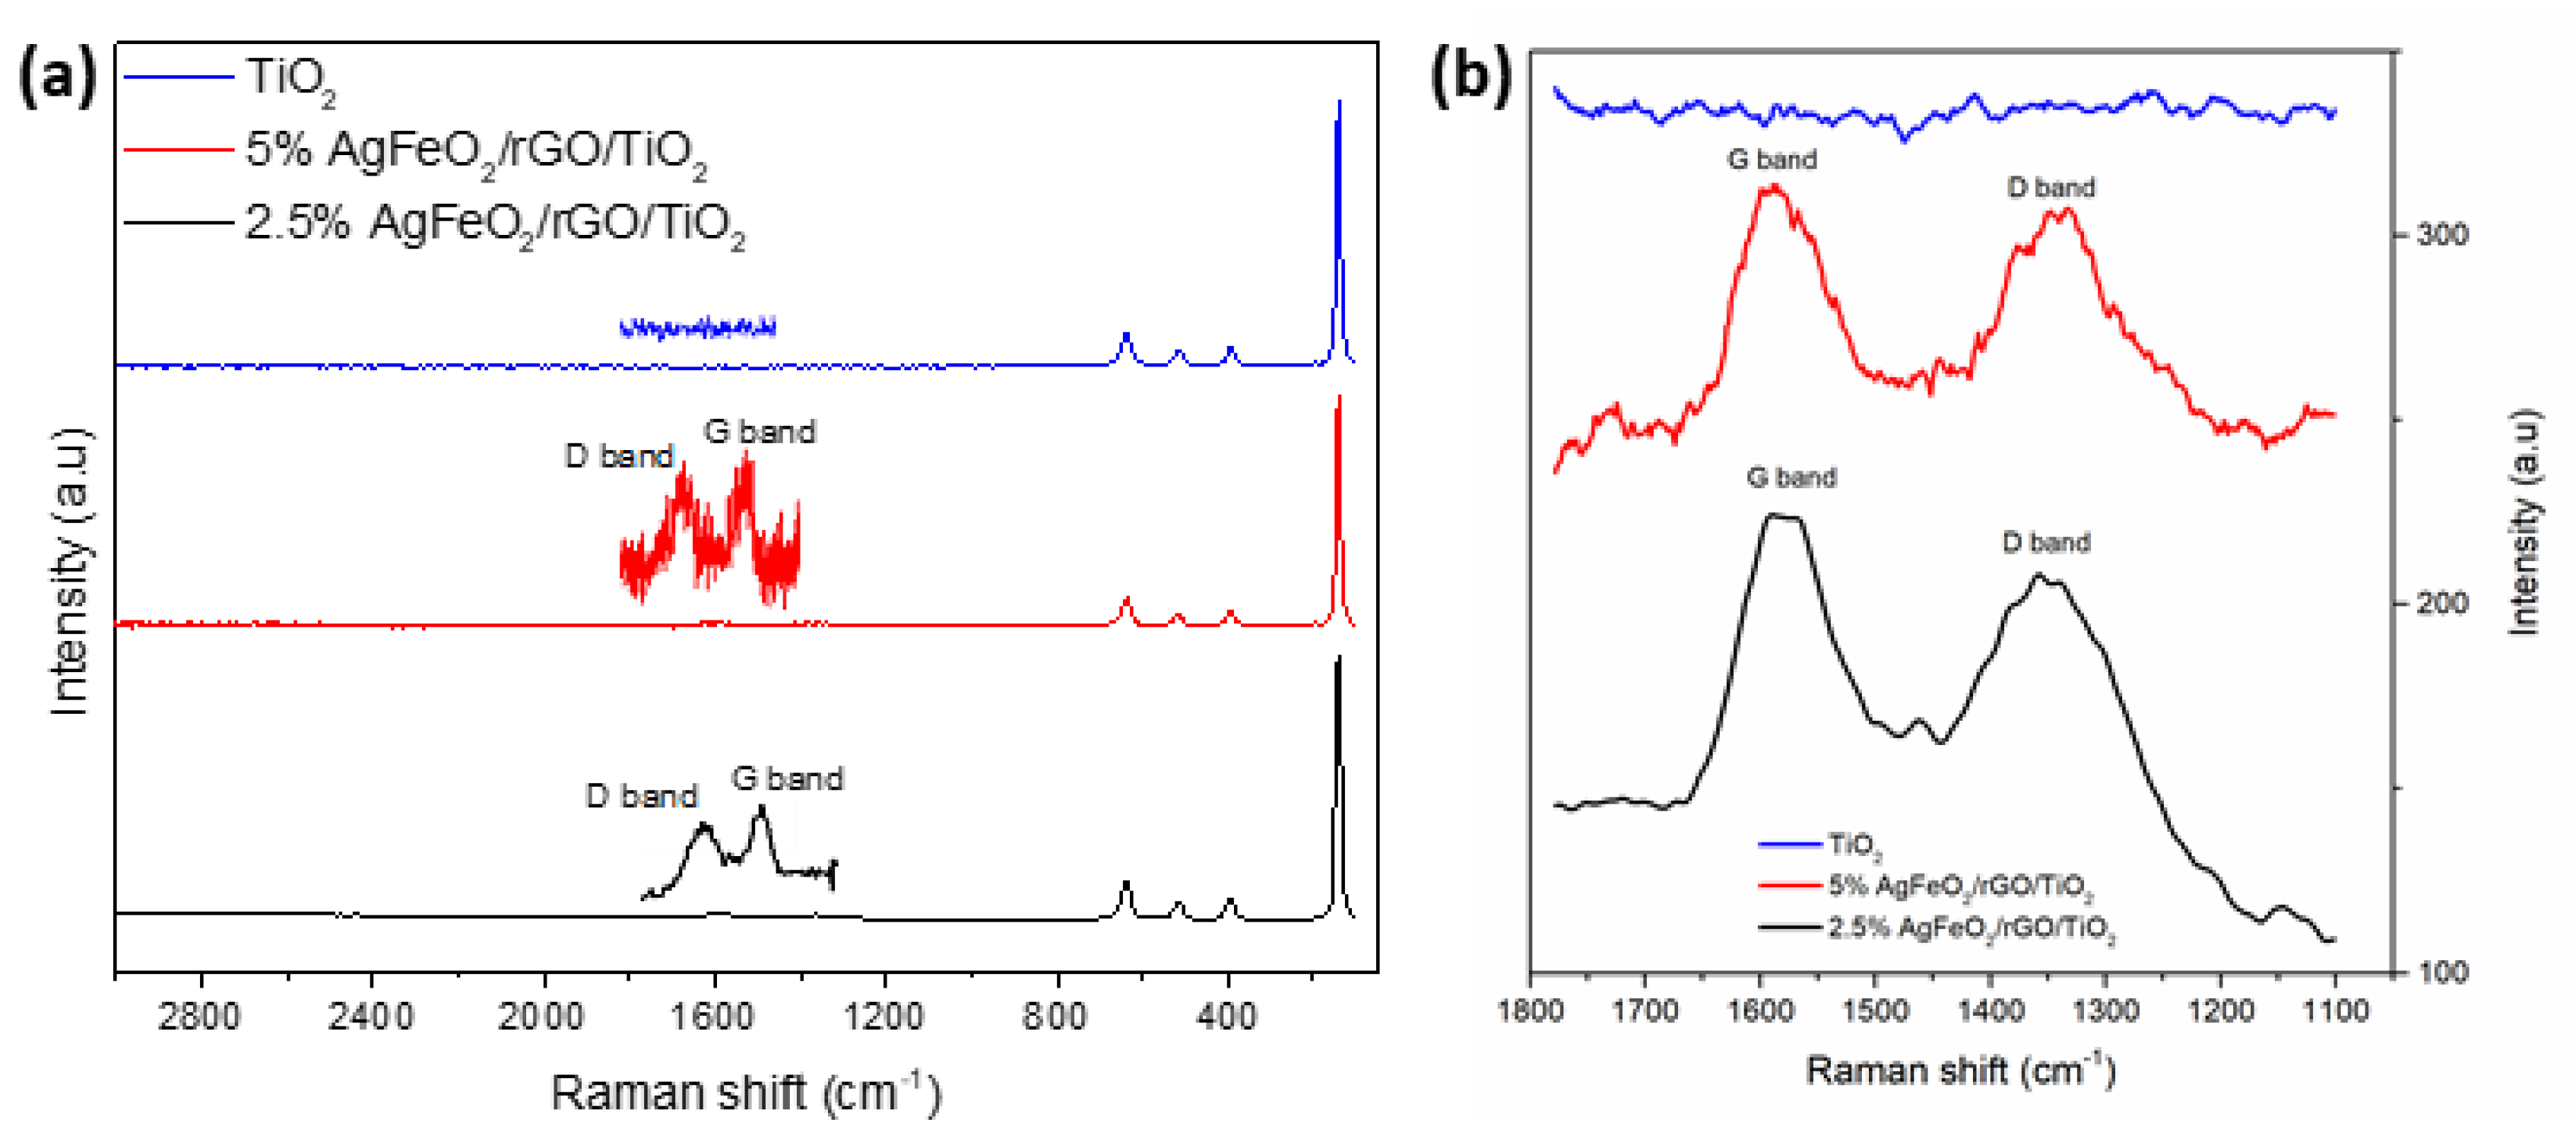
3.3. Raman Analysis
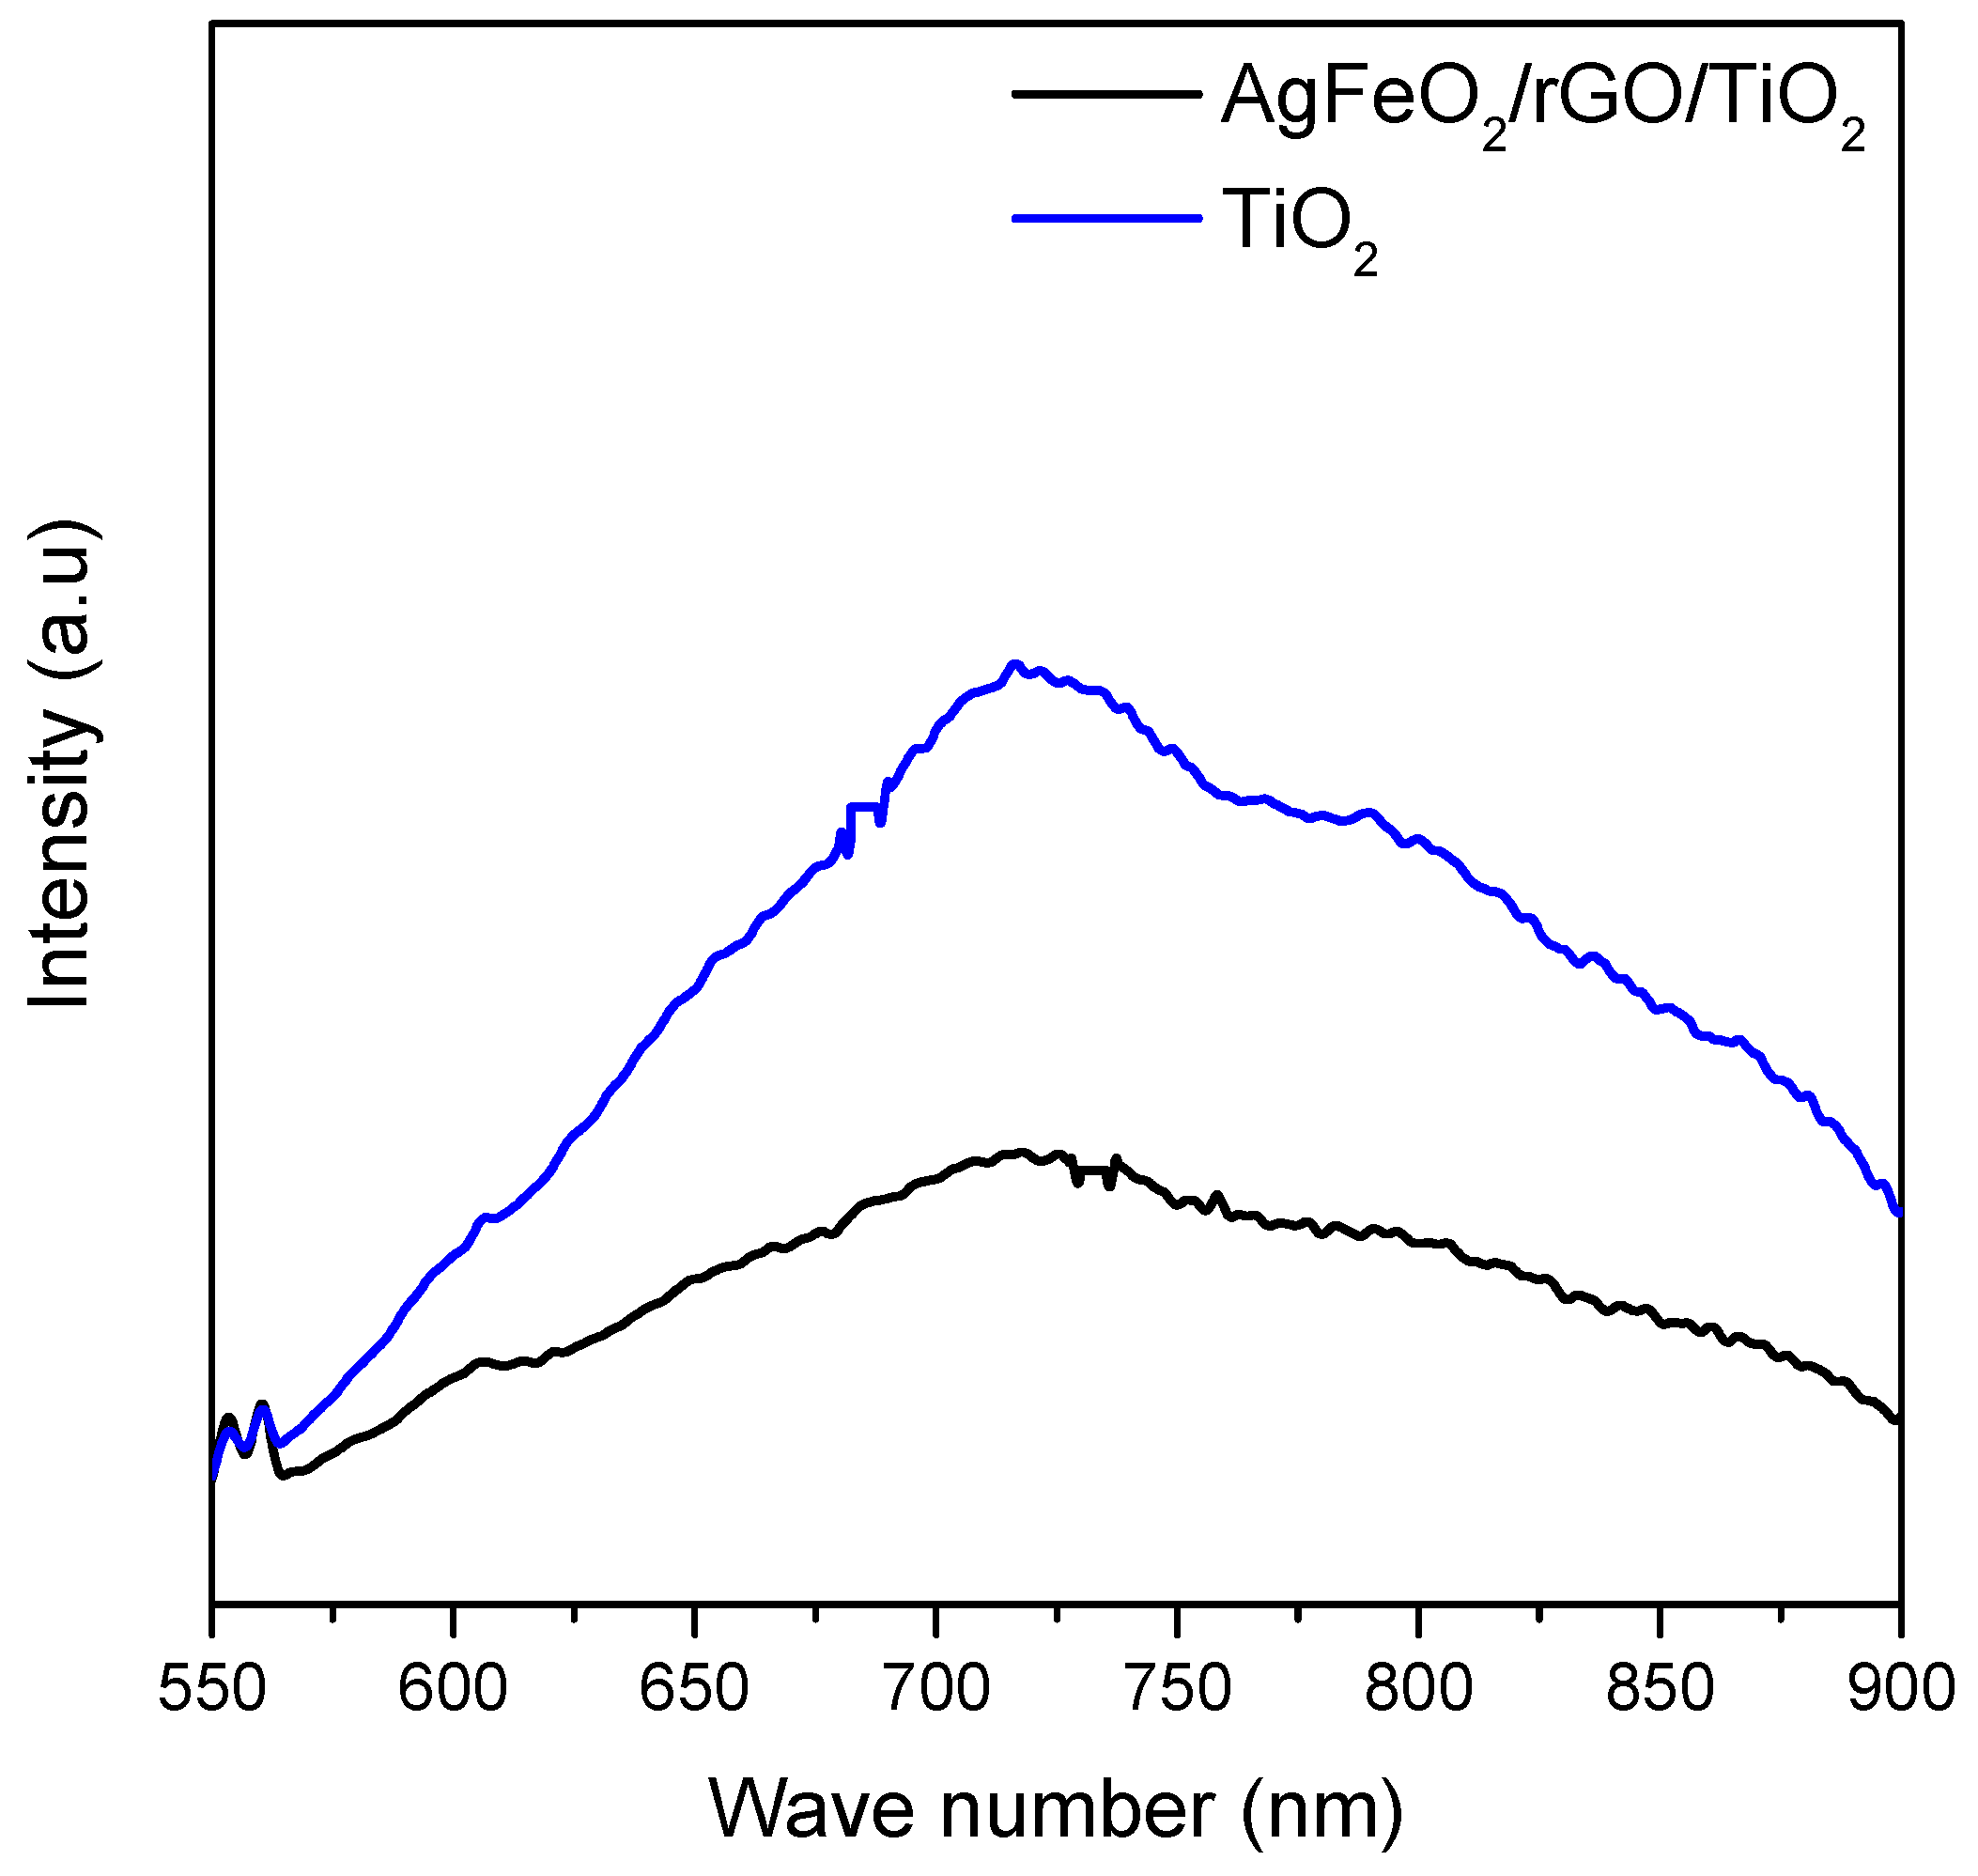
3.4. PL Spectroscopy
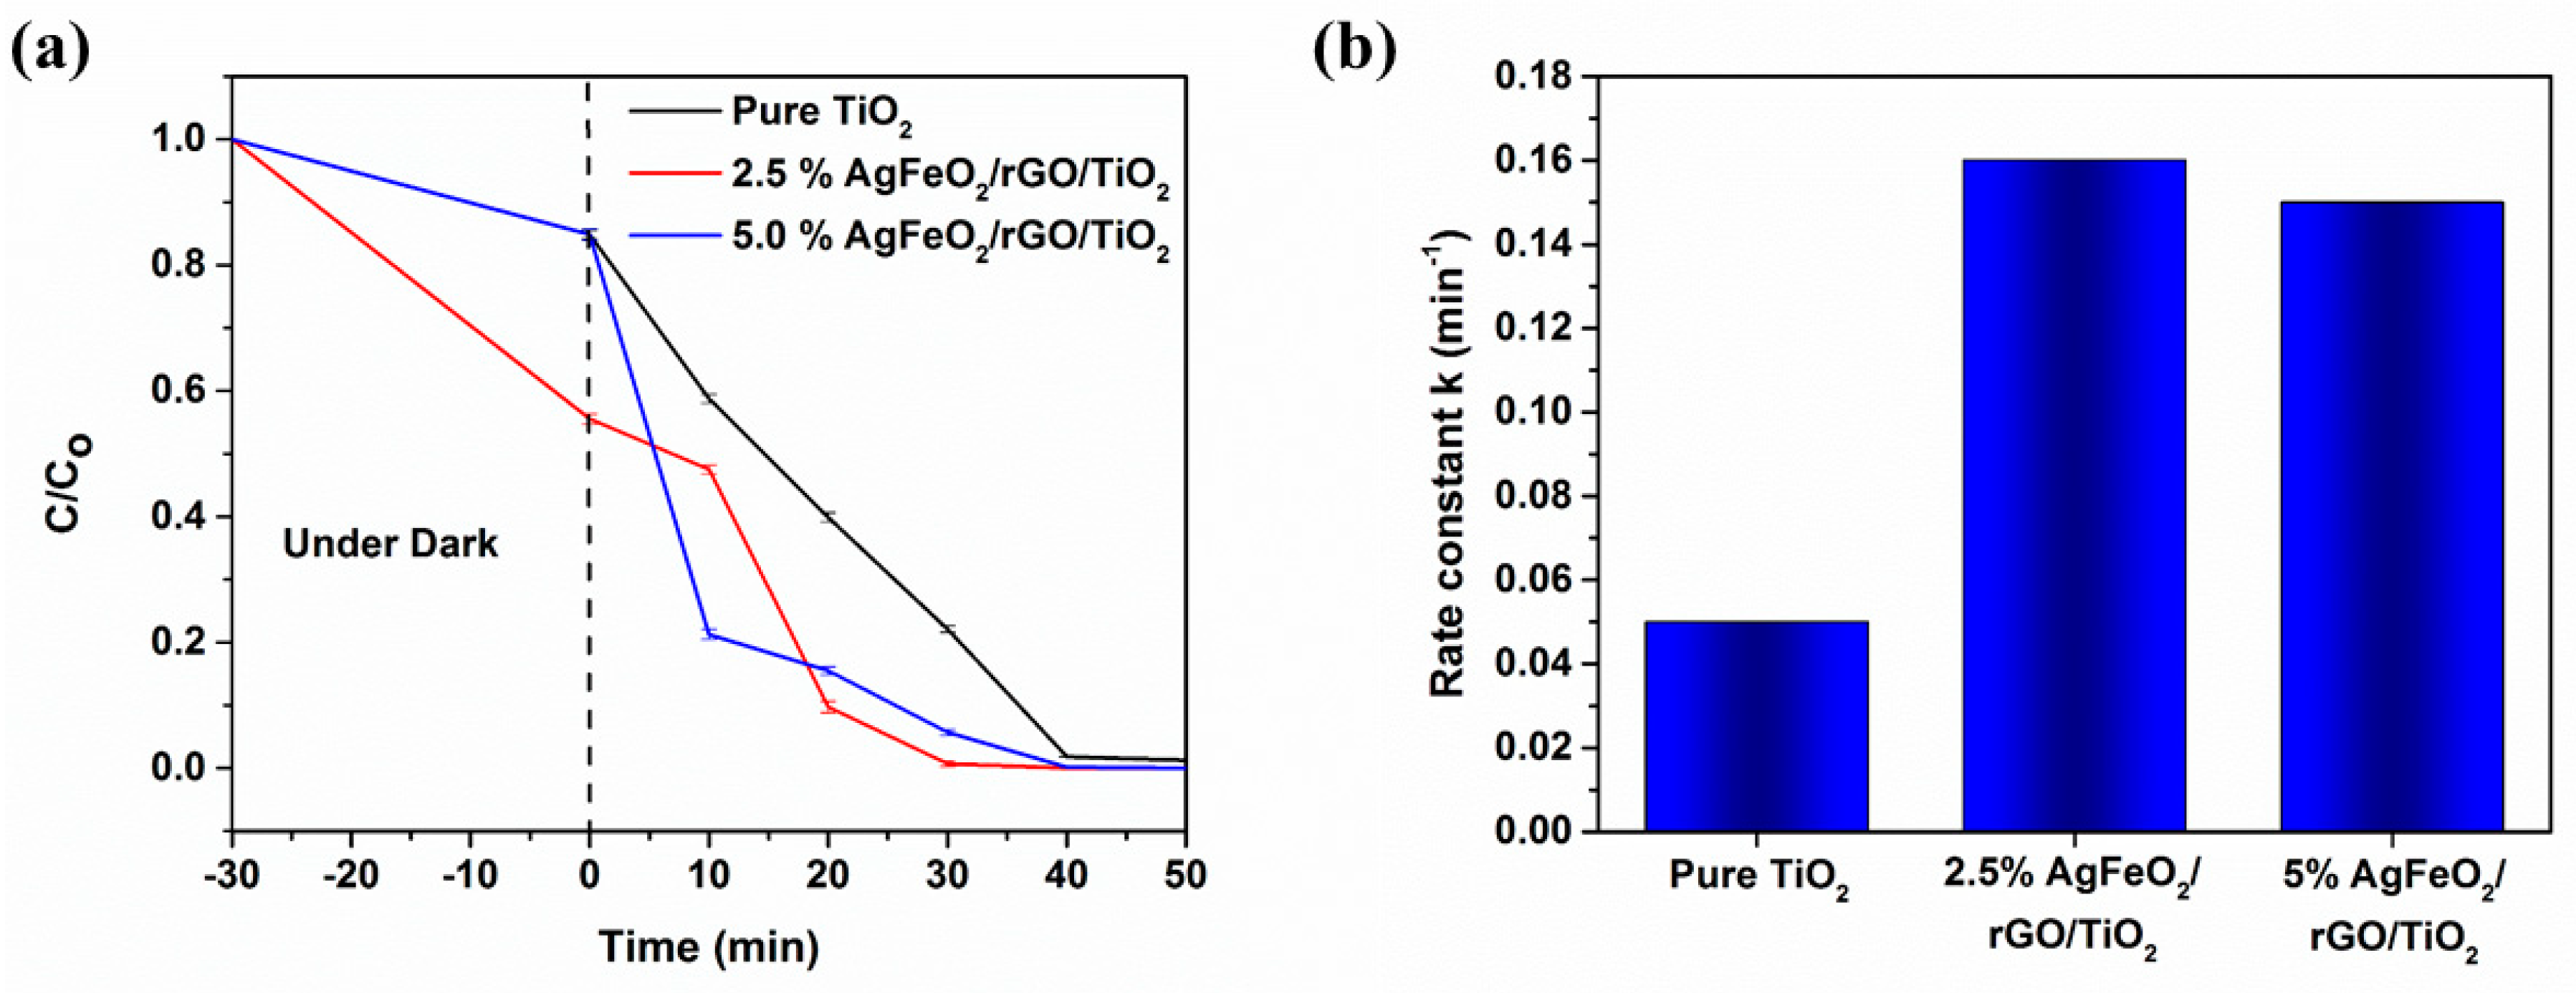
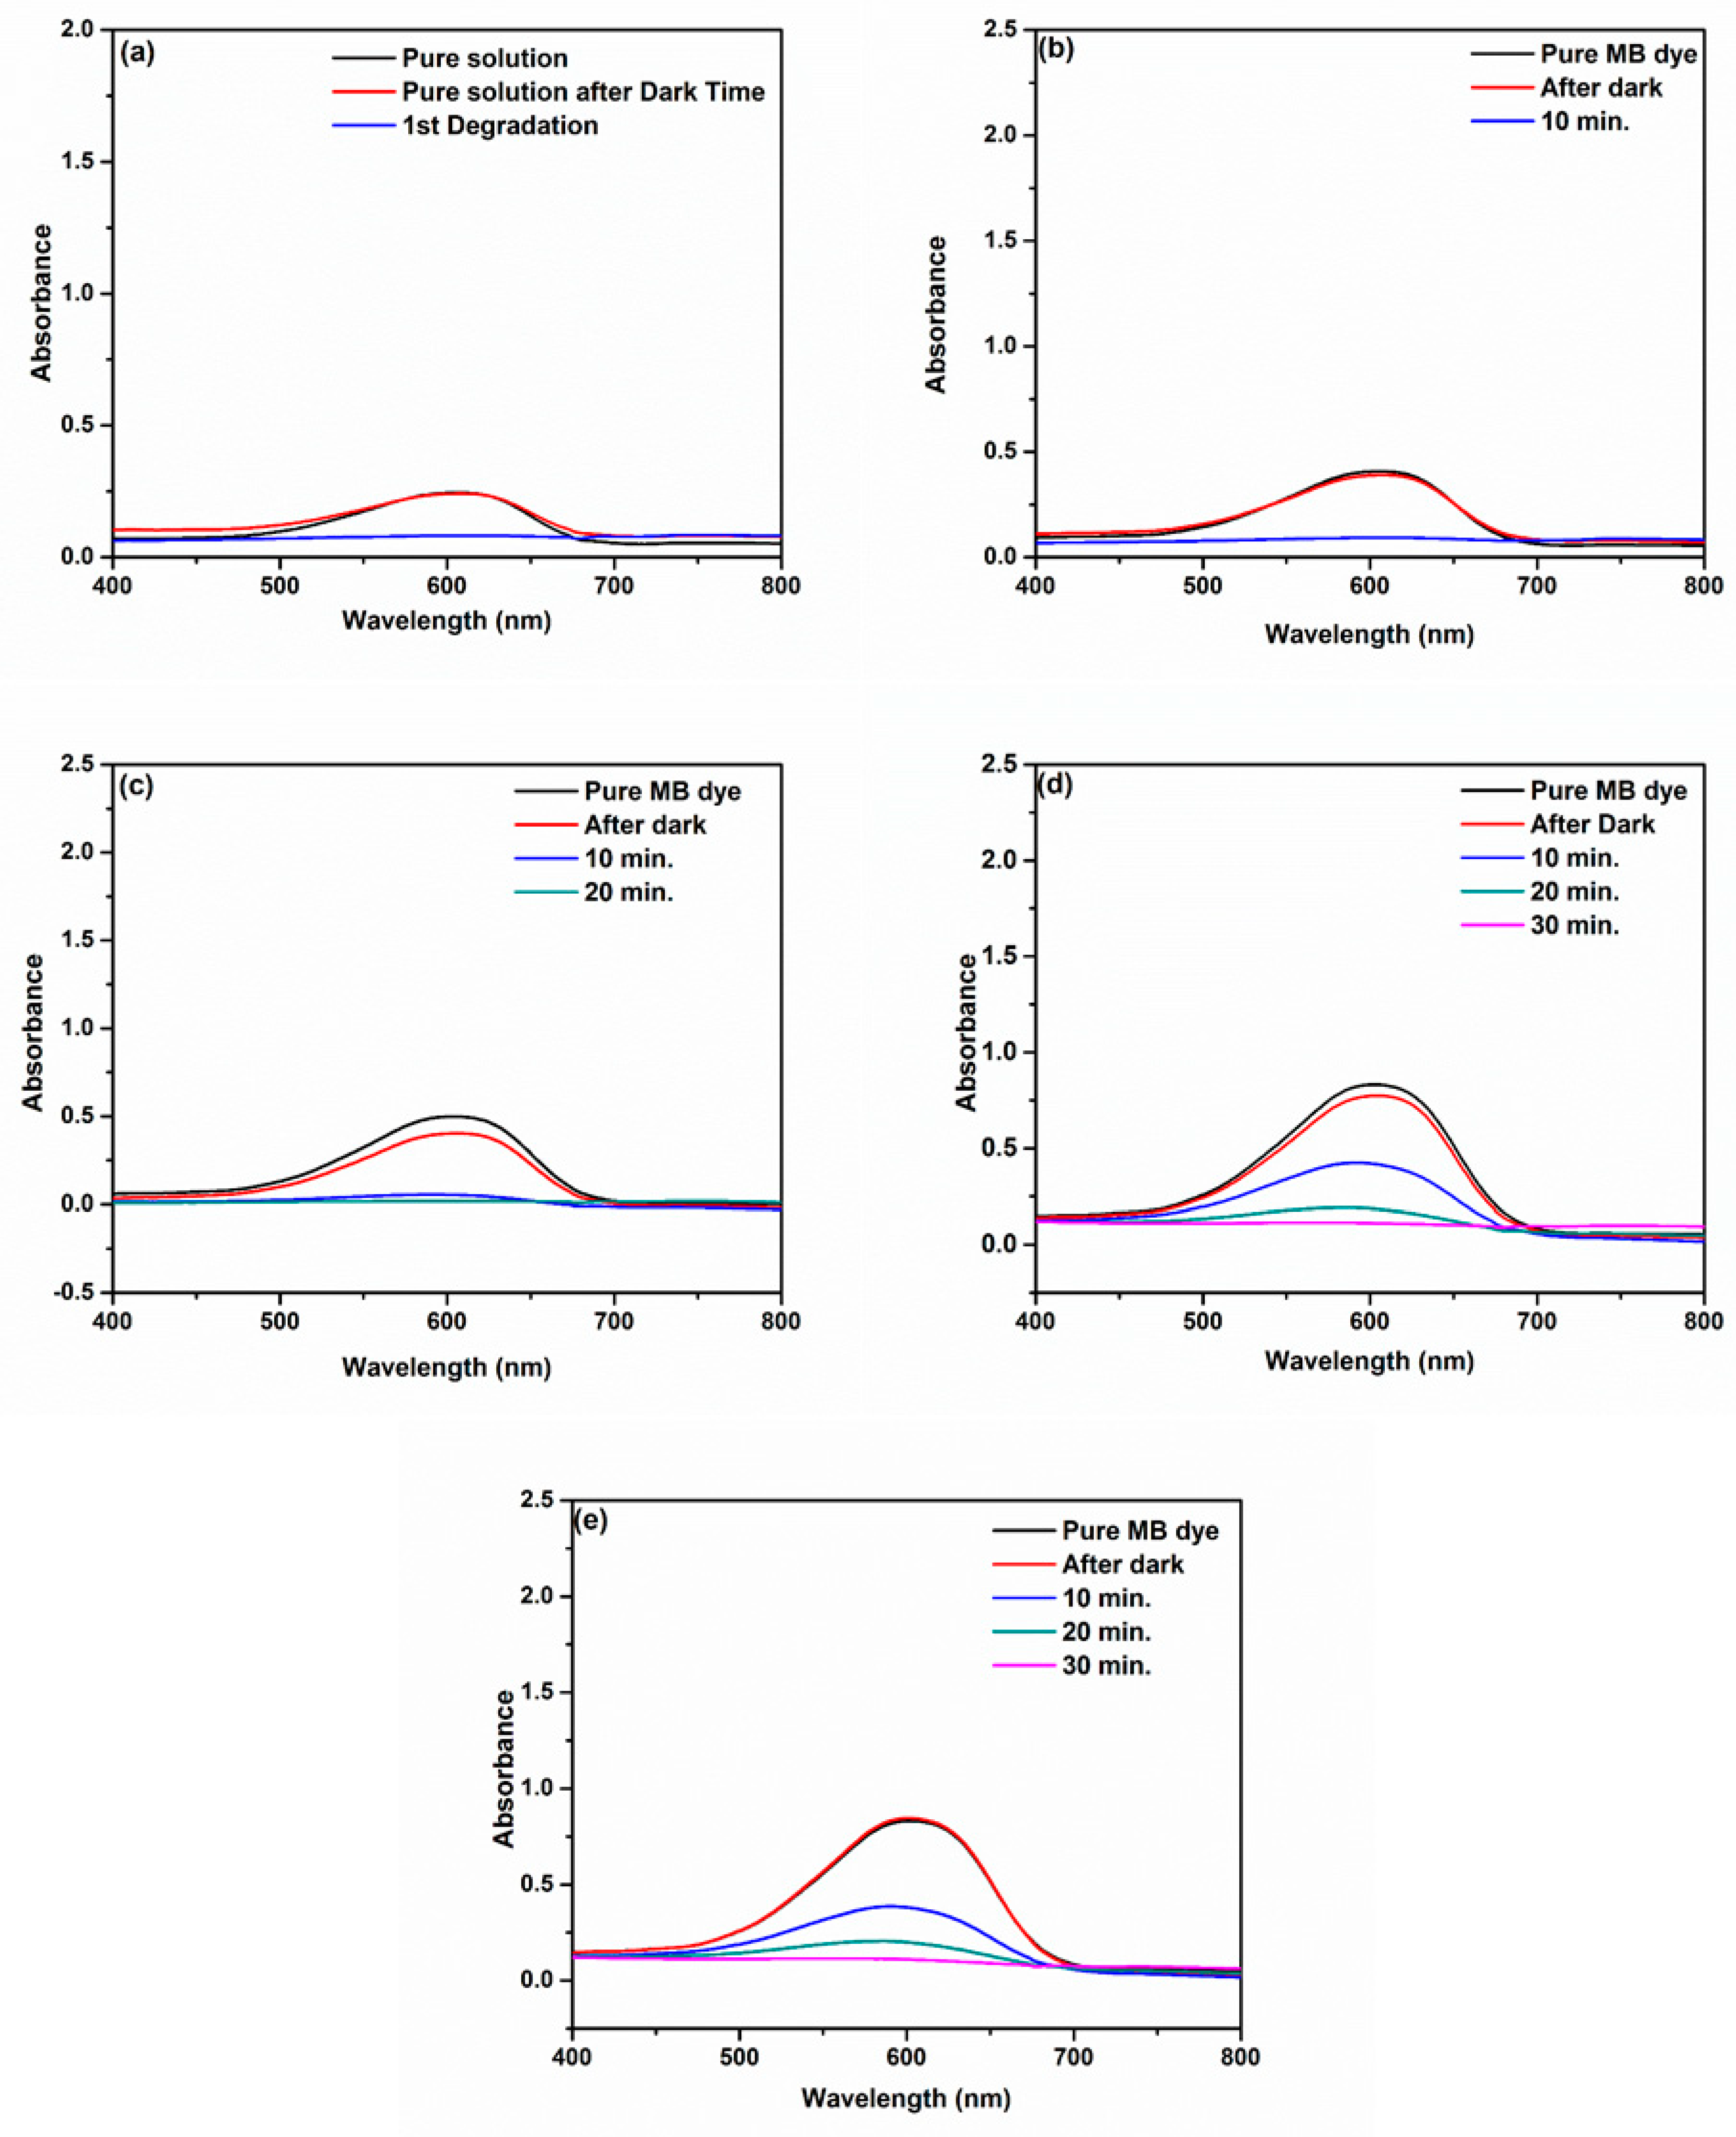
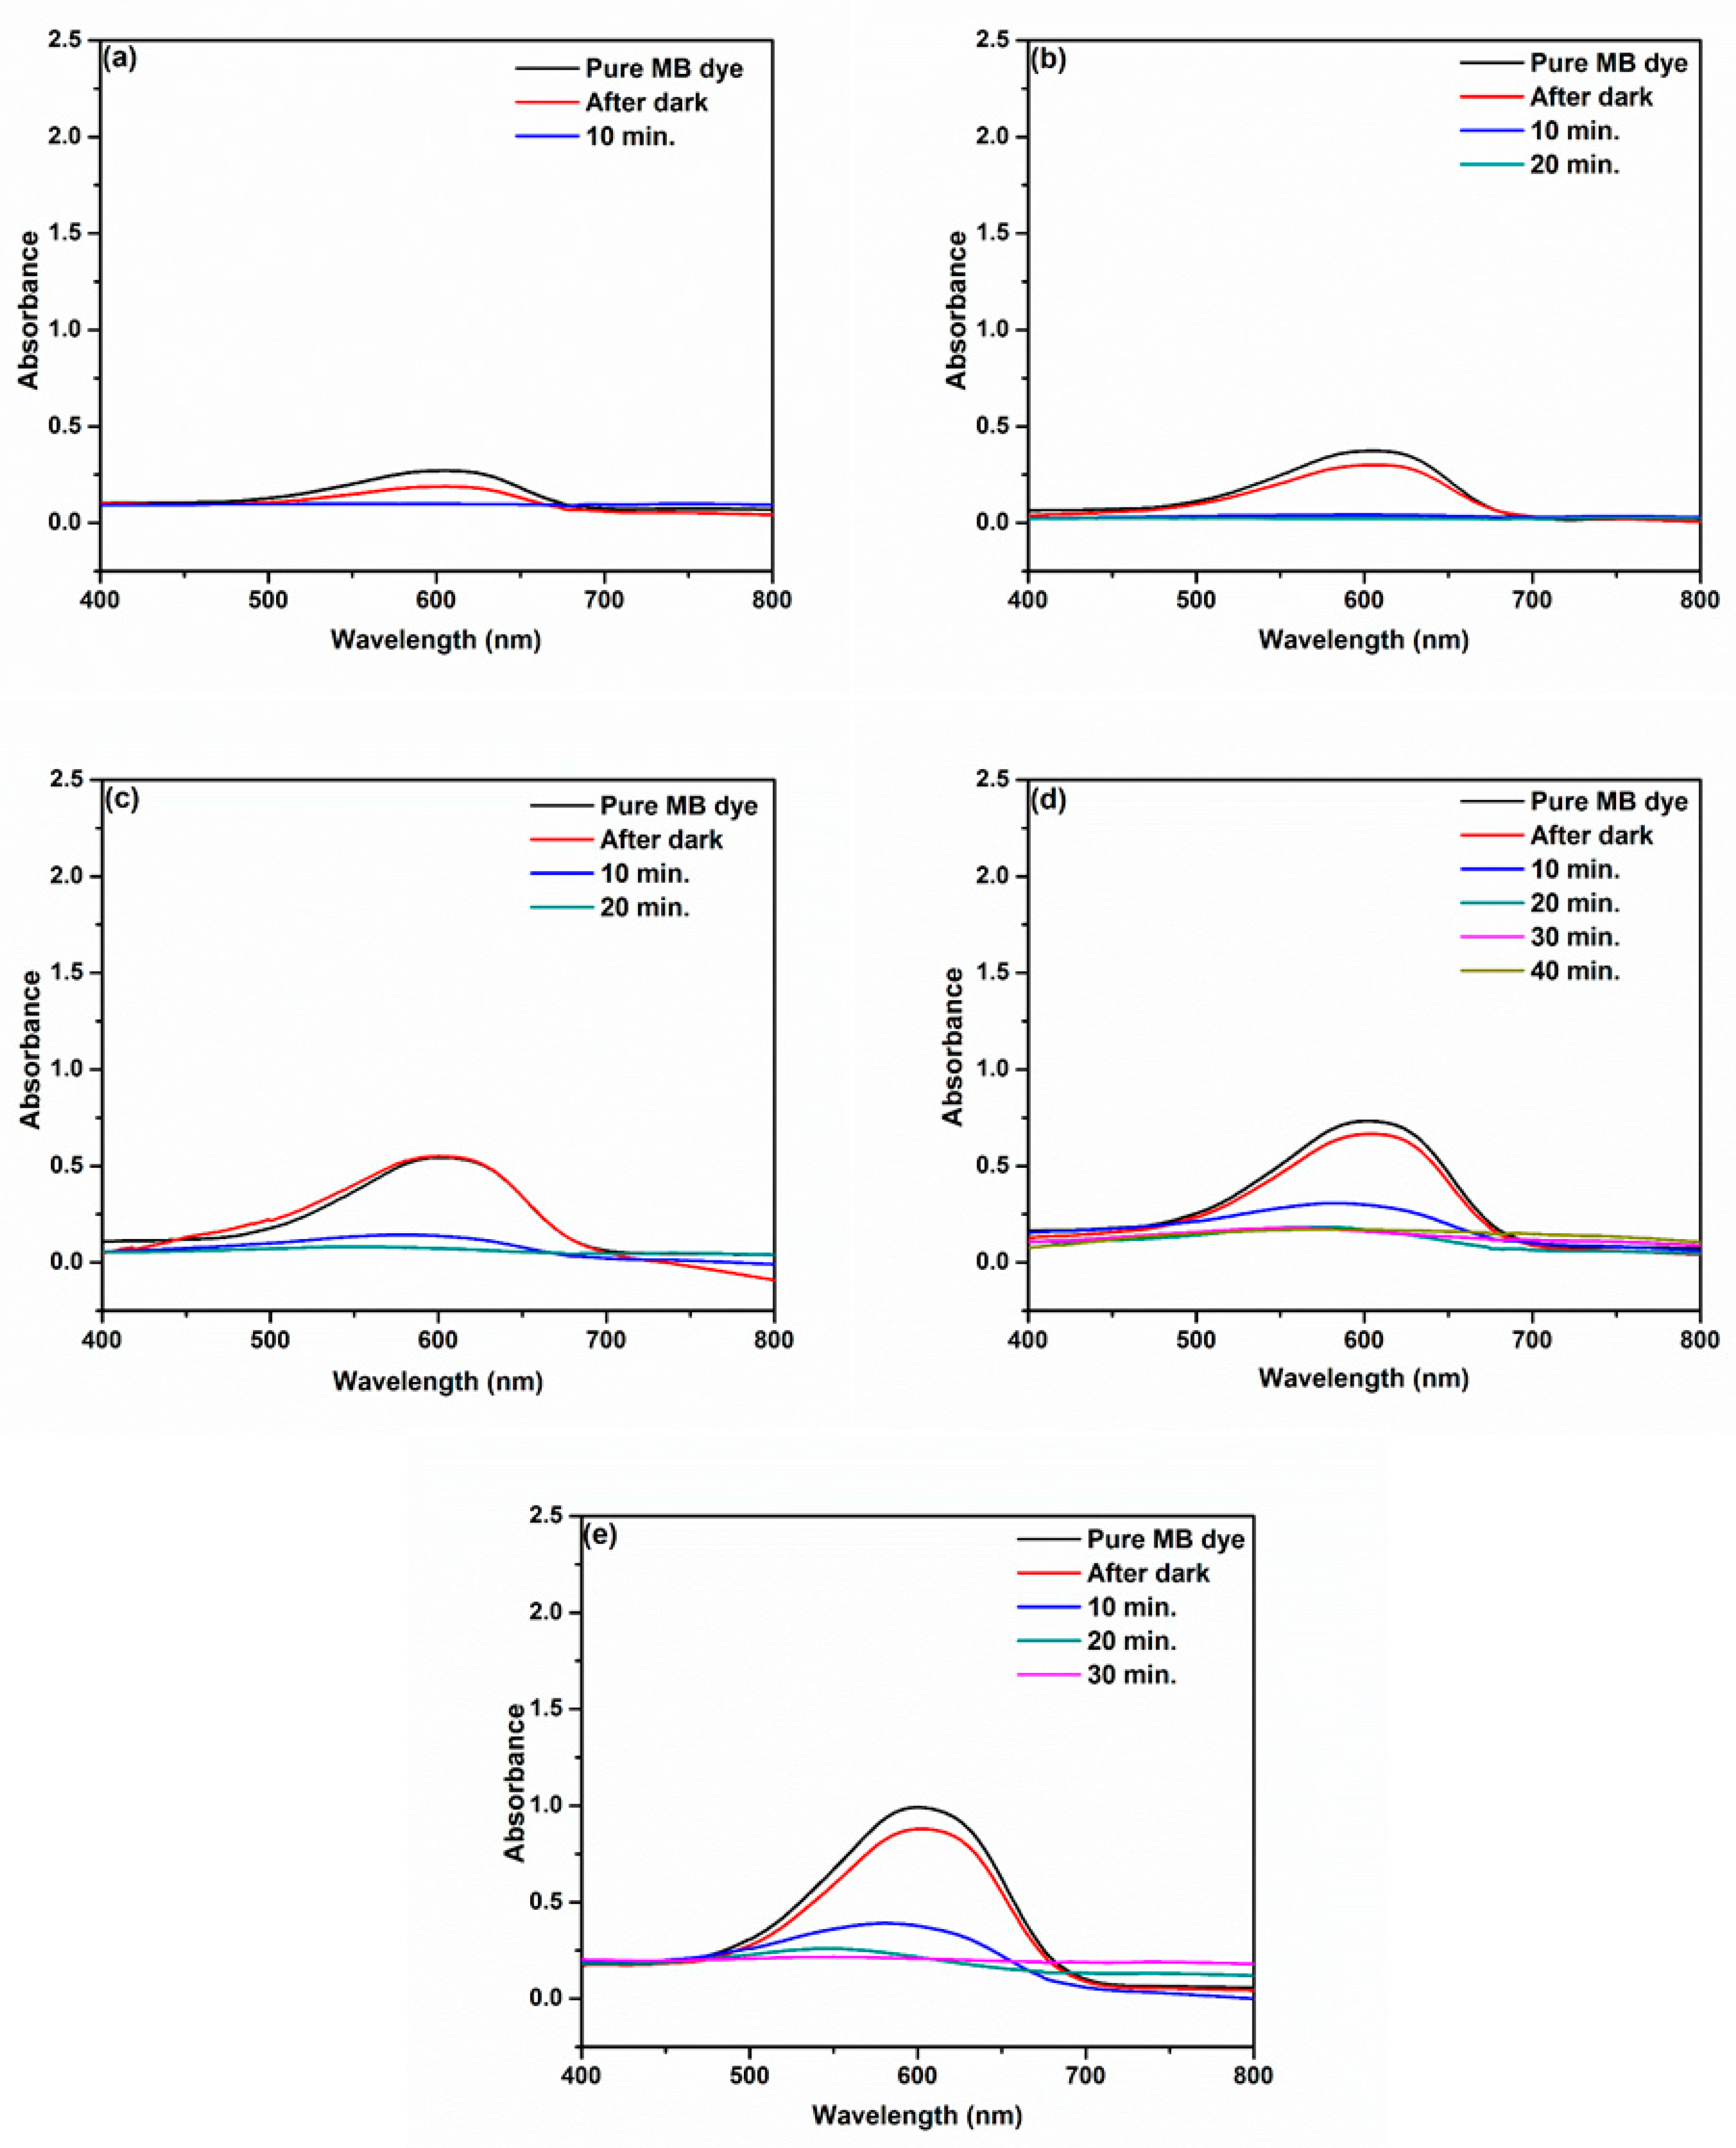
3.5. Photocatalytic Activity Test
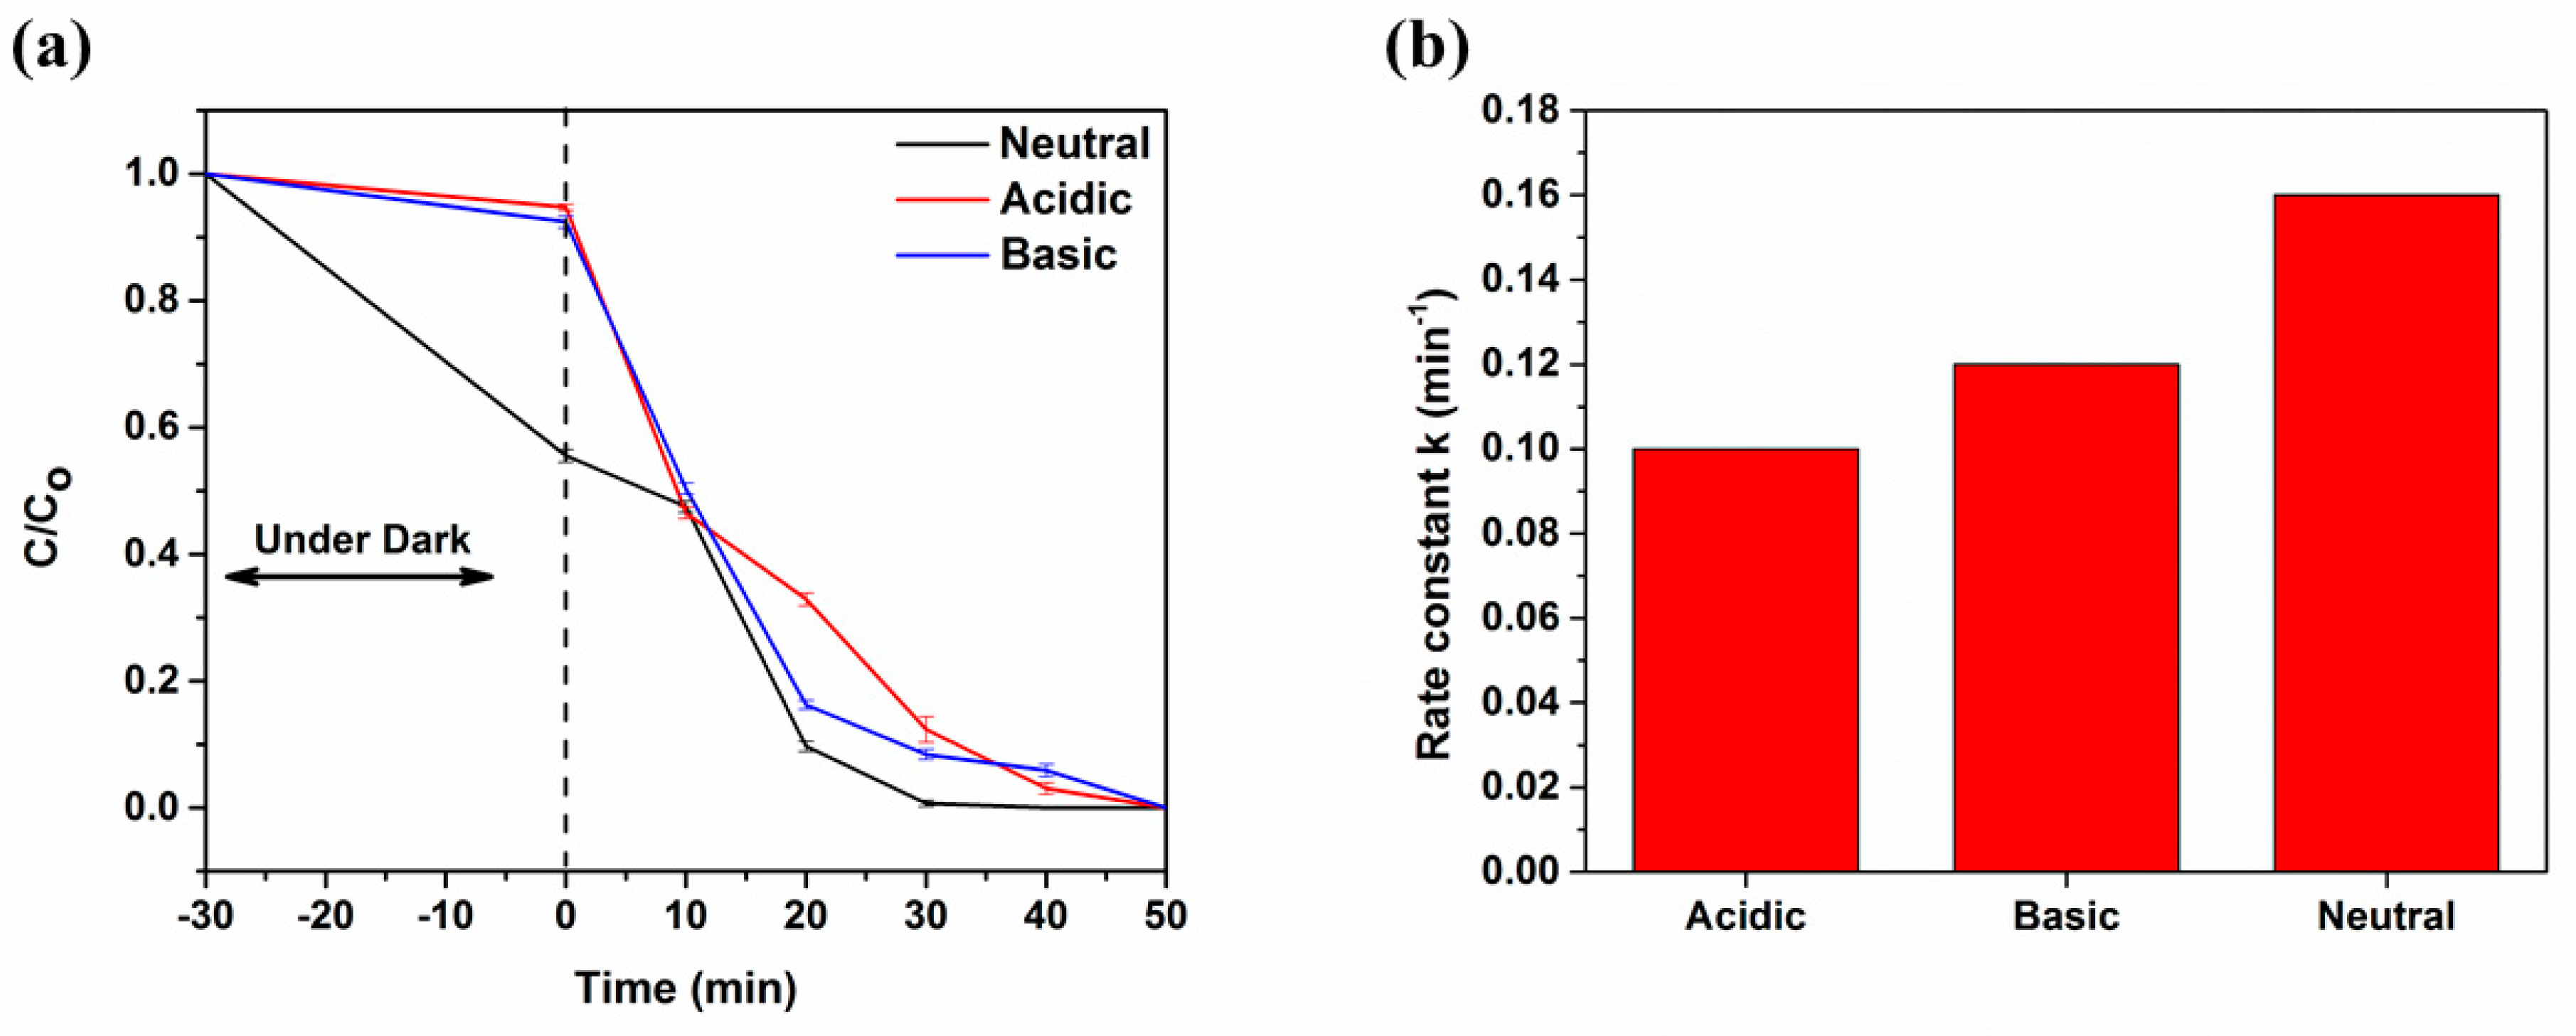
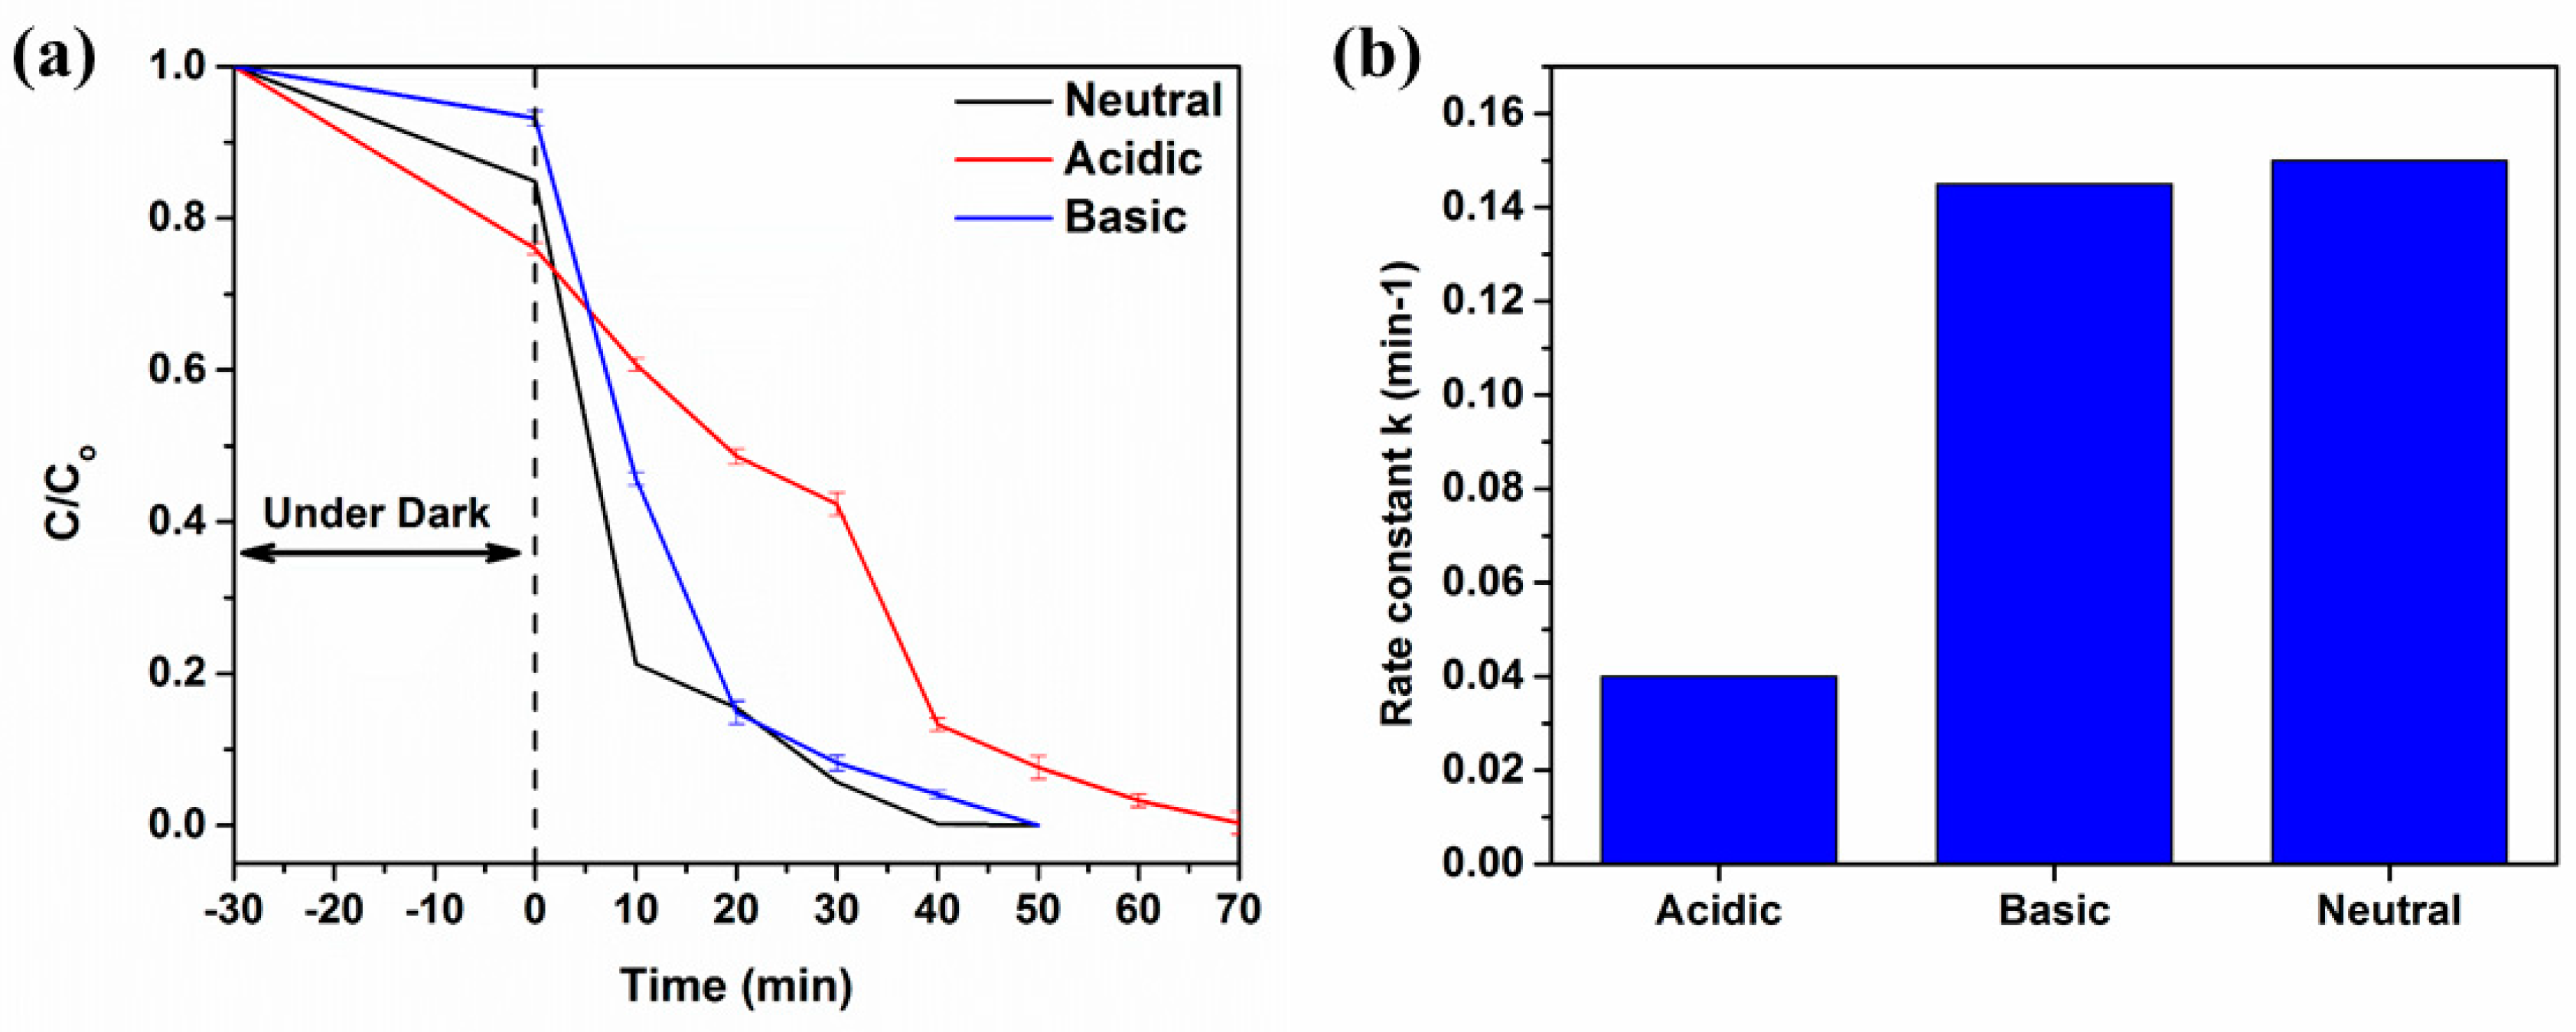
Effect of Parameters
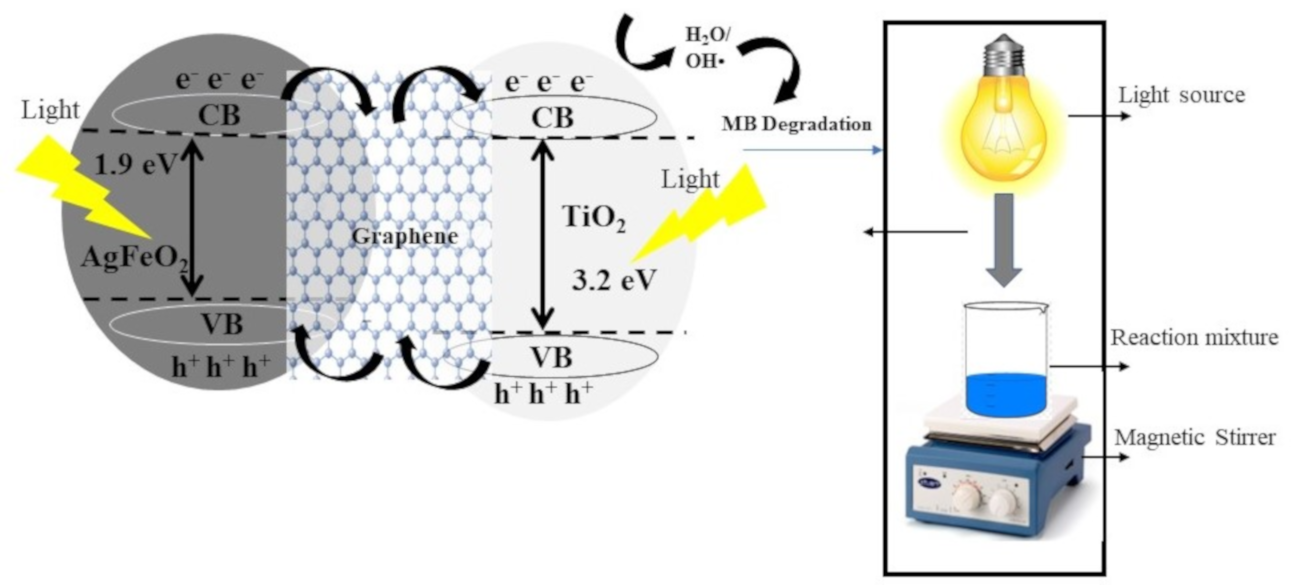
3.6. Mechanism of Photocatalytic Activity
4. Conclusions
Supplementary Materials
Author Contributions
Funding
Conflicts of Interest
References
- Denchak, M. The dirty fight over Canadian tar sands oil. NRDC. Dec. 2015, 31, 2015. [Google Scholar]
- Ayadi, I.; Souissi, Y.; Jlassi, I.; Peixoto, F.P.; Mnif, W. Chemical Synonyms, Molecular Structure and Toxicological Risk Assessment of Synthetic Textile Dyes: A Critical Review. J. Dev. Drugs 2015, 5, 2. [Google Scholar] [CrossRef] [Green Version]
- Rahman, R.A.; Ibrahim, H.A.; Hung, Y.-T. Liquid Radioactive Wastes Treatment: A Review. Water 2011, 3, 551–565. [Google Scholar] [CrossRef] [Green Version]
- Rauf, M.; Ashraf, S.S. Fundamental principles and application of heterogeneous photocatalytic degradation of dyes in solution. Chem. Eng. J. 2009, 151, 10–18. [Google Scholar] [CrossRef]
- Han, S.; Li, J.; Yang, K.; Lin, J. Fabrication of a β-Bi2O3/BiOI heterojunction and its efficient photocatalysis for organic dye removal. Chin. J. Catal. 2015, 36, 2119–2126. [Google Scholar] [CrossRef]
- Mendez, P.; Manríquez, J.; Rodriguez, F.J.; Bustos, E.; Rodriguez, A.; Ortiz-Frade, L.; Godínez, L.A. Study of the Conductivity Mechanism of Non-Illuminated TiO2 Electrodes Modified with Bipyridine- and Terpyridine-Ru(II) Complexes. J. Electrochem. Soc. 2013, 160, H836–H840. [Google Scholar] [CrossRef]
- Park, N.-G.; Van De Lagemaat, J.; Frank, A.J. Comparison of Dye-Sensitized Rutile- and Anatase-Based TiO2 Solar Cells. J. Phys. Chem. B 2000, 104, 8989–8994. [Google Scholar] [CrossRef] [Green Version]
- Riegel, G.; Bolton, J.R. Photocatalytic Efficiency Variability in TiO2 Particles. J. Phys. Chem. 1995, 99, 4215–4224. [Google Scholar] [CrossRef]
- Chen, C.-C.; Li, X.; Ma, W.; Zhao, J.; Hidaka, H.; Serpone, N. Effect of Transition Metal Ions on the TiO2-Assisted Photodegradation of Dyes under Visible Irradiation: A Probe for the Interfacial Electron Transfer Process and Reaction Mechanism. J. Phys. Chem. B 2002, 106, 318–324. [Google Scholar] [CrossRef]
- Fujishima, A.; Zhang, X.; Tryk, D. TiO2 photocatalysis and related surface phenomena. Surf. Sci. Rep. 2008, 63, 515–582. [Google Scholar] [CrossRef]
- Lui, G.; Liao, J.-Y.; Duan, A.; Zhang, Z.; Fowler, M.; Yu, A. Graphene-wrapped hierarchical TiO2 nanoflower composites with enhanced photocatalytic performance. J. Mater. Chem. A 2013, 1, 12255. [Google Scholar] [CrossRef] [Green Version]
- Jo, W.-K.; Kang, H.-J. Titanium dioxide–graphene oxide composites with different ratios supported by Pyrex tube for photocatalysis of toxic aromatic vapors. Powder Technol. 2013, 250, 115–121. [Google Scholar] [CrossRef]
- Kerkez-Kuyumcu, Ö.; Kibar, E.; Dayıoğlu, K.; Gedik, F.; Akın, A.N.; Özkara-Aydınoğlu, Ş. A comparative study for removal of different dyes over M/TiO2 (M = Cu, Ni, Co, Fe, Mn and Cr) photocatalysts under visible light irradiation. J. Photochem. Photobiol. A Chem. 2015, 311, 176–185. [Google Scholar] [CrossRef]
- Asilturk, M.; Sayılkan, F.; Arpaç, E. Effect of Fe3+ ion doping to TiO2 on the photocatalytic degradation of Malachite Green dye under UV and vis-irradiation. J. Photochem. Photobiol. A Chem. 2009, 203, 64–71. [Google Scholar] [CrossRef]
- Pastrana-Martínez, L.M.; Morales-Torres, S.; Likodimos, V.; Figueiredo, J.L.; Faria, J.L.; Falaras, P.; Silva, A.M. Advanced nanostructured photocatalysts based on reduced graphene oxide–TiO2 composites for degradation of diphenhydramine pharmaceutical and methyl orange dye. Appl. Catal. B Environ. 2012, 123, 241–256. [Google Scholar] [CrossRef]
- Wang, F.; Zhang, K. Reduced graphene oxide–TiO2 nanocomposite with high photocatalystic activity for the degradation of rhodamine B. J. Mol. Catal. A Chem. 2011, 345, 101–107. [Google Scholar] [CrossRef]
- Yin, X.; Zhang, H.; Xu, P.; Han, J.; Li, J.; He, M. Simultaneous N-doping of reduced graphene oxide and TiO2 in the composite for visible light photodegradation of methylene blue with enhanced performance. RSC Adv. 2013, 3, 18474. [Google Scholar] [CrossRef]
- Muthirulan, P. Fabrication And Characterization Of Efficient Hybrid Photocatalysts Based On Titania And Graphene For Acid Orange Seven Dye Degradation Under UV Irradiation. Adv. Mater. Lett. 2014, 5, 163–171. [Google Scholar] [CrossRef]
- Shehzad, N.; Tahir, M.; Johari, K.; Murugesan, T.; Hussain, M. A critical review on TiO2 based photocatalytic CO2 reduction system: Strategies to improve efficiency. J. CO2 Util. 2018, 26, 98–122. [Google Scholar] [CrossRef]
- Shehzad, N.; Maafa, I.M.; Johari, K.; Hafeez, A.; Akhter, P.; Shabir, M.; Raza, A.; Anjum, H.; Hussain, M.; Tahir, M. Carbon Nanotubes Incorporated Z-Scheme Assembly of AgBr/TiO2 for Photocatalytic Hydrogen Production under Visible Light Irradiations. Nanomaterials 2019, 9, 1767. [Google Scholar] [CrossRef] [Green Version]
- Samsudin, M.F.R.; Mahmood, A.; Sufian, S. Enhanced Photocatalytic Degradation of Wastewater over RGO-TiO2/BivO4 photocatalyts Under Solar Light Irradiation. J. Mol. Liq. 2018, 268, 26–36. [Google Scholar] [CrossRef]
- Ranjith, R.; Renganathan, V.; Chen, S.-M.; Selvan, N.S.; Rajam, P.S. Green synthesis of reduced graphene oxide supported TiO2/Co3O4 nanocomposite for photocatalytic degradation of methylene blue and crystal violet. Ceram. Int. 2019, 45, 12926–12933. [Google Scholar] [CrossRef]
- Yin, L.; Shi, Y.; Lu, L.; Fang, R.; Wan, X.-K.; Shi, H. A Novel Delafossite Structured Visible-Light Sensitive AgFeO2 Photocatalyst: Preparation, Photocatalytic Properties, and Reaction Mechanism. Catalysts 2016, 6, 69. [Google Scholar] [CrossRef] [Green Version]
- Durham, J.L.; Kirshenbaum, K.; Takeuchi, E.S.; Marschilok, A.C.; Takeuchi, K.J. In-situ Formation of a Series of AgFeO2/γ-Fe2O3 Composites: Impact on Electrochemical Performance. MRS Adv. 2016, 1, 389–394. [Google Scholar] [CrossRef]
- Zubair, M.; Kim, H.; Razzaq, A.; Grimes, C.A.; In, S.-I. Solar spectrum photocatalytic conversion of CO2 to CH4 utilizing TiO2 nanotube arrays embedded with graphene quantum dots. J. CO2 Util. 2018, 26, 70–79. [Google Scholar] [CrossRef]
- Shehzad, N.; Johari, K.; Murugesan, T.; Tahir, M. Graphene Oxide as An Efficient Photocatalyst For Photocatalytic Reduction of CO2 Into Solar Fuel. Int. J. Automot. Mech. Eng. 2018, 15, 4909–4918. [Google Scholar] [CrossRef]
- Farley, K.E.; Marschilok, A.C.; Takeuchi, E.S.; Takeuchi, K.J. Synthesis and Electrochemistry of Silver Ferrite. Electrochem. Solid-State Lett. 2011, 15, A23–A27. [Google Scholar] [CrossRef]
- Shehzad, N.; Tahir, M.; Johari, K.; Murugesan, T.; Hussain, M. Improved interfacial bonding of graphene-TiO2 with enhanced photocatalytic reduction of CO2 into solar fuel. J. Environ. Chem. Eng. 2018, 6, 6947–6957. [Google Scholar] [CrossRef]
- Park, S.-K.; Shin, H. Effect of HCl and H2SO4 treatment of TiO2 powder on the photosensitized degradation of aqueous rhodamine B under visible light. J. Nanosci. Nanotechnol. 2014, 14, 8122–8128. [Google Scholar] [CrossRef] [PubMed]
- Devi, L.G.; Kottam, N.; Murthy, B.N.; Kumar, S.G. Enhanced photocatalytic activity of transition metal ions Mn2+, Ni2+ and Zn2+ doped polycrystalline titania for the degradation of Aniline Blue under UV/solar light. J. Mol. Catal. A Chem. 2010, 328, 44–52. [Google Scholar] [CrossRef]
- Kemp, T.J.; McIntyre, R.A. Transition metal-doped titanium (IV) dioxide: Characterisation and influence on photodegradation of poly (vinyl chloride). Polym. Degrad. Stab. 2006, 91, 165–194. [Google Scholar] [CrossRef]
- Santos, R.S.; Faria, G.A.; Giles, C.; Leite, C.A.P.; Barbosa, H.D.S.; Arruda, M.A.Z.; Longo, C. Iron Insertion and Hematite Segregation on Fe-Doped TiO2 Nanoparticles Obtained from Sol–Gel and Hydrothermal Methods. ACS Appl. Mater. Interfaces 2012, 4, 5555–5561. [Google Scholar] [CrossRef]
- Shough, A.M.; Doren, D.J.; Ogunnaike, B.A. Transition Metal Substitution in ETS-10: DFT Calculations and a Simple Model for Electronic Structure Prediction. Chem. Mater. 2009, 21, 1232–1241. [Google Scholar] [CrossRef]
- Zhou, M.; Yu, J.; Cheng, B. Effects of Fe-doping on the photocatalytic activity of mesoporous TiO2 powders prepared by an ultrasonic method. J. Hazard. Mater. 2006, 137, 1838–1847. [Google Scholar] [CrossRef]
- Rauf, M.; Meetani, M.; Hisaindee, S. An overview on the photocatalytic degradation of azo dyes in the presence of TiO2 doped with selective transition metals. Desalination 2011, 276, 13–27. [Google Scholar] [CrossRef]
- Zhang, J.; Xu, H.; Chen, H.; Anpo, M. Study on the formation of H2O2 on TiO2 photocatalysts and their activity for the photocatalytic degradation of X-GL dye. Res. Chem. Intermed. 2003, 29, 839–848. [Google Scholar] [CrossRef]
- Attri, P.; Kim, Y.H.; Park, D.H.; Park, J.H.; Hong, Y.J.; Uhm, H.S.; Kim, K.-N.; Fridman, A.; Choi, E.H. Generation mechanism of hydroxyl radical species and its lifetime prediction during the plasma-initiated ultraviolet (UV) photolysis. Sci. Rep. 2015, 5, 9332. [Google Scholar] [CrossRef]


| pH of MB Solution | Decolorization Time for 2.5% AgFeO2/ rGO/TiO2 | Decolorization Time for 5% AgFeO2/ rGO/TiO2 |
|---|---|---|
| Neutral (pH 7) | 30 min | 35 min |
| Acidic (pH 5) | 40 min | 70 min |
| Basic (pH 9) | 50 min | 50 min |
| Concentration of Dye | Decolorization Time for 2.5% AgFeO2/rGO/TiO2 | Decolorization Time for 5% AgFeO2/rGO/TiO2 |
|---|---|---|
| 10 ppm | 8 min | 10 min |
| 20 ppm | 12 min | 14 min |
| 30 ppm | 18 min | 20 min |
| 40 ppm | 23 min | 27 min |
| 50 ppm | 30 min | 35 min |
© 2020 by the authors. Licensee MDPI, Basel, Switzerland. This article is an open access article distributed under the terms and conditions of the Creative Commons Attribution (CC BY) license (http://creativecommons.org/licenses/by/4.0/).
Share and Cite
Shehzad, N.; Zafar, M.; Ashfaq, M.; Razzaq, A.; Akhter, P.; Ahmad, N.; Hafeez, A.; Azam, K.; Hussain, M.; Kim, W.Y. Development of AgFeO2/rGO/TiO2 Ternary Composite Photocatalysts for Enhanced Photocatalytic Dye Decolorization. Crystals 2020, 10, 923. https://0-doi-org.brum.beds.ac.uk/10.3390/cryst10100923
Shehzad N, Zafar M, Ashfaq M, Razzaq A, Akhter P, Ahmad N, Hafeez A, Azam K, Hussain M, Kim WY. Development of AgFeO2/rGO/TiO2 Ternary Composite Photocatalysts for Enhanced Photocatalytic Dye Decolorization. Crystals. 2020; 10(10):923. https://0-doi-org.brum.beds.ac.uk/10.3390/cryst10100923
Chicago/Turabian StyleShehzad, Nasir, Muhammad Zafar, Muhammad Ashfaq, Abdul Razzaq, Parveen Akhter, Nabeel Ahmad, Ainy Hafeez, Kshaf Azam, Murid Hussain, and Woo Young Kim. 2020. "Development of AgFeO2/rGO/TiO2 Ternary Composite Photocatalysts for Enhanced Photocatalytic Dye Decolorization" Crystals 10, no. 10: 923. https://0-doi-org.brum.beds.ac.uk/10.3390/cryst10100923