Article

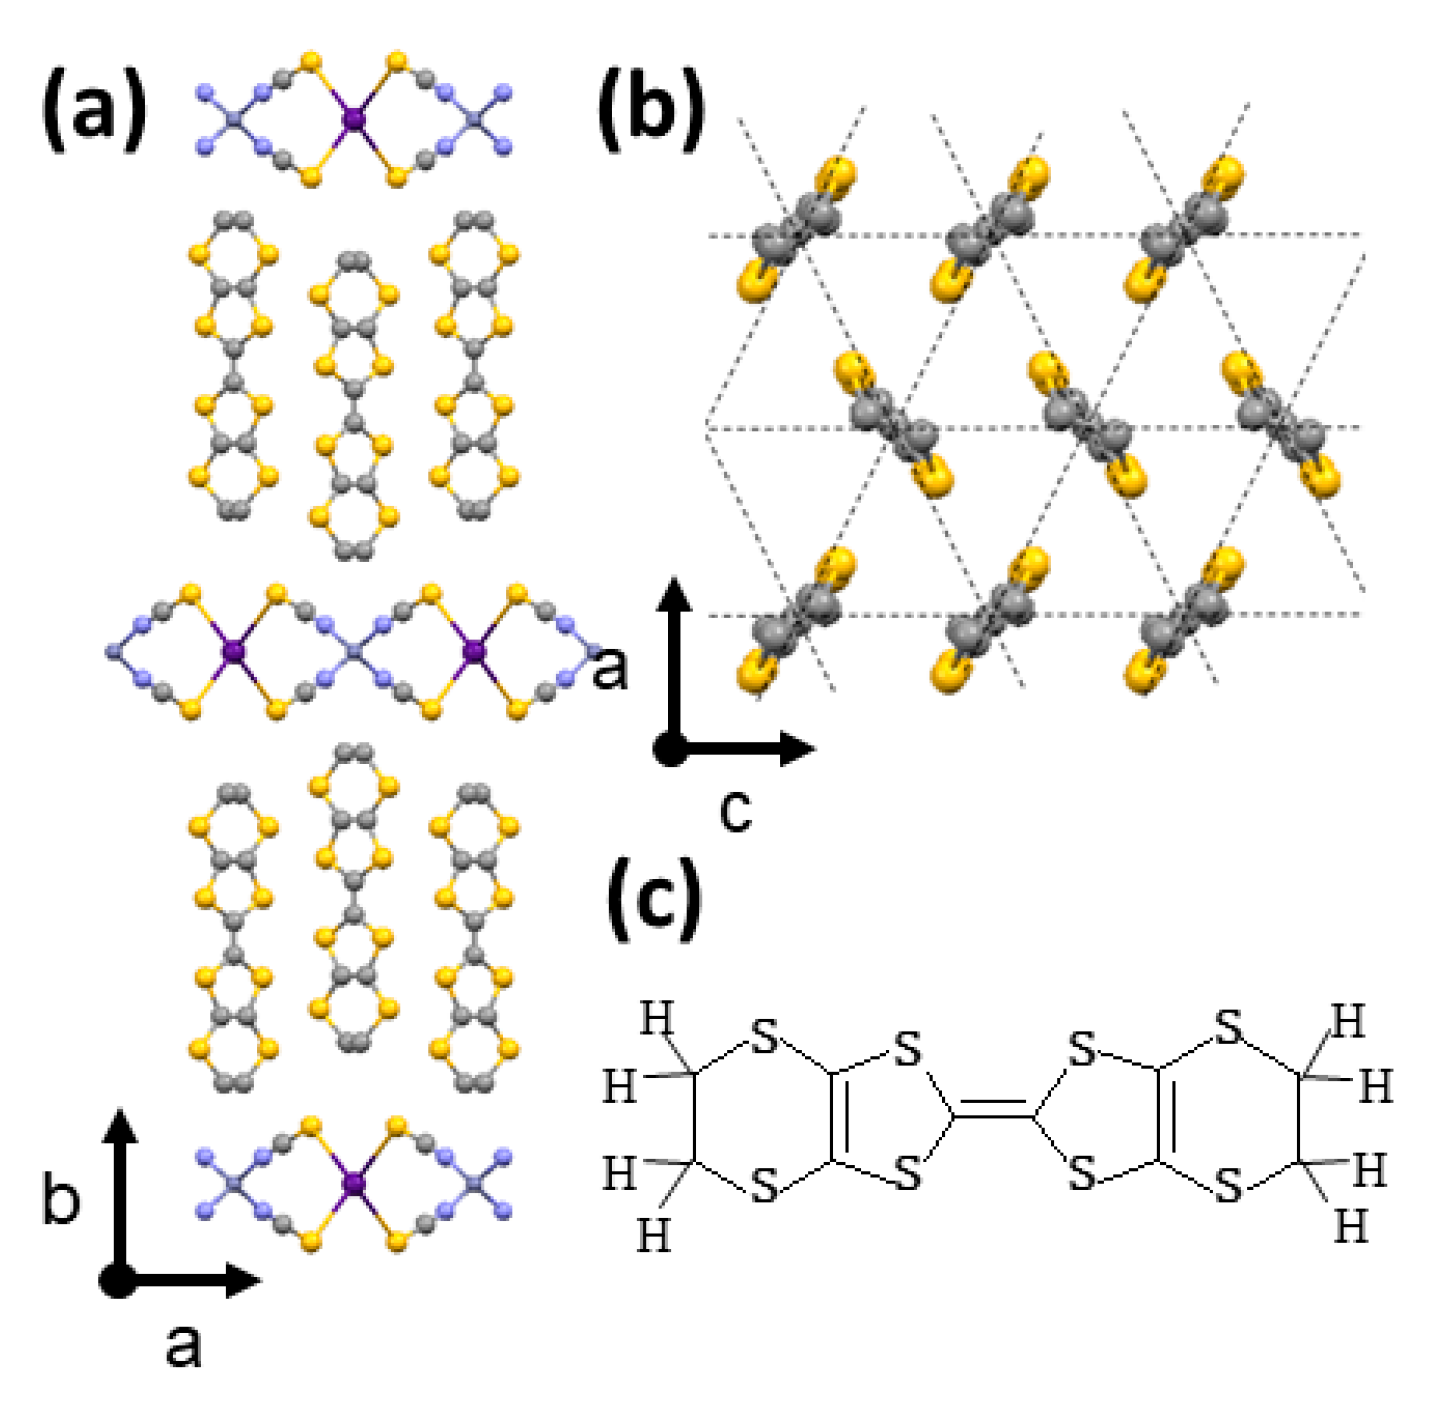
Single Crystal Heat Capacity Measurement of Charge Glass Compound θ-(BEDT-TTF)2CsZn(SCN)4 Performed under Current and Voltage Application

Department of Chemistry, Graduate School of Science, Osaka University, Machikaneyama 1-1, Toyonaka, Osaka 560-0043, Japan
*
Author to whom correspondence should be addressed.
Submission received: 30 October 2020 / Revised: 17 November 2020 / Accepted: 18 November 2020 / Published: 21 November 2020
(This article belongs to the Special Issue Organic Conductors)

Abstract

:
Heat capacity measurements of θ-(BEDT-TTF)2CsZn(SCN)4 in its non-equilibrium electronic states induced by applying electric currents and voltages were performed by a modified relaxation calorimetry technique. We developed a single crystal heat capacity measurements system by which the Joule heating produced in samples by external currents and voltages can be balanced with the cooling power to make a non-equilibrium steady state. Although temperature versus time profiles in the relaxation process in calorimetry can be obtained as exponential curves as in the usual relaxation technique, we found that the change of resistivity that occurs during the heating and relaxation process should be taken into account in analyzing the data. By correcting this factor in the analyses, we succeeded in evaluating absolute values of Cp(I) and Cp(V) in these non-equilibrium states. The experiments up to 150 μA and the constant voltage of 20 mV do not induce visible change in the structure of the Boson peak in CpT−3 vs. T suggestive of the glassy ground state of phonons. Although the suppression of the short-range fluctuations of the charge density has been reported, it does not seriously affect the glassy phonons in this current range.

1. Introduction

The θ-type charge transfer complexes consisting of an organic donor molecule, BEDT-TTF (bis(ethylenedithio)tetrathiafulvalene), and monovalent anions are attracting extensive interest in the area of electron correlation science related to the charge and lattice degrees of freedom [1,2]. Peculiar charge transport features, such as non-linear conductivity, large magnetoresistance [3], thyristor effect, etc. [4,5], and the formation of non-equilibrium charge glass (CG) states [6,7,8] are considered as manifestations of charge dynamics induced by inter-molecular Coulomb interactions in the frustrated lattice. These compounds have a layered structure of alternatively stacked π-electron donor sheets and insulating counter anion (X−1) sheets and the chemical composition is expressed as (BEDT-TTF)2X. The θ-type arrangement of donor molecules is classified as a typical non-dimeric structure and the electron filling of the HOMO band determined by the inter-molecules’ transfer is exactly 3/4 in this case [9,10]. Although the crystal structure is orthorhombic, the neighboring molecules form a triangle lattice structure as shown in Figure 1a–c. Geometric frustration and inter-site Coulomb interaction to make charge disproportionation result in the Fermi liquid state becoming unstable at low temperatures and induce various ground states [11,12,13,14]. Although they show conductive behavior near room temperature reflecting the third-quarter band filling, charge ordering transitions accompanied by structural phase transitions occur in θ-(BEDT-TTF)2RbZn(SCN)4 at 195 K and in θ-(BEDT-TTF)2RbCo(SCN)4 at 190 K in the two-dimensional layer when the samples are cooled down slowly across these temperatures [9,15].
On the other hand, the rapidly cooled θ-(BEDT-TTF)2RbZn(SCN)4 and θ-(BEDT-TTF)2CsZn(SCN)4 are reported to freeze into the glassy state in the charge distribution (CG state) [16,17,18]. From the X-ray diffraction [16,17] and IR and Raman experiments [19], the competition of several types of short-range charge fluctuations coexists in them. In the case of θ-(BEDT-TTF)2CsZn(SCN)4, two kinds of short-range charge disproportionation modes with the wave vectors, q1 = (2/3, k, 1/3) and q2 = (0, k, 1/2), coexist at low temperatures. The former tends to form a three-hold periodicity, while the latter has a two-hold one. Sawano et al. observed that the application of electric currents during the X-ray analysis process suppresses the short-range fluctuations, meaning that a possible melting of the short-range correlations was induced by the currents [5].
Since the charge-lattice coupling is strong in the charge fluctuation compounds, the application of electronic currents that affects the short-range charge fluctuations may induce some changes in low-energy phonons in θ-(BEDT-TTF)2CsZn(SCN)4 [20]. Heat capacity measurements with electric currents for conductive materials have never been performed, although those with the application of large electric fields for perfectly insulating samples have been performed by the adiabatic method [21,22,23] and the relaxation method by Lashly et al. [24]. There are no reports up to now for semi-conductive and metallic materials due to the serious Joule heating produced by external currents and voltages. Here, we report the promising method for the measurement and discuss the thermodynamic properties of θ-(BEDT-TTF)2CsZn(SCN)4 in the non-equilibrium condition produced by external currents and voltages for the first time.

2. Experimental

2.1. Sample Preparation

The crystal used for this work was grown by the electrochemical oxidation method. The BEDT-TTF molecules were solved in 1,1,2-trichroloethane with CsSCN, Zn(SCN)2, and 18-crown-6-ether. The electric current of 1 μA was applied to the solution using H-type cells for about three weeks to yield single crystals suitable for heat capacity measurements. The crystal used for this experiment was 616.4 μg with 0.40 × 0.45 × 2.0 mm3.

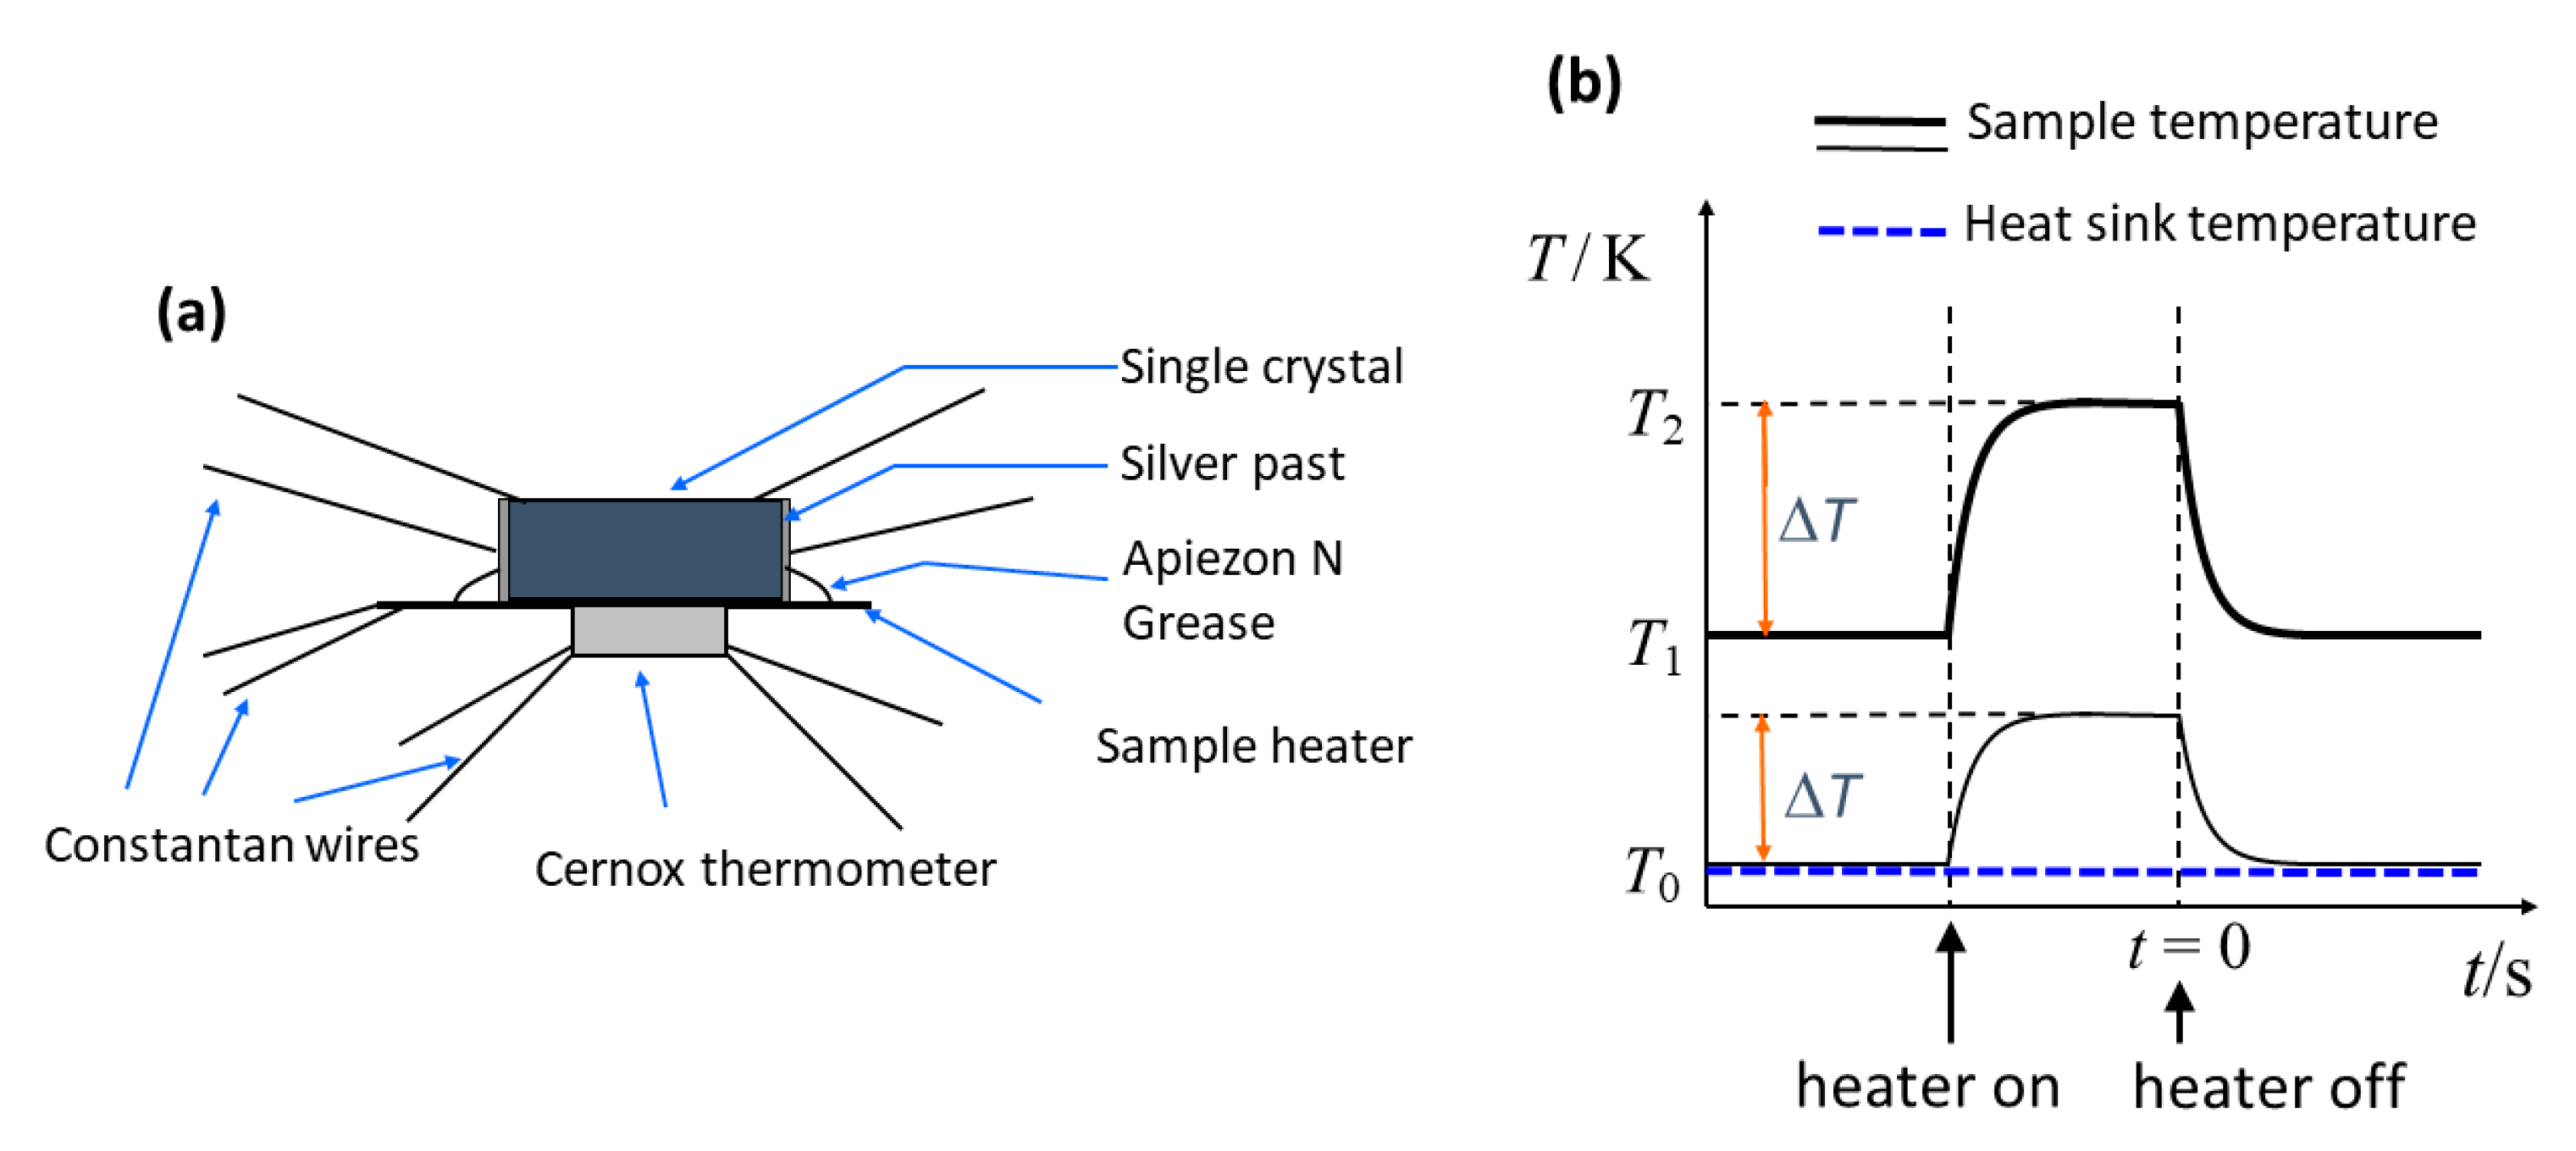
2.2. Experimental Set Up of the Calorimetry Cell

The measurements of the heat capacity for the single crystal sample with applied currents were performed by a modified thermal relaxation technique. We used a calorimetry cell constructed for measuring single crystal samples in an order of 101–3 μg [25,26]. To apply constant currents/voltages to the single crystal to suppress short-range charge disproportionation, we attached four thin lead wires by using a small amount of Ag paste on the gold-deposited portions on the surface of the crystal. We used constantan wires with a diameter of φ25 μm for electric leads. The same wires were also used for the leads of the Cernox sensor (CX1050, LakeShore, Carson, CA, USA) and the heater (1 kΩ strain gauge) of the calorimetry cell. The schematic view of the sample stage is shown in Figure 2a. The electric leads are connected to the anchored ports at the heat sink of the calorimeter of which the temperature is accurately controlled within ±5 mK. The applied currents induce Joule heating in the sample and give rise to temperature discrepancy between the sample part and the heat sink. This discrepancy depends on the magnitude of the external currents. However, it is possible to realize a steady state through the balance of the Joule heating and the cooling power. This discrepancy can be kept constant if the sample heater is not operated. Therefore, it is possible to get heating and relaxing curves by using the sample heater. Good thermal contact between the sample and the thermometer is required to stabilize the steady state. Therefore, we covered the bottom surface and side surfaces of the single crystal using Apiezon N grease on the sample holder. A thermal gradient occurs inside the sample part shown in Figure 2a as the sample heating is considered negligible, since the thermal conductivity between the sample and the Cernox sensor was evaluated as 50–150 μWK−1, which is nearly two orders of magnitude larger than the κ value between the heat sink and sample stage. We confirmed that the base temperature during the current application can be stabilized within ±5 × 10⁻⁶ K s−1.

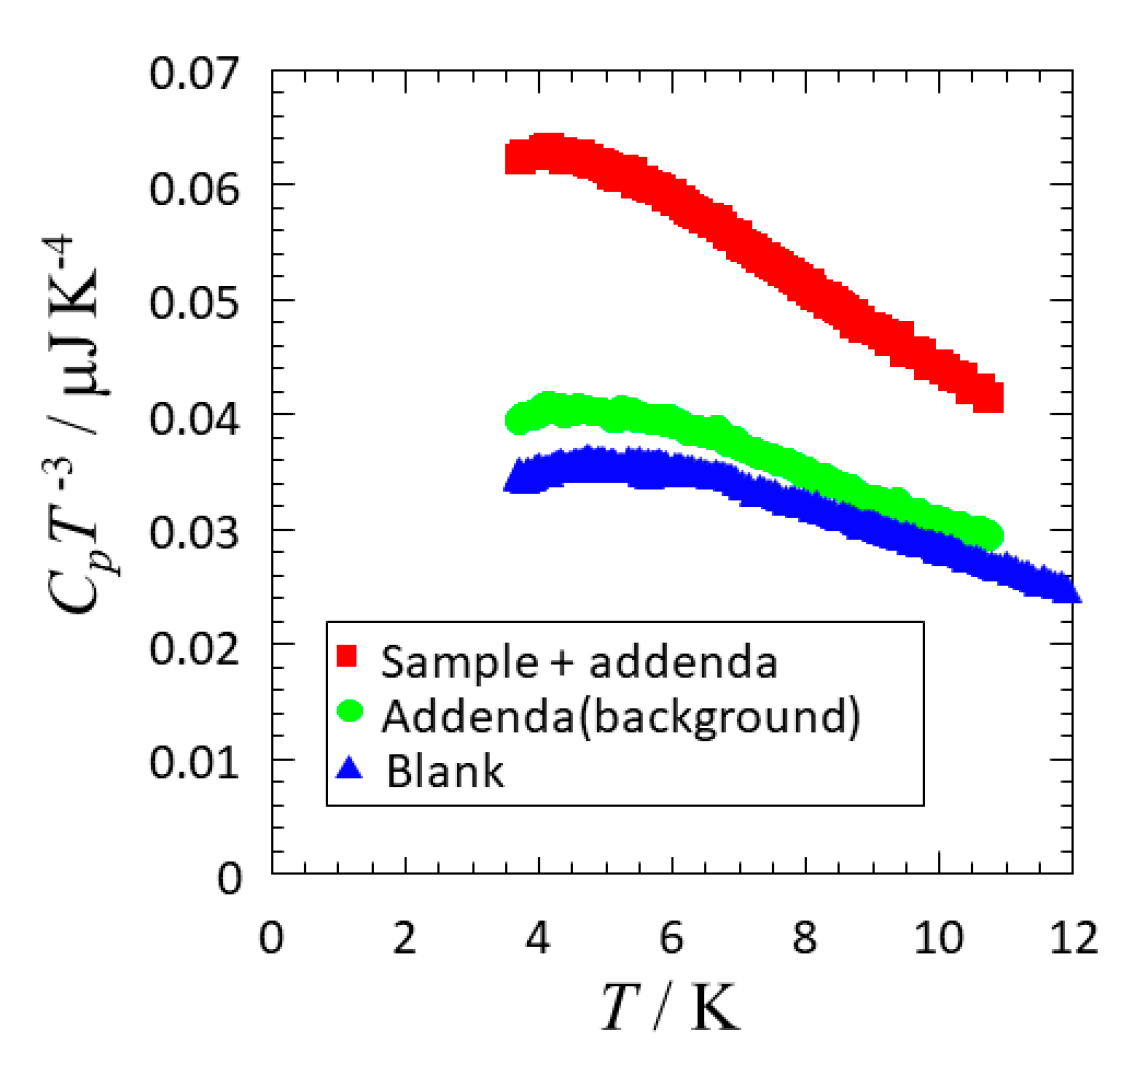
2.3. Analytic Method

Here, we discuss the method to determine the absolute values of the heat capacity. In the relaxation calorimetry system, the temperature profile of the sample cell is recorded as a function of time. We show the schematic view in the typical temperature change of the sample part in the normal condition and that under the applied current in Figure 2b. In the relaxation calorimetry, the absolute values of the heat capacity are determined by the analysis of the relaxation curve using Formula (1). If the temperature dependence of κ is small, it can be simplified as (2) as is used for the normal relaxation technique. The ΔT for the present experiments were set in a range between 60 and 100 mK. The typical temperature profile in the normal condition without currents is shown as the lower curve in Figure 2b:
P heater = C P d T d t + T 0 T κ ( T ) d T ,
P heater = C P d T d t + κ ( T T 0 ) .
When the constant current is applied to the sample, the sample itself also works as a heater to make constant deviation of the temperature from the heat sink. The constant current produces an increase of temperature from the base temperature, T0, and makes a non-equilibrium state with a temperature, T1. However, it is possible to consider it as a steady state and the thermal profile can be evaluated by Equations (3) and (4):
P sample ( T 1 ) = T 0 T 1 κ ( T ) d T ,
P heater + P sample ( T ) P sample ( T 1 ) = C P d T d t + T 1 T κ ( T ) d T .
The possible temperature profile in the relaxation calorimetry performed in this process is shown in Figure 2b as the upper curve.
To evaluate the absolute values of the heat capacity realized in this current-induced non-equilibrium state, the evaluation of Psample(T) − Psample(T1) produced by the current is required. It should be pointed out that the constant deviation from the sample stage becomes large, especially in the low-temperature region, since the heat capacity of the sample becomes smaller while the electric resistivity becomes larger with the decrease of the temperature. Therefore, the minimum temperature we can attain shifts to a higher temperature. During the heating and relaxation process of the measurements, we can keep the condition of ΔT << (T1T0) and the temperature of the heat sink can be kept constant. In this case, we can reasonably consider that Psample(T1) is kept constant. The temperature dependence of the electric resistivity of θ-(BEDT-TTF)2CsZn(SCN)4 is semi-conductive and shows an increase in the low-temperature region. Therefore, the change of the resistivity, namely the change of the Joule heating, Psample(T), during the heating and relaxation processes should be taken into account in each point. If we assume that the ΔT is small, in the range between 60 and 100 mK, and the resistivity change in this narrow temperature range can be expressed as a linear function as R(T) = r1T + r0, the effect of the Joule heating can be assumed as Equations (5) and (6) when the applied currents are constant and applied voltages are constant. In the case of semi-conductive temperature dependence in the present temperature range below 11 K, r1 is always negative and has the larger absolute value:
P heater = C P d T d t + κ ( T T 1 ) I 2 r 1 ( T T 1 ) = C P d T d t + κ ( T T 1 ) ,
P heater = C P d T d t + κ ( T T 1 ) + V 2 r 1 r 0 2 ( T T 1 ) = C P d T d t + κ ( T T 1 ) .
The heat balance equation can be simplified by using the κ’ term and similar relaxation fitting as the normal method can be used. The κ’ can be described as κ’ = κI2r1 and κ’ = κ + V2 r1/r02 for the case of constant current I and constant voltage V being applied, respectively. The total heat capacity Cp of the sample part at various currents can be determined from the time constant of the relaxation curve and the κ’ as in the usual relaxation method. The contribution of the Joule heating term to κ’ for the constant current case gives a positive contribution, while it is negative for the constant voltage case.

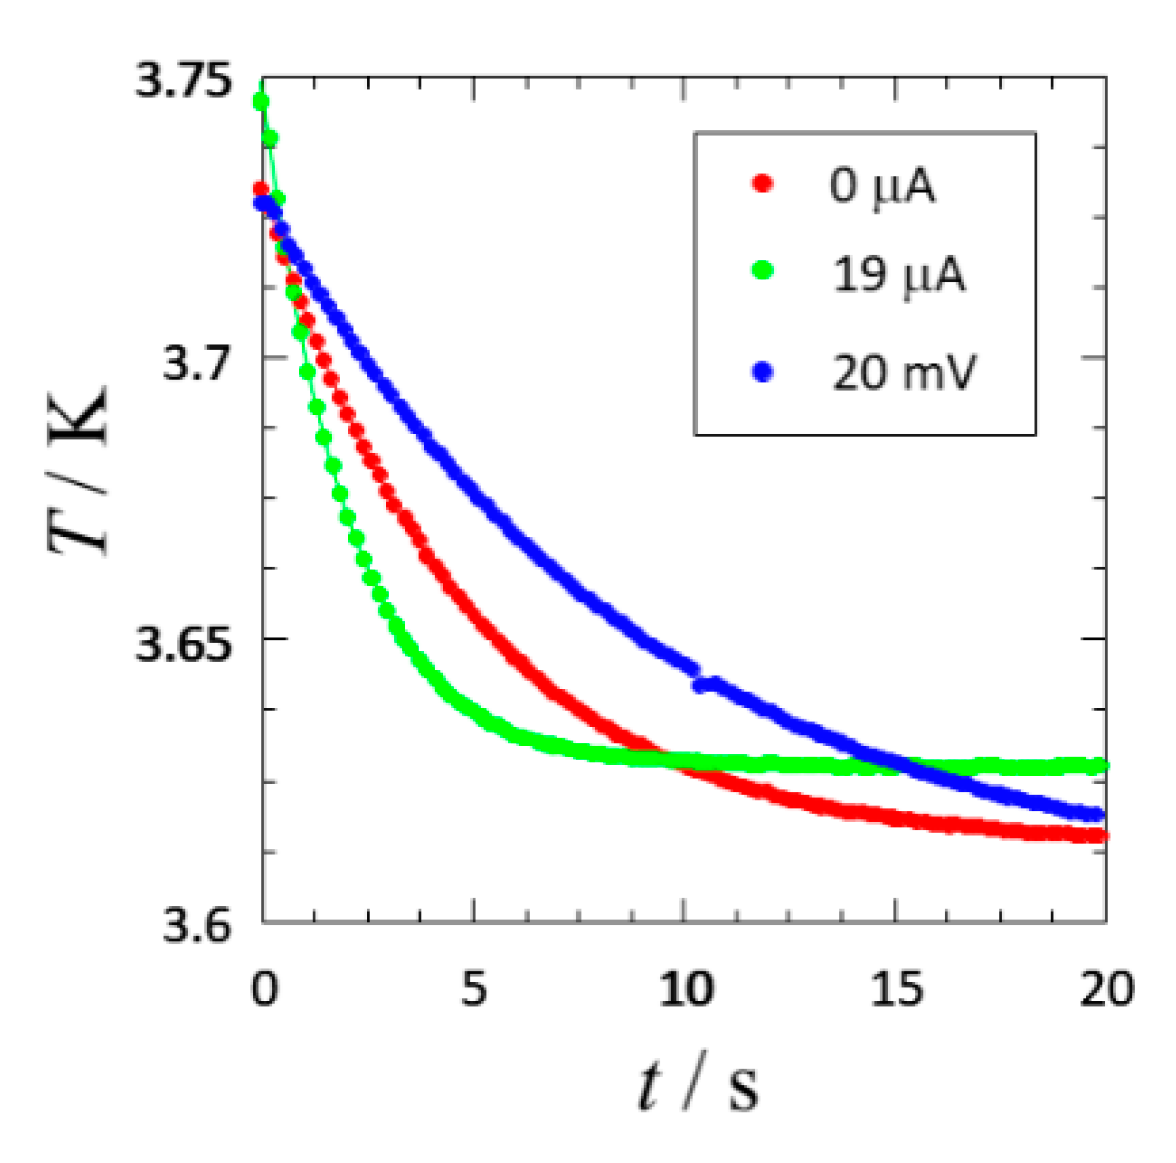
3. Results and Discussion

In Figure 3, we show the temperature dependence of the total heat capacity of the sample part, including the contribution of the single crystal sample and those of the addenda, by the red squares. The data plotted by the blue triangles demonstrate the blank heat capacity measured without any sample and grease. The green circles show the contribution of the addenda part, including the contributions of Apiezon N grease, Au coating, and the Ag past, etc. The data shown by green circles were used as the background contribution for deriving the sample heat capacity, Cp(I) and Cp(V). We can consider that the current dependence of the background heat capacity is negligible here. Figure 4 shows typical temperature relaxation curves obtained in steady state with I = 19 μA and V = 20 mV, together with the normal conduction obtained at nearly the same temperatures. Although the relaxation process can be given as single exponential curves, their time constants are different depending on the conditions of the steady states. This difference originates from the difference of the Joule heating that occurs during the relaxation processes. To evaluate this contribution quantitatively, we compared κ and κ’ for several conditions in Figure 5a–d. We show the temperature dependence of κ obtained in the normal condition without any current and voltage by the red squares in Figure 5a–d. κ is mainly determined by the lead wires, which thermally terminate the sample part and the heat sink. Therefore, its temperature dependence can be described by the thermal conductivity of the constantan wires. In fact, those at 6 and 9 K can be calculated as 1.43 and 2.69 μWK−1, respectively, for the case of 12 wires of φ25 μm in diameter and 5 mm in length in the present cell [27]. These values are consistent with the experimental values. Figure 5a–c also displays the experimentally determined κ’ of constant current I = 19, 80, and 150 μA. respectively. Since the κ’ includes the Joule heating contribution as shown in Formula (5), the temperature dependences of the κ’ show large deviation from the κ values, especially in the low-temperature region. We also show the temperature dependence of κ’ calculated using the experimental values of κ and resistivity values for the cases of I = 19, 80, 150 μA by blue curves in Figure 5a–c. We can confirm there is good agreement between the experimental values of κ’ and the calculated ones. This result demonstrates that the analyses based on Formula (5) are reliable to determine Cp(I) with various currents. We also display the temperature dependence of κ’ obtained for the case of heating by applying a constant voltage of V = 20 mV in Figure 5d. Although it is difficult to detect an accurate sample current in this experiment to evaluate resistivity, usage of the measured κ’ for the analysis according to Formula (6) is also available to determine Cp(V).
Since the charge disproportionation and fluctuations affect the structure of low-energy phonons through the electron-lattice coupling, the low-temperature heat capacity changes drastically depending on the ground states of the charge degrees of freedom [20,28]. A peculiar feature was observed in the heat capacity of θ-(BEDT-TTF)2CsZn(SCN)4 by Yoshimoto et al. in the normal condition [20]. The temperature dependence of the lattice heat capacity divided by T3 shows a large Boson peak structure around 2–3 K, which is a typical feature of molecular glasses and amorphous compounds [20,28,29]. On the other hand, such a peak structure is absent in the charge-ordered (CO) state of slowly cooled θ-(BEDT-TTF)2RbZn(SCN)4 and metallic θ-(BEDT-TTF)2I3. This feature is consistent with the glass-like thermal conductivities of θ-(BEDT-TTF)2CsZn(SCN)4 and rapidly cooled θ-(BEDT-TTF)2RbZn(SCN)4 reported recently [30]. The Boson peak structure for the present sample was also detected by the heat capacity measurement in the normal state as shown in Figure 6a.
The molar heat capacity of θ-(BEDT-TTF)2CsZn(SCN)4 with the applied currents up to 150 μA and with the constant voltage of 20 mV obtained by using the κ’ for each steady state and the addenda heat capacity data in Figure 3 is shown in Figure 6b in the CpT−3 vs. T plot. Although the temperature region we can measure in the applied currents and voltage is limited, and we could not cover the whole shape of the Boson peak due to the shift of the base temperature by the larger Joule heating in the low-temperature region, we compare them with the data marked by a light blue color in Figure 5a. The agreement of the data, including the absolute values of molar heat capacity, with those of Figure 6a in the upper side region of the Boson peak is good, which means successful measurements in the applied currents and voltage. From the figure, we can confirm that the application of electric currents up to 150 μA and the application of constant voltage of 20 mV do not induce change in the heat capacity. In the previous X-ray experiments given by Sawano et al., suppression of the short-range peak denoted as q2 = (0, k, 1/2) occurs with the application of an external current of 70 μA, while the short-range structure of q1 = (2/3, k, 1/3) is not affected even by the current of 260 μA [5]. Since the contribution of the Boson peak is induced by the disordered phonons, the influence of the partial charge melting by applying current seems to be smaller in the present temperature and current range. It is suggested that the disordered phonons responsible for the Boson peak have the character of local phonons without long-range coherency as in acoustic phonons. This is consistent with the step-like decrease of thermal conductivity with decreasing temperature that occurs around the similar temperature region [30]. The local disorders, for example, produced by hydrogen bonding through ethylene conformations, may be a possible scenario as was reported in [31,32]. The relation with donors and counter anions should be taken into account in discussing the thermal properties of these charge-disproportionation phenomena. Probably, experiments with a much larger electric current or electric field, which can melt the glass-like charge state more drastically, can derive further information of the phonon-glass dynamics occurring in the low-energy region in θ-(BEDT-TTF)2CsZn(SCN)4. The effect of external currents and voltages for the charge disproportionation systems are quite interesting for charge-lattice coupling systems and detection by thermodynamic measurements in such non-equilibrium states should be developed in a wider temperature region.

4. Summary

In summary, we performed heat capacity measurements of θ-(BEDT-TTF)2CsZn(SCN)4 with applied current and voltage conditions. The Joule heating by the static currents was balanced with the cooling power from the heat sink to make a steady state. We also reported the method of data analyses to evaluate the accurate heat capacity with applied currents in detail. The experiments up to 150 μA and the constant bias of 20 mV did not change the Boson peak structure in the heat capacity, although some suppression effect was reported by the X-ray diffraction. We found that the suppression of the short-range fluctuations did not seriously affect the disorder in the phonon structure in this experimental range. The measurements of heat capacity under currents can give a new possibility to investigate phase transitions of electronic and lattice origin.

Author Contributions

K.H., T.N., and S.Y. worked on the synthesis and characterizations of the samples. K.H., T.N. and S.Y. conducted the low temperature heat capacity measurements with external currents and voltages. K.H. and Y.N. designed the research plan and all authors worked on the overall discussions throughout the work. K.H., T.N. and Y.N. mainly wrote the draft of the manuscript and all authors commented on the manuscript. All authors have read and agreed to the published version of the manuscript.

Funding

This research was financially supported by JSPS KAKENHI Grant Numbers JP19K22169 and 20H01862.

Acknowledgments

The authors thank T. Yamamoto (Ehime University) for valuable discussion in terms of charge disproportionation.

Conflicts of Interest

The authors declare no conflict of interest.

References

  1. Mori, H. Materials Viewpoint of Organic Superconductors. J. Phys. Soc. Jpn. 2006, 75, 1–15. [Google Scholar] [CrossRef]
  2. Mori, T.; Kawamoto, T. Organic conductors—From fundamentals to nonlinear conductivity. Annu. Rep. Prog. Chem. Sect. C Phys. Chem. 2007, 103, 134–172. [Google Scholar] [CrossRef]
  3. Takahide, Y.; Konoike, T.; Enomoto, K.; Nishimura, M.; Terashima, T.; Uji, S.; Yamamoto, H.M. Large positive magnetoresistance of insulating organic crystals in the non-ohmic region. Phys. Rev. Lett. 2007, 98, 1–4. [Google Scholar] [CrossRef] [PubMed] [Green Version]
  4. Inagaki, K.; Terasaki, I.; Mori, H.; Mori, T. Large Dielectric Constant and Giant Nonlinear Conduction in the Organic Conductor θ-(BEDT-TTF)2CsZn(SCN)4. J. Phys. Soc. Jpn. 2004, 73, 3364–3369. [Google Scholar] [CrossRef] [Green Version]
  5. Sawano, F.; Terasaki, I.; Mori, H.; Mori, T.; Watanabe, M.; Ikeda, N.; Nogami, Y.; Noda, Y. An organic thyristor. Nature 2005, 437, 522–524. [Google Scholar] [CrossRef]
  6. Kagawa, F.; Sato, T.; Miyagawa, K.; Kanoda, K.; Tokura, Y.; Kobayashi, K.; Kumai, R.; Murakami, Y. Charge-cluster glass in an organic conductor. Nat. Phys. 2013, 9, 419–422. [Google Scholar] [CrossRef]
  7. Sasaki, S.; Hashimoto, K.; Kobayashi, R.; Itoh, K.; Iguchi, S.; Nishio, Y.; Ikemoto, Y.; Moriwaki, T.; Yoneyama, N.; Watanabe, M.; et al. Crystallization and vitrification of electrons in a glass-forming charge liquid. Science 2017, 357, 1381–1385. [Google Scholar] [CrossRef] [Green Version]
  8. Sato, T.; Miyagawa, K.; Kanoda, K. Electronic crystal growth. Science 2017, 357, 1378–1381. [Google Scholar] [CrossRef] [Green Version]
  9. Mori, H.; Tanaka, S.; Mori, T. Systematic study of the electronic state in θ-type BEDT-TTF organic conductors by changing the electronic correlation. Phys. Rev. B 1998, 57, 12023–12029. [Google Scholar] [CrossRef]
  10. Williams, J.M.; Ferraro, J.R.; Thorn, R.J.; Carlson, K.D.; Geiser, U.; Wang, H.H.; Kini, A.M.; Whangbo, N.-H. Organic Superconductors (Including Fullerenes): Synthesis, Structure, Properties, and Theory; Prentice Hall: Englewood Cliffs, NJ, USA, 1992; pp. 92–93. [Google Scholar]
  11. Mori, T. Non-Stripe Charge Order in the θ-Phase Organic Conductors. J. Phys. Soc. Jpn. 2003, 72, 1469–1475. [Google Scholar] [CrossRef]
  12. Seo, H. Charge Ordering in Organic ET Compounds. J. Phys. Soc. Jpn. 2000, 69, 805–820. [Google Scholar] [CrossRef] [Green Version]
  13. Clay, R.T.; Mazumdar, S.K.; Campbell, D. Charge Ordering in θ-(BEDT-TTF)2X Materials. J. Phys. Soc. Jpn. 2002, 71, 1816–1819. [Google Scholar] [CrossRef] [Green Version]
  14. McKenzie, R.H.; Merino, J.; Marston, J.B.; Sushkov, O.P. Charge ordering and antiferromagnetic exchange in layered molecular crystals of the type. Phys. Rev. B 2005, 64, 085109. [Google Scholar] [CrossRef] [Green Version]
  15. Mori, H.; Tanaka, S.; Mori, T. Magnetic Properties of Coexistent System of Itinerant and Localized Electrons, (BEDT-TTF)2MCo(SCN)4 (M = K, Rb, Cs). J. Phys. I 1996, 6, 1987–1996. [Google Scholar]
  16. Nogami, Y.; Pouget, J.P.; Watanabe, M.; Oshima, K.; Mori, H.; Tanaka, S.; Mori, T. Structural modulation in θ-(BEDT-TTF)2CsM′(SCN)4[M′=Co, Zn]. Synth. Met. 1999, 103, 1911. [Google Scholar] [CrossRef]
  17. Nogami, Y.; Hanasaki, N.; Watanabe, M.; Yamamoto, K.; Ito, T.; Ikeda, N.; Ohsumi, H.; Toyokawa, H.; Noda, Y.; Terasaki, I.; et al. Charge Order Competition Leading to Nonlinearity in Organic Thyristor Family. J. Phys. Soc. Jpn. 2010, 79, 1–5. [Google Scholar] [CrossRef]
  18. Sato, T.; Kagawa, F.; Kobayashi, K.; Ueda, A.; Mori, H.; Miyagawa, K.; Kanoda, K.; Kumai, R.; Murakami, Y.; Tokura, Y. Systematic Variations in the Charge-Glass-Forming Ability of Geometrically Frustrated θ-(BEDT-TTF)2X Organic Conductors. J. Phys. Soc. Jpn. 2014, 83, 1–4. [Google Scholar] [CrossRef] [Green Version]
  19. Suzuki, K.; Yamamoto, K.; Yakushi, K.; Kawamoto, A. Infrared and Raman Studies of θ-(BEDT-TTF)2CsZn(SCN)4: Comparison with the Frozen State of θ-(BEDT-TTF)2RbZn(SCN)4. J. Phys. Soc. Jpn. 2005, 74, 2631–2639. [Google Scholar] [CrossRef]
  20. Yoshimoto, R.; Takane, Y.; Hino, K.; Yamashita, S.; Nakazawa, Y. Coupling of charge and lattice degrees of freedoms in θ-type BEDT-TTF compound probed by low-temperature heat capacity measurements. Physica B 2014, 449, 19–24. [Google Scholar] [CrossRef]
  21. Camnasio, J.A.; Gonzalo, A.J. Comparative Study of the Ferroelectric Specific Heat in TGS and DTGS. J. Phys. Soc. Jpn. 1975, 39, 451–459. [Google Scholar] [CrossRef]
  22. Ramos, S.; del Cerro, J.; Zamora, M. Specific heat of triglycine sulfate at several applied electric fields near the critical temperature. Phys. Status Solidi (a) 1980, 61, 307–313. [Google Scholar] [CrossRef]
  23. Del Cerro, J.; Martin, J.M.; Ramos, S. Specific heat measurements under non-equilibrium conditions. J. Therm. Anal. 1996, 47, 1691–1700. [Google Scholar] [CrossRef]
  24. Lashley, J.C.; Hundley, M.F.; Mihaila, B.; Smith, J.L.; Opeil, C.P.; Finlayson, T.R.; Fisher, R.A.; Hur, N. Heat capacity in magnetic and electric fields near the ferroelectric transition in triglycine sulfate. Appl. Phys. Lett. 2007, 90, 1–3. [Google Scholar] [CrossRef] [Green Version]
  25. Imajo, S.; Fukuoka, S.; Yamashita, S.; Nakazawa, Y. Construction of relaxation calorimetry for 101–2 μg samples and heat capacity measurements of organic complexes. J. Therm. Anal. Calorim. 2015, 123, 1871–1876. [Google Scholar] [CrossRef]
  26. Fukuoka, S.; Horie, Y.; Yamashita, S.; Nakazawa, Y. Development of heat capacity measurement system for single crystals of molecule-based compounds. J. Therm. Anal. Calorim. 2013, 113, 1303–1308. [Google Scholar] [CrossRef]
  27. Duthil, P. Material Properties at Low Temperature. arXiv 2015, arXiv:1501.07100. [Google Scholar]
  28. Nishio, Y.; Nihei, Y.; Tamura, M.; Kajita, K.; Nakamura, T.; Takahashi, T. Specific heat and metal-insulator transition of (BEDT-TTF)2MZn(SCN)4(M = Cs, Rb). Synth. Met. 1999, 103, 1907–1908. [Google Scholar] [CrossRef]
  29. Nomoto, T.; Yesil, E.; Yamashita, S.; Akutsu, H.; Nakazawa, Y. Thermodynamic properties of glassy phonon states induced by strong electron correlations in θ-type organic charge transfer salts. Mod. Phys. Lett. B 2020, 34, 1–7. [Google Scholar] [CrossRef]
  30. Nomoto, T.; Yamashita, S.; Akutsu, H.; Nakazawa, Y.; Krivchikov, A.I. Phonon Glass Induced by Electron Correlation. J. Phys. Soc. Jpn. 2019, 88, 1–4. [Google Scholar] [CrossRef]
  31. Pouget, J.-P.; Alemany, P.; Canadell, E. Donor-anion interactions in quarter-filled low-dimensional organic conductors. Mat. Hori. 2018, 5, 590–640. [Google Scholar] [CrossRef] [Green Version]
  32. Alemany, P.; Pouget, J.-P.; Canadell, E. Structural and electronic control of the metal to insulator transition and local orderings in the θ-(BEDT-TTF)2X organic conductors. J. Phys. Condens. Mat. 2015, 27, 1–16. [Google Scholar] [CrossRef] [PubMed]
Figure 1. (a) Crystal structure of θ-(BEDT-TTF)2CsZn(SCN)4. The donor molecules and counter anions stack in a segregated structure. (b) The arrangement of the donor molecule of BEDT-TTF in the two-dimensional layer. The dashed line shows the triangle lattice in this arrangement. (c) The molecular structure of BEDT-TTF.
Crystals 10 01060 g001
Figure 2. (a) Schematic illustration of the sample part of the relaxation calorimetry cell. Four lead wires are attached on the surfaces of the single crystal for applying current and voltage. (b) The temperature profiles against time for the standard and the modified relaxation calorimetry technique. The lower curve shows the heating and relaxation curve for the standard relaxation calorimetry. The upper one shows the case with constant currents or voltages applied for the crystal.
Crystals 10 01060 g002
Figure 3. Temperature dependences of the total heat capacity of the sample part (red squares), addenda heat capacity (green circles), and blank heat capacity (blue triangles) shown in CpT−3 vs. T plot.
Crystals 10 01060 g003
Figure 4. Typical thermal relaxation curves obtained in the present set up. The red circles show the standard case without current and voltage. The green circles denote the relaxation curve for the constant current of I = 19 μA and the blue ones show the curve for constant voltage with V = 20 mV.
Crystals 10 01060 g004
Figure 5. Temperature dependences of the experimentally determined κ (red square) and κ’ (green circle) for (a) I = 19, (b) I = 80, (c) I = 150 μA, and (d) V = 20 mV. The blue circles show the calculated values from κ and Psample obtained by the resistivity value of the sample and applied currents.
Crystals 10 01060 g005
Figure 6. (a) Temperature dependence of the heat capacity of θ-(BEDT-TTF)2CsZn(SCN)4 for the single crystal sample used for the present experiment obtained by the standard relaxation technique. (b) Those obtained with constant current of I = 0, 19, 50, 80, 150 μA and V = 20 mV are shown in CpT−3 vs. T plot. The rectangle area shown by the light blue color in (a) corresponding to the whole area shown in (b).
Crystals 10 01060 g006
Publisher’s Note: MDPI stays neutral with regard to jurisdictional claims in published maps and institutional affiliations.

