Article

Fast Tunable Biological Fluorescence Detection Device with Integrable Liquid Crystal Filter

by
Qing Yang
1,
Tong Sun
1,2,
Xinyu Wu
1,2,
Guangchao Cui
1,2,
Mengzheng Yang
1,2,
Zhongyang Bai
1,2,
Lin Wang
2,
Helin Li
1,2,
Wenjing Chen
2,
Qunwen Leng
1,2,
Robert Puers
3,
Ceyssens Frederik
3,
Michael Kraft
4,
Qinglin Song
5,
Huabin Fang
5,
Dewen Tian
5,
Dexin Wang
5,
Huijie Zhao
6,7,
Weisheng Zhao
1,2,
Tianxiao Nie
1,
Qi Guo
7,* and
Lianggong Wen
1,2,*
add Show full author list remove Hide full author list
1
School of Integrated Circuit Science and Engineering, Beihang University, Beijing 100191, China
2
Beihang-Goertek Joint Microelectronics Institute, Qingdao Research Institute, Qingdao 266101, China
3
ESAT-MICAS, KU Leuven, Kasteelpark Arenberg 10, 3001 Leuven, Belgium
4
ESAT-MNS, KU Leuven, Kasteelpark Arenberg 10, 3001 Leuven, Belgium
5
Qingdao Goertek Microelectronics Research Institute Co., Ltd., Qingdao 266104, China
6
Beihang University Qingdao Research Institute, Qingdao 266101, China
7
School of Instrumentation and Optoelectronic Engineering, Beihang University, Beijing 100191, China
*
Authors to whom correspondence should be addressed.
Submission received: 1 March 2021 / Revised: 6 March 2021 / Accepted: 7 March 2021 / Published: 10 March 2021
(This article belongs to the Special Issue Liquid Crystals in China)

Abstract

:
Detecting a variety of biological samples accurately and swiftly in an integrated way is of great practical significance. Currently, biofluorescent spectrum detection still largely relies on microscopic spectrometers. In this study, we propose an integrable method to detect biofluorescent spectrums with designed liquid crystal tunable filter (LCTF), in order to identify typical biological samples such as cells and bacteria. Hela cells labeled with red and green fluorescent proteins and Pseudomonas with fluorescence wavelengths of 610 nm, 509 nm and 450 nm, respectively, are inspected. High-resolution (6 μm) biofluorescent results have been achieved, together with clear images of the Hela cell clusters and the Pseudomonas bacteria colonies. Biofluorescence signals can be detected at a high transmittance (above 80%), and the response time of the device can reach 20 ms or below. The proposed method has the potential to be integrated into a microfluidic system to detect and identify the biofluorescent signals as a high throughput, low-cost option, for both high resolution and large field observation applications.

1. Introduction

Biological specimen diagnostic platforms have been widely used in laboratories worldwide for more than 50 years. They can provide information related to the degree of environmental pollution, the risk of injury and specific health conditions with biosensor devices [1,2,3,4,5]. Medical-level biomedical diagnostic platforms can also diagnose and predict many diseases [6,7,8,9]. However, traditional biomedical diagnostics are mainly carried out by sending collected samples to analytical laboratories outside the field for testing. Today, the popularization of biosensors and microfluidic technology fundamentally changes this situation. Analysis can be performed immediately at the sampling site by developing point-of-care testing (POCT) small-volume diagnostic equipment. These methods eliminate complex processing procedures of the test sample in the laboratory and obtain the test results in a short time. In addition, there is a wide range of sensing mechanisms, including optical, mechanical, magnetic and electric field effects [10,11,12,13,14,15]. Because of the advantages of contact-free, noninvasive, high specificity and so on, optical biomedical diagnostic systems are extensively applied. Tests with fluorescent optical signals have been accepted as an inexpensive and secure technology for developing a multipurpose biosensors with high detectability and sensitivity. Therefore, realizing a high throughput, real-time and integrable fluorescent device with microfluidics becomes an important option towards various clinical applications with biological samples.
To detect biological samples with fluorescence efficiently and sensitively, several approaches based on liquid crystal tunable filter (LCTF), correlation spectrometer and spectrophotometer were put forward [16,17,18,19]. Among the various sensing modalities used in the development of biofluorescence spectrometric analysis methods, liquid crystal has been utilized for biofluorescence sensing with enormous potential due to its simple mechanism and wide field of view [20,21,22]. As the core device of multispectral imaging technology, liquid crystal had been incorporated into clinical biofluorescence detection in the past decades because of playing a guiding, real-time monitoring role in cancer surgery and wound healing [23,24,25]. However, previous work focused on a maximum transmittance of about 60% in a sophisticate system [26]. Meanwhile, the instruments with a spectrometer are not suitable for integration and miniaturization.
Here, a compact and integrable biosensor with a liquid crystal filter as core device was developed and integrated in a biofluorescence detection system. Hela cells labeled with red and green fluorescent proteins and Pseudomonas were chosen as experimental objects, which are the most typical specimen in cancer research and environmental protection [27,28,29,30]. First, dynamic experiments were conducted with a dedicated optical system to verify the response speed and sensitivity of designed liquid crystal filter with variable voltages. Furthermore, static parameters were tested to determine the corresponding maximum transmittance for each biofluorescence wavelength. A variety of samples were eventually characterized with different spatial and time-resolution conditions. The proposed devices not only meet the demand of a compact and integrable biofluorescence system, but also have an advantage in terms of cost compared with other common biofluorescence detection techniques, as shown in Table S2 of Supplementary Materials. This work provides a novel mean of detecting biological specimens with a portable and integrable feasibility.

2. Materials and Methods

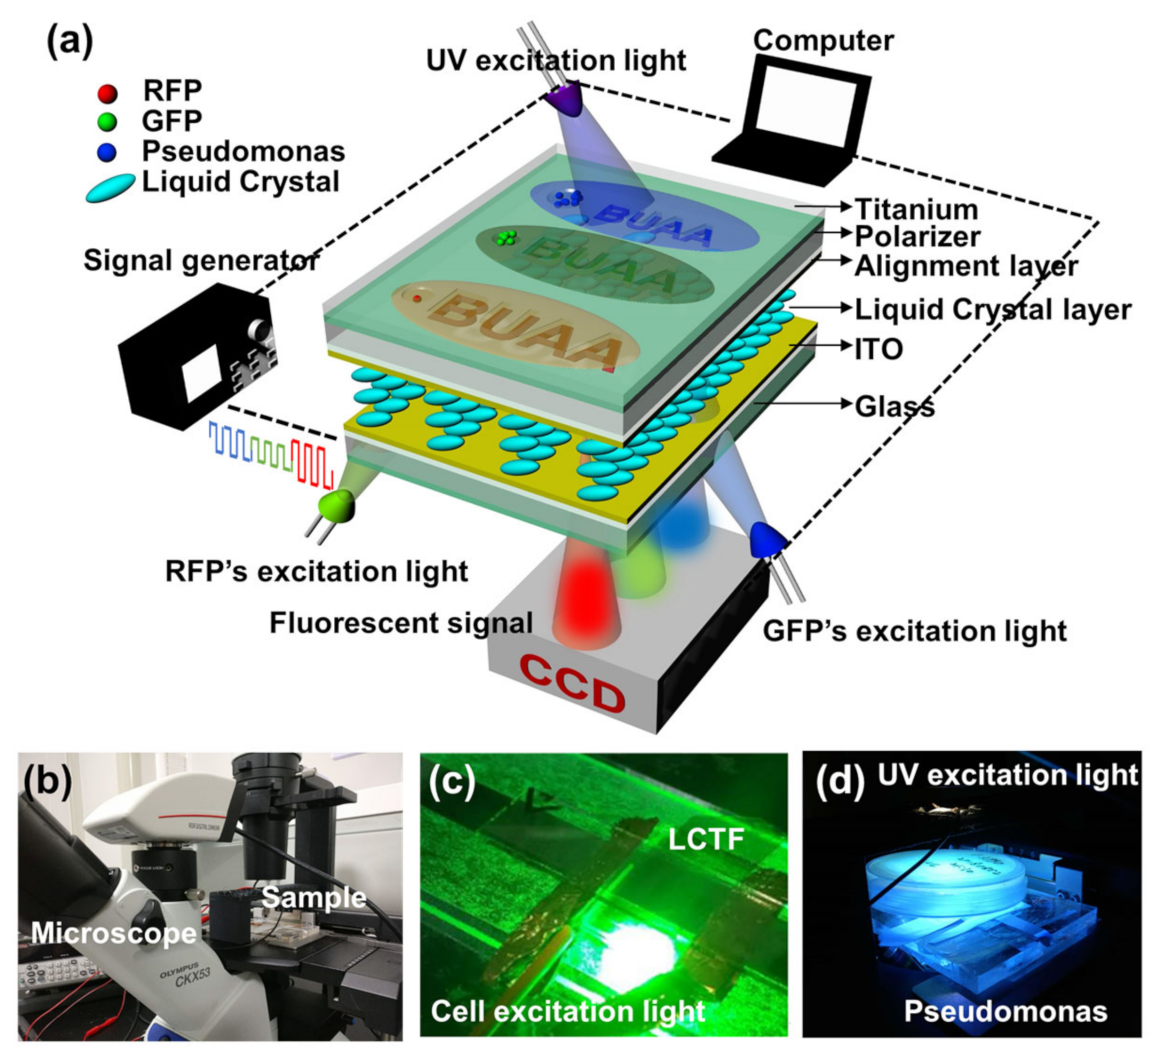
2.1. System Design and Experiment Preparation

The schematic and physical setups of the experimental system comprise the designed liquid crystal filter, Charge-coupled Device (CCD) camera and signal generator (3390, Keithley, Cleveland, Ohio, U.S.), as shown in Figure 1a,b. A pair of parallel polarizers was added on both sides of the liquid crystal layer to filter light, which could realize the transformation of phase retardation to amplitude difference. A titanium-coated glass plate was placed on the polarizer above the liquid crystal layer to construct an environment suitable for the survival of the sample and prepare the basis for the minimum resolution in the subsequent experiment. Four letter patterns with B, U, A and A with different sizes (20.83 mm2, 3.8 mm2, 0.95 mm2, 0.25 mm2) and eight round holes with diameters from 70 μm to 6 μm were fabricated by photolithography. The thickness of the titanium layer was 120 nm, which was prepared by electron beam evaporation. Figure 1a also shows the structure of designed liquid crystal filter in detail. The liquid crystal cell was a symmetrical structure combined with glass substrates, Indium Tin Oxides (ITO) and alignment layer; the liquid crystal molecular layer was in the middle. Considering of the sensitivity and cost, we chose a parallel oriented nematic liquid crystal for electrically controlled birefringence, which was packed in a 4.2 μm thick liquid crystal cell.
We cultured red fluorescent protein labeled Hela cells (RFP), green fluorescent protein labeled Hela cells (GFP) and Pseudomonas with patterned shadow masks, and stimulated them to produce red (610 nm), green (509 nm) and blue (450 nm) fluorescent light. The fluorescence was captured by the CCD detector of the microscope (CKX53, Olympus, Tokyo, Japan) after passing through the liquid crystal system, and was finally imaged on the computer. During the experiment, the selective filtering of the liquid crystal was implemented in a square wave signal of 2.5 kHz at both ends of the liquid crystal layer. The transmittance of the liquid crystal filter could be controlled by adjusting the voltage amplitude of the square wave through a LabVIEW program. In addition, the microscope could provide two cell fluorescence excitation light sources (the excitation light band of RFP is 510 to 550 nm, and the excitation light band of GFP is 460 to 490 nm), while the fluorescence excitation devices of the bacteria are a separate ultraviolet (UV) light source (365 nm–370 nm). The details of experimental facility are shown in Figure 1c,d, respectively. The processes of pattern preparation and cells cultivation are shown in supplementary material Figure S1.

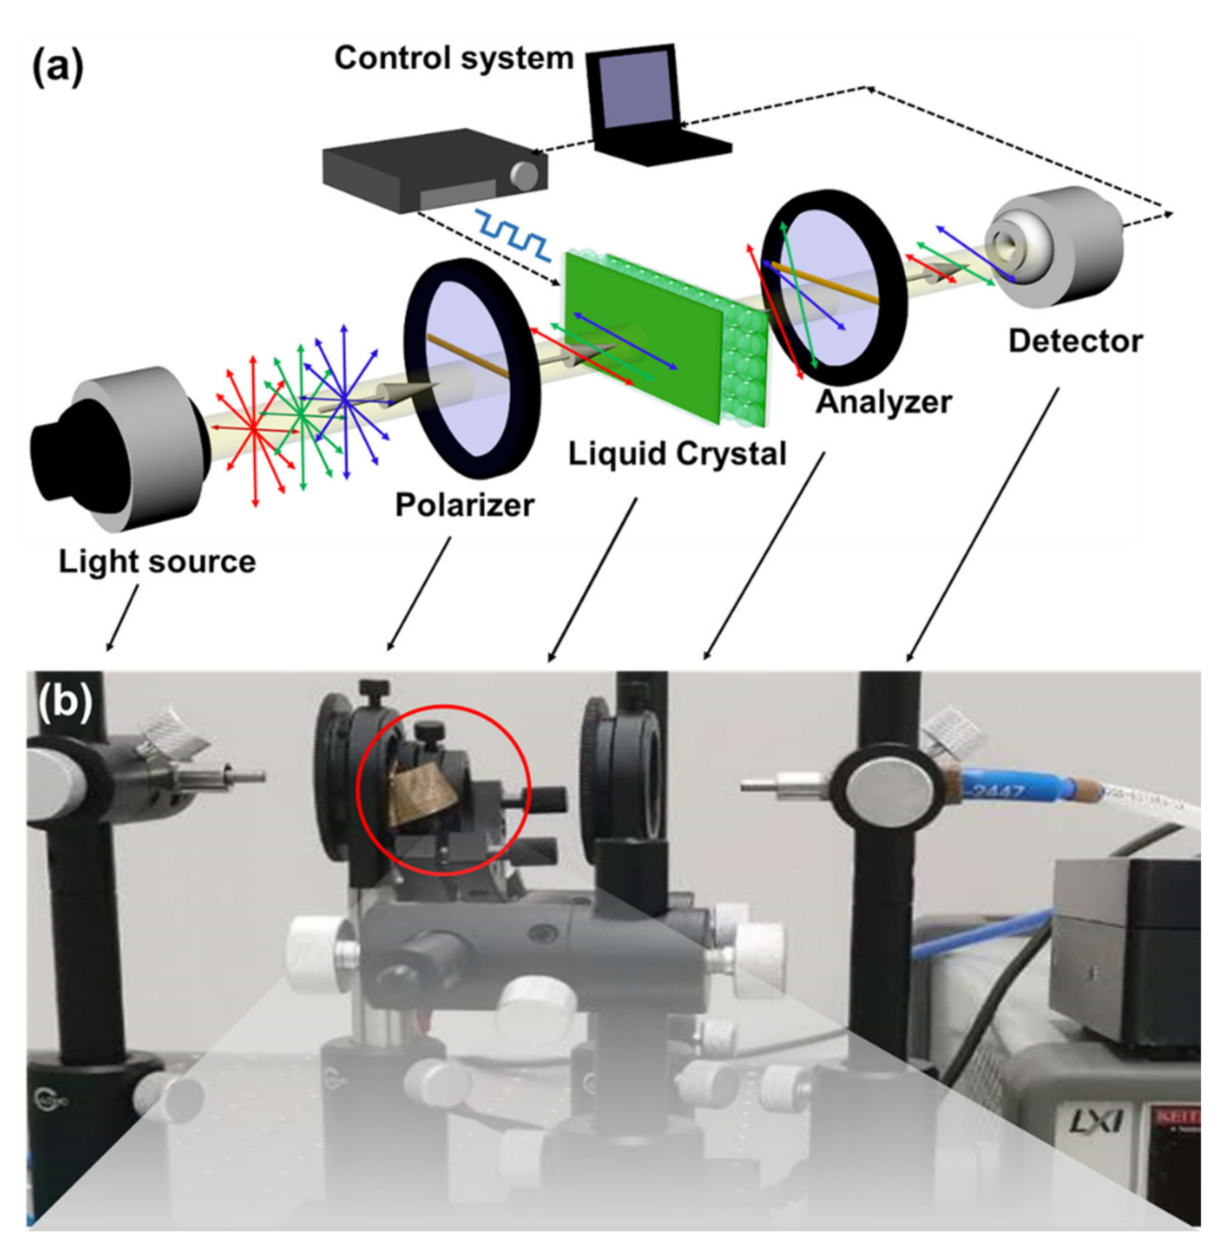
2.2. Spectrum Filtering Based on Integrable Liquid Crystal Filter

To detect the biosample fluorescence, an integrated and tunable spectral filtering technology is desired. Considering the weak signal properties of the biosample fluorescence, a high transmittance of the spectrum-filter device is preferable. Hereby, based on electrically controlled birefringence (ECB), a single-stage liquid crystal tunable filter, which can avoid excessive transmission loss caused by multiple transmission, was designed and fabricated to distinguish typical biological fluorescent signals with wavelengths of 610 nm (red), 509 nm (green) and 450 nm (blue), respectively.
The test schematic of the designed liquid crystal filter is shown in Figure 2a,b. A Lyot structure [31,32] with polarizer and analyzer paralleled to each other was used, and the liquid crystal was sandwiched between with the optical axis deviating 45° to the polarizer. A broadband light source (AvaLight-HAL) covering all three fluorescent wavelengths and a high-resolution spectrometer (Ocean Optics HR4000) was employed to characterize the designed filter. The detected spectral data was recorded and processed automatically by a LabVIEW program.
The main architecture of the electrically tunable liquid crystal spectral filter is shown in Figure 3a. It consists of two glass substrates coated with a transparent ITO layer as electrode, alignment layers defining the molecular director of nematic liquid crystal layer (E7 from Merck, Darmstadt, Germany). An antiparallel planer alignment configuration with alignment direction along the long axis of the cell is applied for a homogenous liquid crystal director distribution. In this configuration, the liquid crystal molecules demonstrate a property of ECB. In the absence of an electric field, the liquid crystal molecules follow the initial condition defined by alignment layers to be uniformly aligned. When the external electric field is applied across two substrates, the liquid crystal directors, representing the orientation of liquid crystal molecules, will be titled towards the electric field vector, as shown in Figure 3a. This distortion introduced by the electric field is so-called splay deformation. The elastic energy density is given by [33]:
f e l a s t i c = 1 2 K 11 𝛻 × n 2 + K 22 n × 𝛻 × n 2 + K 33 n × 𝛻 × n 2
where n is the liquid crystal director, K11, K22 and K33 are the splay, twist, and bend elastic constants of the liquid crystal, respectively. The electric energy density is given by:
f e l e c t r i c = 1 2 ε 0 Δ ε E · n 2 = 1 2 ε 0 Δ ε E 2 sin 2 θ
Where Δε is the dielectric anisotropy of the liquid crystal molecule, θ is the tilt angle of director. For reaching equilibrium state, the director distribution satisfies the minimum of total free energy f = felastic + felectric. Figure 3a shows that the amplitude of the electric field corresponds to the average induced tilt angle of liquid crystal directors θ(E).
The effective birefringence Δneff(E) deviates from the initial optical anisotropy Δn(E = 0) = ne − no, here no/ne is the reflective index of ordinary and extraordinary light (for E7 mixture, no = 1.517 and ne = 1.741). Once the averaged tilt angle induced by the electric field θ(E) is determined, the effective birefringence Δneff(E) can be calculated as [34]:
Δ n e f f = n o n e n o 2 cos 2 θ + n e 2 sin 2 θ 1 / 2 n o
With the effective birefringence controlled by the electric field, the transmittance of a single stage liquid crystal filter is:
I / I 0 = cos 2 π Δ n e f f E d λ
As shown in Figure 3a, with different voltage amplitudes, the ECB effect leads to a shift of central wavelength of the tunable filter. At 1.45 V, 1.65 V and 1.9 V, the textures observed under a microscope show uniform colors corresponding to wavelengths of 450 nm, 509 nm and 610 nm, respectively.

3. Results and Discussion

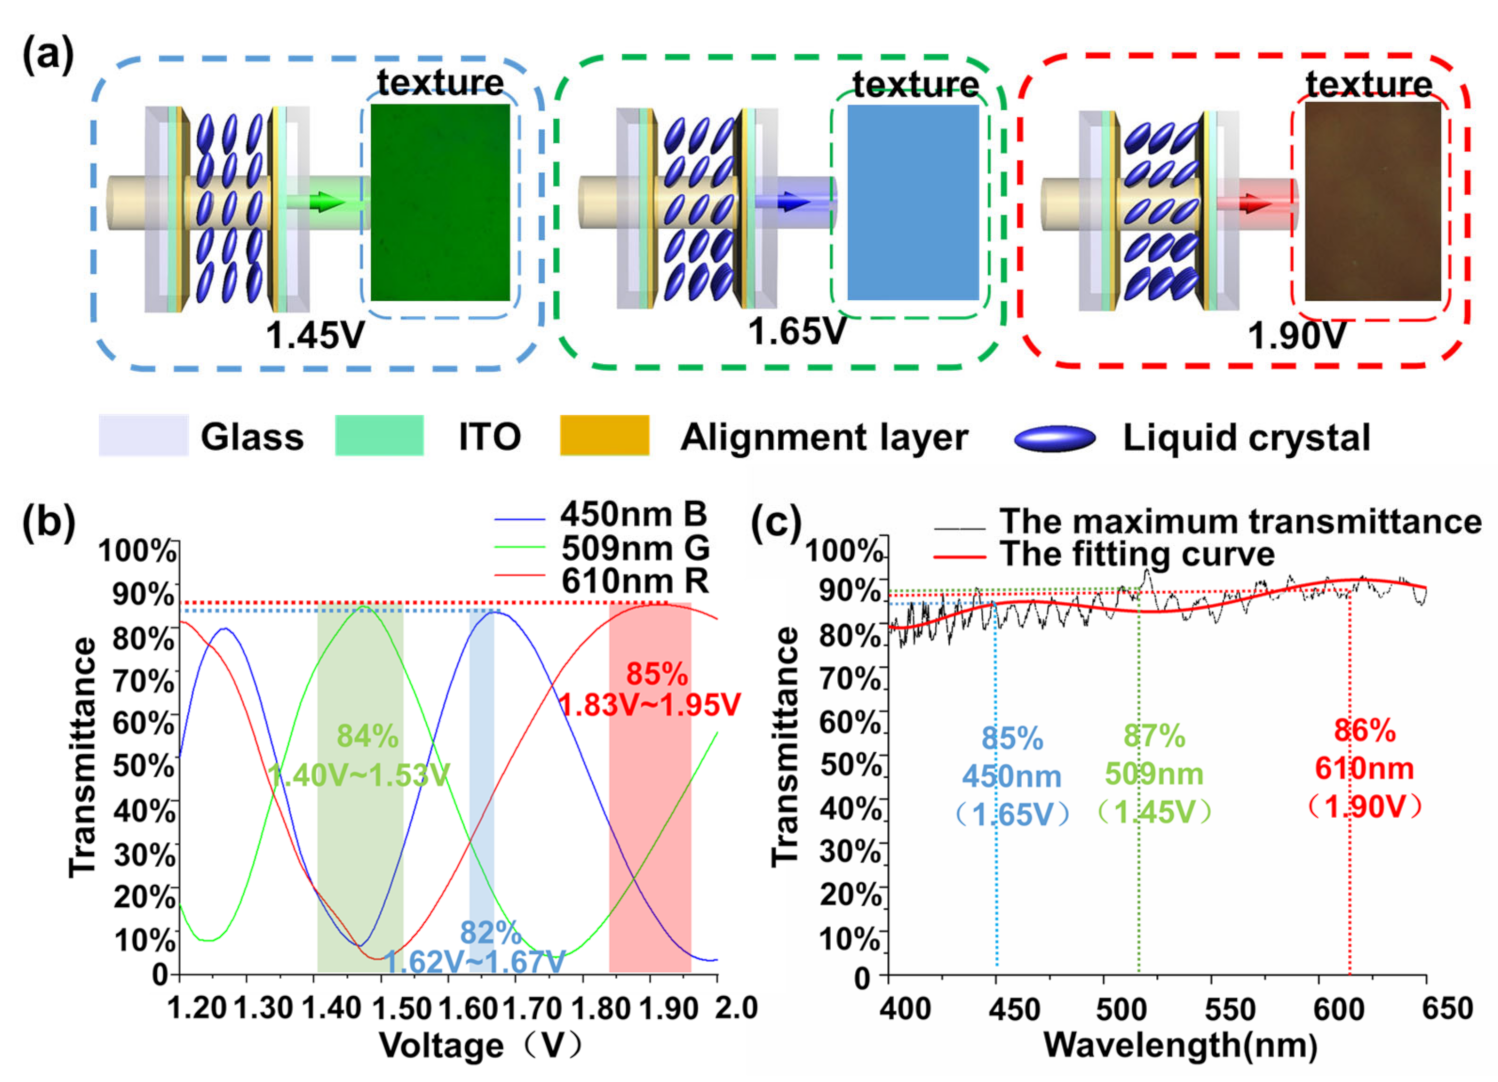
3.1. Electro-optical Characterizations

For the purpose of distinguishing three typical fluorescent wavelengths of 450 nm, 509 nm and 610 nm, the compact and integrable liquid crystal filter based on ECB was designed for high transmittance and low driving voltage. The integration time of each measurement is 100 ms. The nematic liquid crystal mixture E7 (with ne of 1.741 and no of 1.517) was filled into a 4.2 μm-thick planer-aligned cell. When applied voltage signals with an amplitude exceed threshold Vth (Vth < 1 V), the electrically controlled transmittance exhibits a dependence on the incident wavelength, as shown in Figure 3b. For detecting Hela cell with 509 nm green fluorescence, the corresponding voltage was 1.45 V. In this case, the transmittance of target wavelength 509 nm was greater than 84%, and the transmittance of other fluorescence 450 nm or 610 nm was below 10%. Similarly, to detect the fluorescence of Pseudomonas (450 nm) and Hela cells (610 nm), the corresponding voltages were measured to be 1.65 V and 1.9 V for realizing transmittance of 82% and 85%, respectively. The system gave priority to the detection of 509 nm and satisfied the detection of 450 nm and 610 nm. If there are requirements for other wavelengths (any fluorescence), the system can make flexible adjustments according to actual situations to meet detection effect.
In our approach, the high optical transmittance facilitated the weak fluorescence signal detection, which was critical for the enhancement of image resolution and detection accuracy. The optimization of the liquid crystal design was conducted considering the low intensity and narrow linewidth property of fluorescence. Thus, a single-stage liquid crystal composed of a single liquid crystal cell sandwiched between parallel polarizers was employed for high throughput of the system. Moreover, based on the flexibility of device design, including liquid crystal layer thickness and optical birefringence, multiple combinations of fluorescent wavelengths could be distinguished separately.
The electrical tunability of the central wavelength provided the possibility for detection of various fluorescent samples. To prove it, in the process of voltage increasing from 1 V to 2 V in steps of 0.001 V, the transmittance in the wavelength range of 400 nm–650 nm was recorded. The experiment results fitted by polynomials (7 orders) showed a trend that the corresponding maximum transmittance increases as the wavelength increases. As shown in Figure 3c, the maximum transmittance of three typical fluorescent wavelengths, 450 nm, 509 nm and 610 nm, was 85% (1.65 V), 87% (1.45 V) and 86% (1.9 V), respectively. In the whole visible range, the maximum transmittance maintained at about 80%, and with slight oscillation within ±4%, as the maximum transmittance curve in Figure 3c shows, due to interference between reflections from two transparent electrode ITO layers.

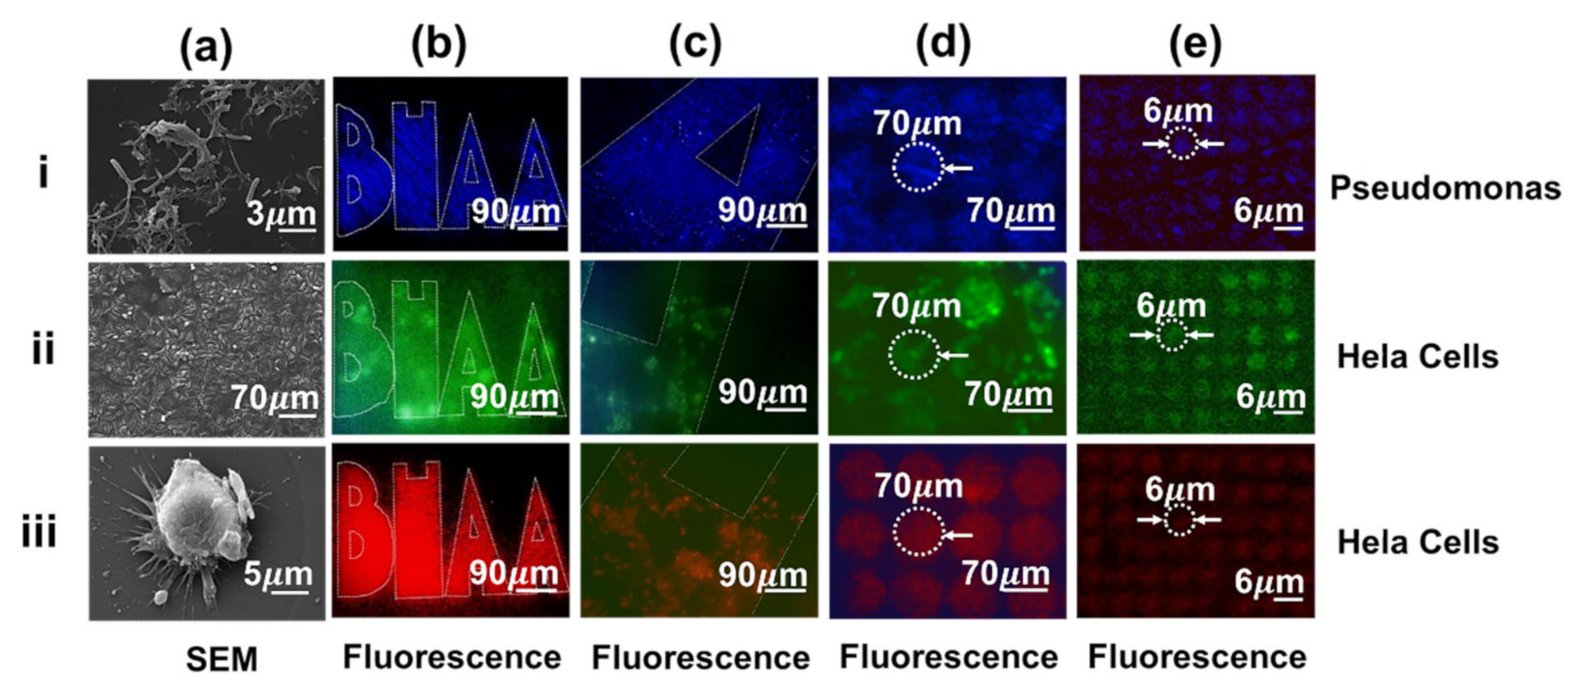
3.2. Static Characterization and Resolution

To verify the ability of the designed system (as shown in Figure 1a) to detect and identify biofluorescent signals, the shadow mask cultivated with Pseudomonas bacteria colonies, GFP-labeled Hela cells and RFP-labeled Hela cells was placed on the liquid crystal filter for static characterization. Figure 4 shows the scanning electron microscope (SEM) and the fluorescent images of the observed bacteria and cells. Before the measurement, the density of Hela cells and Pseudomonas was controlled to about 20%.
Column (a) shows SEM images of the Pseudomonas bacteria colonies, the aggregated Hela cells and the single Hela cell, respectively, which indicated that the previous sample cultivation process had no effect on the morphologies of the biological samples. Columns (b) and (c) show the fluorescent images of two dimensions of the letters filled with biological samples, captured by the LCTF-based detection system. Columns (d) and (e) show the fluorescent images of hole (70 μm and 6 μm in diameter, respectively) arrays filled with biological samples, captured by the LCTF-based detection system. These clear images demonstrate the feasibility of our fast tunable biofluorescence sensing device in detecting biological samples with different dimensions and morphologies.
The diameters of some typical cells are summarized in the Supplementary Information, Table S1 [35]. Figure 4e ii and iii indicates the possibility of our detection system to identify the fluorescent signal of the single cell for further biological and clinical research. Moreover, our device is not designed for detection with a certain biological sample. As long as the size and fluorescence characteristics are suitable for our device, we can perform fluorescence detection on it. The detection of circulating tumor cells (CTCs) plays a crucial role in cancer biology and clinical research, since the metastasis of tumor cells is the main cause of cancer-related deaths. It can be seen from Figure 4d ii and iii that the proposed system may provide enormous potential for CTCs detection. Cells with different fluorescent proteins can be detected by the selective transmittance of liquid crystal implemented in impressed voltage through the specific binding of fluorescent proteins to cells.

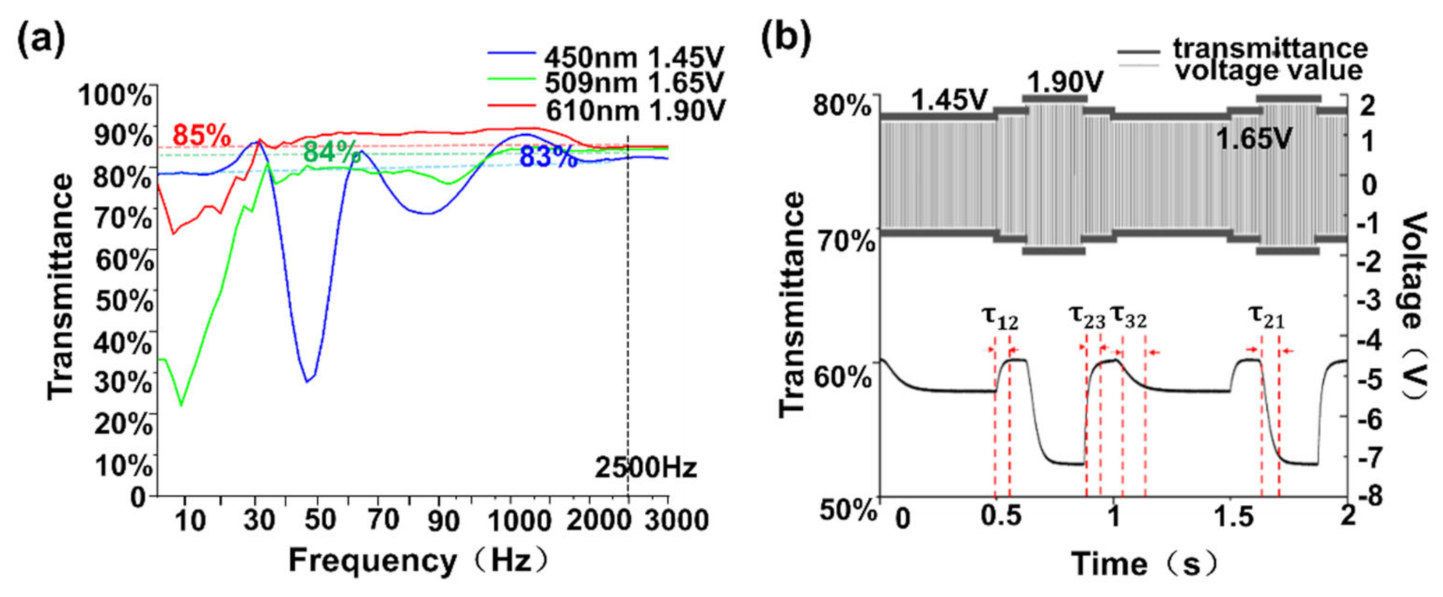
3.3. The Dynamic Characterizations

In order to further determine the accuracy of the experimental results and explore the feasibility of the device in the condition of a variety of samples, a dynamic characterization experiment based on the optical system was designed and carried out.
First, the driving scheme of the designed liquid crystal filter was based on amplitude modulation of AC voltage signals. When the voltage was determined, the transmittance of corresponding wavelengths within a certain frequency range (between 0 Hz and 3000 Hz) was compared. The stabilization time of the liquid crystal was set to 100 ms and the sweep interval was 1 Hz. It was demonstrated that the frequency dependence of transmittance was severe at frequencies below 1 kHz, as shown in Figure 5a. Then, the electrically controlled transmittance reached saturation, which was 83% for 450 nm at 1.65 V, 84% for 509 nm at 1.45 V, and 85% for 610 nm at 1.9 V, respectively, within a frequency range of 1 kHz to 3 kHz. Thus, AC signals with a frequency of 2.5 kHz were used for our driving scheme.
Then, the electro-optical dynamic behavior was evaluated using the electrically controlled transmittance of a 532 nm laser. Assuming that the laser source had good monochromaticity and stable intensity, it can characterize the response speed of the liquid crystal filter to a voltage change. Normally, the switching time was defined as the time of transmittance changed from 10% to 90%, as shown in Figure 5b. Given the corresponding voltages for three fluorescent signals, V1 = 1.45 V (λ1 = 509 nm), V2 = 1.65 V (λ2 = 450 nm), and V3 = 1.9 V (λ3 = 610 nm), respectively, τ12 = 12.66 ms represented the switching time from green to blue fluorescence. Table 1 shows the switching time between three typical fluorescent signals, which decreased to 20 ms or below; this was much faster than reported in prior work [21]. Some comparisons of the liquid crystal tunable filter for biodetection can be found in Supplementary Materials Table S3.

4. Conclusions and Future Work

A fast, tunable biofluorescence detection device with integrable liquid crystal tunable filter was demonstrated. The experimental results show that the transmittance of three biofluorescence signals in the system is more than 80%, which is considerably higher than in existing technology. Furthermore, we observed the patterns of three biofluorescence signals clearly with high resolution (6 μm) and large field (70 μm). It is also worth noting that the voltage and frequency dependence corresponding to the high transmittance are reasonable and controllable. The response time of the device can achieve 20ms or below, which greatly improves the accuracy of our experimental results and the probability for rapid detection of various biological samples. The experimental results provide strong support and evidence for fabricating a device, which is simple to construct and cost-effective for testing under different resolution requirements without tedious pretreatment. Furthermore, research and development of this technology will promote innovation of traditional bioassay technology and satisfy the increasing demand of a miniaturized, multipurpose and fast detection platform with high sensitivity and low power consumption.

Supplementary Materials

The following are available online at https://0-www-mdpi-com.brum.beds.ac.uk/2073-4352/11/3/272/s1, Table S1: The diameters of some typical cells. Table S2: Summary of biofluorescence detection techniques. Table S3: Some comparisons of the liquid crystal tunable filter for biodetection. Figure S1: Pattern production and cells cultivation.

Author Contributions

Q.Y. and T.S. contributed equally to this paper. Conceptualization, L.W. (Lianggong Wen) and Q.G.; methodology, Q.Y., L.W. (Lianggong Wen) and Q.G.; software, Q.Y. and G.C.; writing—original draft preparation, X.W., G.C., Z.B., M.Y., L.W. (Lin Wang) and T.S.; writing—review and editing, Q.Y., T.S., L.W. (Lianggong Wen), Q.G., L.W. (Lin Wang), H.L., W.C., Q.L., R.P., C.F., M.K., Q.S., H.F., D.T., D.W., H.Z., W.Z. and T.N.; supervision, L.W. (Lianggong Wen) and Q.G. All authors have read and agreed to the published version of the manuscript.

Funding

This research was funded by the National Key R&D Program of China (No. 2018YFB0407602), the “Zhuo yue Program of Associate Professors” of Beihang University (ZG216S18B5), Qingdao Innovation and Entrepreneurship Leadership Program (*), The International Collaboration 111 Project (No. B16001), National Natural Science Foundation of China (61405009, 61875004), Leading Talents Program for Enterpriser and Innovator of Qingdao (18-1-2-22-zhc).

Institutional Review Board Statement

Not applicable.

Informed Consent Statement

Not applicable.

Data Availability Statement

The data presented in this study are contained within this article.

Acknowledgments

This study was supported by the National Key R&D Program of China (No. 2018YFB0407602), the “Zhuo yue Program of Associate Professors” of Beihang University (ZG216S18B5), Qingdao Innovation and Entrepreneurship Leadership Program (*) and The International Collaboration 111 Project (No. B16001), National Natural Science Foundation of China (61405009, 61875004), Leading Talents Program for Enterpriser and Innovator of Qingdao (18-1-2-22-zhc) and Bo Ma, Qingdao Institute of Biomass Energy and Bioprocess Technology, Chinese Academy of Sciences, thanks for the help provided by the research team in theory and experiment.

Conflicts of Interest

The authors declare no conflict of interest.

References

  1. Gorkin, R.; Park, J.; Siegrist, J.; Amasia, M.; Lee, B.S.; Park, J.M.; Kim, J.; Kim, H.; Madou, M.; Cho, Y.K. Centrifugal microfluidics for biomedical applications. Lab Chip 2010, 10, 1758–1773. [Google Scholar] [CrossRef] [Green Version]
  2. Jokerst, J.V.; Raamanathan, A.; Christodoulides, N.; Floriano, P.N.; Pollard, A.A.; Simmons, G.W.; Wong, J.; Gage, C.; Furmage, W.B.; Redding, S.W. Nano-bio-chips for high performance multiplexed protein detection: Determinations of cancer biomarkers in serum and saliva using quantum dot bioconjugate labels. Biosens. Bioelectron. 2009, 24, 3622–3629. [Google Scholar] [CrossRef] [PubMed] [Green Version]
  3. Pan, Y.; Sonn, G.A.; Sin, M.L.; Mach, K.E.; Shih, M.C.; Gau, V.; Wong, P.K.; Liao, J.C. Electrochemical immunosensor detection of urinary lactoferrin in clinical samples for urinary tract infection diagnosis. Biosens. Bioelectron. 2010, 26, 649–654. [Google Scholar] [CrossRef] [Green Version]
  4. Ray, M.; Ray, A.; Dash, S.; Mishra, A.; Achary, K.G.; Nayak, S.; Singh, S. Fungal disease detection in plants: Traditional assays, novel diagnostic techniques and biosensors. Biosens. Bioelectron. 2017, 87, 708–723. [Google Scholar] [CrossRef] [PubMed]
  5. Sackmann, E.K.; Fulton, A.L.; Beebe, D.J. The present and future role of microfluidics in biomedical research. Nature 2014, 507, 181–189. [Google Scholar] [CrossRef]
  6. Cialla-May, D.; Zheng, X.S.; Weber, K.; Popp, J. Recent progress in surface-enhanced Raman spectroscopy for biological and biomedical applications: From cells to clinics. Chem. Soc. Rev. 2017, 46, 3945–3961. [Google Scholar] [CrossRef]
  7. Hattersley, A.T.; Patel, K.A. Precision diabetes: Learning from monogenic diabetes. Diabetologia 2017, 60, 769–777. [Google Scholar] [CrossRef] [PubMed] [Green Version]
  8. Luo, J.; Wu, M.; Gopukumar, D.; Zhao, Y. Big data application in biomedical research and health care: A literature review. Biomed. Inform. Insights 2016, 8, BII-S31559. [Google Scholar] [CrossRef] [PubMed] [Green Version]
  9. Walker, T.M.; Kohl, T.A.; Omar, S.V.; Hedge, J.; Elias, C.D.O.; Bradley, P.; Lqbal, Z.; Feuerriegel, S.; Niehaus, K.E.; Wilson, D.J.; et al. Whole-genome sequencing for prediction of Mycobacterium tuberculosis drug susceptibility and resistance: A retrospective cohort study. Lancet Infect. Dis. 2015, 15, 1193–1202. [Google Scholar] [CrossRef] [Green Version]
  10. Dakin, J.P.; HOTATE, K.; Lieberman, R.A.; Marcus, M.A. Optical Fiber Sensors. Handb. Optoelectron; CRC Press: Boca Raton, FL, USA, 2017; pp. 347–430. [Google Scholar]
  11. Epelman, S.; Liu, P.P.; Mann, D.L. Role of innate and adaptive immune mechanisms in cardiac injury and repair. Nat. Rev. Immunol. 2015, 15, 117–129. [Google Scholar] [CrossRef]
  12. Lee, H.; Shin, T.H.; Cheon, J.; Weissleder, R. Recent developments in magnetic diagnostic systems. Chem. Rev. 2015, 115, 10690–10724. [Google Scholar] [CrossRef] [Green Version]
  13. Sreekanth, K.V.; Alapan, Y.; ElKabbash, M.; Ilker, E.; Hinczewski, M.; Gurkan, U.A.; Luca, A.D.; Strangi, G. Extreme sensitivity biosensing platform based on hyperbolic metamaterials. Nat. Mater. 2016, 15, 621–627. [Google Scholar] [CrossRef] [PubMed] [Green Version]
  14. Al-Naib, I. Biomedical Sensing with Free-Standing Complementary Supercell Terahertz Metasurfaces. Crystals 2020, 10, 372. [Google Scholar] [CrossRef]
  15. Baryshev, A.V.; Merzlikin, A.M. Plasmonic photonic-crystal slabs: Visualization of the Bloch surface wave resonance for an ultrasensitive, robust and reusable optical biosensor. Crystals 2014, 4, 498–508. [Google Scholar] [CrossRef] [Green Version]
  16. Nemes, P.; Woods, A.S.; Vertes, A. Simultaneous imaging of small metabolites and lipids in rat brain tissues at atmospheric pressure by laser ablation electrospray ionization mass spectrometry. Anal. Chem. 2010, 82, 982–988. [Google Scholar] [CrossRef] [Green Version]
  17. Antonucci, F.; Pallottino, F.; Paglia, G.; Palma, A.; D’Aquino, S.; Menesatti, P. Non-destructive estimation of mandarin maturity status through portable VIS-NIR spectrophotometer. Food Bioprocess Technol. 2011, 4, 809–813. [Google Scholar] [CrossRef]
  18. Sagle, L.B.; Ruvuna, L.K.; Ruemmele, J.A.; Van Duyne, R.P. Advances in localized surface plasmon resonance spectroscopy biosensing. Nanomedicine 2011, 6, 1447–1462. [Google Scholar] [CrossRef] [PubMed] [Green Version]
  19. Bai, Y.; Shu, T.; Su, L.; Zhang, X. Fluorescent gold nanoclusters for biosensor and bioimaging application. Crystals 2020, 10, 357. [Google Scholar] [CrossRef]
  20. Zhang, X.; Fales, A.; Vo-Dinh, T. Time-resolved synchronous fluorescence for biomedical diagnosis. Sensors 2015, 15, 21746–21759. [Google Scholar] [CrossRef] [PubMed] [Green Version]
  21. Chen, K.; Zeng, Y.; Wang, L.; Gu, D.; He, J.; Wu, S.Y.; Ho, H.P.; Li, X.J.; Qu, J.L.; Gao, B.Z.; et al. Fast spectral surface plasmon resonance imaging sensor for real-time high-throughput detection of biomolecular interactions. J. Biomed. Opt. 2016, 21, 127003. [Google Scholar] [CrossRef] [Green Version]
  22. Kaneko, S.; Suero Molina, E.; Ewelt, C.; Warneke, N.; Stummer, W. Fluorescence-based measurement of real-time kinetics of protoporphyrin IX after 5-aminolevulinic acid administration in human in situ malignant gliomas. Neurosurgery 2019, 85, E739–E746. [Google Scholar] [CrossRef]
  23. Sahu, K.; Verma, Y.; Sharma, M.; Rao, K.D.; Gupta, P.K. Non-invasive assessment of healing of bacteria infected and uninfected wounds using optical coherence tomography. Skin Res. Technol. 2010, 16, 428–437. [Google Scholar] [CrossRef] [PubMed]
  24. Behrooz, A.; Waterman, P.; Vasquez, K.O.; Meganck, J.; Peterson, J.D.; Faqir, I.; Kempner, J. Multispectral open-air intraoperative fluorescence imaging. Opt. Lett. 2017, 42, 2964–2967. [Google Scholar] [CrossRef] [PubMed]
  25. Lee, O.; Kim, J.; Park, G.; Kim, M.; Son, S.; Ha, S.; Oh, C. Non-invasive assessment of cutaneous wound healing using fluorescent imaging. Skin Res. Technol. 2015, 21, 108–113. [Google Scholar] [CrossRef] [PubMed]
  26. Xie, Y.; Thom, M.; Miserocchi, A.; McEvoy, A.W.; Desjardins, A.; Ourselin, S.; Vercauteren, T. Multi-scale spectrally resolved quantitative fluorescence imaging system: Towards neurosurgical guidance in glioma resection. Clinical and Translational Neurophotonics; International Society for Optics and Photonics: San Francisco, CA, USA, 2017; Volume 10050, p. 1005002. [Google Scholar]
  27. Nath, B.; Raza, A.; Sethi, V.; Dalal, A.; Ghosh, S.S.; Biswas, G. Understanding flow dynamics, viability and metastatic potency of cervical cancer (HeLa) cells through constricted microchannel. Sci. Rep. 2018, 8, 1–10. [Google Scholar] [CrossRef]
  28. Davis, D.W.; Haider, A.; Pierron, V.; Schmidlin, F. Apostream to isolate circulating tumor cells (CTC) from castration-resistant prostate cancer patients (CRPC) that express androgen receptor variant 7 (AR-V7) associated with resistance to AR-targeting drugs. J. Clin. Oncol. 2016, 34, e23025. [Google Scholar] [CrossRef]
  29. Mnif, I.; Ghribi, D. Review lipopeptides biosurfactants: Mean classes and new insights for industrial, biomedical, and environmental applications. Pept. Sci. 2015, 104, 129–147. [Google Scholar] [CrossRef]
  30. Shrivastava, P.; Kumar, R. Soil salinity: A serious environmental issue and plant growth promoting bacteria as one of the tools for its alleviation. Saudi J. Biol. Sci. 2015, 22, 123–131. [Google Scholar] [CrossRef] [PubMed] [Green Version]
  31. Tam, A.M.W.; Qi, G.; Srivastava, A.K.; Wang, X.Q.; Fan, F.; Chigrinov, V.G.; Kwok, H.S. Enhanced performance configuration for fast-switching deformed helix ferroelectric liquid crystal continuous tunable Lyot filter. Appl. Opt. 2014, 53, 3787–3795. [Google Scholar] [CrossRef]
  32. Aharon, O.; Abdulhalim, I. Liquid crystal Lyot tunable filter with extended free spectral range. Optics Express 2009, 17, 11426–11433. [Google Scholar] [CrossRef]
  33. Yang, D.K.; Wu, S.T. Fundamentals of Liquid Crystal Devices; John Wiley & Sons: Hoboken, NJ, USA, 2014. [Google Scholar]
  34. Yan, K.; Guo, Q.; Wu, F.; Sun, J.; Zhao, H.; Kwok, H.S. Polarization-independent nematic liquid crystal phase modulator based on optical compensation with sub-millisecond response. Opt. Express 2019, 27, 9925–9932. [Google Scholar] [CrossRef] [PubMed]
  35. Sun, N.; Li, X.; Wang, Z.; Li, Y.; Pei, R. High-purity capture of CTCs based on micro-beads enhanced isolation by size of epithelial tumor cells (ISET) method. Biosens. Bioelectron. 2018, 102, 157–163. [Google Scholar] [CrossRef] [PubMed]
Figure 1. (a) Fast tunable biofluorescence detection system with integrable liquid crystal filter (LCTF); Red fluorescent protein labeled Hela cells (RFP); Green fluorescent protein labeled Hela cells (GFP); (b) Experimental System setups; (c) Cell excitation light through designed LCTF; (d) UV excitation light and Pseudomonas fluorescent light.
Crystals 11 00272 g001
Figure 2. (a) Experimental setup for spectrum filtering based on electrically controlled birefringence; (b) Corresponding optical path physical map.
Crystals 11 00272 g002
Figure 3. (a) Schematic diagram of electrically controlled distribution of molecular directors and corresponding textures under polarized microscope; (b) The fluorescence transmittances versus applied voltages for the three wavelengths; (c) The curve of the maximum transmittance at different wavelengths.
Crystals 11 00272 g003
Figure 4. Static characterization of the cells and Pseudomonas with scanning electron microscope (SEM) and fluorescent microscopic photographs.
Crystals 11 00272 g004
Figure 5. (a) The relationship between the transmission of liquid crystal at different wavelengths and the signal frequency at both ends of the liquid crystal at a specific voltage; (b) Experimental confirmation of the speed of liquid crystal reaction.
Crystals 11 00272 g005
Table 1. Switching time of liquid crystal among multiple fluorescence.
τ12τ23τ32τ21
Switching time (ms)12.6613.1720.7810.85
Publisher’s Note: MDPI stays neutral with regard to jurisdictional claims in published maps and institutional affiliations.

