Article

Growth Peculiarities and Properties of KR3F10 (R = Y, Tb) Single Crystals

by
Denis N. Karimov
1,*,
Irina I. Buchinskaya
1,
Natalia A. Arkharova
1,
Anna G. Ivanova
1,
Alexander G. Savelyev
1,
Nikolay I. Sorokin
1 and
Pavel A. Popov
2
1
Shubnikov Institute of Crystallography of Federal Scientific Research Center «Crystallography and Photonics», Russian Academy of Sciences, Leninskiy Prospekt 59, 119333 Moscow, Russia
2
Department of Physics and Mathematics, Petrovsky Bryansk State University, Bezhitskaya Str. 14, 241036 Bryansk, Russia
*
Author to whom correspondence should be addressed.
Submission received: 24 February 2021 / Revised: 10 March 2021 / Accepted: 11 March 2021 / Published: 14 March 2021
(This article belongs to the Special Issue Functional Materials Based on Rare-Earth Elements)

Abstract

:
Cubic KR3F10 (R = Y, Tb) single crystals have been successfully grown using the Bridgman technique. Growth of crystals of this type is complicated due to the hygroscopicity of potassium fluoride and melt overheating. The solution to the problem of oxygen-incorporated impurities has been demonstrated through the utilization of potassium hydrofluoride as a precursor. In this study, the crystal quality, structure features, and optical, thermal and electrophysical properties of KR3F10 were examined. Data on the temperature dependences of conductivity properties of KTb3F10 crystals were obtained for the first time. These crystals indicated thermal conductivity equal to 1.54 ± 0.05 Wm−1K−1 at room temperature caused by strong phonon scattering in the Tb-based crystal lattice. Ionic conductivities of KY3F10 and KTb3F10 single crystals were 4.9 × 10⁻⁸ and 1.2 × 10⁻¹⁰ S/cm at 500 K, respectively, and the observed difference was determined by the activation enthalpy of F ion migration. Comparison of the physical properties of the grown KR3F10 crystals with the closest crystalline analog from the family of Na0.5−xR0.5+xF2+2x (R = Tb, Y) cubic solid solutions is reported.

Graphical Abstract

1. Introduction

Crystalline materials are the basis of any optical and optoelectronic device. The possibility to grow bulk crystals with unique fundamental properties determines the functionality of the instrumentation, practical technological applications, and common progress in science and industry. Among complex inorganic fluorides based on rare-earth ions, KR3F10 (where R = Y, Tb–Lu) single crystals with a cubic structure attract special attention as promising materials for optics and photonics [1,2,3,4].
KY3F10 (KYF) single crystals, as the best studied representatives of this large KR3F10 family, have acquired practical importance as a construction optical material and a laser matrix for various rare-earth ion doping [4,5,6,7,8,9,10,11,12,13,14,15]. Another prospective representative, KTb3F10 (KTF) crystal, is the next generation magneto-optical material for the visible and near infrared optical Faraday isolators [16,17,18,19]. In contrast to Tb-based fluoride crystals such as TbF3 and LiTbF4, this material is optically isotropic and has serious advantages over the traditionally used magneto-optical terbium-gallium garnet crystals due to their excellent thermo-optical performance. In addition, KTb3F10 crystals are of interest as a high power converter phosphor for LEDs and a potential candidate for X-ray slow scintillating applications [20].
For the first time, KTb3F10 single crystals were grown using the Czochralski method [21,22], and at present the industrial crystallization of these crystals is carried out by Northrop Grumman SYNOPTICS (USA) using a top-seeded solution growth method [23,24]. Recently, optimization of the melt composition using the Bridgman–Stockbarger method for KTb3F10 crystal growth was carried out, and the incongruent (peritectic) melting of this compound and the unambiguous presence of the homogeneity region were confirmed [25].
Pure and rare-earth doped KY3F10 single crystals are grown from a melt by various methods of directional crystallization [4,26,27,28]. These crystals have a congruent melting characteristic and melting point at T = 1263 K. A detailed review of phase interactions in the KF–YF3 system was reported in [29,30]. The crystal structure of this fluoride is considered a cubic 2 × 2 × 2 fluorite superstructure (space group F m 3 ¯ m , Z = 8), which consists of two ionic groups [KY3F8]2+ and [KY3F12]2– alternating along the three crystallographic directions [27,28].
However, study of the growth process peculiarities and the characterization of KR3F10 bulk crystals have not been sufficiently conducted so far. These crystals are considered difficult to grow with high optical quality, even with well-established techniques. Compared to other fluoride compounds, KR3F10 crystals often grow cloudy. It is possible to obtain high quality of these crystals only using absolutely dry initial reagents and a pure growth process [1].
The aim of this paper is investigation of some features of the KR3F10 crystal growth by the vertical directional crystallization for R = Y and Tb, possessing a distinctly congruent and incongruent melting characteristic, respectively, and investigation of physical properties.

2. Materials and Methods

2.1. Growth Equipment Design

At present, large-size fluoride single crystals are grown from the melt using the Czochralski and Bridgman (Stockbarger) methods [31,32,33,34], and less often using the Kyropoulos and vertical gradient freeze (VGF) methods. The micro-pulling-down (μ–PD) method for obtaining single-crystal fibers has also been presented [35,36]. The Czochralski method allows high quality single crystals to be obtained. However this technology is expensive and complicated in comparison with the Bridgman technique.
In this work, the Bridgman–Stockbarger method for growing KR3F10 single crystals was used. The use of a heating unit in the single-heater configuration to provide a sharp temperature gradient at the crystal–melt interface and in the cooling zone allows the growth of crystals of the simple fluorides and multicomponent congruently melting compositions. In most cases such thermal conditions lead to significant mechanical stresses and block the crystal structure. The growth of perfect crystals (especially incongruently melting and with pronounced cleavage) without plastic deformation traces requires a presence of the special zone with a relatively small temperature gradient at the cooling and annealing stages. Thus, complex multi-zone temperature conditions are required for the crystal growth. The best results can be obtained by using a configuration of multi-zone heating units (with two or more heaters) and a water-cooled diaphragm between them. Modeling of the crystallization conditions for our objects (transparent dielectrics) is complicated by the fact that the dominant thermal radiation in the process of heat transfer in the melt and crystal introduces nonlinearity. Complex numerical and experimental studies of thermal fields during crystallization of partially transparent materials have demonstrated that to maintain optimal crystallization conditions (uniform axial temperature gradient and preservation of the linear solidification rate), programmed variation of the heaters electric power is required [31,37].
The heating furnace split into two independent sections by means of Mo or a graphite diaphragm was employed in this work. (Figure 1a,b). This equipment allows crystals to be grown using various methods of vertical directional crystallization of the melt (Bridgman–Stockbarger, gradient freezing, Kyropoulos methods) under a minor reconstruction of the heating unit. Thus, it is possible to grow crystals of high-temperature hydrolysable fluoride with diameter up to 80 mm and length up to 140 mm, both in vacuum and in a fluorinating atmosphere [38,39,40,41]. The upper temperature limit is 2250 K. The growth chamber provides deep evacuation to a residual pressure of 10−3 Pa using a turbomolecular pump system.
The axial temperature gradient at the crystallization front is varied through the double-zone configuration of the heating unit (Figure 1c). Such a configuration provides fine tuning of the crystallization process thermal parameters for a specific type of crystal, both in the growth zone and in the cooling zones, and ultimately improves the quality of the grown crystals. By varying the electric power ratio (W1/W2) of the heaters, it is possible to change the temperature gradient in the range of 15–100 K/cm in the growth zone and create practically gradient-free conditions in the cooling zone under optimally selected parameters of the crystallization process.

2.2. Initial Chemical Reagents and Growth Parameters of Growth Process

As mentioned above, KYF crystals have a distinctly congruent melting character, whereas KTF crystals melts incongruently, and this greatly complicates the growth of this Tb-based compound (Figure 2). The initial melt composition for growing KYF is determined by its stoichiometry, although the optimal composition of the melt for KTF growth by the Bridgman–Stockbarger technique corresponds to a content of 27.5 ± 0.5 mol. % KF [25].
The high purity anhydrous powder YF3, TbF3 (99.99%, LANHIT, Moscow, Russia), KF (≥99.9% Sigma-Aldrich, Louis, MO, USA), and laboratory-made hydrofluoride KHF2, which was obtained by the interaction of carbonate K2CO3 (99.995%, Sigma-Aldrich) with a concentrated HF solution, were utilized as raw materials. The rare-earth trifluoride powders were preliminarily annealed in vacuum (~10−2 Pa) for 3–5 h at 450 K, then melted in a fluorinating (He+CF4+HF) atmosphere for deep purification from oxygen-containing impurities. Directional crystallization of KYF and KTF was carried out in a He+CF4 atmosphere in a multicellular graphite crucible. Fused YF3 or TbF3 were separately placed in the crucible channels as seeds. The melt composition was stoichiometric (25/75 mol. %) for KYF and enriched in KF (28/72 mol. %) for KTF.
The following technological parameters of the growth process were applied: preliminary homogenization of the melt for 3 h, melt overheating of about 100 K, the temperature was controlled by the W/Re thermocouple and by the reference substance melting (TbF3, Tm = 1455 ± 8 K); the temperature gradient in the growth zone was ~80 K/cm. After starting the growth, the pulling rate was set to 2–3 mm/h; the cooling rate of the crystals was 50–100 K/h. The evaporation losses during the crystallization process did not exceed 1 wt. %. Thus, 30–50 mm long KR3F10 crystals with 10–30 mm in diameter were successfully grown.
Cubic Na0.4R0.6F2.2 (R = Y, Tb) single crystals were grown additionally according to previously described methods [42,43,44] for comparative analysis of the properties.

2.3. X-ray Diffraction (XRD) Analysis

The XRD analysis of the crystal was carried out using an X-ray powder diffractometer Rigaku MiniFlex 600 (CuKα radiation). The diffraction peaks were recorded within the angle range 2θ from 10 to 140°. Crystal phases were identified using the ICDD PDF-2 (2017). The unit-cell parameters were calculated using the Le Bail full-profile fitting (the Jana2006 software).

2.4. Scanning Electron Microscopy (SEM)

The SEM and mapping/elemental area analysis of the grown crystals were performed on Quanta 200 3D scanning electron microscope (FEI, Hillsboro, IL, USA) equipped with EDX (EDAX, Hillsboro, IL, USA).

2.5. Single-Crystal X-ray Diffraction Study of KR3F10

For both compounds, KTb3F10 and KY3F10 suitable crystals were selected and mounted on the Rigaku XtaLAB Synergy-DW diffractometer equipped with HyPix-Arc 150 detector. Single-crystal X-ray diffraction data were collected at room temperature using monochromatized MoKα-radiation for KTb3F10 and AgKα-radiation for KY3F10. The intensities were corrected for numerical absorption based on Gaussian integration over a multifaceted crystal model using the CrysAlisPro software [45]. The crystal structures of KR3F10 (R = Y, Tb) were solved by the intrinsic phasing method using ShelXT [46] structure solution program with Olex2 [47] and refined with the anisotropic displacement parameters for all sites using ShelxL [48] by the full-matrix least-squares method.

2.6. Optical Properties

Transmission spectra of the crystals were recorded under room temperature using a Varian Cary 5000 spectrophotometer (Agilent Technologies, Santa Clara, CA, USA) in the spectral region λ = 0.19–3.30 µm. Samples for investigation were taken from the middle part of the crystal ingots.

2.7. The Thermal Conductivity Measurements

The temperature dependence of crystal thermal conductivity k(T) was measured by an absolute steady-state axial heat flow technique in the temperature range of 50–300 K. The measurement procedure was described in detail in [49]. The samples represented non-oriented parallelepipeds with an approximate size of 6 × 6 × 20 mm3. The error in determining the absolute k value did not exceed ±5%.

2.8. The Electrical Conductivity Measurements

The electrical conductivity σdc of the KR3F10 crystals was determined by impedance spectroscopy. The impedance measurements were carried out in the frequency range of 5–5 × 10⁵ Hz and the resistance range of 1–107 Ohm using a Tesla B-507 impedance tester at temperatures of 550–825 K in the vacuum ~1 Pa. KR3F10 single crystals have a perfect cleavage along the crystallographic (111) plane. Taking this into account, samples oriented along the crystallographic [111] direction were prepared. The thickness of the samples was about 1.5 mm and the silver electrode areas were about 20–30 mm2. Silver paste (Leitsilber) was used as a current-conducting electrode. The relative measurement error did not exceed 5%. The presence in the impedance spectra of the blocking effect from inert (silver) electrodes at low frequencies indicates the ionic nature of the electrical transfer.

3. Results and Discussion

3.1. Growth Process Results and Crystals Characterization

The utilization of KF as a precursor is absolutely unsuitable for the production of oxygen-free KR3F10 crystals (see Figure 3a) as shown by our growth experiments. These crystals appeared cloudy and opalescent or contained cloudy inclusions in the bulk. The use of a hard fluorinating growth atmosphere (fully consisting of CF4) did not lead to positive results.
The use of potassium hydrofluoride in the synthesis of KR3F10 single crystals has shown significant advantages. Hydrofluoride KHF2 decomposes according to the scheme: KHF2 = KF + HF in the temperature range from 430 to 450 K with the evolution of anhydrous hydrogen fluoride [50], which has an additional fluorinating effect on the melt during growth process. KR3F10 crystals grown using potassium hydrofluoride were colorless and transparent in ambient light, and did not contain scattering inclusions (Figure 3b,c). In some cases, crystals had cracks due to perfect cleavage along the (111) planes if high cooling rates (over 75 K/h) were applied.
The assignment of grown crystals to the CaF2 structure type (space group F m 3 ¯ m , Z = 8) was confirmed by XRD. The diffraction patterns of the KR3F10 crystals are shown in Figure 4. Transparent crystal parts are single phase. The cubic lattice parameter of the KYF crystal is a = 11.5468(1) Å at room temperature, which is confirmed by the published data (coincides with the standard patterns PDF #75-3059). The composition of the transparent part of KTF crystal is not constant and represents a partial solid solution; a change in the lattice parameter a from 11.679(1) to 11.663(1) Å is observed along the length of the ingot, respectively. The structural aspects of the formation of such a solid solution and the mechanism of its nonstoichiometry require detailed study in the future. Crystal density ρ = 4.262(5) g/cm3 for KYF (measured by hydrostatic weighing in distilled water) is insignificantly lower than the theoretical density data for KYF. For the terbium analogue, ρ = 5.806(5) g/cm3.
Losses during growth (up to 1 wt. %) are mainly due to the evaporation of more volatile KF. Therefore, a shift of the composition to the RF3-enriched region occurs. As a result of incongruent melting, additional impurity phases were detected in the parts of the KR3F10 crystalline boules, which crystallized last. SEM and XRD revealed the presence of additional impurity of YF3 in the opaque part of the KYF crystal. The eutectic (KYF + YF3) mixture and the precipitated YF3 rod-like phase in the bulk KYF matrix were clearly observed (Figure 5).
A decrease in the degree of melt overheating during growth results in an increase in the length of the useful transparent part of the KYF crystals. Two polymorphic modifications, KTb2F7 and the compound KTbF4, were detected in addition to the main cubic phase in the top parts of the grown KTF crystals, which crystallized last, as shown in [25].

3.2. Crystal Structure Refinement

The crystallographic parameters of KR3F10, experimental conditions of the data collection, and the structural refinement results are summarized in Table 1. Atomic positions and displacement parameters for KR3F10 compounds, and selected interatomic distances for KTb3F10 and KY3F10 crystals, are given in Tables S1, S2 and S3 respectively. CCDC 2062503 (KTb3F10) and 2062504 (KY3F10) contain the supplementary crystallographic data for this paper. The data can be obtained free of charge from The Cambridge Crystallographic Data Centre via www.ccdc.cam.ac.uk/structures (accessed on 14 March 2021).
KTb3F10 and KY3F10 compounds are isostructural and represent the structure type Zr3PbO4F6 [51]. Our crystal structure solution results confirm previous structural studies of KTb3F10 [20,52] and KY3F10 [27,28,53]. The asymmetric unit of KR3F10 contains one rare-earth cation R3+ (24e: 0.24, 0, 0), one anion K+ (8c: ¼, ¼, ¼), and two distinct sites of fluorine ions: F(1) (48i: 1/2, 0.1667, 0.1667) and F(2) (32f: 0.112, 0.112, 0.112). Rare-earth cations R3+ are bonded to eight fluorine ions forming square antiprisms. The crystal structure of KR3F10 can be described by considering two types of fundamental building blocks—polyanionic clusters of six RF8 square antiprisms connected either along edges—[R6F32] cluster or along vertices—[R6F36] ones [20,27,28,52,53,54,55].
Taking into account the shortest distances between the R3+ cations, one can consider the [R6F32] cluster, in which the 24 external F(1) fluorine atoms form a truncated octahedron, and eight internal F(2) atoms form a cubic central cavity (Figure 6, left). The alternative means of describing the crystal structure is based on the polyanionic cluster [R6F36] in which 12 internal F(1) atoms form a central cuboctahedral cavity and 24 outer F(2) atoms form a rhombicuboctahedron (Figure 7, left). In both cases, the clusters and K+ ions are arranged as Ca2+ and F- ions in the fluorite structure (Figure 6 and Figure 7). The clusters [R6F36] or [R6F32] adopt a face-cubic centered arrangement, occupying the vertices and face centers of the cubic unit cell, and are connected through F–F edges to form a three-dimensional framework. The K+ ions occupy the tetrahedral interstitial sites in fluorite-like structure and are coordinated with four nearest fluorine ions F(2) at distances of 2.786 Å in KTb3F10 or 2.766 Å in KY3F10, and to twelve fluorine atoms F(1) at a distance of 3.226 Å in KTb3F10 or 3.195 Å in KY3F10 (Figure 7, right).
The composition of the polyanionic [R6F36] cluster is similar to that of the rare-earth cluster in the ordered phases of the MF2RF3 systems (where M—alkaline earth, R—rare-earth cations). This reveals the affinity of the KR3F10 structural type with other fluorite-like ordered phases containing anionic [R6F36] cuboctahedra. This approach makes it possible to consider KR3F10 crystals as representatives of fluorite-like phases MF2RF3 and to describe their structurally dependent properties from the point of view of general structural nature [56].

3.3. Optical Properties of KR3F10 Crystals

The optical absorption spectra of the grown KR3F10 crystals are shown in Figure 8a, b. Both transparent and opalescent KYF crystals exhibit high absorption in the ultraviolet spectral region (Figure 8a). Significant increase in the overall absorption level in the visible region due to strong light scattering was observed for the opalescent oxygen-content KYF samples. Their short-wavelength transmission limit was significantly shifted to the visible spectral region.
A number of additional weak absorption bands were observed in the IR range for the opalescent KYF crystal (Figure 8a, inset). It is known that some oxygen impurities, namely OH groups and HCO complexes, are responsible for the appearance of absorption bands in the range λ = 2.6–3.5 µm [57]. As seen from Figure 8a, the IR spectrum contains weakly intense narrow bands that can be attributed to these complexes. The OH and HCO complexes are due to carbon contamination caused by oxides, which is not totally eliminated in the synthesis process and indicates that there were water vapor traces during the crystal growth process. No IR absorption bands appeared in this spectral range for the transparent KYF samples. Additional deep purification of the initial charge and atmosphere during the growth process can significantly improve the spectral quality of these crystals in the short-wavelength part of the transparency window. The last is highly sensitive to the oxygen impurity contaminations. Note that oxygen-free KYF crystals are characterized by a wide transparency region up to 0.13 μm and are promising optical materials for the VUV spectral region [58,59].
The absorption spectrum of KTb3F10 crystal is represented in Figure 8b. This is typical for crystals containing Tb3+ ions. The electro-dipole transitions within the 4f8 configuration of this ion are clearly observed without additional impurity lines [18,20,21]. KTb3F10 crystals demonstrate a transparency window in the range of 0.4–1.5 μm, with the exception of a narrow absorption line near λ = ~485 nm (7F6–5D4 transition of Tb3+ ion).

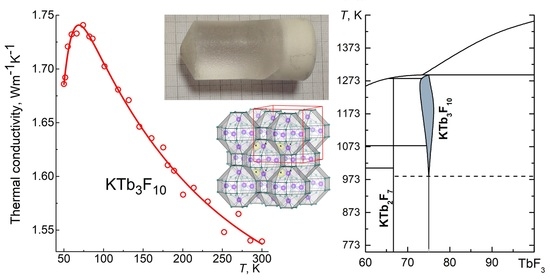
3.4. Thermal Conductivity Measurements

The thermal conductivity of KTb3F10 crystals was measured for the first time in a wide temperature range (Figure 9a). The thermal conductivity temperature dependences k(T) of KYF [60], Na0.4Y0.6F2.2, and Na0.37Tb0.63F2.26 [61] crystals are shown for comparison (Figure 9b). It is noticeable that the k(T) dependences of the KR3F10 and Na0.5–xR0.5+xF2+2x crystal families differ significantly. The presence of a large number of phonon scattering centers in Na0.5–xR0.5+xF2+2x crystals determines the glass-like character of their k(T) dependences.
The thermal conductivity of the KTb3F10 crystal is also low; it varies within narrow limits, from 1.54 to 1.74 Wm−1K−1 in the explored temperature range. Amorphous materials have similar values of the thermal conductivity coefficient. However, in the region of T = 74 K, a low-temperature maximum k(T) characteristic of crystalline media was observed for KTb3F10. These features indicate, on the one hand, the presence of a long-range order in the crystal structure of this material, and, on the other hand, a very significant phonon scattering manifestation in the investigated temperature range.
The KTF crystal is significantly inferior to its yttrium isostructural KYF analogue in terms of thermal conductivity. For comparison, the composition of KTF contains K+ and Tb3+ cations, which differ greatly in mass, whereas the corresponding difference is less in KYF crystal. A significant difference in the masses of the oscillators predetermines the presence of optical modes in the phonon spectrum of a crystal, which usually make a small contribution to heat transfer compared to acoustic modes. So this factor makes the crystal a poor heat conductor. In addition, a higher density of the KTb3F10 crystal corresponds to a lower average propagation velocity of acoustic vibration modes.
Another possible factor determining the comparatively low thermal conductivity of KTb3F10 crystal should be indicated. In many cases, Tb3+ ions exhibit splitting of the electron paramagnetic levels of the 4f shell. Oxide Tb-based crystals (differing from fluoride crystals due to a stronger crystal field) are characterized by a relatively low thermal conductivity [62]. If the magnitude of the splitting ΔE is in the range of 0–200 cm–1, then it should be the cause of resonant phonon scattering and a corresponding decrease in thermal conductivity. Unfortunately, no data on this level splitting in the KTb3F10 can be found in the literature.
Disorder in the crystal structure usually results in phonon scattering. The basic fluorite structure of KR3F10 crystals is characterized by a divalent oxidation state of cations. The presence of trivalent rare-earth ions causes the appearance of large defect clusters, which are effective centers of phonon scattering. The consequence of this is a significant decrease in thermal conductivity and a weakening of its k(T) dependence. This phenomenon is well known (see, for example, [63,64,65]) for the heterovalent solid solution M1–xRxF2+x (M = Ca, Sr, Ba; R—rare-earth) crystals with a fluorite structure. The behavior of the thermal conductivity of M1–xRxF2+x crystals becomes characteristic of glasses due to percolation of clusters at high concentrations of trivalent ions. Apparently, the presence of [R6F36] structural blocks and their ordering can determine the thermal conductivity in the case of KR3F10 crystals. Therefore, the temperature dependence of the thermal conductivity of KR3F10 crystals can be considered as transitional from k(T) of undoped MF2 crystals to k(T) of concentrated heterovalent M1–xRxF2+x solid solutions.
The results of a comparison of the thermal conductivity of Na0.4Y0.6F2.2 and Na0.37Tb0.63F2.26 crystals were as expected (Figure 9b). The presence of Tb3+ ions in the crystal composition in this case is also a negative factor and leads to its significant decrease, converting crystals of this type into low-temperature heat insulators.

3.5. Ionic Conductivity Measurements

The temperature dependences of ionic conductivity σdc(T) for different crystal samples in the KF–YF3 system are shown in Figure 10a. It can be seen that the transparent and opalescent KYF crystal fragments have the same σdc values. The conductivity for the eutectic (KY3F10 + YF3) composite is higher than for the pure KYF compound. The extrapolated σdc values at 500 K are 1.7 × 10⁻⁹ and 1.2 × 10⁻¹⁰ S/cm for the composite and KYF single crystal, respectively. The comparison σdc(T) dependences for KR3F10 crystals are shown in Figure 10b. Data for Na0.5–xR0.5+xF2+2x solid solution crystals are shown additionally.
The σdc(T) dependences for KR3F10 (R = Tb, Y) single crystals were fitted according to the Arrhenius–Frenkel equation:
σdcT = Aexp(−Hσ/kBT),
where A—preexponential conductivity factor, Hσ—activation enthalpy of ion transport, kB—Boltzmann’s constant, T—temperature. The Arrhenius–Frenkel equations parameters and measured room temperature thermal conductivity data are given in Table 2. The ionic conductivity of KYF was much higher than that of KTF, because KYF has a lower potential barrier for the charge carrier migration (Hσ) than that of KTF.
The σdc value for KTb3F10 is two orders of magnitude higher than for KY3F10 crystals. Nevertheless, results obtained for KR3F10 compounds and the electrophysical data for the Na0.5–xR0.5+xF2+2x solid solutions show that the fluorine-ion transfer in the KF-based compounds is significantly lower than in the NaF-based ones (Figure 10b). This drop in ionic conductivity magnitude is primarily associated with a twofold increase in potential barriers to the migration of charge carriers: from 0.7–0.8 eV for Na0.5–xR0.5+xF2+2x (R = Tb, Y) to 1.2–1.6 eV for KR3F10 crystals. The σdc(T) dependences for Na0.5–xR0.5+xF2+2x solid solution crystals consist of two linear segments with the temperature of the transition between them of T = ~750 K (Figure 10b). Each segment of conduction dependences satisfies the Arrhenius–Frenkel equation. A similar situation is valid for fluorite-type Ca1–xRxF2+x (R = La–Lu, Y) crystals [68]. A common feature of the conductivity of these crystals is the fulfillment of the following condition: activation enthalpy of ion transport in the high-temperature region is greater than in the low-temperature region. The high-temperature region of conductivity is probably connected with the process of dissociation of bonded fluorine ions from clusters.
According to structural studies of disordered Na0.5–xR0.5+xF2+2x (R = Y, Ho, Yb) solid solutions [69,70,71], the octahedral clusters [R6F37] are formed in their crystalline lattices. Taking into account the nearest cationic (M) environment of [R6F37] clusters, they can be represented as superclusters {M8[R6F37]F32}, where 8M2+ = 4Na+ + 4R3+ [56]. The {M8[R6F37]F32} clusters at M2+ = Ca2+, Sr2+, Ba2+ are also formed in nonstoichiometric fluorites of Ca1–xRxF2+x (R = Dy–Lu, Y), Sr1–xRxF2+x (R = Nd–Lu, Y) and Ba1–xRxF2+x (R = La–Lu, Y) and Ca2YbF7, Sr4Lu3F17, Ba4R3F17 (for R = Yb, Y) ordered ones [68,72,73,74]. Ionic transfer in Na0.5–xR0.5+xF2+2x solid solutions occurs in the anionic sublattice and is caused by the hopping migration of F ions according to the interstitial mechanism. The scheme of heterovalent substitutions in the fluorite structure of Na0.5–xR0.5+xF2+2x has the following form (block isomorphism model) [75]:
{(Na,R)14F64}36− → {(Na0.5R0.5)8[R6F37]F32}35− + Fmob,
where Fmob is a mobile charge carrier.
Thus, the rare-earth sublattice in nonstoichiometric fluorite-type Na0.5−xR0.5+xF2+2x phases is disordered and only short-range order (octahedral clusters) is observed. In the superstructural fluorite-type KR3F10 (K0.25R0.75F2.50 composition) phases, long-range order appears [28,52,56] in the cationic and anionic sublattices. Structural ordering in KR3F10 crystals leads to an increase in potential barriers to carrier migration and a decrease in conductivity by 2–4 orders of magnitude.

4. Conclusions

Bulk KR3F10 (R = Y, Tb) single crystals were successfully grown by the Bridgman technique. The synthesis, growth parameters, and investigation of properties are presented for crystals of this type in detail.
Thermal conductivity k(T) of KR3F10 crystals experimentally determined for the first time in the temperature range of 50–300 K noticeably exceeds the thermal conductivity of isostructural Na0.5–xR0.5+xF2+2x solid solution crystals (R = Tb, Y). It is shown that the Tb-based fluoride crystals are inferior in thermal conductivity to yttrium analogs due to significant phonon scattering manifestation. The temperature dependences of the ionic conductivity σdc(T) of KR3F10 (R = Y, Tb) crystals were investigated. σdc(T) dependences satisfy the Frenkel–Arrhenius equation in the temperature range 550–820 K. Comparison of the electroconductive properties of KR3F10 compounds and Na0.5–xR0.5+xF2+2x solid solutions, the structure of which builds on the [R6F37] clusters basis, is performed. The ordered KR3F10 superstructure formed on the basis of these clusters leads to a twofold increase in potential barriers for the migration of charge carriers and a drop in ionic conductivity (at 500 K) by 2–4 orders of magnitude in KR3F10 single crystals compared to Na0.5–xR0.5+xF2+2x solid solutions with a disordered cluster formation.
These complex studies, from crystal growth to structure determination and study of properties, will be of great importance for photonic applications of complex fluorides KR3F10 (R = Y, Tb) in the future.

Supplementary Materials

The following are available online at https://0-www-mdpi-com.brum.beds.ac.uk/2073-4352/11/3/285/s1, Table S1: Atomic positions and displacement parameters for KR3F10 (R = Y, Tb) crystals, Table S2: Selected interatomic distances for KTb3F10 single crystal, Table S3: Selected interatomic distances for KY3F10 single crystal, CIF file for KTb3F10 single crystal, CIF file for KY3F10 single crystal.

Author Contributions

D.N.K., I.I.B., N.A.A., P.A.P., N.I.S. performed the experiments, prepared figures and manuscript; D.N.K., I.I.B. performed crystal growth experiments; N.A.A. and P.A.P. analyzed crystal quality; N.I.S. performed conductivity investigation; N.A.A., A.G.I. performed crystal structure analysis; A.G.S. performed spectroscopic investigation; P.A.P. performed thermal conductivity measurements; D.N.K., I.I.B., A.G.I., P.A.P. analyzed the data, interpreted experiments; D.N.K. provided the idea, designed the experiments; D.N.K. coordinated the scientific group. All authors have read and agreed to the published version of the manuscript.

Funding

This research was funded by the Russian Foundation for Basic Research (project 19-02-00877) in the part concerning growth of the crystals and by the Ministry of Higher Education and Science of the Russian Federation within the State assignments of the Federal Scientific Research Centre “Crystallography and Photonics” of the Russian Academy of Sciences in the part concerning investigation and analysis of crystal properties using the equipment of the Shared Research Center (project RFMEFI62119X0035).

Conflicts of Interest

The authors declare no conflict of interest. The funders had no role in the design of the study; in the collection, analyses, or interpretation of data; in the writing of the manuscript, or in the decision to publish the results.

References

  1. Denker, B.; Shklovsky, E. Handbook of Solid-State Lasers: Materials, Systems and Applications; Denker, B., Shklovsky, E., Eds.; Woodhead Publishing Series in Electronic and Optical Materials; Elsevier: Amsterdam, The Netherlands, 2013; p. 688. [Google Scholar]
  2. Kaminskii, A.A. Laser Crystals: Their Physics and Properties, 2nd ed.; Springer: Berlin/Heidelberg, Germany, 1990; p. 456. [Google Scholar] [CrossRef]
  3. Scholle, K.; Lamrini, S.; Koopmann, P.; Fuhrberg, P. 2 μm laser sources and their possible applications. In Frontiers in Guided Wave Optics and Optoelectronics; Pal, B., Ed.; InTech: London, UK, 2010; pp. 471–500. [Google Scholar] [CrossRef] [Green Version]
  4. Abdulsabirov, R.Y.; Dubiniski, M.A.; Kazakov, N.M.; Silkin, N.I.; Yagudin, S.I. New Fluoride Laser Host. Sov. Phys. Crystallogr. 1987, 32, 559–564. [Google Scholar]
  5. Veronesi, S.; Parisi, D.; Marchetti, F.; Tonelli., M. Effect of Ce co-doping on KYF: Pr crystals. J. Phys. Chem. Solids 2010, 71, 913–917. [Google Scholar] [CrossRef] [Green Version]
  6. Serna-Gallén, P.; Beltrán-Mir, H.; Cordoncillo, E. Tuning the optical and photoluminescence properties of high efficient Eu3+-doped KY3F10 phosphors by different synthetic approaches. Opt. Laser Technol. 2021, 136, 106734. [Google Scholar] [CrossRef]
  7. Tigreat, P.Y.; Doualan, J.L.; Budasca, C.; Moncorge, R. Energy transfer processes in (Yb3+, Dy3+) and (Tm3+, Dy3+) codoped LiYF4 and KY3F10 single crystals. J. Lumin. 2001, 94–95, 23–27. [Google Scholar] [CrossRef]
  8. Braud, A.; Tigreat, P.Y.; Doualan, J.L.; Moncorgé, R. Spectroscopy and cw operation of a 1.85 μm Tm:KY3F10 laser. Appl. Phys. B 2001, 72, 909–912. [Google Scholar] [CrossRef]
  9. Bigotta, S.; Tonelli, M.; Cavalli, E.; Belletti, A. Optical spectra of Dy3+ in KY3F10 and LiLuF4 crystalline fibers. J. Lumin. 2010, 130, 13–17. [Google Scholar] [CrossRef]
  10. Loiko, P.; Doualan, J.-L.; Guillemot, L.; Moncorgé, R.; Starecki, F.; Benayad, A.; Dunina, E.; Kornienko, A.; Fomicheva, L.; Braud, A.; et al. Emission properties of Tm3+-doped CaF2, KY3F10, LiYF4, LiLuF4 and BaY2F8 crystals at 1.5 μm and 2.3 μm. J. Lumin. 2020, 225, 117279. [Google Scholar] [CrossRef]
  11. Kim, K.J.; Jouini, A.; Yoshikawa, A.; Simura, R.; Boulon, G.; Fukuda, T. Growth and optical properties of Pr, Yb-codoped KY3F10 fluoride single crystals for up-conversion visible luminescence. J. Cryst. Growth 2007, 299, 171–177. [Google Scholar] [CrossRef]
  12. Yoshikawa, A.; Kamada, K.; Martin, N.; Aoki, K.; Sato, H.; Pejchal, J.; Fukuda, T. Growth and luminescent properties of Pr:KY3F10 single crystal. J. Cryst. Growth 2005, 285, 445–449. [Google Scholar] [CrossRef]
  13. Chen, M.; Loiko, P.; Serres, J.M.; Veronesi, S.; Tonelli, M.; Aguiló, M.; Díaz, F.; Choi, S.Y.; Bae, J.E.; Rotermund, F.; et al. Fluorite-type Tm3+:KY3F10: A promising crystal for watt-level lasers at ∼1.9μm. J. Alloy. Compd. 2020, 813, 152176. [Google Scholar] [CrossRef]
  14. Diaf, M.; Braud, A.; Labb, C.; Doualan, J.L.; Girard, S.; Margerie, J.; Moncorg, R.; Thuau, M. Synthesis and spectroscopic studies of Tm3+-doped KY3F10 single crystals. Can. J. Phys. 2000, 77, 693–697. [Google Scholar] [CrossRef]
  15. Guillemot, L.; Loiko, P.; Soulard, R.; Braud, A.; Doualan, J.-L.; Hideur, A.; Camy, P. Close look on cubic Tm:KY3F10 crystal for highly efficient lasing on the 3H43H5 transition. Opt. Express 2020, 28, 3451–3463. [Google Scholar] [CrossRef] [PubMed]
  16. Vasyliev, V.; Villora, E.G.; Nakamura, M.; Sugahara, Y.; Shimamura, K. UV-visible Faraday rotators based on rare-earth fluoride single crystals: LiREF4 (RE = Tb, Dy, Ho, Er and Yb), PrF3 and CeF3. Opt. Express 2012, 20, 14460. [Google Scholar] [CrossRef] [PubMed]
  17. Vojna, D.; Slezák, O.; Lucianetti, A.; Mocek, T. Verdet Constant of Magneto-Active Materials Developed for High-Power Faraday Devices. Appl. Sci. 2019, 9, 3160. [Google Scholar] [CrossRef] [Green Version]
  18. Valiev, U.V.; Karimov, D.N.; Burdick, G.W.; Rakhimov, R.; Pelenovich, V.O.; Fu, D. Growth and magnetooptical properties of anisotropic TbF3 single crystals. J. Appl. Phys. 2017, 121, 243105. [Google Scholar] [CrossRef] [Green Version]
  19. Zelmon, D.E.; Erdman, E.C.; Stevens, K.T.; Foundos, G.; Kim, J.R.; Brady, A. Optical properties of lithium terbium fluoride and implications for performance in high power lasers. Appl. Opt. 2016, 55, 834–837. [Google Scholar] [CrossRef]
  20. Pues, P.; Baur, F.; Schwung, S.; Rytz, D.; Pottgen, R.; Paulsen, C.; Janka, O.; Rendenbach, B.; Johrendt, D.; Jüstel, T. Temperature and time-dependent luminescence of single crystals of KTb3F10. J. Luminescence V 2020, 227, 117523. [Google Scholar] [CrossRef]
  21. Weber, M.J.; Morgret, R.; Leung, S.Y. Magneto-optical properties of KTb3F10 and LiTbF4 crystals. J. Appl. Phys. 1978, 49, 3464–3469. [Google Scholar] [CrossRef]
  22. Potassium Terbium Fluoride Crystal Growth Development for Faraday Rotator DISCS Fabrication, 6 July 1978–6 February 1979; Technical Report; Defensive Systems Div, Sanders Associates, Inc.: Nashua, NH, USA, May 1979. [CrossRef] [Green Version]
  23. Stevens, K.T.; Schlichting, W.; Foundos, G.; Payne, A.; Rogers, E. Promising materials for high power laser isolators: Growth of large single-crystals for faraday rotator and isolator applications. Laser Tech. J. 2016, 13, 18–21. [Google Scholar] [CrossRef]
  24. Schlichting, W.; Stevens, K.; Foundos, G.; Payne, A. Commercializing potassium terbium fluoride, KTF (KTb3F10) faraday crystals for high laser power optical isolator applications. Proc. SPIE 10448 Optifab. 2017, 10448, 104481N. [Google Scholar] [CrossRef]
  25. Karimov, D.N.; Buchinskaya, I.I. Growing KR3F10 (R = Tb–Er) crystals by the vertical directional crystallization method. I. Optimization of the melt composition for growing KTb3F10 and correction of the phase diagram of the KF–TbF3 system. Crystallogr. Rep. 2021, 66. in press. (in Russian) [Google Scholar] [CrossRef]
  26. Chamberlain, S.L.; Corruccini, L.R. Magnetic ordering in rare-earth fluorides with KY3F10 structure and axial moments. Phys. Rev. B 2005, 71, 024434-1-7. [Google Scholar] [CrossRef]
  27. Grzechnik, A.; Nuss, J.; Friese, K.; Gesland, J.-Y.; Jansen, M. Refinement of the crystal structure of potassium triyttrium decafluoride, KY3F10. Z. Kristallogr. NCS 2002, 217, 460. [Google Scholar] [CrossRef]
  28. Friese, K.; Krüger, H.; Kahlenberg, V.; Balić-Zunić, T.; Emerich, H.; Gesland, J.-Y.; Grzechnik, A. Study of the temperature dependence of the structure of KY3F10. J. Phys. Condens. Matter 2006, 18, 2677–2687. [Google Scholar] [CrossRef]
  29. Chai, B.; Lefaucheur, J.; Pham, A.-T.; Loutts, G.B.; Nicholls, J.F. Growth of high-quality single crystals of KYF4 by TSSG method. In Proceedings of the SPIE 1863, Growth, Characterization, and Applications of Laser Host and Nonlinear Crystals II, Los Angeles, CA, USA, 21 July 1993; pp. 131–135. [Google Scholar] [CrossRef]
  30. Zhangyang, K.; Christian, R.; Maogang, H.; Chartrand, P. Thermodynamic evaluation and optimization of the (KF+YF3), (KCl+YCl3) and (YF3+YbF3) binary systems. J. Chem. Thermodyn. 2016, 98, 242–253. [Google Scholar] [CrossRef]
  31. Krivandina, E.A. Preparation of single crystals of multicomponent fluoride materials with the fluorite type structure. Butll. Soc. Cat. Sien. 1991, 12, 393–412. [Google Scholar]
  32. Fedorov, P.P.; Osiko, V.V. Crystal Growth of Fluorides. In Bulk Crystal Growth of Electronic, Optical and Optoelectronic Materials; Capper, P., Ed.; John Wiley & Sons, Ltd.: Hoboken, NJ, USA, 2005; pp. 339–355. [Google Scholar] [CrossRef]
  33. Baldochi, S.L.; Ranieri, I.M. A Short Review on Fluoride Laser Crystals Grown by Czochralski Method at IPEN. Acta Phys. Pol. A 2013, 124, 286–294. [Google Scholar] [CrossRef]
  34. Baldochi, S.L.; Morato, S.P. Fluoride Bulk Crystals Growth. In Encyclopedia of Materials: Science and Technology; Buschow, K.H.J., Cahn, R.W., Flemings, M.C., Ilschner, B., Kramer, E.J., Mahajan, S., Eds.; Elsevier Science: Amsterdam, The Netherlands, 2001; pp. 3200–3205. [Google Scholar]
  35. Fukuda, T.; Rudolph, P.; Uda, S. Fiber Crystal Growth from the Melt; Fukuda, T., Rudolph, P., Uda, S., Eds.; Series: Advances in Materials Research; Springer: Berlin/Heidelberg, Germany, 2004; p. 281. [Google Scholar] [CrossRef]
  36. Shu, J.; Damiano, E.; Sottile, A.; Zhang, Z.; Tonelli, M. Growth by the μ-PD Method and Visible Laser Operation of a Single-Crystal Fiber of Pr3+:KY3F10. Crystals 2017, 7, 200. [Google Scholar] [CrossRef] [Green Version]
  37. Deshko, V.I.; Zhmurova, Z.I.; Kalenichenko, S.G.; Karvatsky, A.Ya.; Krivandina, E.A.; Lebedeva, T.V.; Semenkov, Yu.S.; Sobolev, B.P. Investigation of temperature fields in a two-zone apparatus for growing fluoride crystals by the Stockbarger method. Crystallogr. Rep. 1994, 39, 485–495. [Google Scholar]
  38. Sobolev, B.P.; Stanishevskij, E.J.; Semenkov, J.V.; Kisel’kov, M.P.; Zubova, E.N.; Zhmurova, Z.I.; Krivandina, E.A. Device for Crystal Growing in Furnace with Two-Zone Electric Heating. Patent RU 2038356C1, 27 June 1995. [Google Scholar]
  39. Karimov, D.N.; Dymshits, Yu.M.; Markina, S.A.; Ivanovskaya, N.A.; Krivandina, E.A.; Sobolev, B.P. Crystal growing unit heater. Patent RU 131550U1, 20 November 2013. Bull. No. 23. [Google Scholar]
  40. Sobolev, B.P.; Lomova, V.I.; Karimov, D.N. Equipment for the Growing Crystals. Patent RU 120658U1, 27 November 2012. Bull. No. 27. [Google Scholar]
  41. Karimov, D.N.; Dymshits, Yu.M.; Zubova, E.A.; Samsonova, N.A.; Sorokin, N.I.; Sobolev, B.P. Crucible for the Crystals Growth. Patent RU 135321U1, 10 December 2013. Bull. No. 34. [Google Scholar]
  42. Blistanov, A.A.; Chernov, S.P.; Karimov, D.N.; Ouvarova, T.V. Peculiarities of the growth of disordered Na,R-fluorite (R = Y, Ce–Lu) single crystals. J. Cryst. Growth 2002, 237–239, 899–903. [Google Scholar] [CrossRef]
  43. Karimov, D.N.; Sobolev, B.P.; Ivanov, I.A.; Kanorsky, S.I.; Masalov, A.V. Growth and magneto-optical properties of Na0.37Tb0.63F2.26 cubic single crystal. Crystallogr. Rep. 2014, 59, 718–723. [Google Scholar] [CrossRef]
  44. Sorokin, N.I.; Karimov, D.N.; Volchkov, I.S.; Grigor’ev, Y.V.; Sobolev, B.P. Fluorine-ionic conductivity of superionic conductor crystals Na0.37Tb0.63F2.26. Crystallogr. Rep. 2019, 64, 626–630. [Google Scholar] [CrossRef]
  45. Rigaku Oxford Diffraction CrysAlis PRO Software System; Version 1.171.41.95a; Rigaku Corporation: Wroclaw, Poland, 2021.
  46. Sheldrick, G.M. SHELXTIntegrated space-group and crystal-structure determination. Acta Crystallogr. Sect. A Found. Crystallogr. 2015, 71, 3–8. [Google Scholar] [CrossRef] [Green Version]
  47. Dolomanov, O.V.; Bourhis, L.J.; Gildea, R.J.; Howard, J.A.K.; Puschmann, H. OLEX2: A complete structure solution, refinement and analysis program. J. Appl. Crystallogr. 2009, 42, 339–341. [Google Scholar] [CrossRef]
  48. Sheldrick, G.M. Crystal structure refinement with SHELXL. Acta Crystallogr. Sect. C Struct. Chem. 2015, 71, 3–8. [Google Scholar] [CrossRef] [PubMed]
  49. Popov, P.A.; Sidorov, A.A.; Kul’chenkov, E.A.; Аnishchenko, A.M.; Аvetisov, I.S.; Sorokin, N.I.; Fedorov, P.P. Thermal conductivity and expansion of PbF2 single crystal. Ionics 2017, 23, 233–239. [Google Scholar] [CrossRef]
  50. Opalovskii, A.A.; Fedotova, T.D. Metal Hydrogen Fluorides. Russ. Chem. Rev. 1970, 39, 1003–1016. [Google Scholar] [CrossRef]
  51. Mikou, A.; Laval, J.P.; Frit, B. Etude de l’ordre oxygene-fluor dans l’oxyfluorure PbZr3F6O4, isotype de KY3F10. Rev. Chim. Miner. 1985, 22, 115–124. [Google Scholar]
  52. Podberezskaya, N.V.; Potapova, O.G.; Borisov, S.V.; Gatilov, Y.V. Crystal structure of KTb3F10 cubic packing of the [Tb6F32]14- polyanions. J. Struct. Chem. 1976, 17, 815–817. [Google Scholar] [CrossRef]
  53. Ichikawa, R.U.; Linhares, H.M.S.M.D.; Peral, I.; Baldochi, S.L.; Ranieri, I.M.; Turrillas, X.; Martinez, L.G. Insights into the Local Structure of Tb-Doped KY3F10 Nanoparticles from Synchrotron X-ray Diffraction. ACS Omega 2017, 2, 5128–5136. [Google Scholar] [CrossRef] [PubMed] [Green Version]
  54. Leblanc, M.; Maisonneuve, V.; Tressaud, A. Crystal chemistry and selected physical properties of inorganic fluorides and oxide-fluorides. Chem. Rev. 2015, 115, 1191–1254. [Google Scholar] [CrossRef]
  55. Bevan, D.J.M.; Greis, O.; Strähle, J. A new structural principle in anion-excess fluorite-related superlattices. Acta Crystallogr. Sect. A 1980, 36, 889–890. [Google Scholar] [CrossRef]
  56. Golubev, A.M.; Garashina, L.S.; Zakalyukin, R.M.; Sobolev, B.P.; Herrero, P. Modeling of the structure of fluorite-type solid solutions M1–x(Y, Ln)xF2+x from matrix and rare-earth superclusters based on the KY3F10 structure type. Russ. J. Inorg. Chem. 2004, 49, 225–230. [Google Scholar]
  57. Ranieri, I.M.; Baldochi, S.L.; Santo, A.M.E.; Gomes, L.; Courrol, L.C.; Tarelho, L.V.G.; de Rossi, W.; Berretta, J.R.; Costa, F.E.; Nogueira, G.E.C.; et al. Growth of LiYF4 crystals doped with holmium, erbium and thulium. J. Cryst. Growth 1996, 166, 423–428. [Google Scholar] [CrossRef]
  58. Devyatkova, K.M.; Ivanova, O.N.; Seiranyan, K.B.; Tamazyan, S.A.; Chernov, S.P. Vacuum ultraviolet properties of a new fluoride matrix. Sov. Phys. Dokl. 1990, 35, 40–41. [Google Scholar]
  59. Nawata, T.; Inui, Y.; Masada, I.; Nishijima, E.; Satoh, H.; Fukuda, T. High index fluoride materials for 193 nm immersion lithography. In Proceedings of the SPIE 6154 Optical Microlithography XIX, San Jose, CA, USA, 15 March 2006. 61541A. [Google Scholar] [CrossRef]
  60. Popov, P.A.; Fedorov, P.P.; Semashko, V.V.; Korableva, S.L.; Marisov, M.A.; Gordeev, E.Yu; Reiterov, V.M.; Osiko, V.V. Thermal conductivity of crystals formed by fluorite-like phases in MF–RF3 systems (M = Li, Na, and K, R = Rare Earth). Dokl. Phys. 2009, 54, 221–224. [Google Scholar] [CrossRef]
  61. Mironov, E.A.; Palashov, O.V.; Voitovich, A.V.; Karimov, D.N.; Ivanov, I.A. Investigation of thermo-optical characteristics of magneto-active crystal Na0.37Tb0.63F2.26. Opt. Lett. 2015, 40, 4919–4922. [Google Scholar] [CrossRef] [PubMed]
  62. Popov, P.A.; Ivanov, I.A.; Karimov, D.N. Investigation of the thermal conductivity terbium gallium and terbium scandium aluminum garnet crystals. Crystallogr. Rep. 2018, 63, 451–455. [Google Scholar] [CrossRef]
  63. Karimov, D.N.; Buchinskaya, I.I.; Sorokin, N.I.; Glushkova, T.M.; Chernov, S.P.; Popov, P.A. Growth and some physical properties of congruently melting fluorite solid solutions crystals in the CaF2–SrF2RF3 (R = La, Ce) systems. Crystallogr. Rep. 2019, 64, 834–840. [Google Scholar] [CrossRef]
  64. Karimov, D.N.; Buchinskaya, I.I.; Sorokin, N.I.; Sobolev, B.P.; Popov, P.A. Crystal growth and thermal conductivity of the congruently melting solid solution Cd0.77Sr0.23F2. Inorg. Mater. 2019, 55, 495–499. [Google Scholar] [CrossRef]
  65. Moiseev, N.V.; Popov, P.A.; Fedorov, P.P.; Garibin, E.A.; Reiterov, V.M. Thermodynamic properties of Ca1−xErxF2+x and Ca1−xYbxF2+x heterovalent solid solutions. Inorg. Mater. 2013, 49, 325–328. [Google Scholar] [CrossRef]
  66. Sorokin, N.I.; Ivanov-Shits, A.K.; Vistin, L.L.; Sobolev, B.P. Anion conductivity of Na0.5–xR0.5+xF2+x (R = Dy–Lu, Y; x = 0.1) single crystals with the fluorite structure. Sov. Phys. Crystallogr. 1992, 37, 217–220. [Google Scholar]
  67. Jalali, A.A.; Rogers, E.; Stevens, K. Characterization and extinction measurement of potassium terbium fluoride single crystal for high laser power applications. Opt. Lett. 2017, 42, 899–902. [Google Scholar] [CrossRef] [PubMed]
  68. Sobolev, B.P.; Sorokin, N.I.; Bolotina, N.B. Nonstoichiometric single crystals M1−xRxF2+x and R1-yMyF3-y (MCa, Sr, Ba; R—rare earth elements) as fluorine-conducting solid electrolytes. In Progress in Fluorine Science. Photonic & Electronic Properties of Fluoride Materials; Tressaud, A., Poeppelmeier, K., Eds.; Elsevier: Amsterdam, The Netherlands, 2016; Volume 1, pp. 465–491, Chapter 21. [Google Scholar] [CrossRef]
  69. Pontonnier, L.; Patrat, G.; Aleonard, S.; Capponi, J.J.; Brunel, M.; de Bergevin, F. An approach to the local arrangement of the fluorine atoms in the anionic conductors with the fluorite structure Na0.5-xY0.5+xF2+2x. Solid State Ionics 1983, 9–10, 549–554. [Google Scholar] [CrossRef]
  70. Zhurova, E.A.; Maximov, B.A.; Sobolev, B.P.; Simonov, V.I.; Hull, S.; Wilson, C.C. Defect structure of Na0.39Y0.61F2.22 crystals. Crystallogr. Rep. 1997, 42, 238–242. [Google Scholar]
  71. Otroshchenko, L.P.; Fykin, L.E.; Bystrova, A.A.; Sobolev, B.P. Defect structure of Na0.5-xR0.5+xF2+2x (R = Ho, Yb) solid solutions (fluorite type). Crystallogr. Rep. 2000, 45, 926–929. [Google Scholar] [CrossRef]
  72. Maximov, B.A.; Solans, J.; Dudka, A.P.; Genkina, E.A.; Bardia-Font, M.; Buchinskaya, I.I.; Loshmanov, A.A.; Golubev, A.M.; Simonov, V.I.; Font-Altaba, M.; et al. Crystal structure of fluorite-based Ba4R3F17 (R = Y, Yb) phases: The ordering of cations and features of anion arrangement. Crystallogr. Rep. 1996, 41, 50–57. [Google Scholar]
  73. Sulyanova, E.A.; Karimov, D.N.; Sobolev, B.P. Nanostructured crystals of fluorite phases Sr1−xRxF2+x (R are rare-earth elements) and their ordering. 15. Concentration dependence of the defect structure of as grown nonstoichiometric phases Sr1−xRxF2+x (R = Sm, Gd). Crystallogr. Rep. 2019, 64, 873–878. [Google Scholar] [CrossRef]
  74. Sulyanova, E.A.; Karimov, D.N.; Sobolev, B.P. Nanostructured crystals of fluorite phases Sr1−xRxF2+x (R are rare-earth elements) and their ordering. 16: Defect structure of the nonstoichiometric phases Sr1−xRxF2+x (R = Pr, Tb–Yb) as grown. Crystallogr. Rep. 2020, 65, 560–565. [Google Scholar] [CrossRef]
  75. Pontonnier, L.; Aleonard, S.; Roux, M.T.; Hammou, A. Propertes electriques des solutions solides a structure fluorine excedentaire en anions Na0.5-xY0.5+xF2+2x. J. Solid State Chem. 1987, 69, 10–18. [Google Scholar] [CrossRef]
Figure 1. The external view of the two-section growth facility (a); a simplified design of the furnace heating unit: 1—water-cooled chamber shell; 2—independent blocks of the radiation thermal screens (graphite/ carbon felt); 3—upper and lower resistance heaters; 4—graphite crucible; 5—graphite (molybdenum) diaphragm; 6—pulling rod with crucible supporting holder and inner W/Re thermocouple (b) and axial temperature distribution along the growth chamber length at the different electric power ratios of the upper (W1) and lower (W2) resistance heaters (c).
Crystals 11 00285 g001
Figure 2. Phase diagrams of KF–YF3 [29] (a) and KF–TbF3 [25] (b) systems.
Crystals 11 00285 g002
Figure 3. Appearance of as-grown KY3F10 (KYF) crystals with traces of oxygen, obtained using a commercial reagent KF (a); transparent KYF (b) and KTb3F10 (KTF) (c) crystals grown using potassium hydrofluoride as an initial reagent.
Crystals 11 00285 g003
Figure 4. XRD patterns of the KYF and KTF crystals. The positions of Bragg reflection peaks for KTF (space group F m 3 ¯ m ) are indicated.
Crystals 11 00285 g004
Figure 5. SEM image of opaque KYF crystal part (a) and corresponding EDX elemental mapping (b) of area marked in (a): Y(L)—green, K(K)—blue, F(K)—red and overlapped color map (K + Y); XRD patterns of KYF opaque crystal part, illustrating the presence of two phases simultaneously—KY3F10 and YF3 (c). The positions of Bragg reflection peaks for YF3 phase (space group Pnma with lattice parameters a = 6.3667(1), b = 6.8583(1), c = 4.3930(1) Å) are indicated.
Crystals 11 00285 g005
Figure 6. Geometry of the polyanionic cluster [R6F32] (left) and crystal structure of KR3F10 (R = Tb3+, Y3+) as a three-dimensional assembly of [R6F32] clusters (right).
Crystals 11 00285 g006
Figure 7. Geometry of the polyanionic cluster [R6F36] (left), the crystal structure of KR3F10 (R = Tb3+, Y3+) as a three-dimensional assembly of [R6F36] clusters (center), and KF16-polyhedron (right).
Crystals 11 00285 g007
Figure 8. Absorption spectra of the transparent and opalescent samples of KY3F10 (a) and KTb3F10 single crystals (b). Insert: enlarged part of spectrum for KYF crystal in infrared region.
Crystals 11 00285 g008
Figure 9. Temperature dependence of the thermal conductivity k(T) of KTb3F10 crystal (a) and comparative data on the k(T) for KF- and NaF-based crystals (b). The vertical frames correspond to the reproducibility limits of experimental results within ±3% for the possibility of the tracking temperature trend.
Crystals 11 00285 g009
Figure 10. Temperature dependences of ionic conductivity for the samples from different KY3F10 crystal fragments (a); comparative ionic conductivity data for KF- and NaF-based single crystals (b).
Crystals 11 00285 g010
Table 1. Crystal data for KTb3F10 and KY3F10 structures.
Chemical FormulaKTb3F10KY3F10
Crystal system, space groupCubic, F m 3 ¯ m
a (Å)11.67246 (4)11.5384 (1)
V3)1590.33 (2)1536.16 (4)
Z8
Crystal size (mm)0.1 × 0.1 × 0.070.21 × 0.2 × 0.07
µ (mm−1 )27.04612.575
Radiation typeMo Ka, λ = 0.71073 ÅAg Ka, λ = 0.56087 Å
Theta range for data collection (°)3.0–37.72.4–30.7
Limiting indices−19 ≤ h ≤ 19
−19 ≤ k ≤ 19
−19 ≤ l ≤ 20
−20 ≤ h ≤ 20
−20 ≤ k ≤ 20
−19 ≤ l ≤ 20
Number of measured, independent and
observed [I > 2 σ(I)] reflections
31006, 264, 26027047, 294, 294
Data/restrains/parameters264/0/13294/0/13
Rint0.0270.067
R[F2 > σ2(F2 )], wR(F2 ), S0.008, 0.028, 1.010.0137, 0.033, 1.28
Largest diff. peak and hole (e/Å3)0.53 and −1.100.53 and −0.92
Absorption correctionNumerical absorption correction based on gaussian integration over a multifaceted crystal model CrysAlis PRO 1.171.41.95a
Tmin, Tmax0.196, 0.3490.138, 0.652
Extinction correction: SHELXL2018/3Fc* = kFc[1 + 0.001 × Fc2l3/sin(2q)]−1/4
Extinction coefficient0.000255(18)0.0128(4)
Computer programs: CrysAlis PRO 1.171.41.95a [45], SHELXT 2018/2 [46], Olex2 1.3 [47], SHELXL 2018/3 [48].
Table 2. Physical properties of KR3F10 and Na0.5–xR0.5+xF2+2x (R = Tb, Y) crystals.
ParameterKTb3F10KY3F10Na0.37Tb0.63F2.26Na0.4Y0.6F2.2
A, (SK)/cm1.2 × 1074.0 × 1083.6 × 104 [44]3.1 × 10⁴ [66]
Hσ, eV1.16
(550–820 K)
1.57
(630–825 K)
0.74
(478–700 K)
0.80
(380–730 K)
σdc(500 K), S/cm4.9 × 10−81.2 × 10−102.6 × 10−64.8 × 10−6
k(300 K), W/(mK)1.7
1.67 [67]
3.5 [60]1.0 [61]1.4
Publisher’s Note: MDPI stays neutral with regard to jurisdictional claims in published maps and institutional affiliations.

