
Correlation of Electrical Properties and Acoustic Loss in Single Crystalline Lithium Niobate-Tantalate Solid Solutions at Elevated Temperatures


 , , and
Abstract
:1. Introduction
- (1)
- Intrinsic phonon-phonon interactions,
- (2)
- Anelastic point defect relaxations,
- (3)
- Piezoelectric/carrier relaxation (conductivity-related losses),
- (4)
- Non-material contribution (cables, mounting, etc.).
2. Materials and Methods
2.1. Crystals
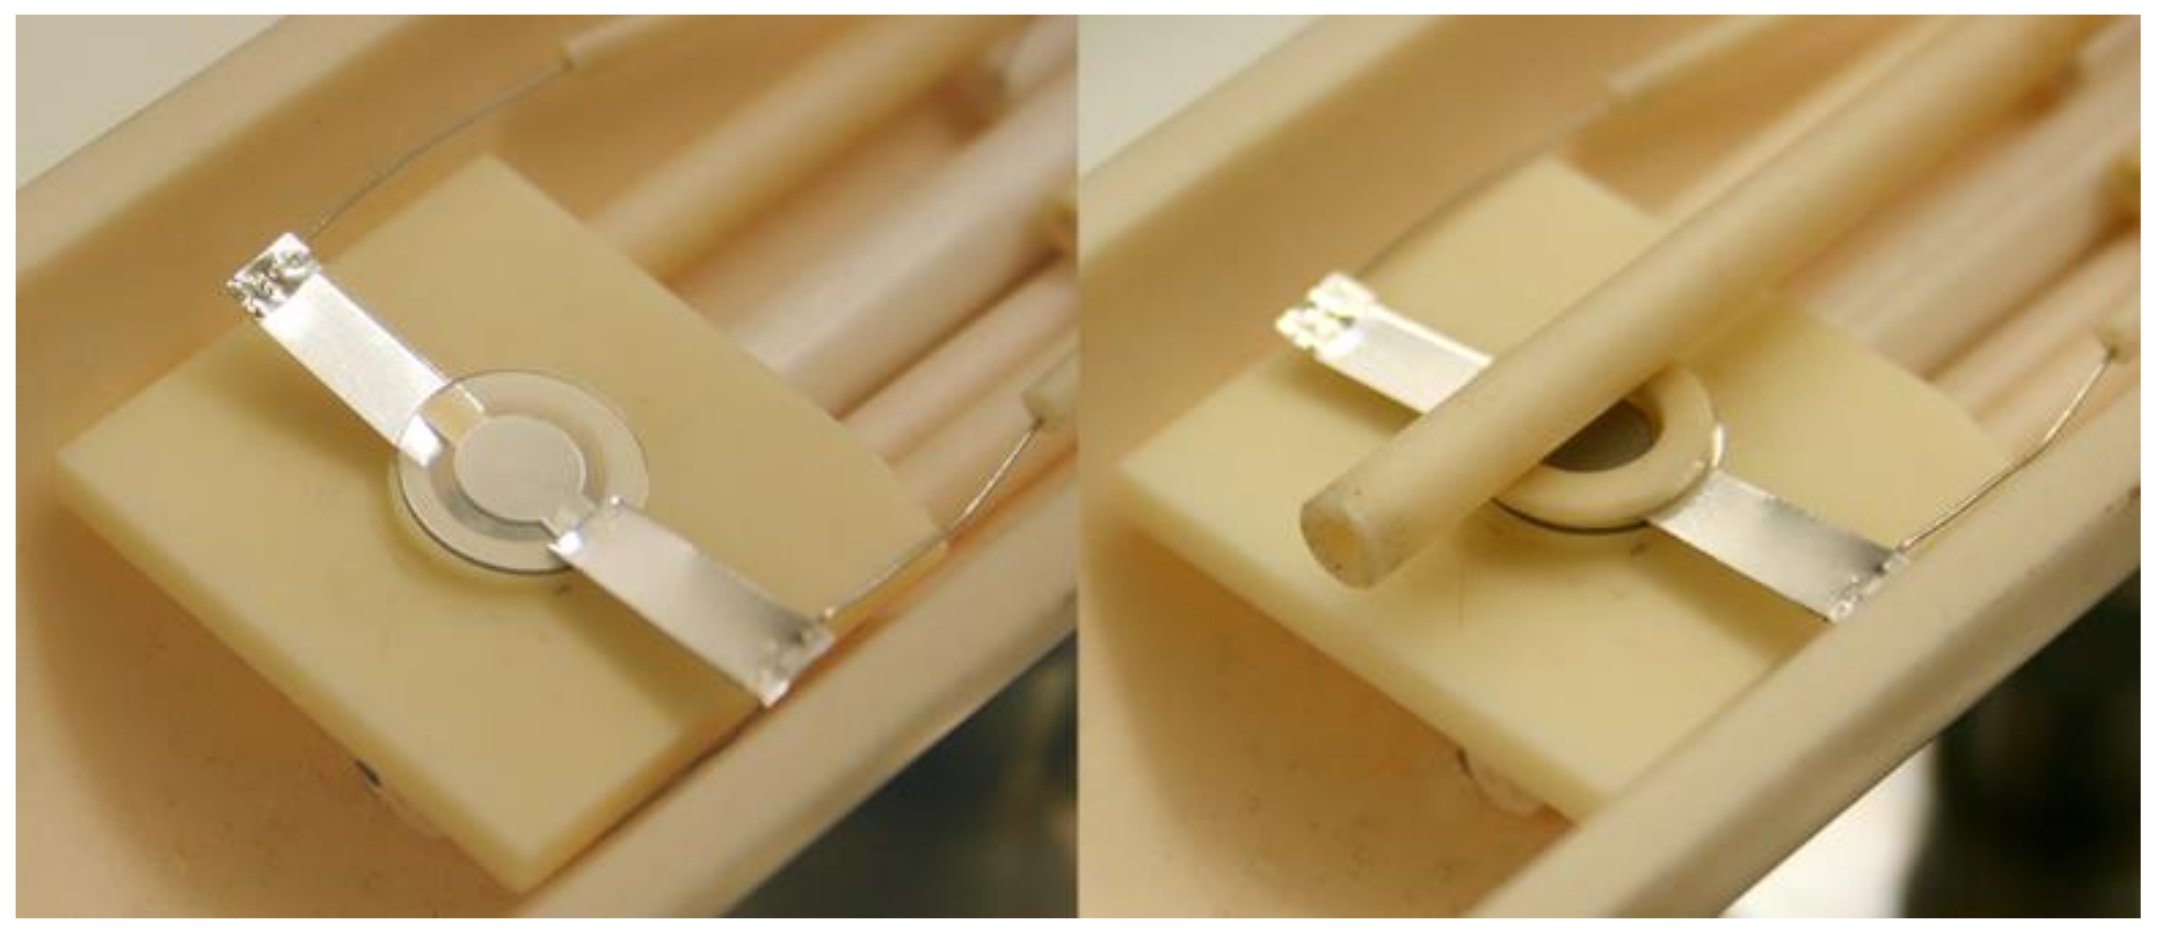
2.2. Specimens
2.3. Measurements and Analysis
2.3.1. Electrical Conductivity
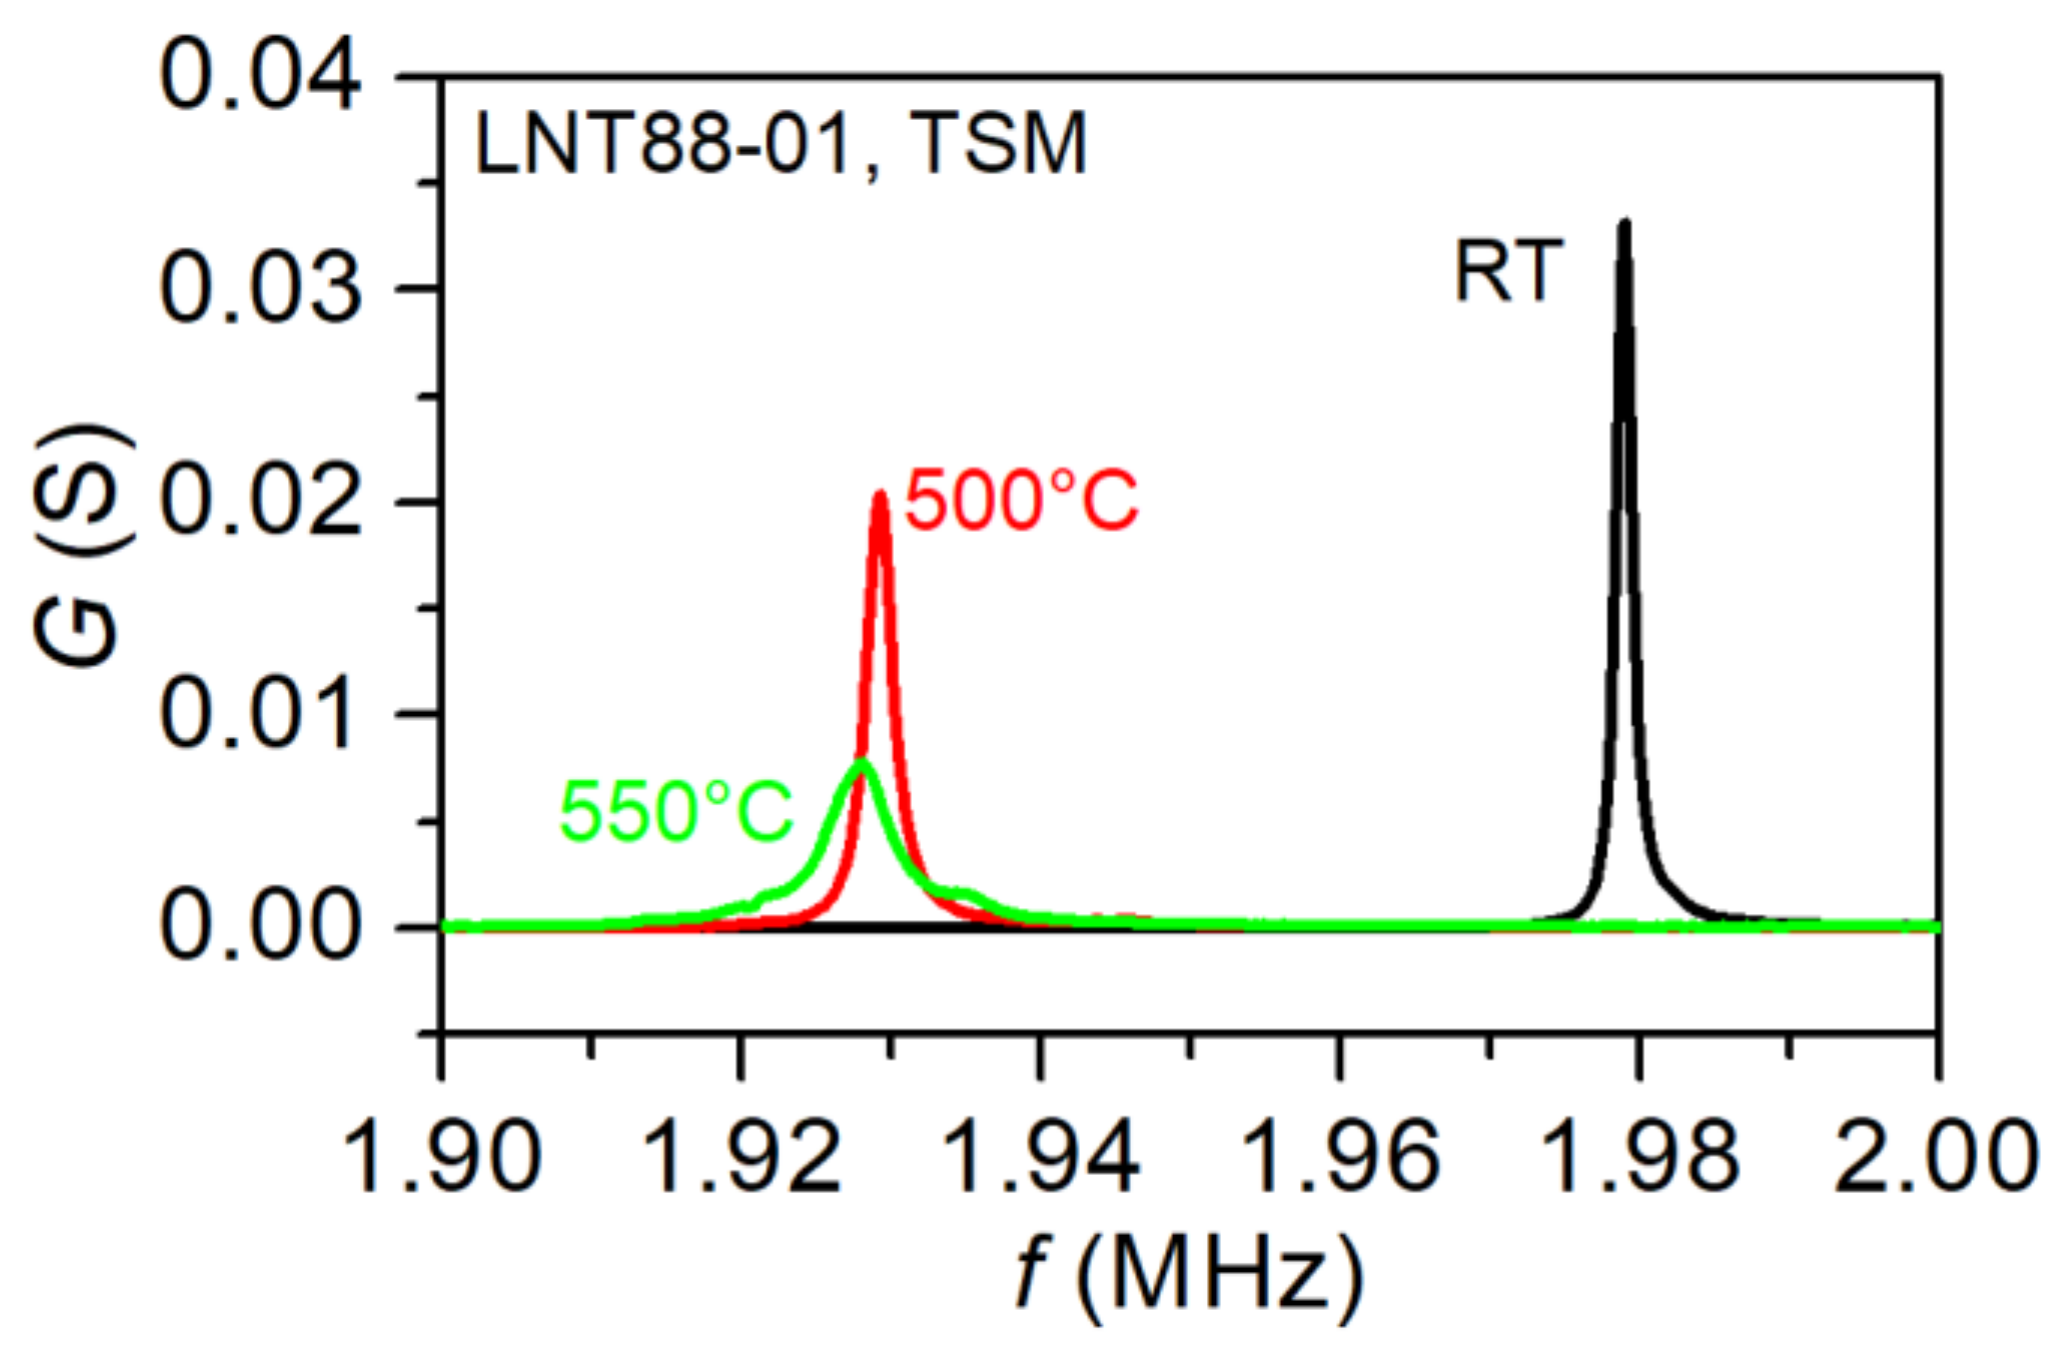
2.3.2. Acoustic Loss
3. Results
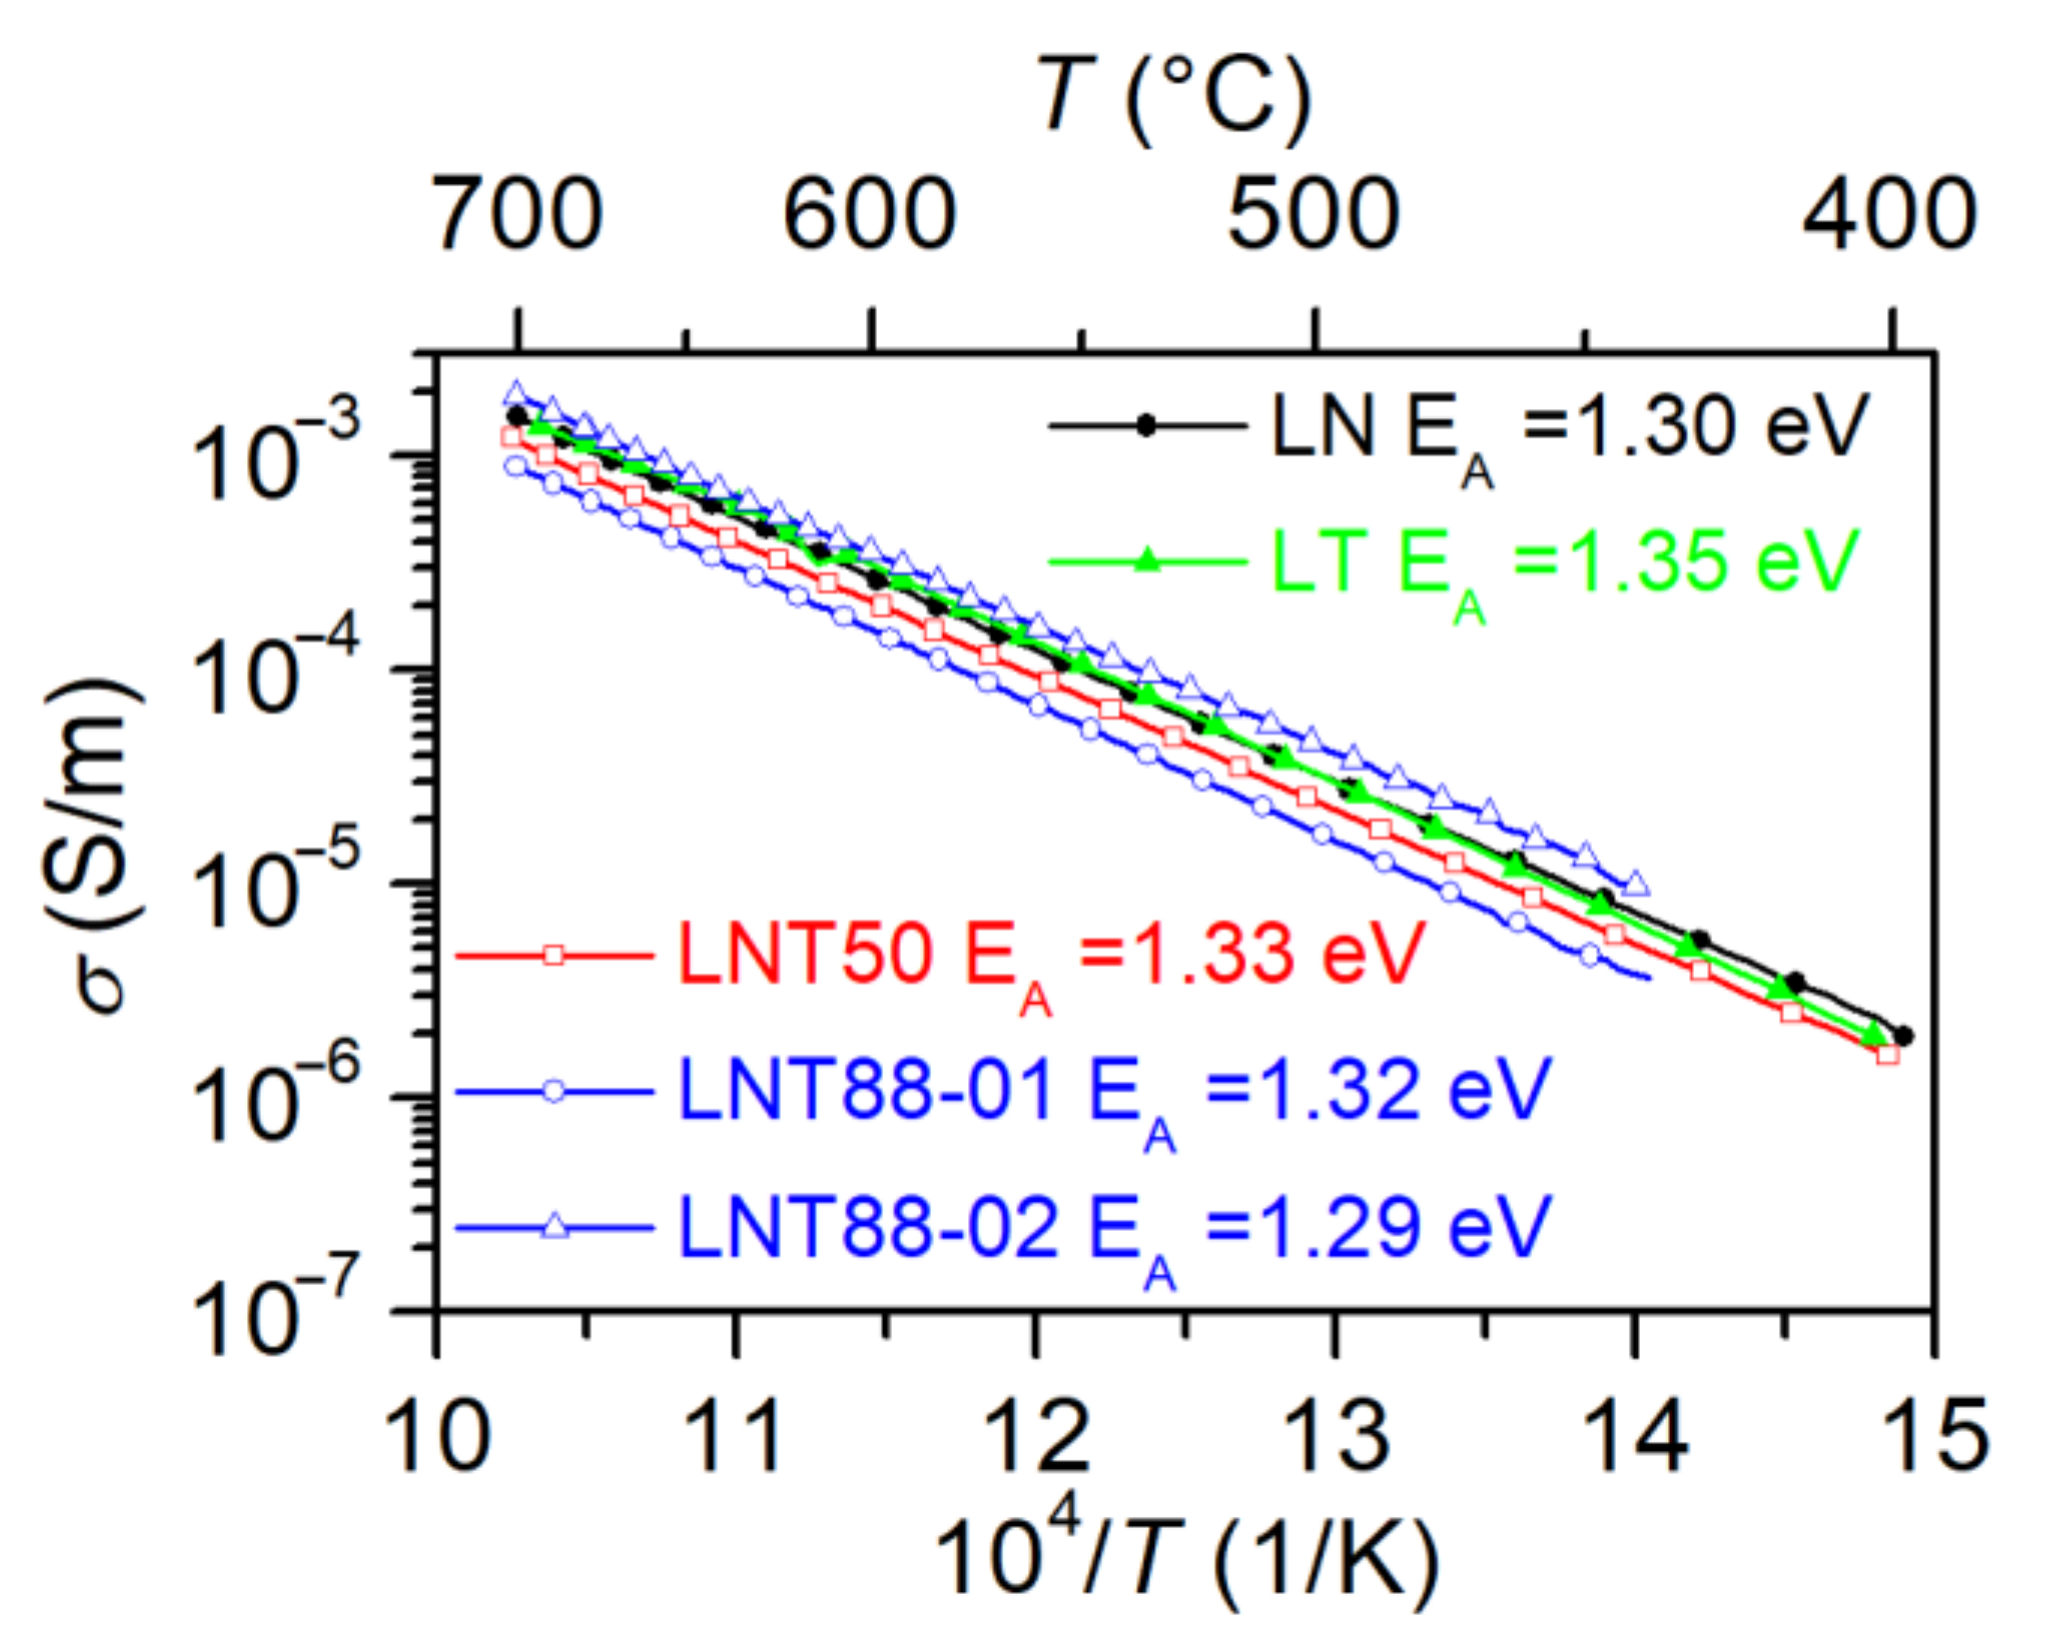
3.1. Electrical Conductivity
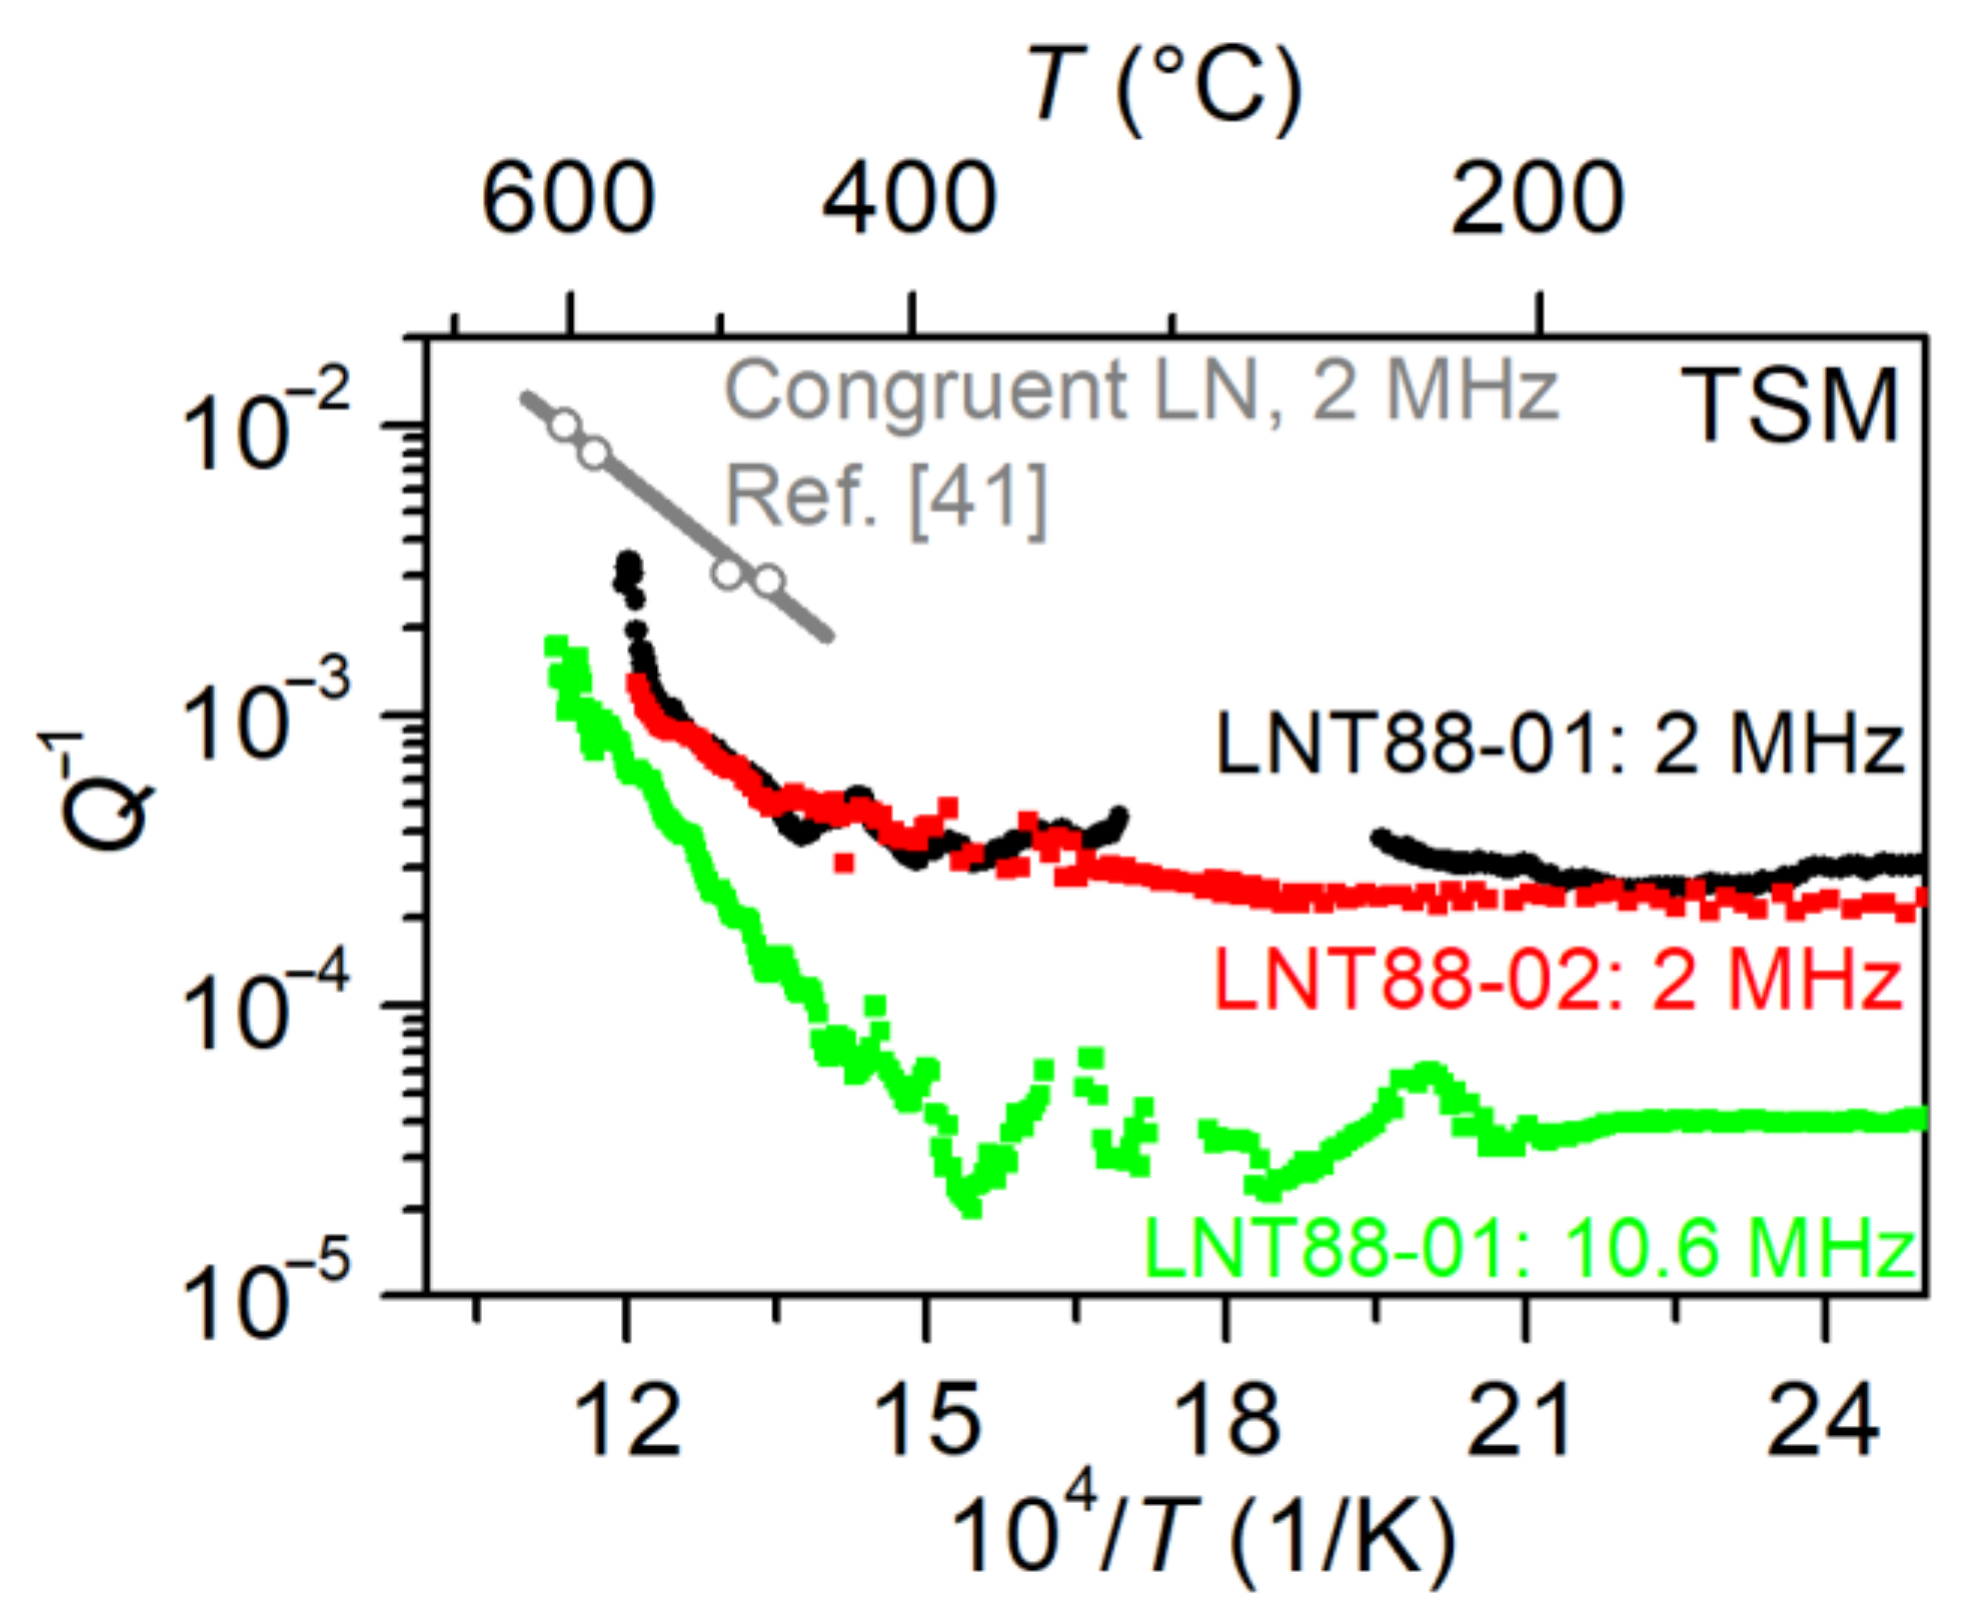
3.2. Acoustic Loss
4. Conclusions
Author Contributions
Funding
Institutional Review Board Statement
Informed Consent Statement
Data Availability Statement
Acknowledgments
Conflicts of Interest
References
- Tuloup, C.; Harizi, W.; Aboura, Z.; Meyer, Y.; Khellil, K.; Lachat, R. On the use of in-situ piezoelectric sensors for the manufacturing and structural health monitoring of polymer-matrix composites: A literature review. Compos. Struct. 2019, 215, 127–149. [Google Scholar] [CrossRef]
- Fritze, H. High-temperature bulk acoustic wave sensors. Meas. Sci. Technol. 2011, 22, 12002. [Google Scholar] [CrossRef]
- Stevenson, T.; Martin, D.G.; Cowin, P.I.; Blumfield, A.; Bell, A.J.; Comyn, T.P.; Weaver, P.M. Piezoelectric materials for high temperature transducers and actuators. J. Mater. Sci. Mater. Electron. 2015, 26, 9256–9267. [Google Scholar] [CrossRef] [Green Version]
- Khesro, A.; Wang, D.; Hussain, F.; Sinclair, D.C.; Feteira, A.; Reaney, I.M. Temperature stable and fatigue resistant lead-free ceramics for actuators. Appl. Phys. Lett. 2016, 109, 142907. [Google Scholar] [CrossRef] [Green Version]
- Zhang, S.; Xia, R.; Lebrun, L.; Anderson, D.; Shrout, T.R. Piezoelectric materials for high power, high temperature applications. Mater. Lett. 2005, 59, 3471–3475. [Google Scholar] [CrossRef]
- Ohsato, H.; Iwataki, T.; Morikoshi, H. Crystal structure and piezoelectric properties of four component langasite A3BGa3Si2O14 (A = Ca or Sr, B = Ta or Nb). Trans. Electr. Electron. Mater. 2012, 13, 171–176. [Google Scholar] [CrossRef] [Green Version]
- Suhak, Y.; Schulz, M.; Sotnikov, A.; Schmidt, H.; Ganschow, S.; Sakharov, S.; Fritze, H. Dielectric, piezoelectric and elastic constants of Ca3TaGa3Si2O14 single crystals at elevated temperatures. Integr. Ferroelectr. 2018, 537, 255–263. [Google Scholar] [CrossRef]
- Volk, T.; Wöhlecke, M. Lithium Niobate: Defects, Photorefraction and Ferroelectric Switching; Springer: Berlin/Heidelberg, Germany, 2008. [Google Scholar]
- Sugak, D.; Zhydachevskii, Y.; Suhak, Y.; Buryy, O.; Ubizskii, S.; Solskii, I.; Schrader, M.; Becker, K.D. In-situ investigation of optical absorption changes in LiNbO3 during reducing/oxidizing high temperature treatments. J. Phys. Cond. Matter 2007, 19, 086211. [Google Scholar] [CrossRef]
- Solskii, I.M.; Sugak, D.Y.; Vakiv, M.M. Growing large size complex oxide single crystals by Czochralski technique for electronic devices. Acta Physica. Polonica A 2013, 124, 314–320. [Google Scholar] [CrossRef]
- Bordui, P.F.; Notwood, R.G.; Bird, C.D.; Carella, J.T. Stoichiometry issues in single-crystal lithium tantalate. J. Appl. Phys. 1995, 78, 4647–4650. [Google Scholar] [CrossRef]
- Kawamata, A.; Hosaka, H.; Morita, T. Non-hysteresis and perfect linear piezoelectric performance of a multilayered lithium niobate actuator. Sens. Actuators A 2007, 135, 782–786. [Google Scholar] [CrossRef]
- Nakamura, K.; Shimizu, H. Hysteresis-free piezoelectric actuators using LiNbO3 plates with a ferroelectric inversion layer. Ferroelectrics 1989, 93, 211–216. [Google Scholar] [CrossRef]
- Samuelsen, E.J.; Grande, A.P. The ferroelectric phase transition in LiTaO3 studied by neutron scattering. Z. Physik B 1976, 24, 207–210. [Google Scholar] [CrossRef]
- Damjanovic, D. Materials for high-temperature piezoelectric transducers. Curr. Opin. Solid St. M. 1998, 3, 469–473. [Google Scholar] [CrossRef]
- Weidenfelder, A.; Shi, J.; Fielitz, P.; Borchardt, G.; Becker, K.D.; Fritze, H. Electrical and electromechanical properties of stoichiometric lithium niobate at high temperatures. Solid State Ion. 2012, 225, 26–29. [Google Scholar] [CrossRef]
- Schirmer, O.F.; Thiemann, O.; Wöhlecke, M. Defects in LiNbO3—1. Experimental Aspects. J. Phys. Chem. Solids 1991, 52, 185–200. [Google Scholar] [CrossRef]
- Donnerberg, H.; Tomlinson, S.M.; Catlow, C.R.A.; Schirmer, O.F. Computer-simulation studies of intrinsic defects in LiNbO3 crystals. Phys. Rev. B 1989, 40, 11909–11916. [Google Scholar] [CrossRef]
- Abrahams, S.C.; Marsh, P. Defect Structure Dependence on Composition in Lithium Niobate. Acta Crystallogr. B 1986, 42, 61–68. [Google Scholar] [CrossRef]
- Furukawa, Y.; Kitamura, K.; Suzuki, E.; Niwa, K. Stoichiometric LiTaO3 single crystal growth by double crucible Czochralski method using automatic powder supply system. J. Cryst. Growth 1999, 197, 889–895. [Google Scholar] [CrossRef]
- Kitamura, K.; Furukawa, Y.; Niwa, K.; Goplan, V.; Mitchell, T.E. Crystal growth and low coercive field 180° domain switching characteristics of stoichiometric LiTaO3. Appl. Phys. Lett. 1998, 73, 3073–3076. [Google Scholar] [CrossRef]
- Krampf, A.; Imlau, M.; Suhak, Y.; Fritze, H.; Sanna, S. Evaluation of similarities and differences of LiTaO3 and LiNbO3 based on high-T-conductivity, nonlinear optical fs-spectroscopy and ab initio modeling of polaronic structures. New J. Phys. 2021, in press. [Google Scholar] [CrossRef]
- Huanosta, A.; West, A.R. The electrical properties of ferroelectric LiTaO3 and its solid solutions. J. Appl. Phys. 1987, 61, 5386–5391. [Google Scholar] [CrossRef]
- Sinclair, D.C.; West, A.R. Electrical properties of a LiTaO3 single crystal. Phys. Rev. B 1989, 39, 13486–13492. [Google Scholar] [CrossRef]
- Ming, D.; Reau, J.M.; Ravez, J.; Gitae, J.; Hagenmuller, P. Impedance-spectroscopy analysis of a LiTaO3-type single crystal. J. Solid State Chem. 1995, 116, 185–192. [Google Scholar] [CrossRef]
- Palatnikov, M.N.; Sandler, V.A.; Yatsenko, A.V.; Sidorov, N.V.; Evdokimov, S.V.; Makarova, O.V. Anisotropic electrical conductivity and dielectric properties of LiTaO3 crystals in the temperature range 290–900 K. Inorg. Mater. 2015, 51, 685–695. [Google Scholar] [CrossRef]
- Smyth, D.M. Defects and transport in LiNbO3. Ferroelectrics 1983, 50, 93–102. [Google Scholar] [CrossRef]
- Lanfredi, S.; Rodrigues, A.C.M. Impedance spectroscopy study of the electrical conductivity and dielectric constant of polycrystalline LiNbO3. J. Appl. Phys. 1999, 86, 2215–2219. [Google Scholar] [CrossRef]
- Chen, R.H.; Chen, L.; Chia, C. Impedance spectroscopic studies on congruent LiNbO3 single crystal. J. Phys. Condens. Matter 2007, 19, 086225. [Google Scholar] [CrossRef]
- Ruprecht, B.; Rahn, J.; Schmidt, H.; Heitjans, P. Low-Temperature DC Conductivity of LiNbO3 Single Crystals. Z. Phys. Chem. 2012, 226, 431–437. [Google Scholar] [CrossRef] [Green Version]
- El-Bachiri, A.; Bennani, F.; Bousselamti, M. Ionic and polaronic conductivity of lithium niobate. Spectrosc. Lett. 2014, 47, 374–380. [Google Scholar] [CrossRef]
- Efremov, V.V.; Shcherbina, O.B.; Palatnikov, M.N.; Masloboeva, S.M. Comparative investigation of electrophysical characteristics of ceramic and single crystal LiNbO3. J. Phys. Conf. Ser. 2020, 1658, 012010. [Google Scholar] [CrossRef]
- Yamada, T.; Iwasaki, H.; Niizeki, N. Piezoelectric and elastic properties of LiTaO3: Temperature characteristics. Jpn. J. Appl. Phys. 1969, 8, 1127–1132. [Google Scholar] [CrossRef]
- De Castilla, H.; Belanger, P.; Zednik, R.J. High temperature characterization of piezoelectric lithium niobate using electrochemical impedance spectroscopy resonance method. J. Appl. Phys. 2017, 122, 244103. [Google Scholar] [CrossRef] [Green Version]
- Chen, F.; Kong, L.; Song, W.; Jiang, C.; Tian, S.; Yu, F.; Qin, L.; Wang, C.; Zhao, X. The electromechanical features of LiNbO3 crystal for potential high temperature piezoelectric applications. J. Mater. 2019, 5, 73–80. [Google Scholar] [CrossRef]
- Rüsing, M.; Sanna, S.; Neufeld, S.; Berth, G.; Schmidt, W.G.; Zrenner, A.; Yu, H.; Wang, Y.; Zhang, H. Vibrational properties of LiNb1-xTaxO3 mixed crystals. Phys. Rev. B 2016, 93, 184305. [Google Scholar] [CrossRef]
- Riefer, A.; Sanna, S.; Schmidt, W.G. LiNb1-xTaxO3 electronic structure and optical response from first principles. Ferroelectrics 2013, 447, 78. [Google Scholar] [CrossRef]
- Huband, S.; Keeble, D.S.; Zhang, N.; Glazer, A.M.; Bartasyte, A.; Thomas, P.A. Crystallographic and optical study of LiNb1-xTaxO3. Acta Cryst. B 2017, 73, 498. [Google Scholar] [CrossRef] [Green Version]
- Glazer, A.M.; Zhang, N.; Bartasyte, A.; Keeble, D.S.; Huband, S.; Thomas, P.A. Observation of unusual temperature-dependent stripes in LiTaO3 and LiNb1-xTaxO3 crystals with near-zero birefringence. J. Appl. Cryst. 2010, 43, 1305. [Google Scholar] [CrossRef]
- Palatnikov, M.N.; Sandler, V.A.; Sidorov, N.V.; Makarova, O.V.; Manukovskaya, D.V. Conditions of application of LiNbO3 based piezoelectric resonators at high temperatures. Phys. Lett. A 2020, 384, 126289. [Google Scholar] [CrossRef]
- Weidenfelder, A.; Schulz, M.; Fielitz, P.; Shi, J.; Borchardt, G.; Becker, K.D.; Fritze, H. Electronic and ionic transport mechanisms of stoichiometric lithium niobate at high temperatures. MRS Proc. 2013, 1519, 1–7. [Google Scholar] [CrossRef]
- Parks, D.A.; Zhang, S.; Tittmann, B.R. High-Temperature (>500 °C) Ultrasonic transducers: An experimental comparison among three candidate piezoelectric materials. IEEE Trans. Ultrason. 2013, 60, 1010–1015. [Google Scholar] [CrossRef]
- Hauser, R.; Reindl, L.; Biniasch, J. High-temperature stability of LiNbO3-based SAW devices. IEEE Ultrason. Symp. 2003, 1, 192–195. [Google Scholar]
- Garavito, R.; Villafuerte-Castrejón, M.E.; Valenzuela, R.; West, A.R. Phase equilibria in the system Li2O-Nb2O5-Ta2O5. Br. Ceram. Trans. J. 1985, 84, 104–108. [Google Scholar]
- Fernandez-Ruiz, R.; Bermudez, V. Determination of the Ta and Nb ratio in LiNb1-xTaxO3 by total reflection X-ray fluorescence spectrometry. Spectrochim. Acta B 2005, 60, 231. [Google Scholar] [CrossRef]
- Wood, I.G.; Daniel, P.; Brown, R.H.; Glazer, A.M. Optical birefringence study of the ferroelectric phase transition in lithium niobate tantalate mixed crystals: LiNb1−xTaxO3. J. Phys. Cond. Matter 2008, 20, 235237. [Google Scholar] [CrossRef]
- Bartasyte, A.; Glazer, A.M.; Wondre, F.; Prabhakaran, D.; Thomas, P.A.; Huband, S.; Keeble, D.S.; Margueron, S. Growth of LiNb1-xTaxO3 solid solution crystals. Mater. Chem. Phys. 2012, 134, 728. [Google Scholar] [CrossRef]
- Bak, K.Y.; Tan, K.B.; Khaw, C.C.; Zainal, Z.; Tan, P.Y.; Chon, M.P. Structural and electrical properties of Nb-substituted LiTa1-xNbxO3. Sains. Malays. 2014, 43, 1573–1582. [Google Scholar]
- Xue, D.; Betzler, K.; Hesse, H. Dielectric properties of lithium niobate–tantalate crystals. Solid State Commun. 2000, 115, 581–585. [Google Scholar] [CrossRef]
- Johnson, W.L.; Kim, S.A.; Uda, S.; Rivenbark, C.F. Contributions to anelasticity in langasite and langatate. J. Appl. Phys. 2011, 110, 123528. [Google Scholar] [CrossRef] [Green Version]
- Hirschle, C.; Schreuer, J. High-temperature ultrasound attenuation in langasite and langatate. IEEE Trans. Ultrason. Ferroelect. Freq. Control 2018, 65, 1250–1257. [Google Scholar] [CrossRef] [PubMed]
- Suhak, Y.; Schulz, M.; Johnson, W.L.; Sotnikov, A.; Schmidt, H.; Fritze, H. Electromechanical properties and charge transport of Ca3TaGa3Si2O14 (CTGS) single crystals at elevated temperatures. Solid State Ion. 2018, 317, 221–228. [Google Scholar] [CrossRef]
- Mason, W.P. Physical Acoustics, Principles and Methods; Academic Press: New York, NY, USA, 1965; Volume 3B. [Google Scholar]
- Tabrizian, R.; Rais-Zadeh, M.; Ayazi, F. Effect of Phonon Interactions on Limiting the fQ Product of Micromechanical Resonators. IEEE Transducers 2009, 2131–2134. [Google Scholar] [CrossRef]
- Nowick, A.S.; Berry, B.S. Anelastic Relaxation in Crystalline Solid; Academic Press: New York, NY, USA, 1972. [Google Scholar]
- Hutson, A.R.; White, D.L. Elastic wave propagation in piezoelectric semiconductors. J. Appl. Phys. 1962, 33, 40–47. [Google Scholar] [CrossRef]
- Ikeda, T. Fundamentals of Piezoelectricity; Oxford University Press: Oxford, UK, 1990. [Google Scholar]
- Roshchupkin, D.; Emelin, E.; Plotitcyna, O.; Rashid, F.; Irzhak, D.; Karandashev, V.; Orlova, T.; Targonskaya, N.; Sakharov, S.; Mololkin, A.; et al. Single crystals of ferroelectric lithium niobate–tantalate LiNb1–xTaxO3 solid solutions for high-temperature sensor and actuator applications. Acta Cryst. B 2020, 76, 1071–1076. [Google Scholar] [CrossRef]
- Reiche, P.; Hermoneit, B.; Schultze, D. A modified heater system for rf-Czochralski equipments. Cryst. Res. Technol. 1985, 20, 845–849. [Google Scholar] [CrossRef]
- Vechembre, J.B.; Fox, G.R. Sintering of screen-printed platinum thick films for electrode applications. J. Mater. Res. 2001, 16, 922–931. [Google Scholar] [CrossRef] [Green Version]
- Golosov, D.A.; Okojie, J.E.; Zavadski, S.M.; Rudenkov, A.S.; Melnikov, S.N.; Kolos, V.V. Stability of the platinum electrode during high temperature annealing. Thin Solid Films 2018, 661, 53–59. [Google Scholar] [CrossRef]
- Ballato, A. Electronic Activity Dip Measurement. IEEE Trans. Instr. Meas. 1978, 27, 59–65. [Google Scholar] [CrossRef]
- Ballato, A.; Gualtieri, J.G. Advances in high-Q piezoelectric resonator materials and devices. IEEE Trans. Ultrason. Ferroelect. Freq. Control 1994, 41, 834–844. [Google Scholar] [CrossRef] [Green Version]
- Shockley, W.; Curran, D.R.; Koneval, D.J. Trapped energy modes in quartz filter crystals. J. Acoust. Soc. Am. 1967, 41, 981. [Google Scholar] [CrossRef]
- Wang, J.; Shen, L.; Yang, J. Effects of electrodes with continuously varying thickness on energy trapping in thickness-shear mode quartz resonators. Ultrasonics 2008, 48, 150–154. [Google Scholar] [CrossRef] [PubMed]
- Cassiede, M.; Paillol, J.H.; Pauly, J.; Daridon, J.-L. Electrical behaviour of AT-cut quartz crystal resonators as a function of overtone number. Sens. Actuators A 2010, 159, 174–183. [Google Scholar] [CrossRef]
- Ledbetter, H.; Ogi, H.; Nakamura, N. Elastic, anelastic, piezoelectric coefficients of monocrystal lithium niobate. Mech. Mater. 2004, 36, 941–947. [Google Scholar] [CrossRef]
- Vittadello, L.; Bazzan, M.; Messerschmidt, S.; Imlau, M. Small polaron hopping in Fe:LiNbO3 as a function of temperature and composition. Crystals 2019, 8, 294. [Google Scholar] [CrossRef] [Green Version]


| Measurement | LNT88-01 | LNT88-02 | ||||
|---|---|---|---|---|---|---|
| Nb at.% | Ta at.% | Nb/(Nb + Ta) | Nb at.% | Ta at.% | Nb/(Nb + Ta) | |
| 1 | 19.73 | 2.12 | 0.90 | 21.26 | 2.49 | 0.90 |
| 2 | 19.75 | 2.61 | 0.88 | 21.45 | 2.44 | 0.90 |
| 3 | 20.53 | 2.52 | 0.89 | 21.51 | 2.54 | 0.90 |
| 4 | 20.72 | 2.42 | 0.90 | 21.30 | 2.49 | 0.90 |
| 5 | 20.91 | 2.87 | 0.88 | 21.85 | 2.11 | 0.91 |
| 6 | 21.00 | 2.73 | 0.88 | 21.59 | 2.06 | 0.91 |
| 7 | 21.56 | 2.89 | 0.88 | 21.89 | 2.11 | 0.91 |
| 8 | 21.38 | 2.32 | 0.90 | 22.36 | 2.07 | 0.91 |
| 9 | 21.40 | 2.8 | 0.88 | 21.88 | 2.00 | 0.92 |
| 10 | 21.31 | 2.86 | 0.88 | 22.46 | 1.76 | 0.93 |
| Sample | Activation Energy (eV) | Pre-Exponential Factor (SK/m) |
|---|---|---|
| LN | 1.30 ± 0.06 | 7.31 × 10⁶ |
| LNT88-01 | 1.32 ± 0.05 | 6.72 × 10⁶ |
| LNT88-02 | 1.29 ± 0.04 | 6.20 × 10⁶ |
| LNT50 | 1.33 ± 0.07 | 7.07 × 10⁶ |
| LT | 1.35 ± 0.05 | 1.49 × 10⁷ |
Publisher’s Note: MDPI stays neutral with regard to jurisdictional claims in published maps and institutional affiliations. |
© 2021 by the authors. Licensee MDPI, Basel, Switzerland. This article is an open access article distributed under the terms and conditions of the Creative Commons Attribution (CC BY) license (https://creativecommons.org/licenses/by/4.0/).
Share and Cite
Suhak, Y.; Roshchupkin, D.; Redkin, B.; Kabir, A.; Jerliu, B.; Ganschow, S.; Fritze, H. Correlation of Electrical Properties and Acoustic Loss in Single Crystalline Lithium Niobate-Tantalate Solid Solutions at Elevated Temperatures. Crystals 2021, 11, 398. https://0-doi-org.brum.beds.ac.uk/10.3390/cryst11040398
Suhak Y, Roshchupkin D, Redkin B, Kabir A, Jerliu B, Ganschow S, Fritze H. Correlation of Electrical Properties and Acoustic Loss in Single Crystalline Lithium Niobate-Tantalate Solid Solutions at Elevated Temperatures. Crystals. 2021; 11(4):398. https://0-doi-org.brum.beds.ac.uk/10.3390/cryst11040398
Chicago/Turabian StyleSuhak, Yuriy, Dmitry Roshchupkin, Boris Redkin, Ahsanul Kabir, Bujar Jerliu, Steffen Ganschow, and Holger Fritze. 2021. "Correlation of Electrical Properties and Acoustic Loss in Single Crystalline Lithium Niobate-Tantalate Solid Solutions at Elevated Temperatures" Crystals 11, no. 4: 398. https://0-doi-org.brum.beds.ac.uk/10.3390/cryst11040398