Article

High-Pressure Crystal Structure and Unusual Magnetoresistance of a Single-Component Molecular Conductor [Pd(dddt)2] (dddt = 5,6-dihydro-1,4-dithiin-2,3-dithiolate)

1
Condensed Molecular Materials Laboratory RIKEN, 2-1 Hirosawa, Wako-shi, Saitama 351-0198, Japan
2
School of Chemistry, University of Birmingham, Edgbaston, Birmingham B15 2TT, UK
3
Inorganic Chemistry Laboratory, Oxford University, South Parks Road, Oxford OX1 3QR, UK
4
Beamline I19, Diamond Light Source, Harwell Campus, Didcot OX11 0DE, UK
*
Authors to whom correspondence should be addressed.
Submission received: 29 March 2021 / Revised: 3 May 2021 / Accepted: 5 May 2021 / Published: 11 May 2021
(This article belongs to the Special Issue Organic Conductors)

Abstract

:
A single-component molecular crystal [Pd(dddt)2] has been shown to exhibit almost temperature-independent resistivity under high pressure, leading theoretical studies to propose it as a three-dimensional (3D) Dirac electron system. To obtain more experimental information about the high-pressure electronic states, detailed resistivity measurements were performed, which show temperature-independent behavior at 13 GPa and then an upturn in the low temperature region at higher pressures. High-pressure single-crystal structure analysis was also performed for the first time, revealing the presence of pressure-induced structural disorder, which is possibly related to the changes in resistivity in the higher-pressure region. Calculations based on the disordered structure reveal that the Dirac cone state and semiconducting state coexist, indicating that the electronic state at high pressure is not a simple Dirac electron system as previously believed. Finally, the first measurements of magnetoresistance on [Pd(dddt)2] under high pressure are reported, revealing unusual behavior that seems to originate from the Dirac electron state.

1. Introduction

Most single-component molecular crystals are semiconductors or insulators because of large HOMO-LUMO energy band gaps (HOMO = Highest Occupied Molecular Orbital, LUMO = Lowest Unoccupied Molecular Orbital). Compared to other simple organic molecular crystals, metal–dithiolene complexes have small HOMO-LUMO gaps (~0.5 eV) and are, therefore, considered to be important candidates in the search for conducting single-component molecular systems. Through the last two decades of research, it has been revealed that chemical modifications, such as increasing π-conjugation and ligand planarity, can reduce the HOMO-LUMO band gap. This method, however, reduces the solubility of source materials and makes crystal growth very difficult. So far, only three single-component molecular metals, [M(tmdt)2] (M = Ni, Au; tmdt = trimethylenetetrathiafulvalenedithiolate) [1,2] and [Au(Me-thiazdt)2] (Me-thiazdt = N-methyl-1,3-thiazoline-2-thione-4,5-dithiolate) [3], and one single-component Dirac electron candidate [Pt(dmdt)2] (dmdt = dimethyltetrathiafulvalenedithiolate) [4], have been reported under ambient conditions. On the other hand, molecular crystals have soft lattices and so the bandwidths of HOMO and LUMO bands may be easily enlarged by the application of external pressure. Therefore, the application of pressure has been found to be an efficient way to discover new single-component molecular metals and superconductors. Indeed, three pressure-induced single-component molecular metals, [Ni(ptdt)2] (ptdt = propylenedithiotetrathiafulvalenedithiolate) [5], [Cu(dmdt)2] [6] and [Ni(dmit)2] (dmit = 1,3-dithiole-2-thione-4,5-dithiolate) [7], have been found at pressures of 19.4 GPa, 4.7 GPa, and 15.9 GPa, respectively. Furthermore, we also discovered the first pressure-induced single-component molecular superconductor, [Ni(hfdt)2] (hfdt = bis(trifluoromethyl)tetrathiafulvalenedithiolate), at 8 GPa (Tc = 5.5 K) [8]. Lorcy and coworkers reported that single-component molecular crystals [Au(Et-thiazdt)2] (Et-thiazdt = N-ethyl-1,3-thiazoline-2-thione-4,5-dithiolate) [9] and [Au(Et-thiazds)2] [10] exhibit metallic conduction at the even lower pressures of 1.3 GPa and 0.6 GPa, respectively.
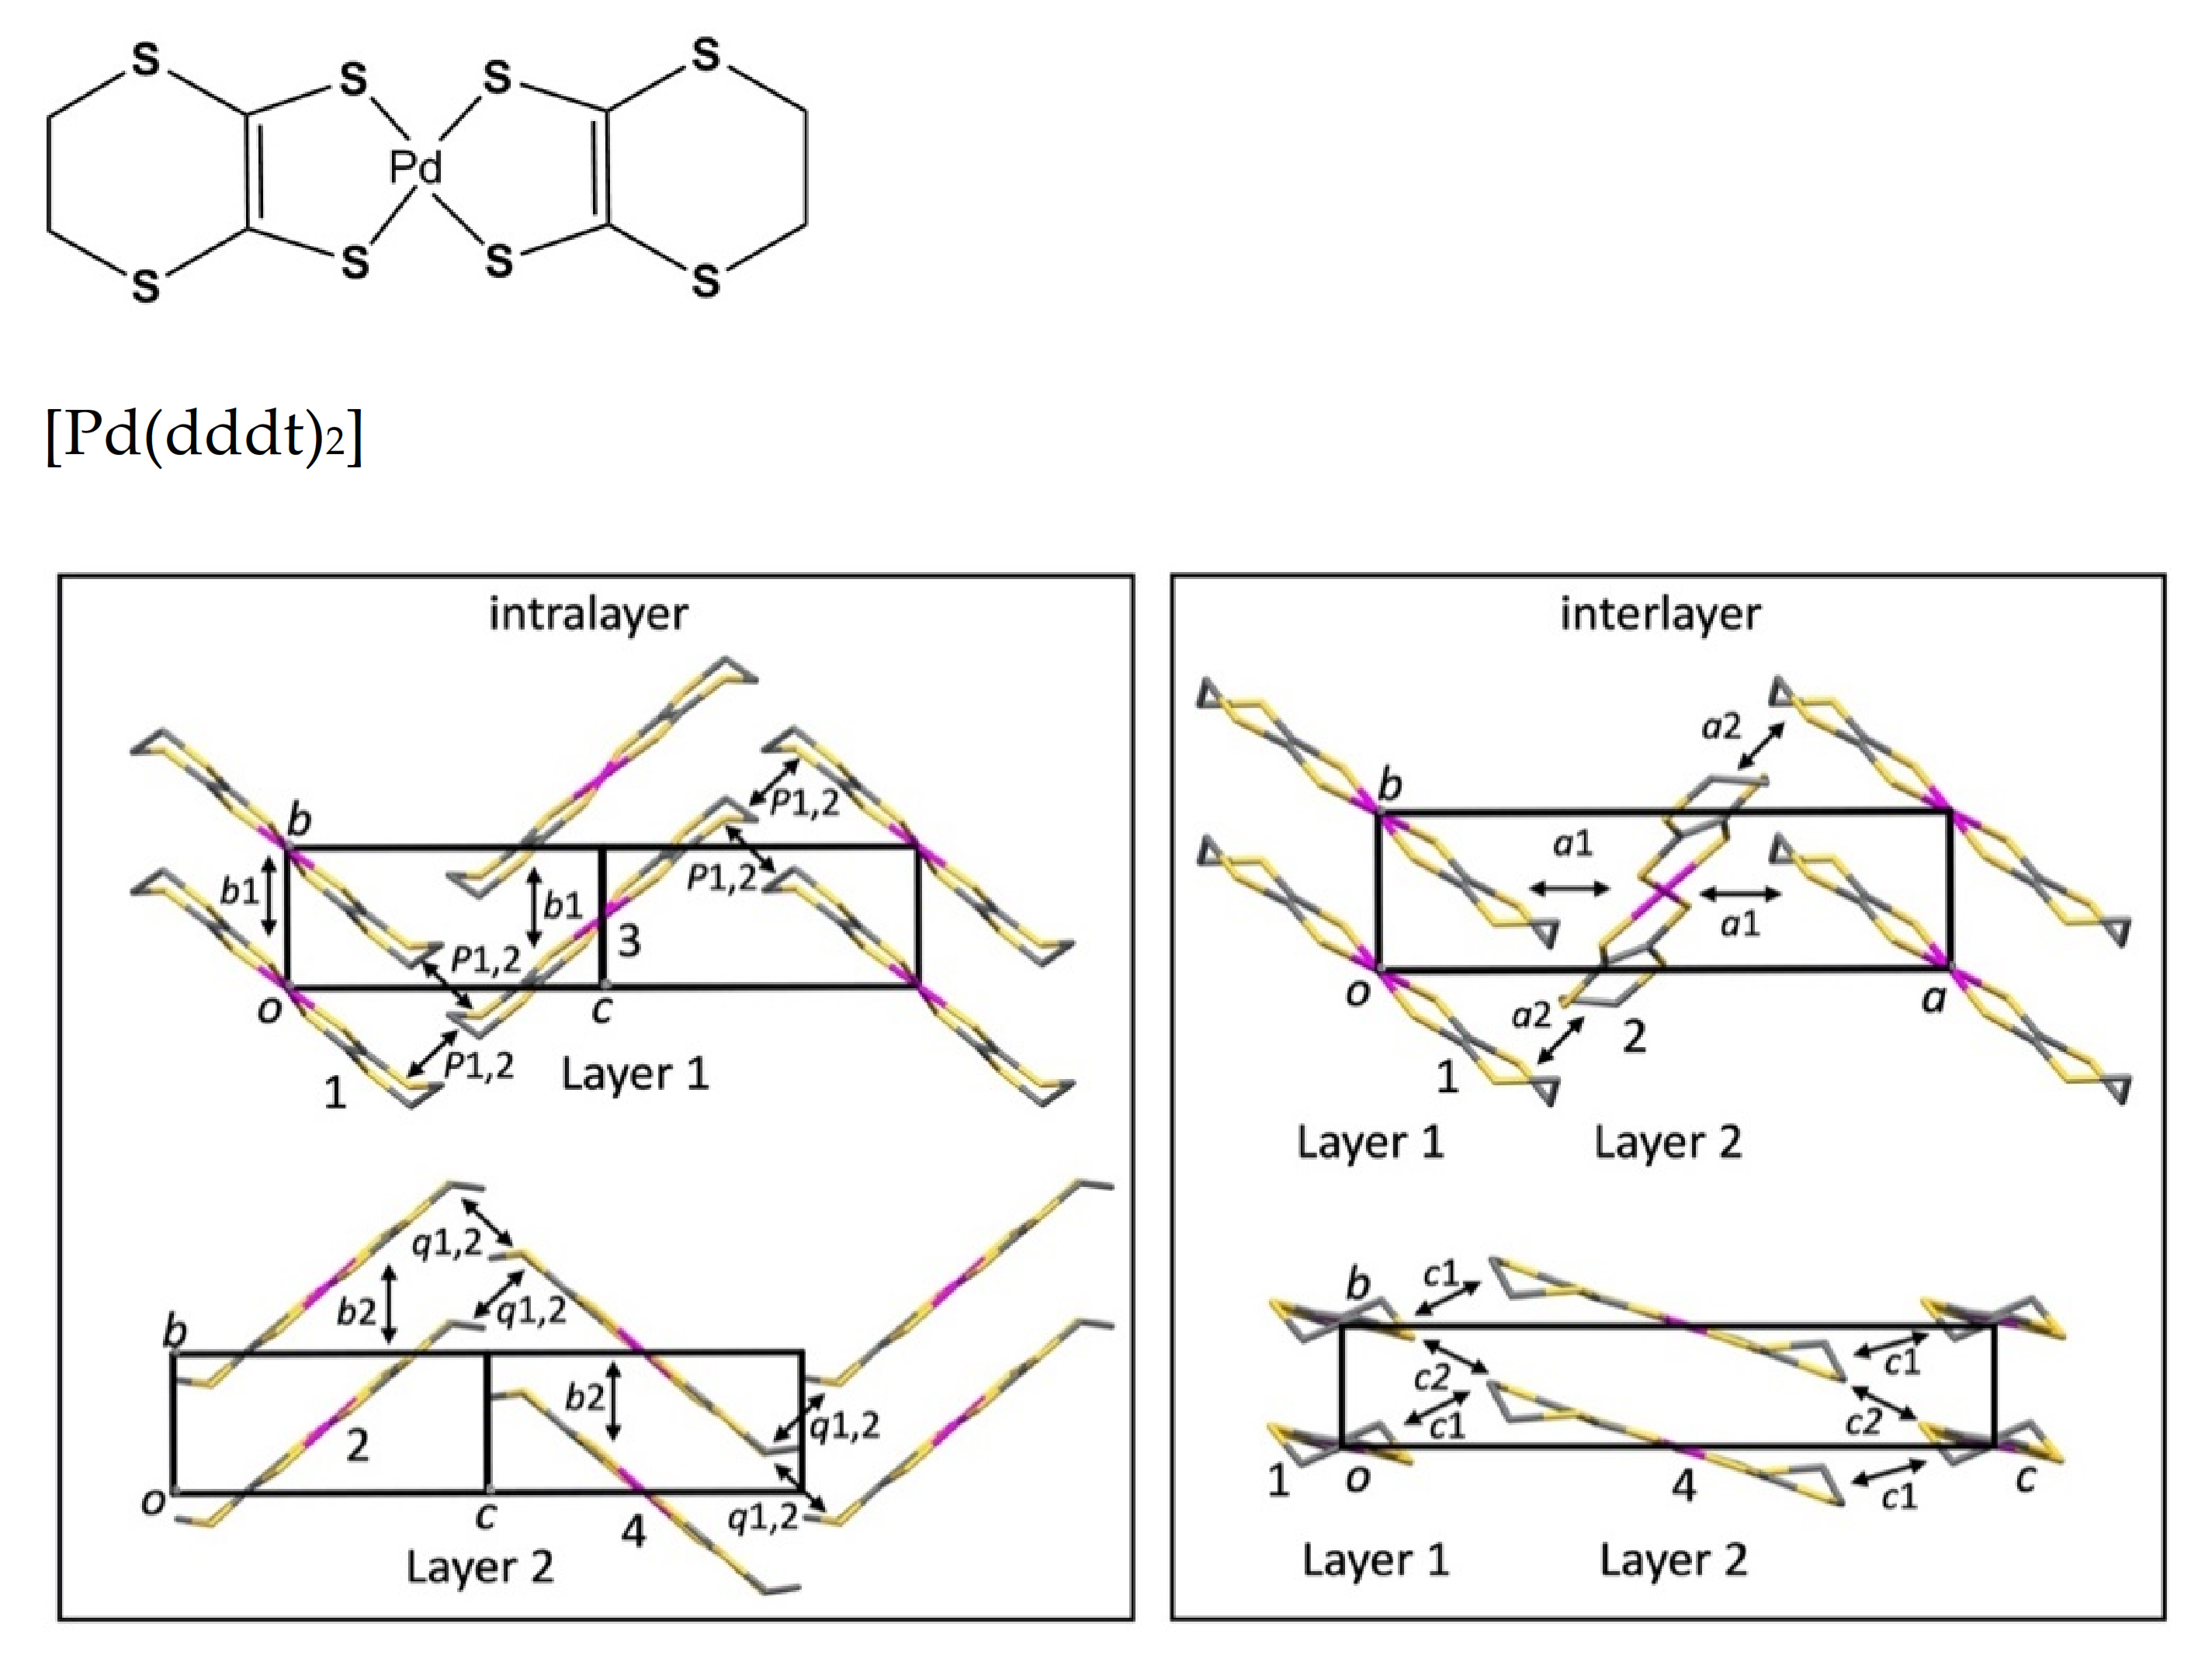
Because of the multi-orbital character of single-component molecular conductors, it is also expected that under certain conditions, more exotic electronic states may occur. For example, the HOMO and LUMO bands may be induced to touch at a single point to form a Dirac electron system. Indeed, we have found that a single-component molecular crystal, [Pd(dddt)
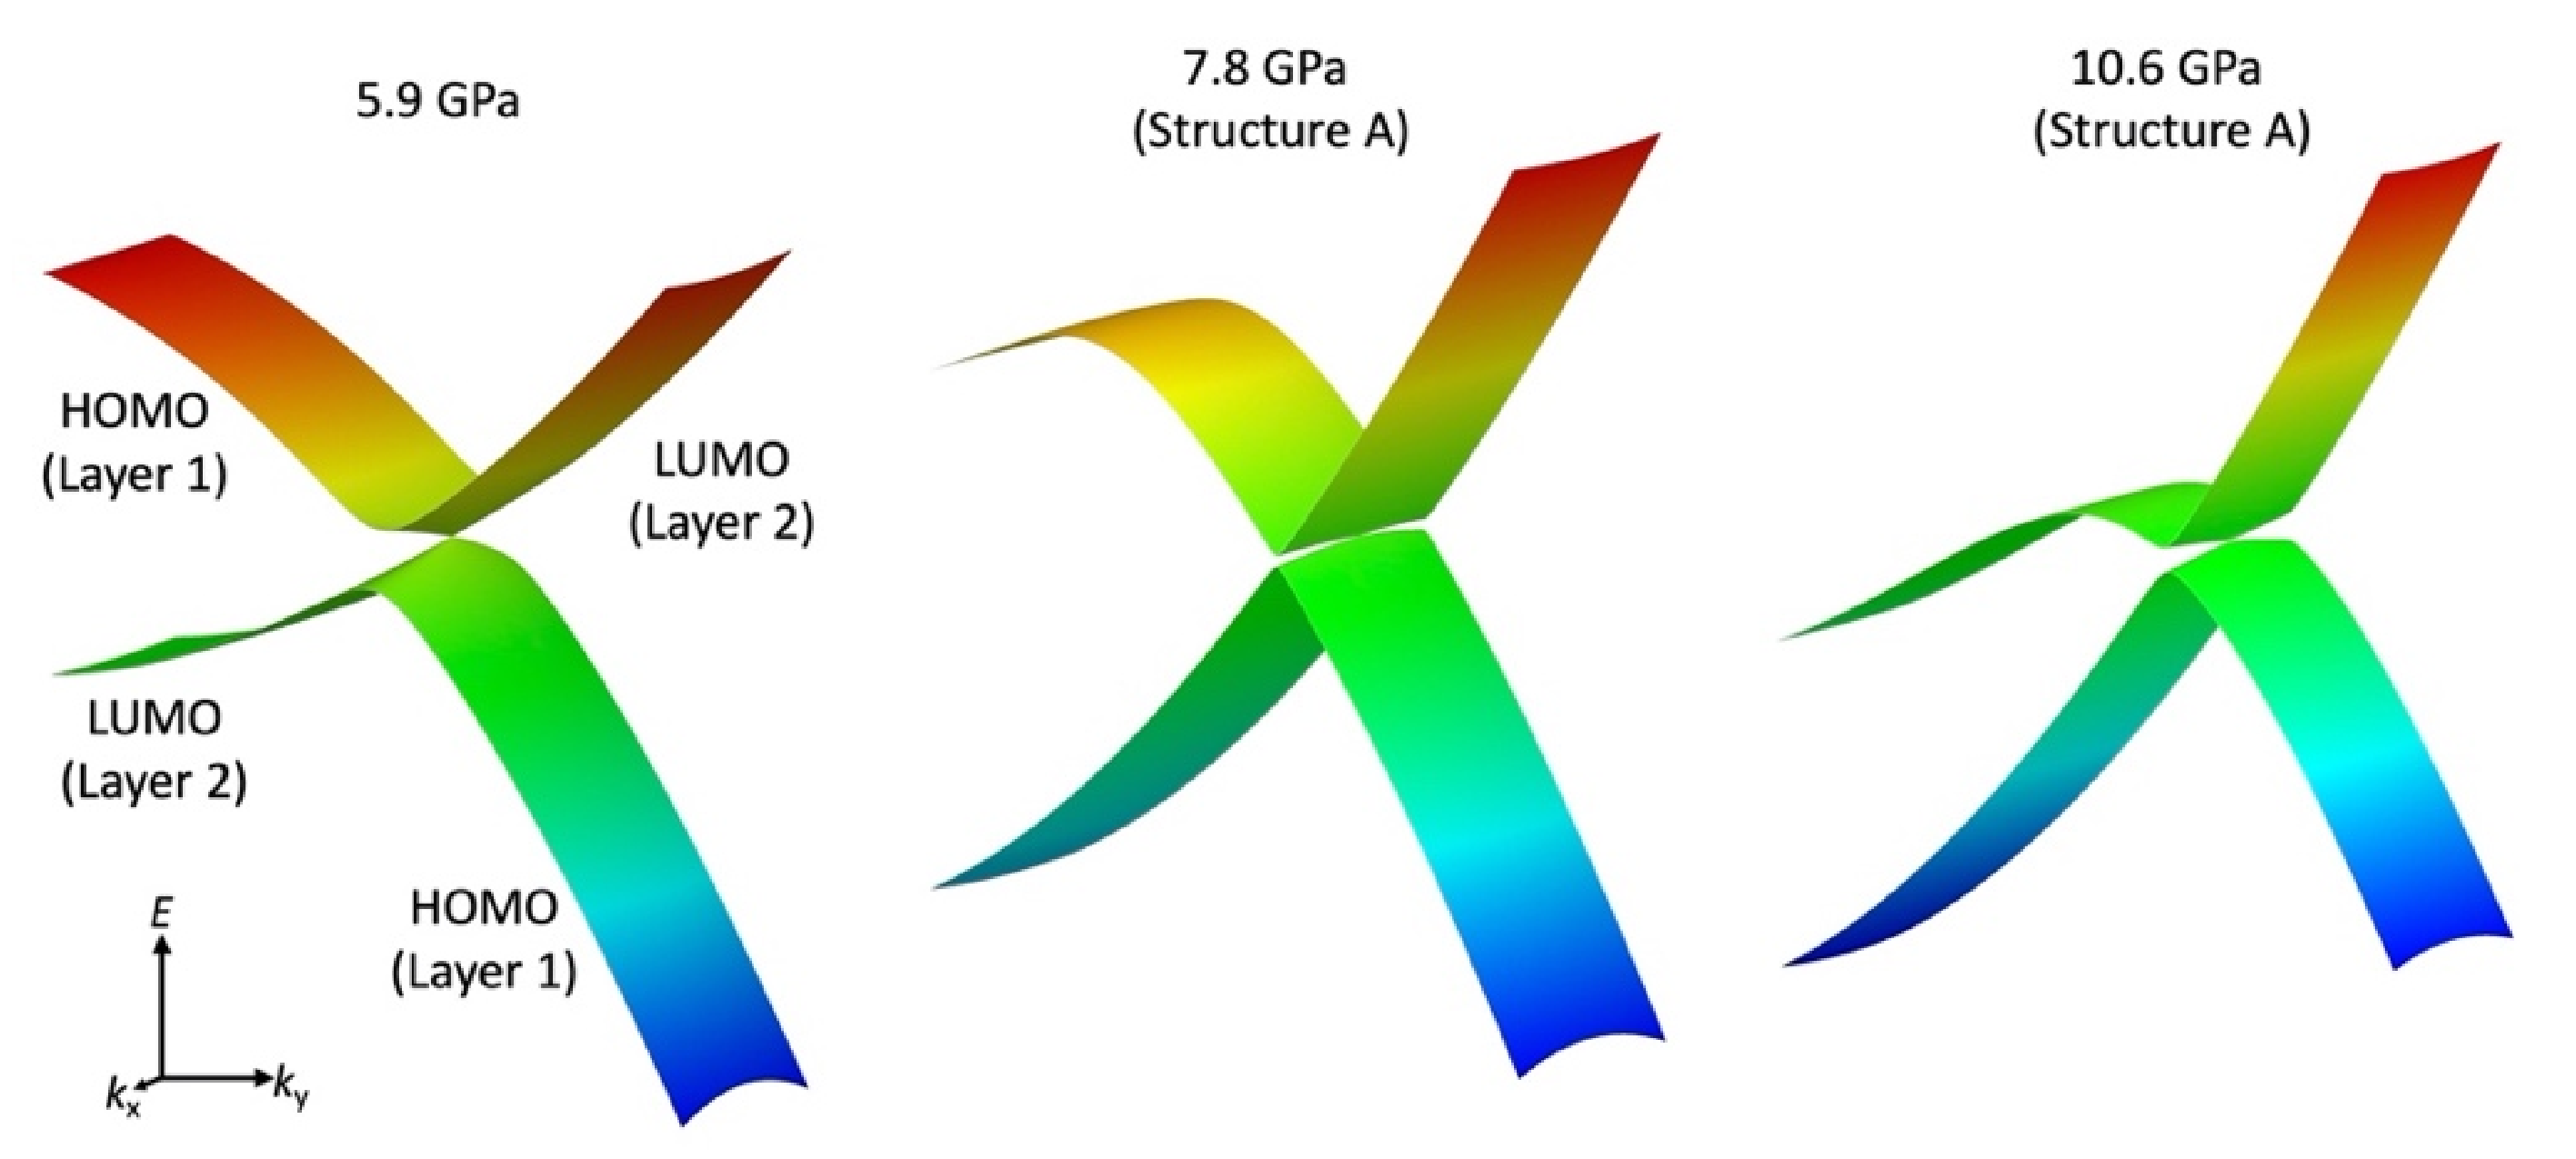
2] (dddt = 5,6-dihydro-1,4-dithiin-2,3-dithiolate), forms a Dirac electron system under high pressure. First-principles density functional theory (DFT) calculations indicated that Dirac cones emerge from the crossing between the HOMO and LUMO bands, which originate from crystallographically independent layers within the crystal [
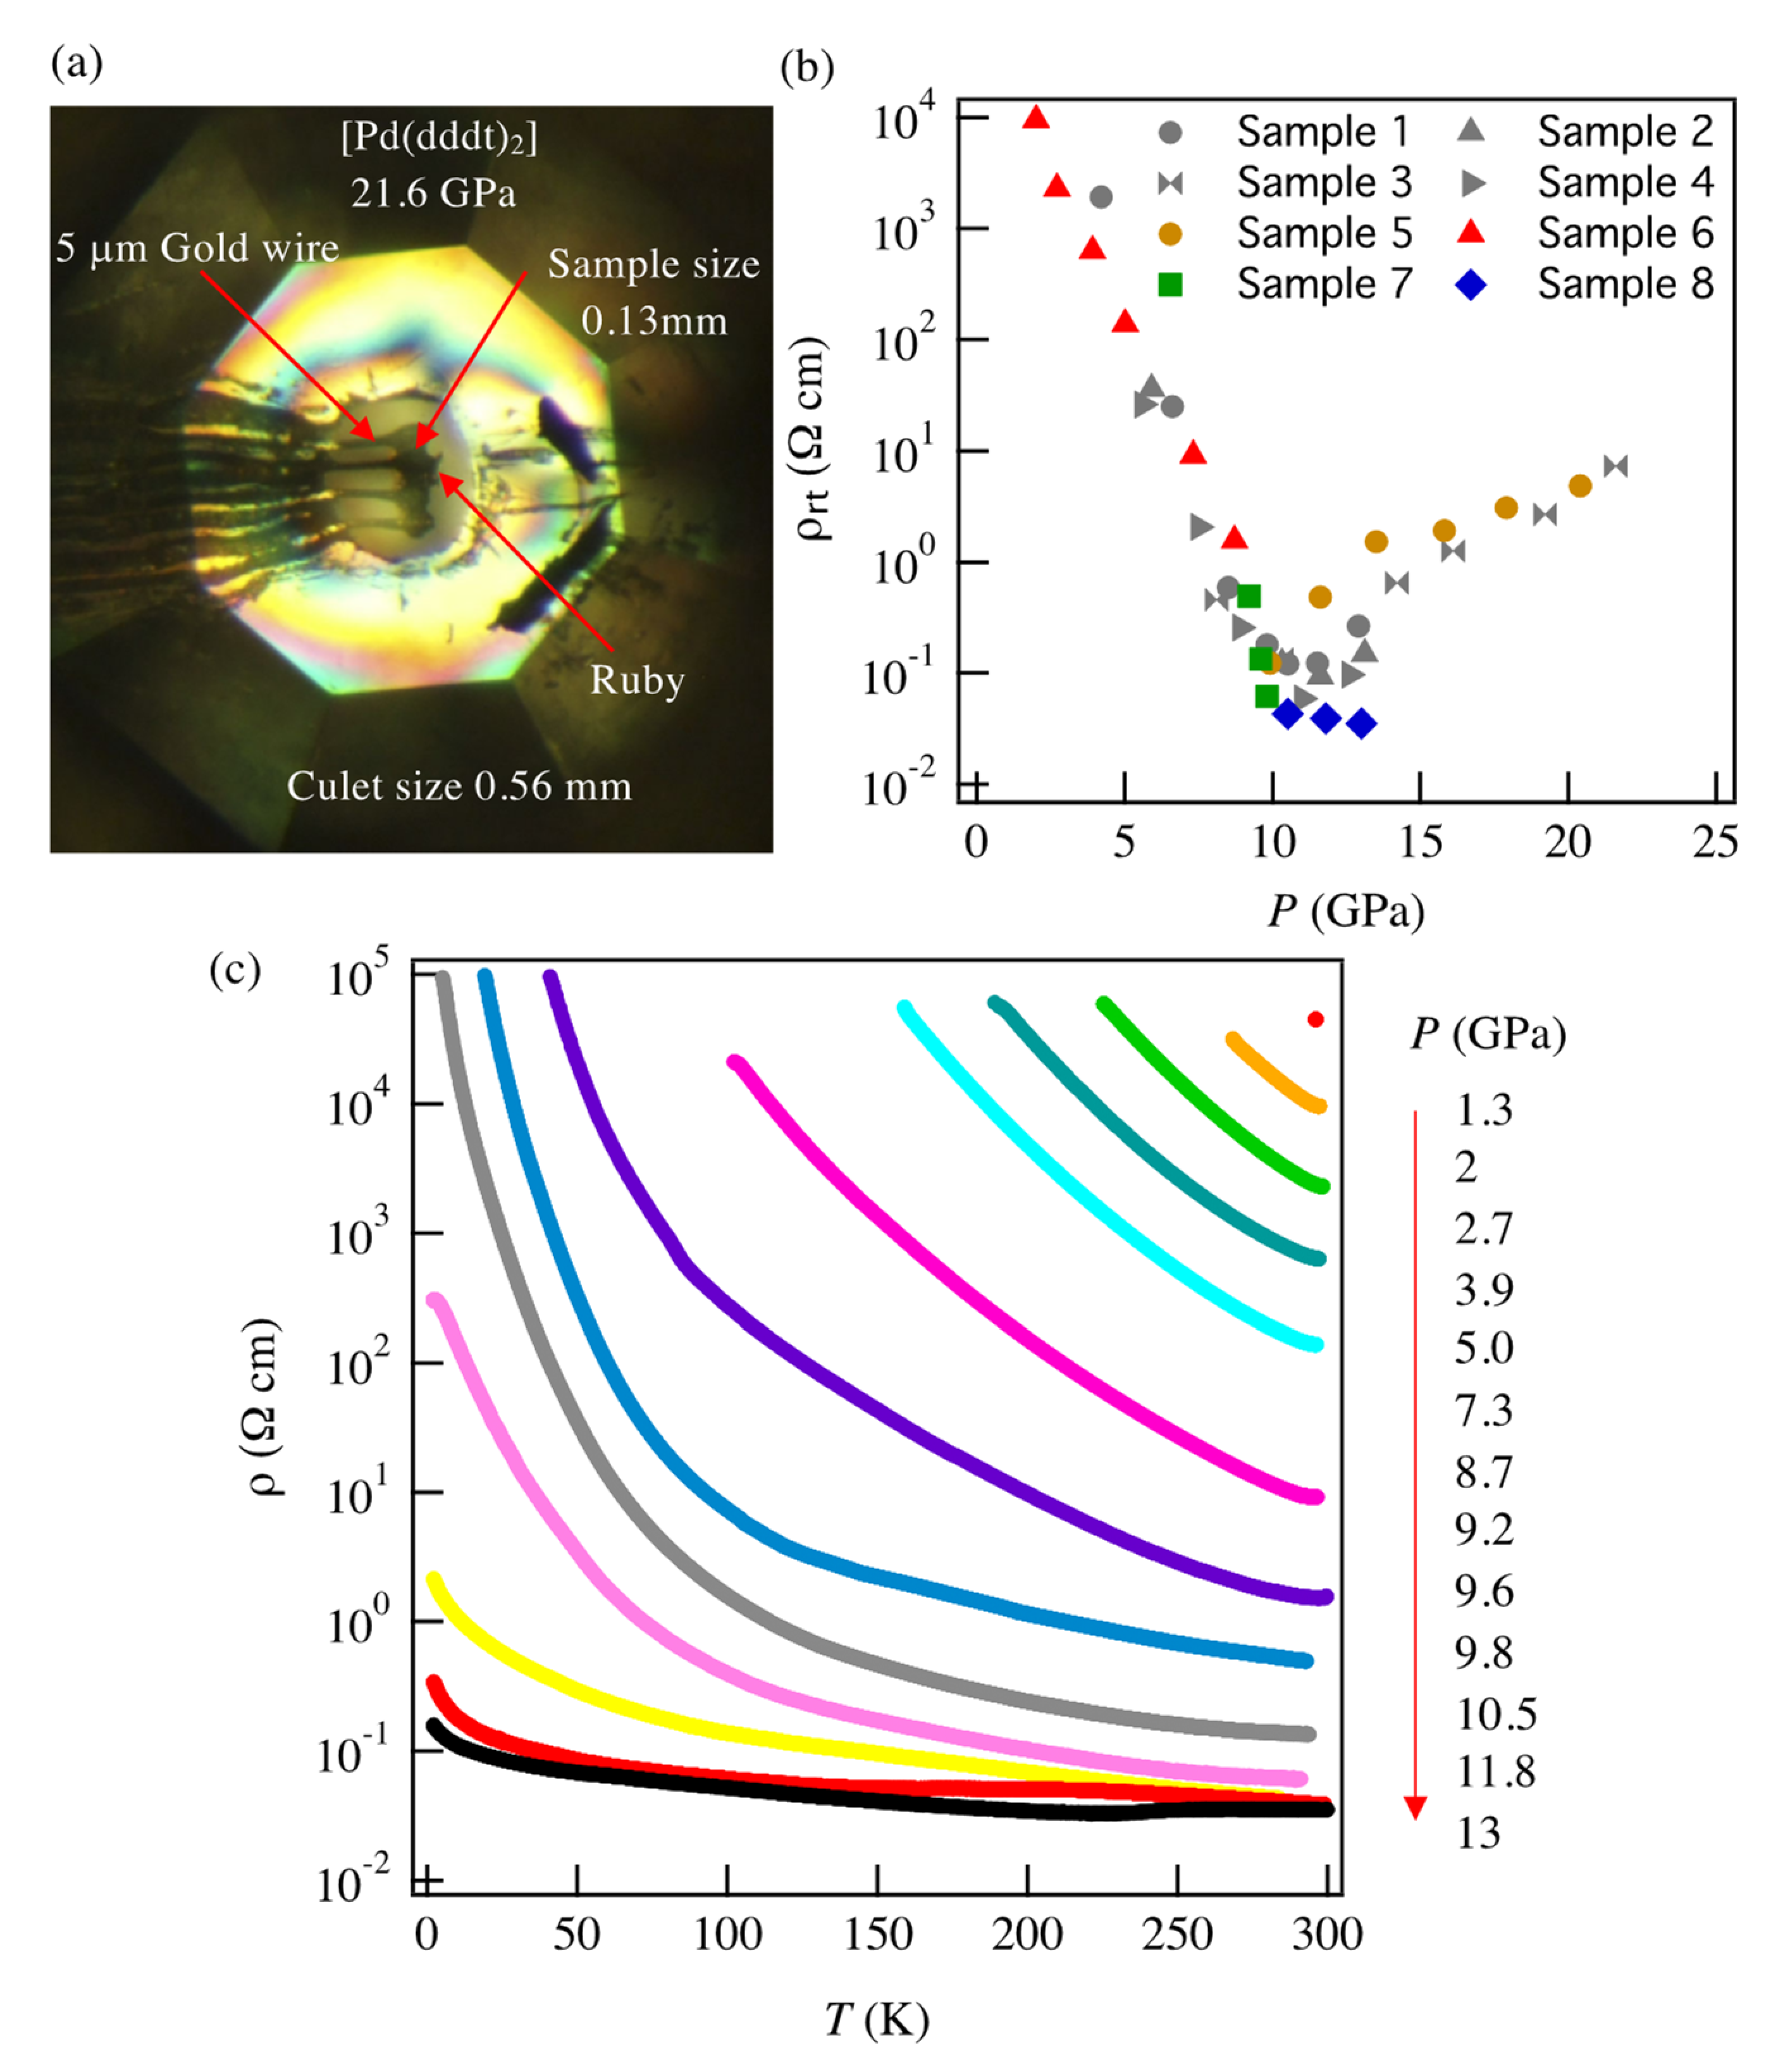
11]. In that work, the HOMO-LUMO energy gap was observed to be 0.65 eV at ambient pressure, and the room temperature resistivity was higher than the measurable range of the equipment. Pressure-dependent resistivity measurements revealed that the room temperature resistivity (ρrt) and activation energy (Ea) decrease sharply with increasing pressure above 4.2 GPa and increase slowly with increasing pressure above 12.6 GPa [12]; electrical properties in the lower pressure region are still unknown.
[Pd(dddt)2] belongs to the monoclinic crystal system with space group P21/n (no. 14) [
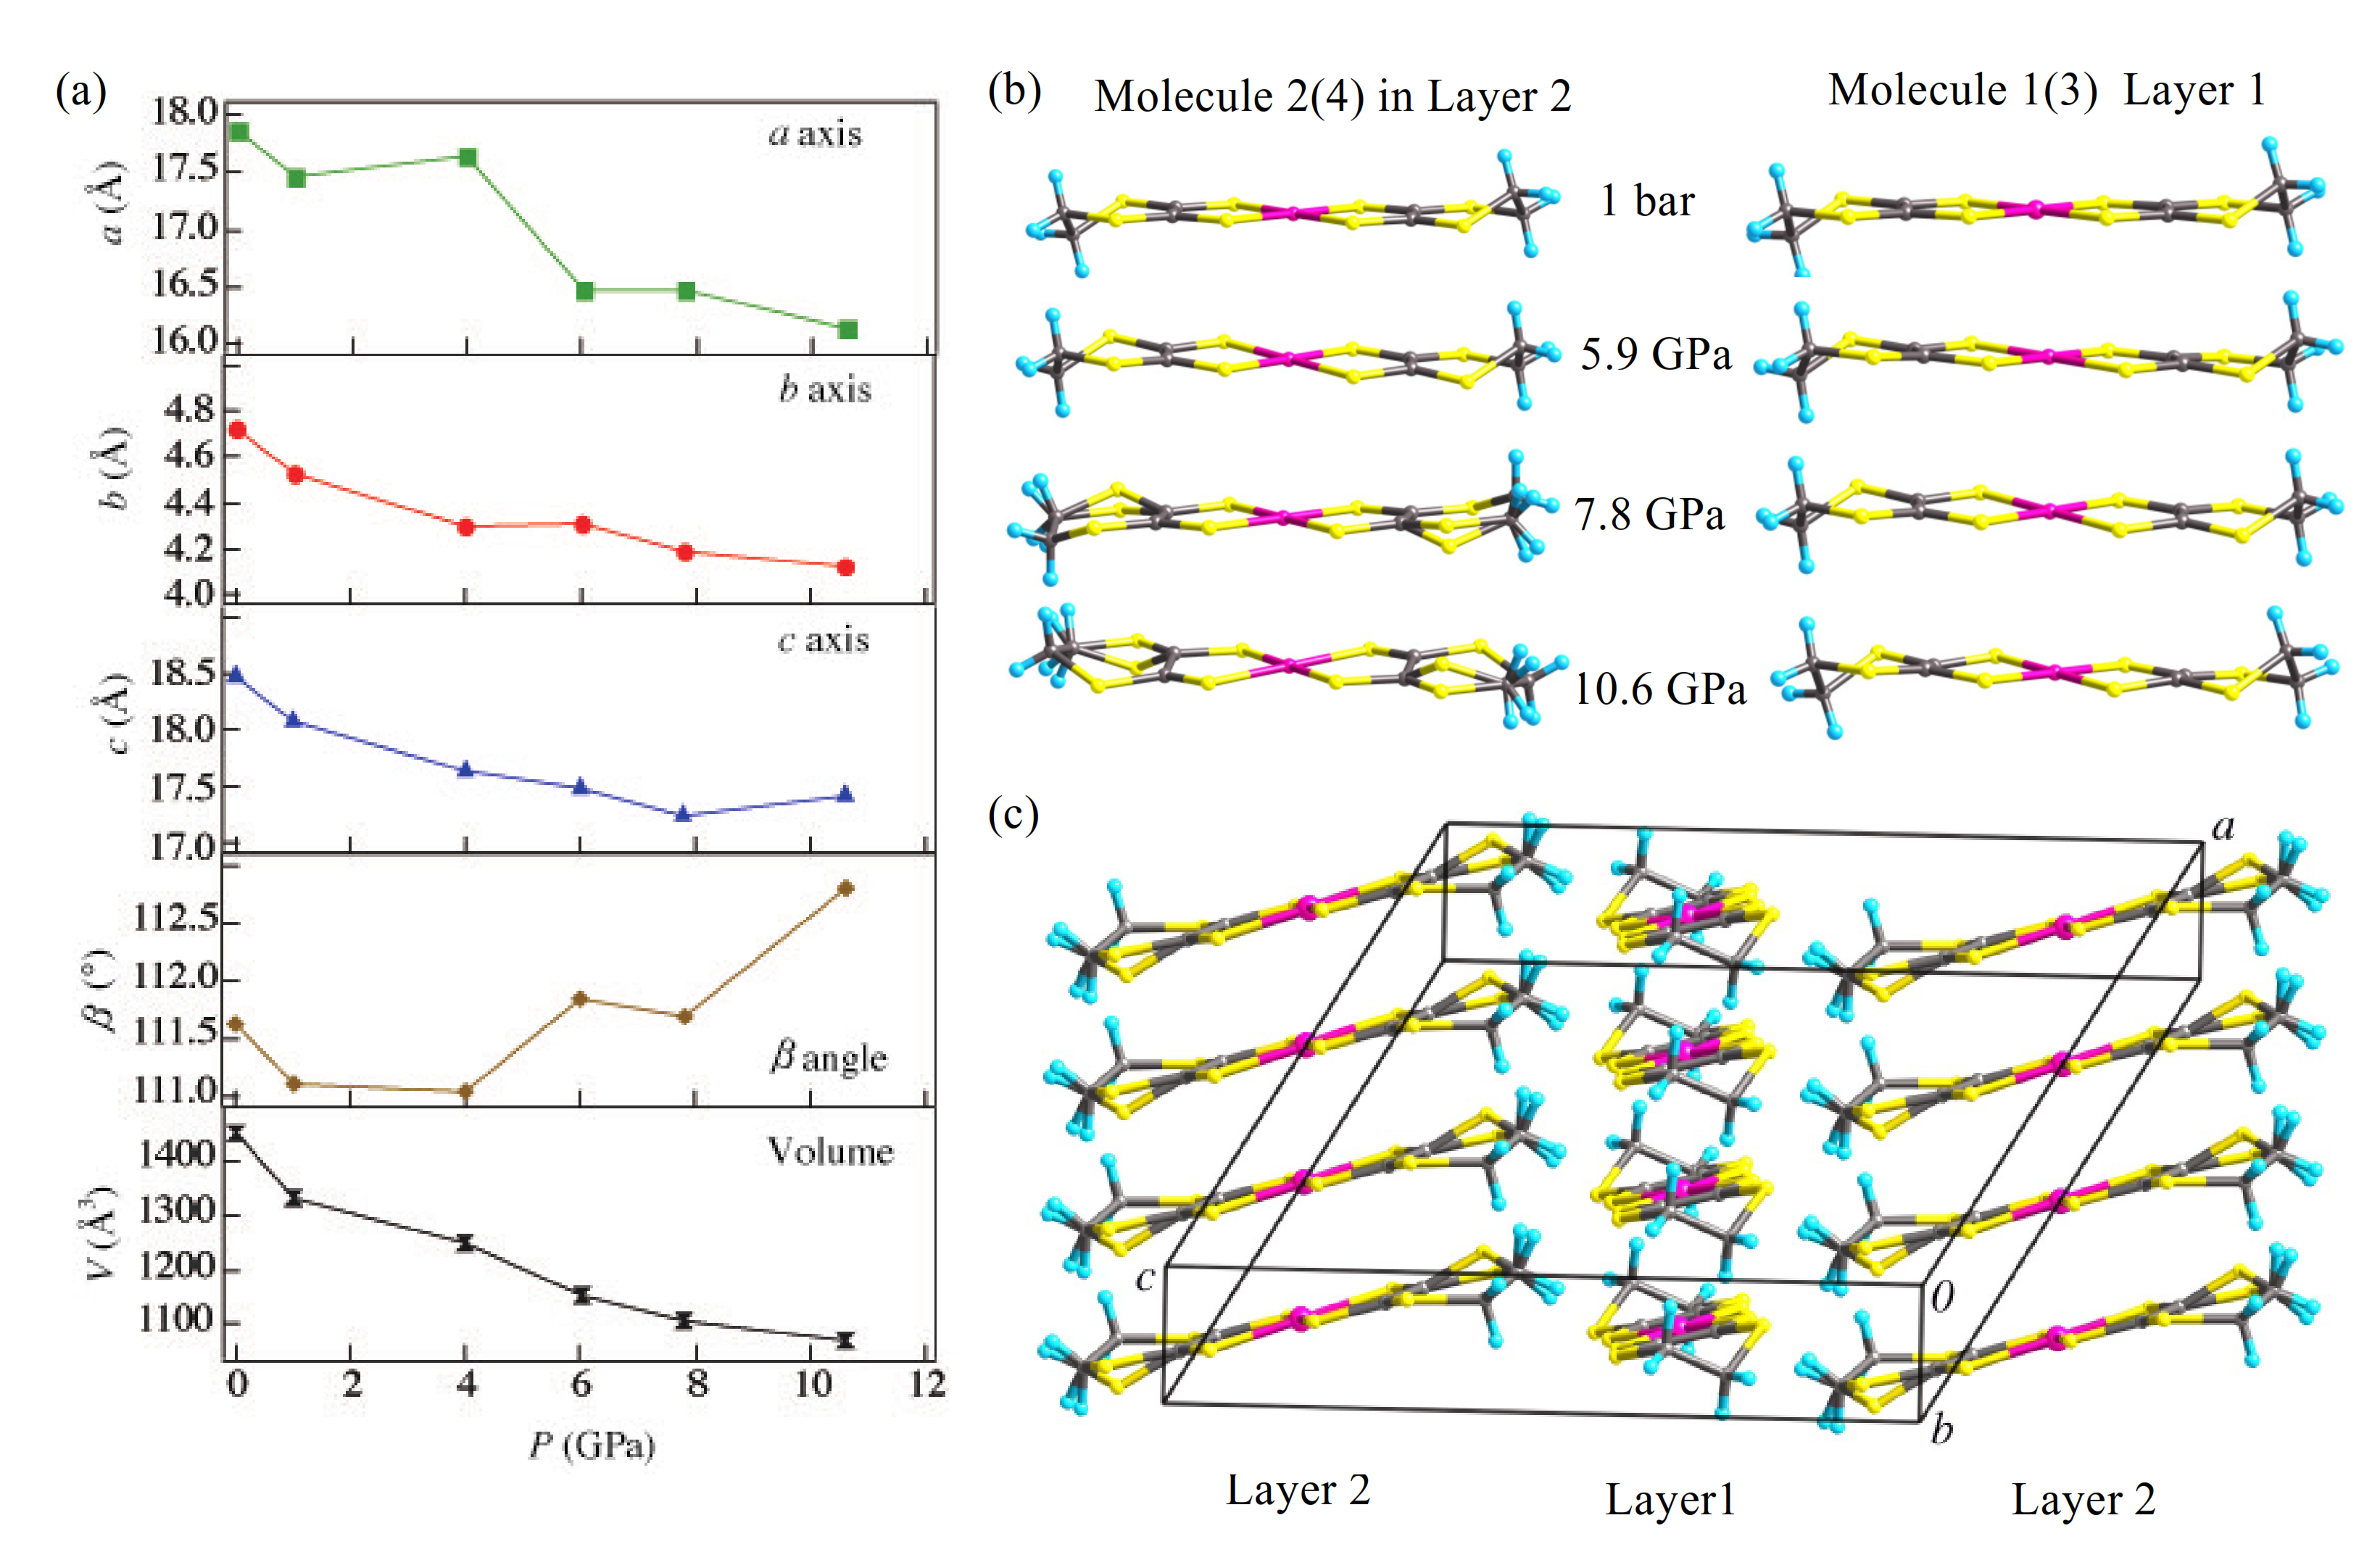
11]. The unit cell parameters at ambient pressure are as follows: a = 17.8698(82)) Å, b = 4.7281(19) Å, c = 18.4657(85) Å, β = 111.6313(63)°, V = 1450.3(1) Å3, Z = 4. 
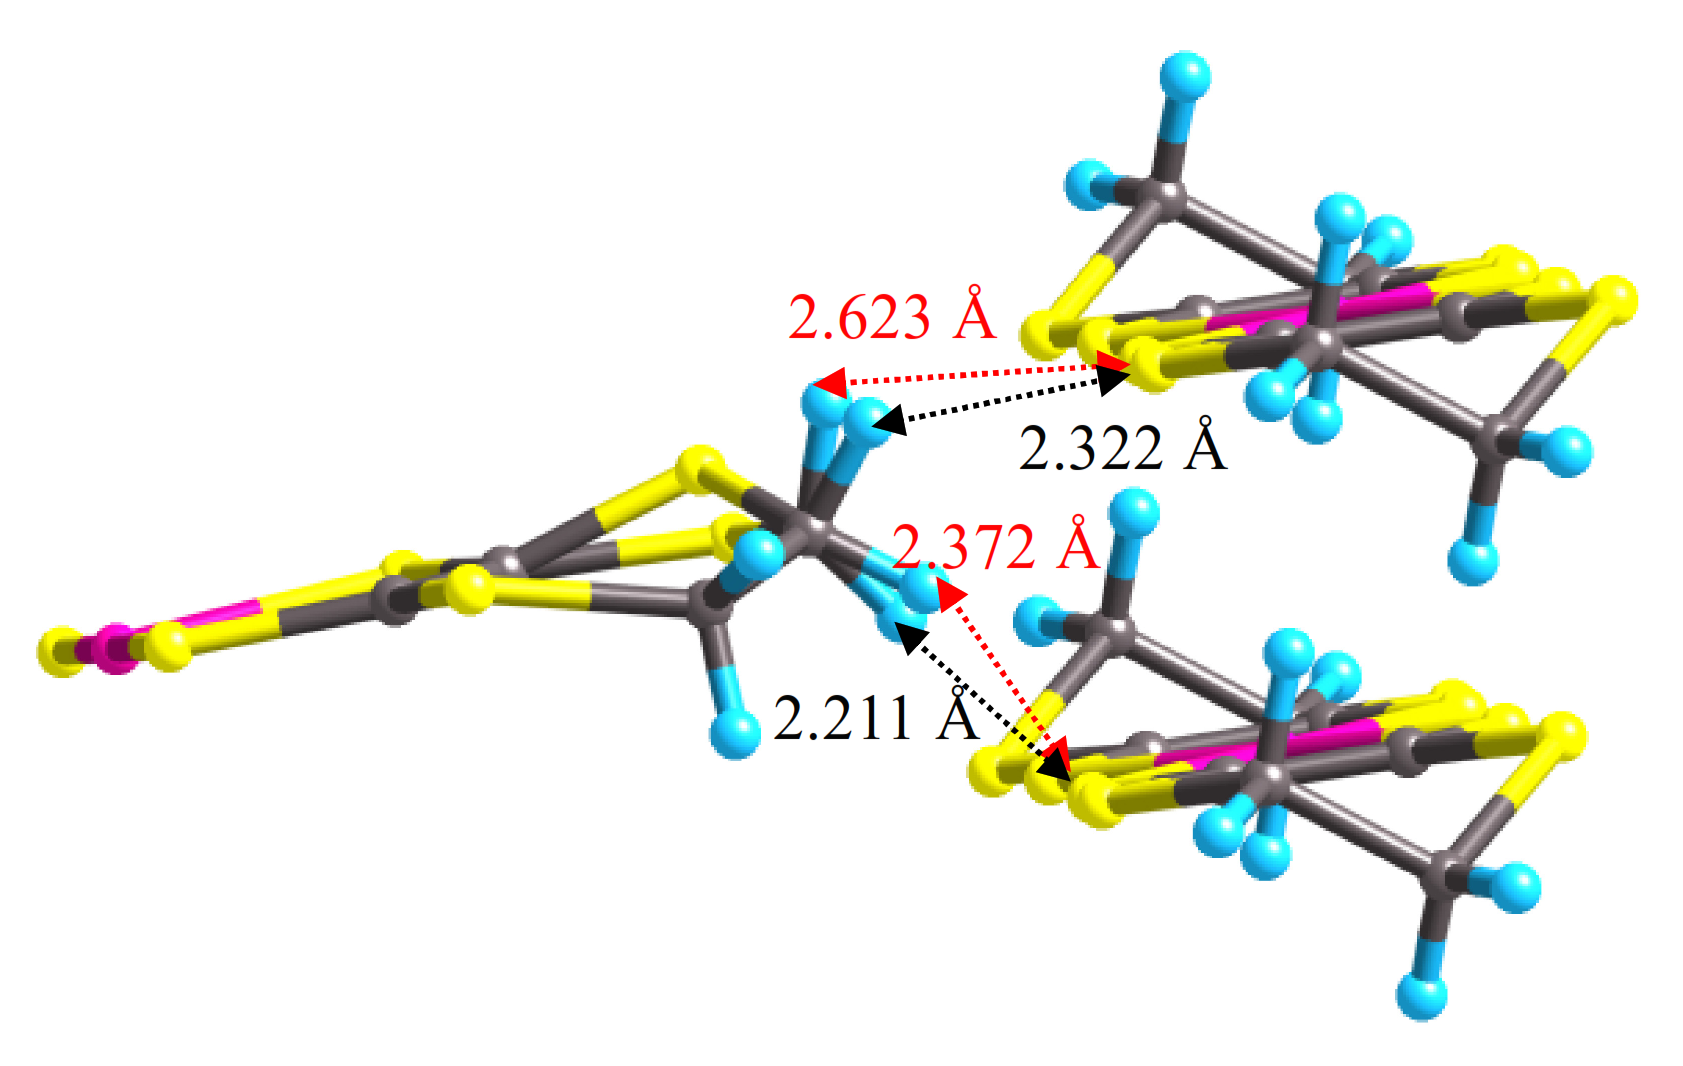
Figure 1 shows the molecular structure and crystal structure of [Pd(dddt)2]. [Pd(dddt)2] molecules are uniformly stacked along the b axis, where Pd atoms are located at inversion centers. The Pd···Pd distance is 4.728 Å, which is identical to the magnitude of the b axis. The structure may further be thought of as crystallographically independent layers stacked in the a
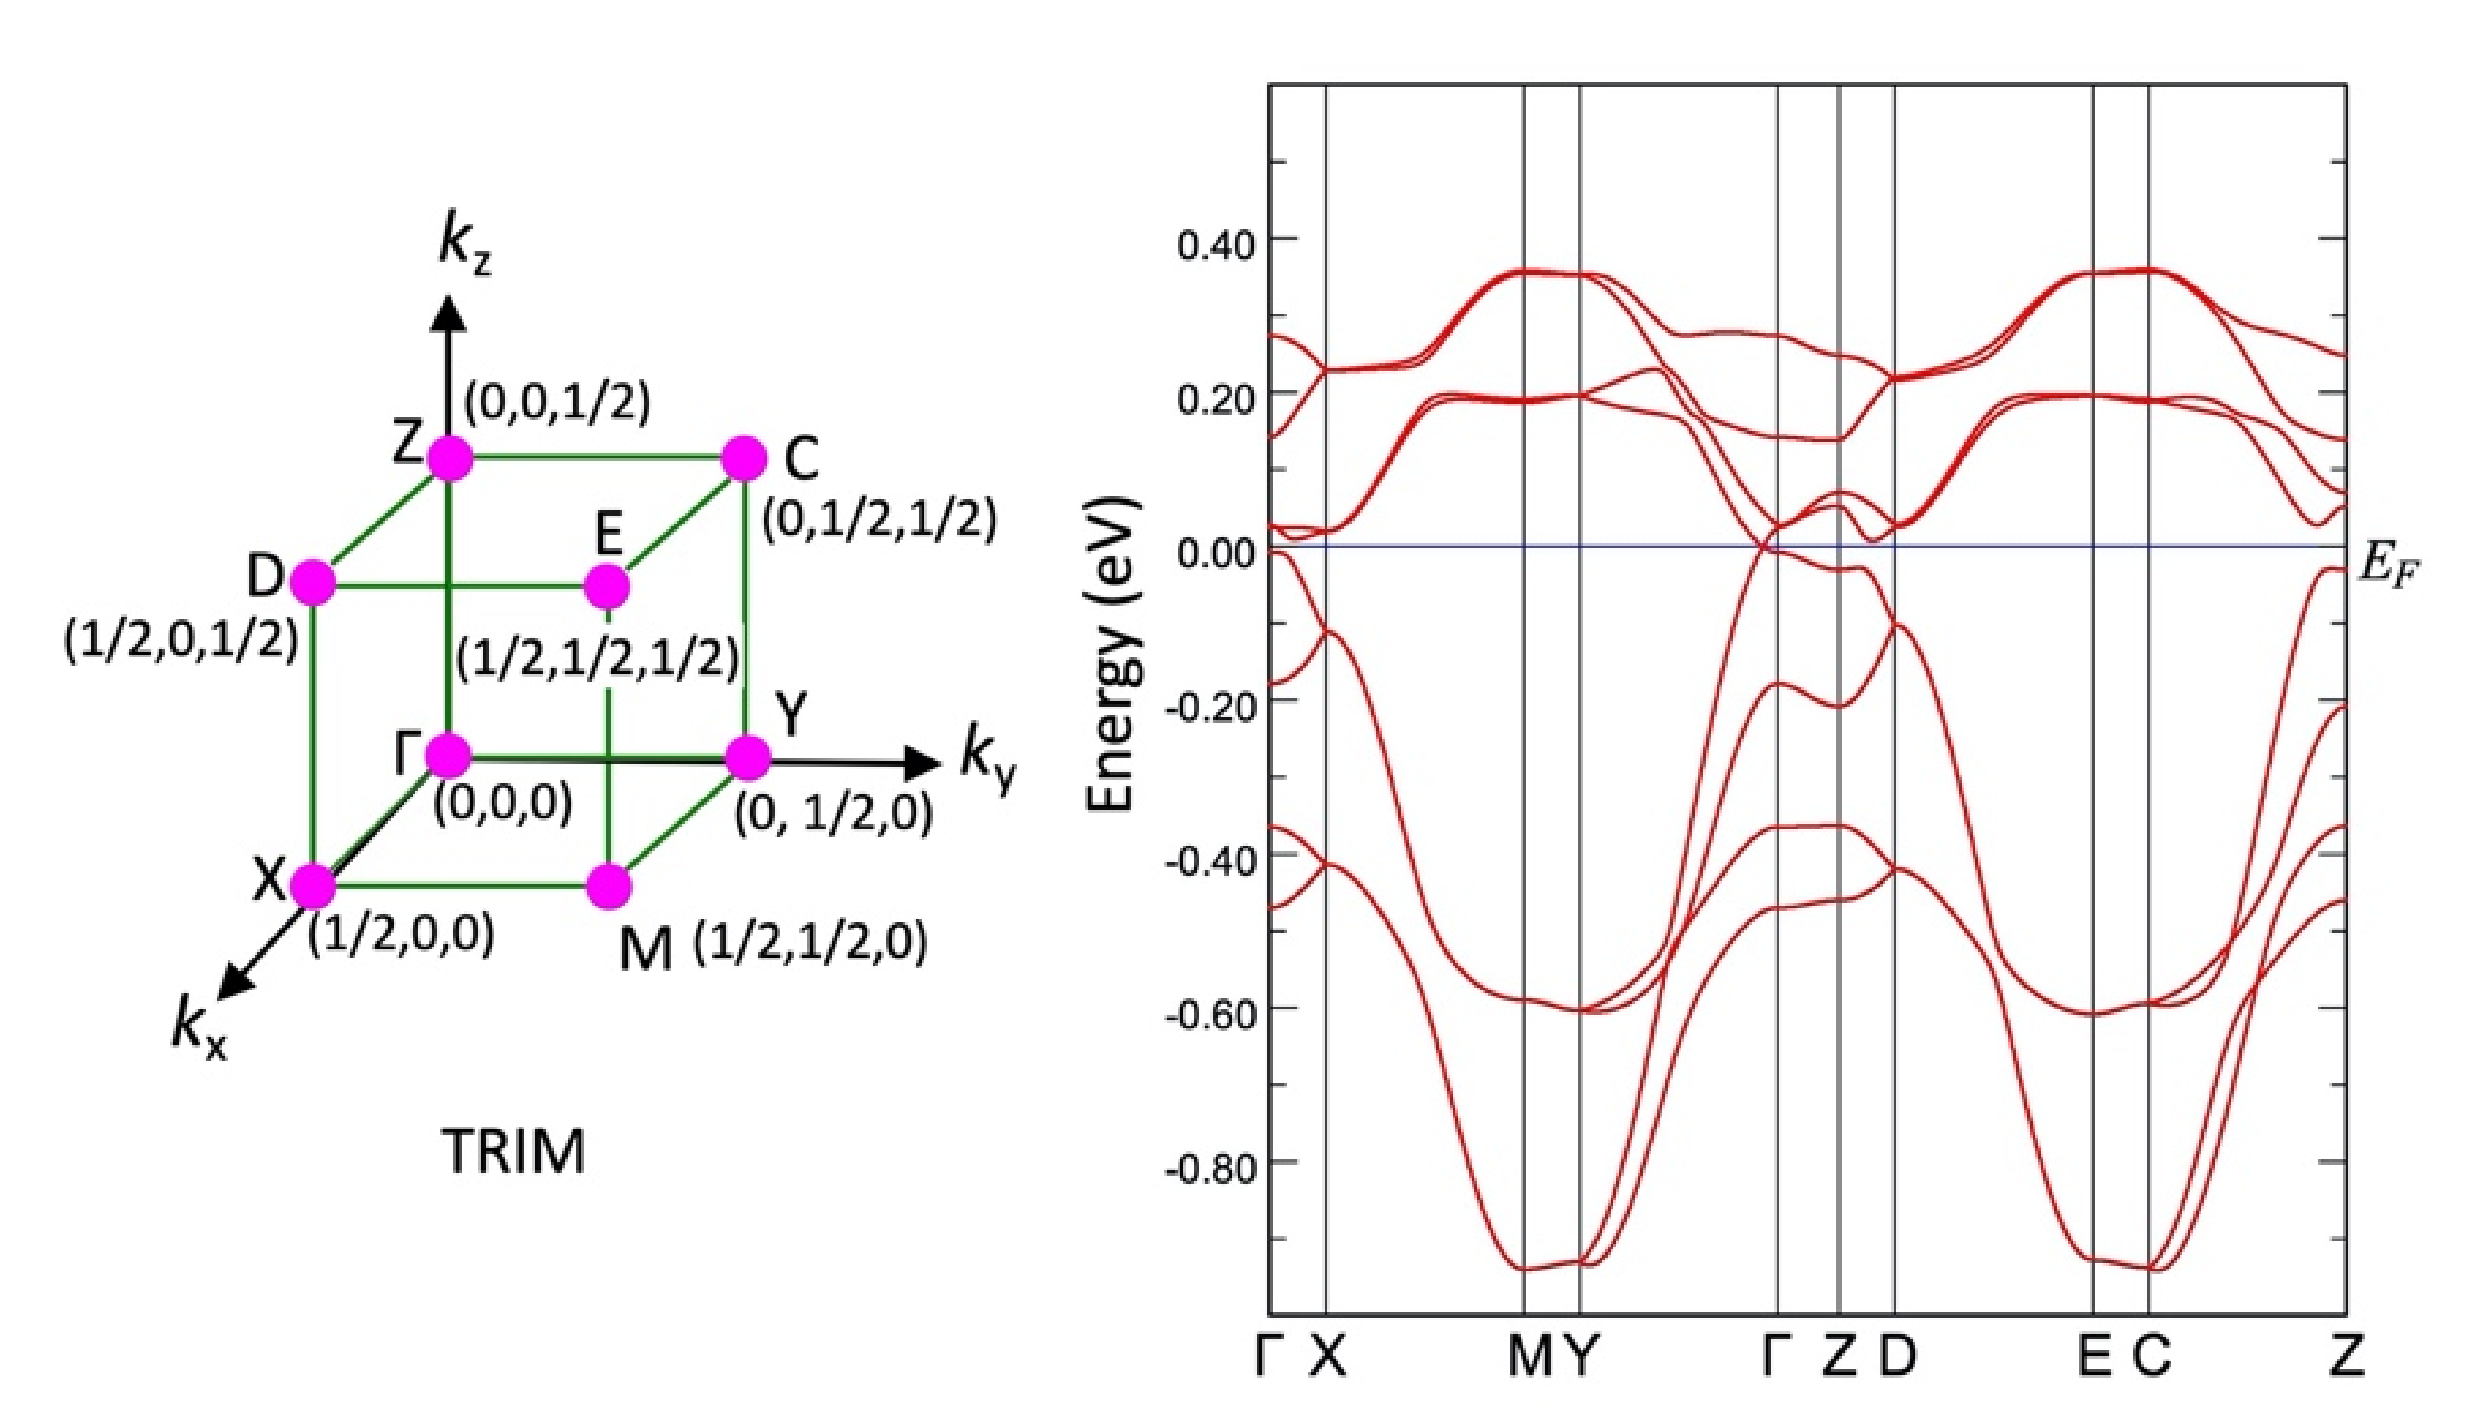
c direction: Layer 1 contains molecules in which the Pd atoms are located on the 2b Wyckoff sites at (0, 0, 1/2) and (1/2, 1/2, 0), while Layer 2 contains molecules in which the Pd atoms are located on the 2a Wyckoff sites at (0, 0, 0) and (1/2, 1/2, 1/2). It is this layered structure that gives rise to the Dirac electron state at high pressure.
In other materials, the Dirac electron system shows interesting quantum magnetotransport phenomena, such as quantum Hall effects (QHEs) reported in graphene [13] and topological insulators [14], and linear relationships of magnetoresistance (MR = [ρ(B) − ρ(0)]/ρ(0)) with magnetic field in iron pnictide, Ba(FeAs)2, single crystals, when the magnetic field is perpendicular to the current direction at low temperature [15]. Magnetoresistance (MR) measurements in a bulk two-dimensional Dirac electron system, α-(BEDT-TTF)2I3, showed an unusual negative interlayer MR in the low magnetic field region [16]. In the case of [Pd(dddt)
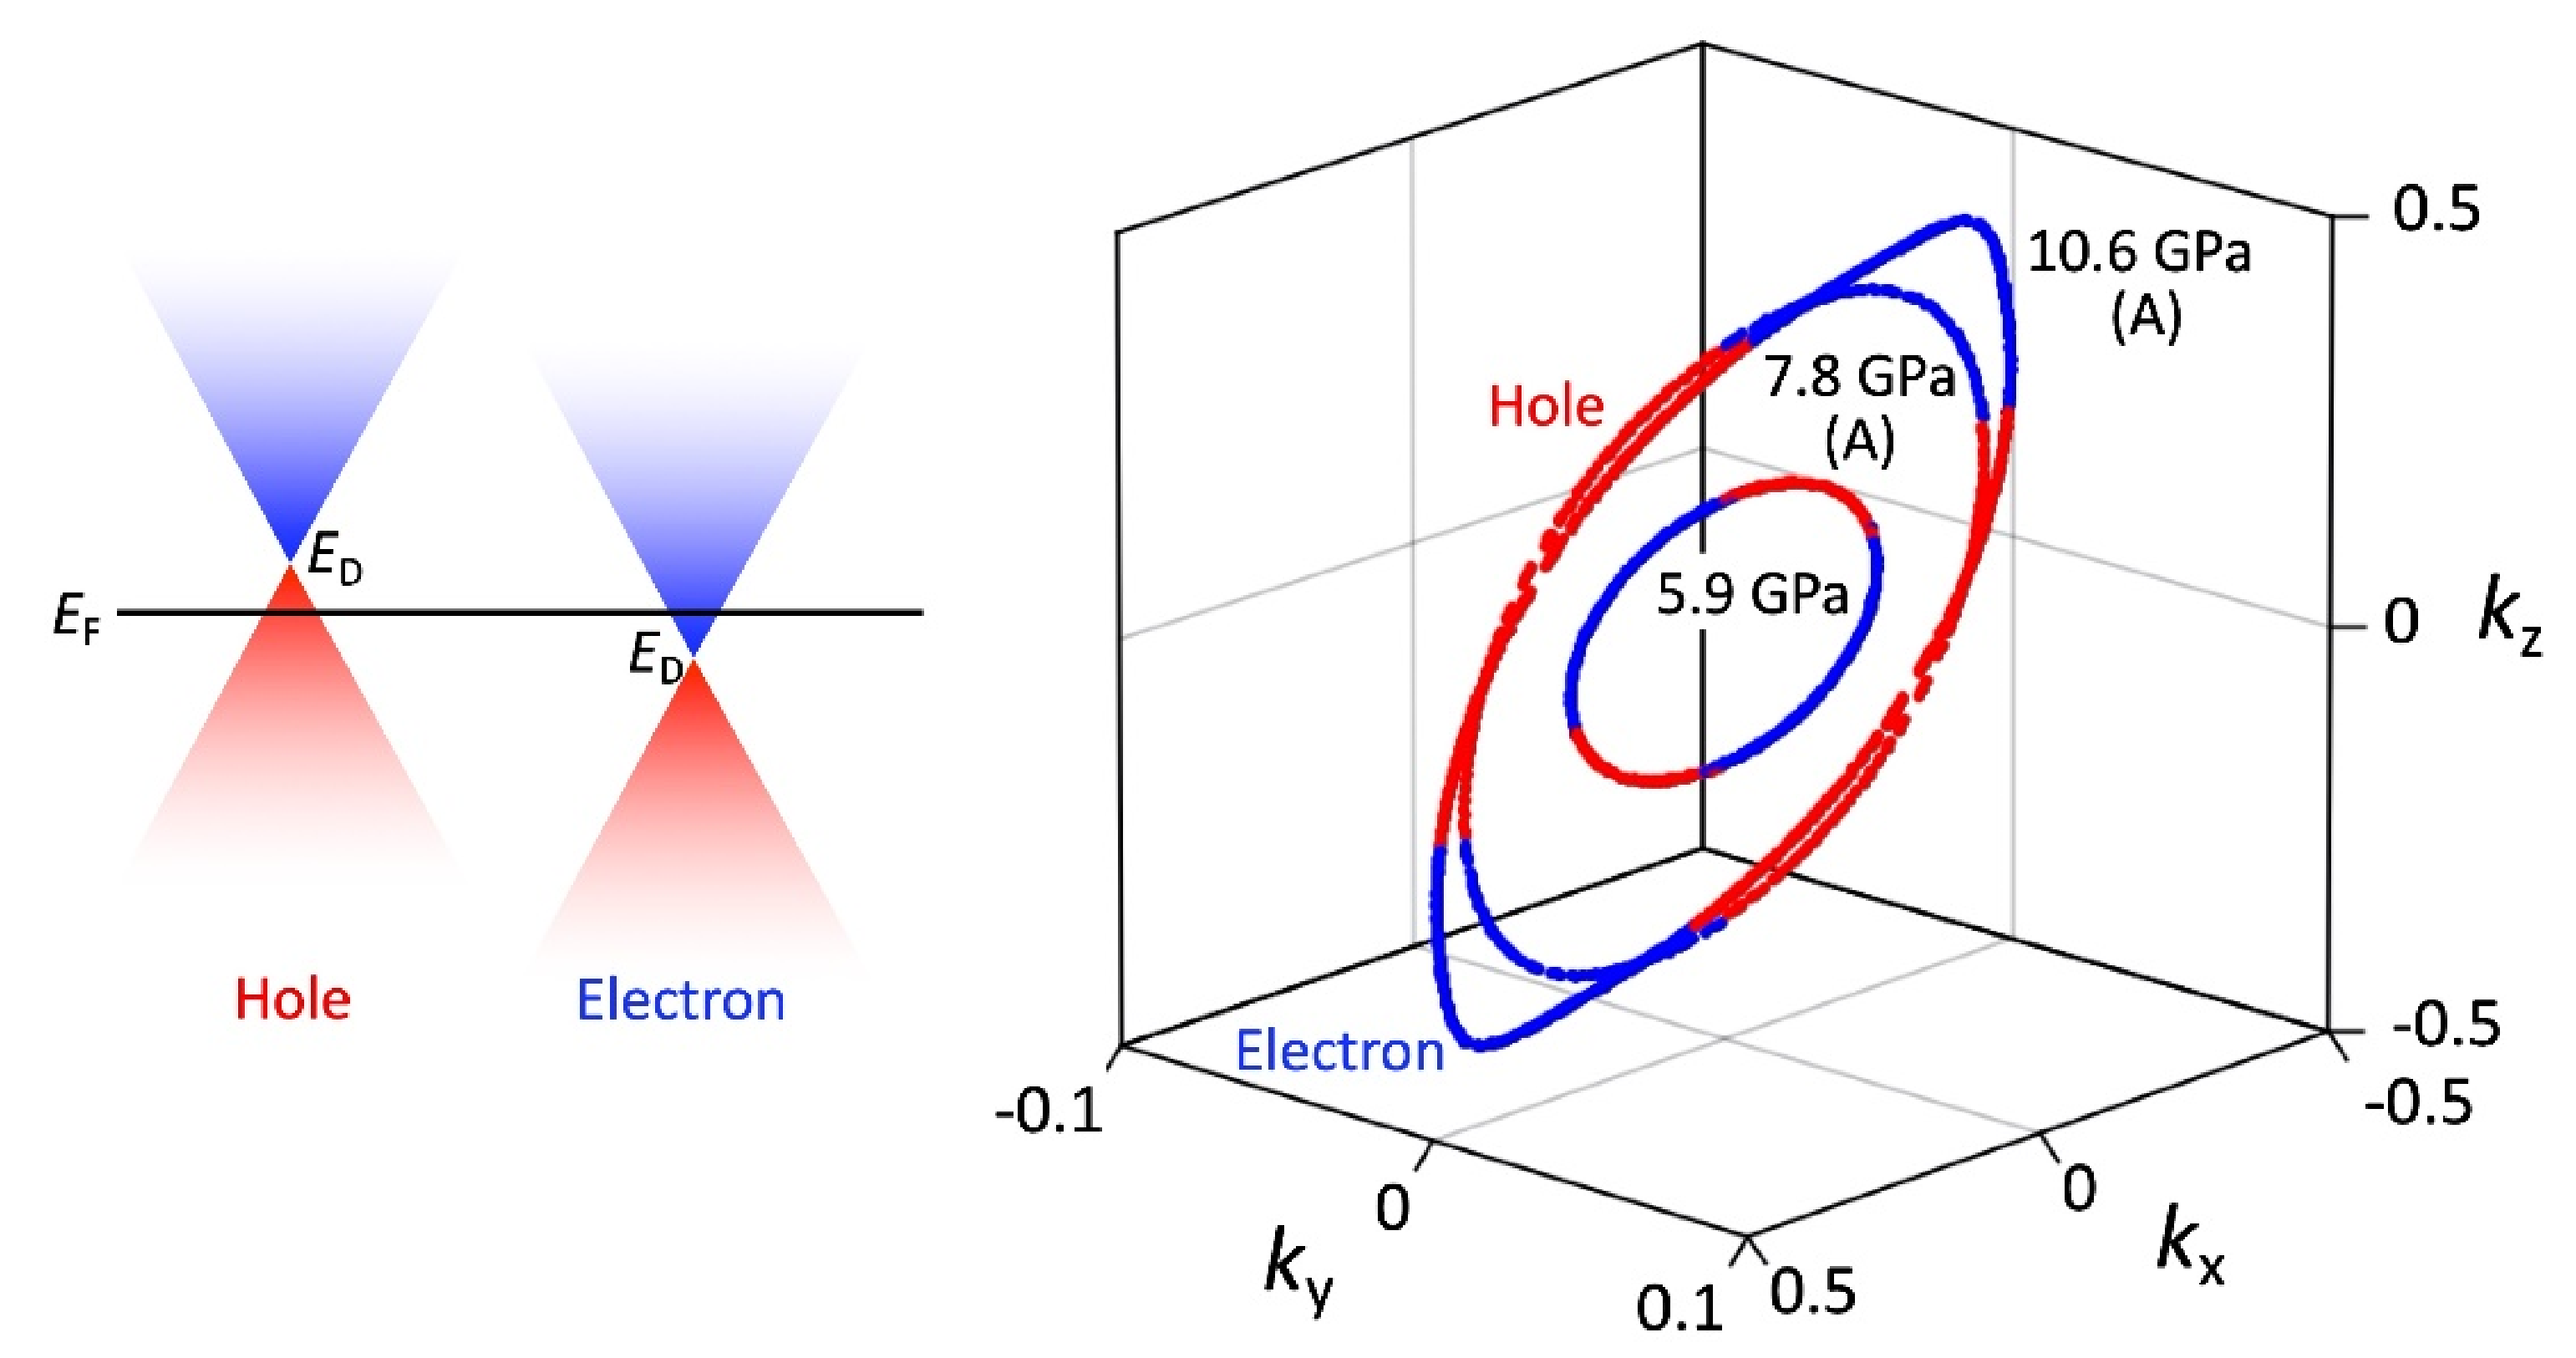
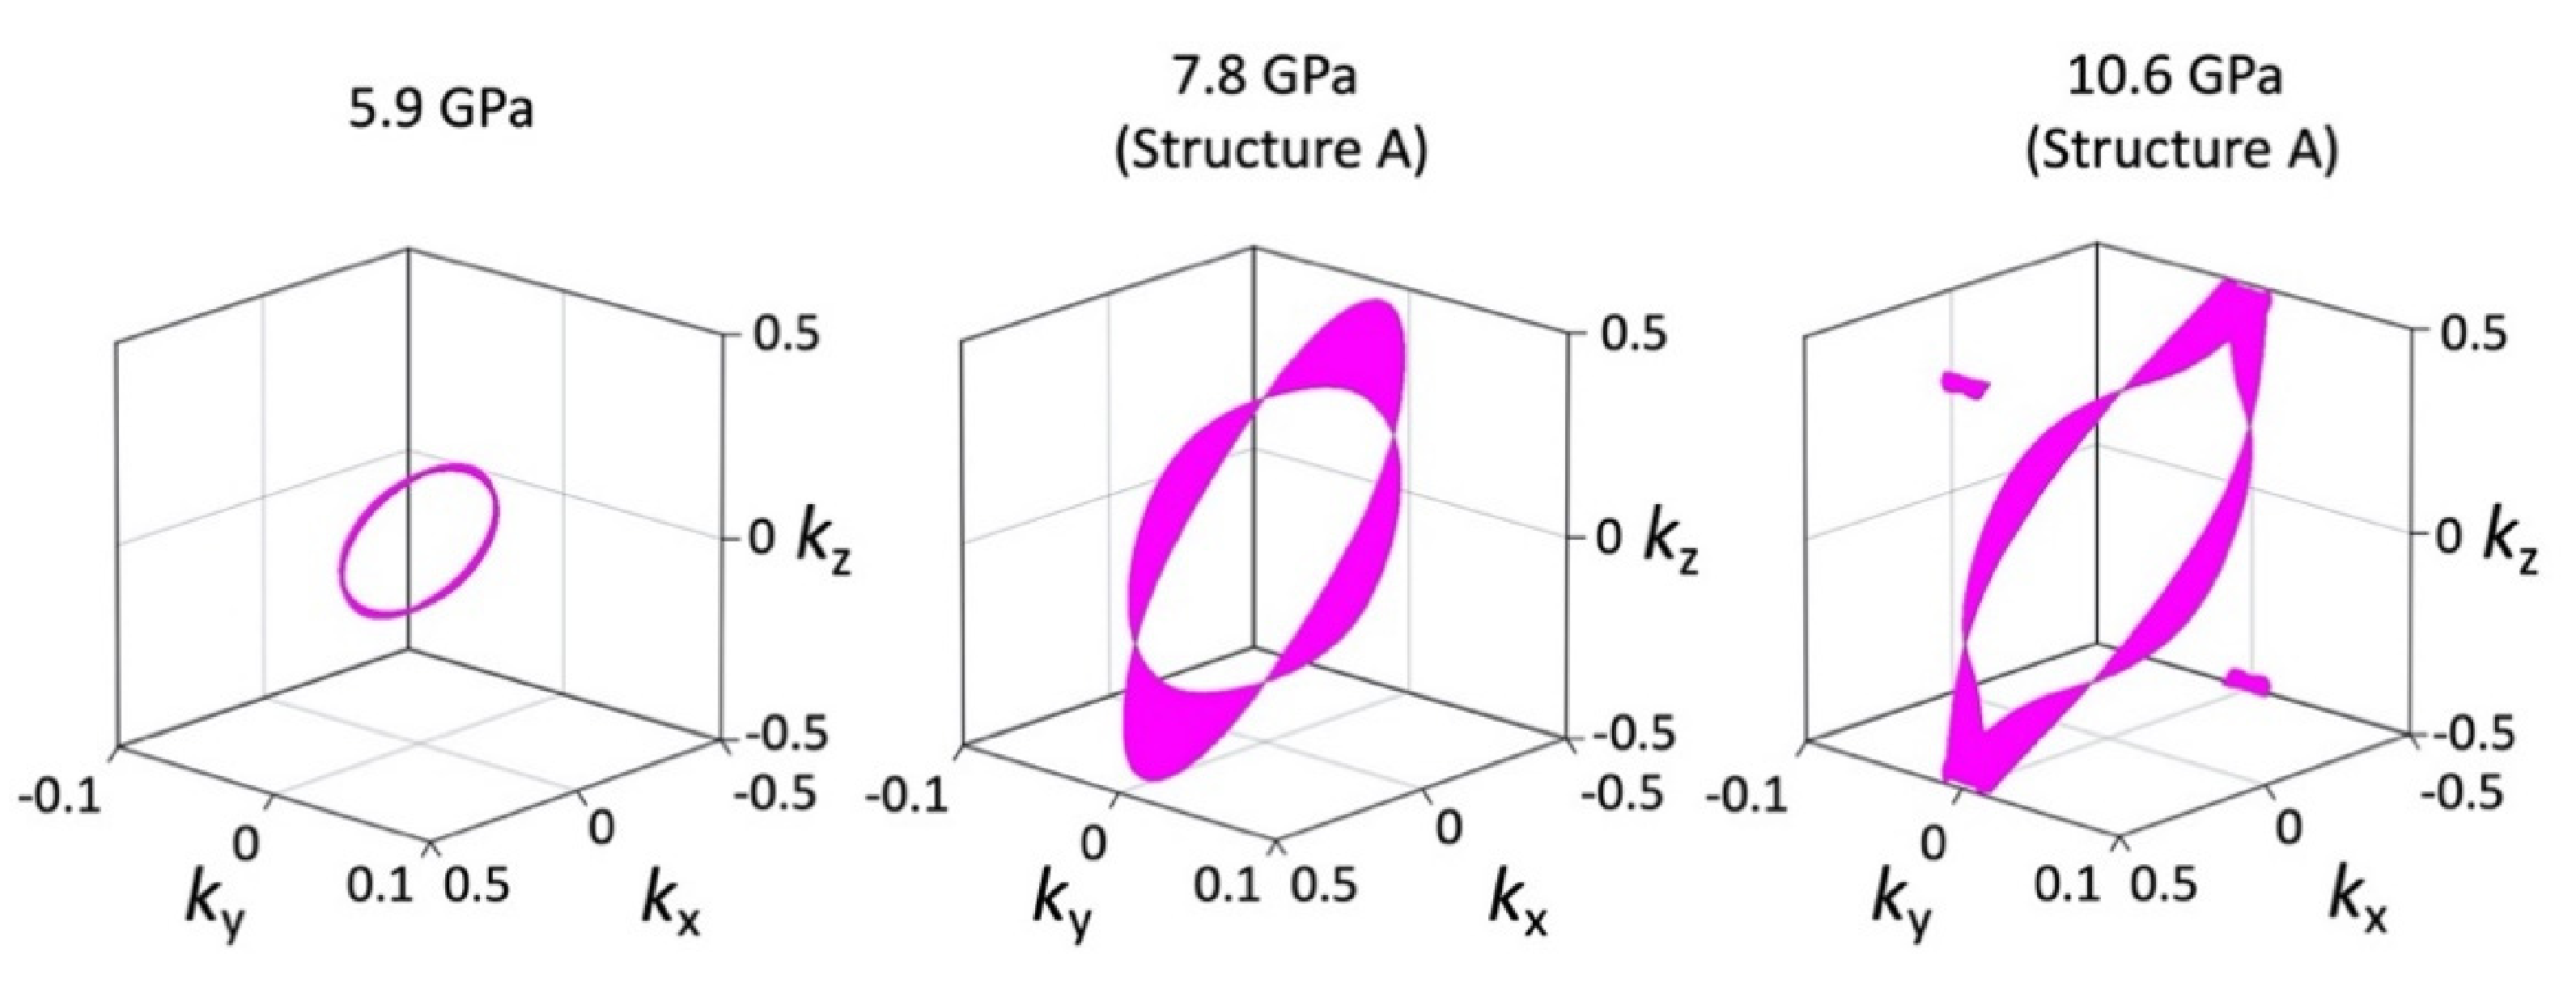
2], no MR measurements have been reported to date. Theoretical calculations have shown that it is a nodal line semimetal, in which the Dirac points form a loop in three-dimensional reciprocal space [17,18], which may give rise to further interesting MR behavior.
To better understand the high-pressure behavior of [Pd(dddt)2], we report a series of new measurements and calculations that verify previous theoretical calculations and provide insight into the Dirac electron state. In particular, we report more detailed high-pressure resistivity measurements, the first experimental structure determinations performed at high pressure using single-crystal synchrotron X-ray diffraction, tight binding calculations performed using these data, and the first high-pressure MR measurements performed on single crystals of [Pd(dddt)2]. We find that the new experimental crystal structures verify previous theoretical reports of the Dirac electron state and suggest that changes in resistivity may be affected by structural disorder. Tight binding calculations indicate that the Dirac electron state coexists with semiconducting behavior, also owing to the disorder. The new MR measurements are also indicative of exotic quantum transport behavior: negative MR is observed at low temperatures and the curvature of the field-dependent MR is heavily dependent on crystal orientation.

2. Materials and Methods

2.1. High-Pressure Electrical Resistivity

Four-probe high-pressure resistivity measurements were performed by using the same procedure as previously performed for [Ni(ptdt)2] [5]. A culet size of 0.56 mm DAC and Inconel 625 was used as the metal gasket. Four contacts were made from 5 μm gold wires and gold paint, and Daphne Oil 7373 was used as the pressure medium. The sample was encapsulated with a mixture of Araldite AR-S30 (Huntsman) and alumina powder (see Figure 2a). A small Ruby chip was attached to the center of the protective layer and pressure was determined by measuring the shift of Ruby fluorescence R1 lines at room temperature. Samples 5 and 6 were measured using the cryocooler helium compressor system (Sumitomo Heavy Industries, Ltd.) for cooling the DAC with a cooling rate of 1.5 K/min. Samples 7 and 8 were measured using a Quantum Design physical property measurement system (PPMS) with a cooling rate of 0.5 K/min.

2.2. High-Pressure Single Crystal Structure Determination

The high-pressure single-crystal structure measurements were performed at beamline I19-2, Diamond Light Source synchrotron, UK using 0.4859 Å radiation. A single crystal of [Pd(dddt)2] was coated in a thin layer of Araldite and placed in a DAC with culet size 0.6 mm and tungsten gasket and 4:1 methanol:ethanol was used as the pressure medium. The pressure was determined by the shift of Ruby fluorescence R1 lines at room temperature, before and after each measurement. Data were processed via in-house semi-automated routines using aimless [19], ccp4 [20], dials [21], pointless [22], and xia2 [23], and solved and refined using SHELX [24] within Olex2 [25].
The ambient pressure structure refinement was performed using riding H atoms. Owing to low completeness of the high-pressure datasets, only Pd atoms were refined with anisotropic ADPs, which were restrained using the ISOR command in the 5.9 GPa and 10.6 GPa structures. Structural disorder on the S/CH2 moiety was modeled in two parts with refined occupancies, using two S positions. The C atom was modeled on the same position in both cases with sets of riding H atoms allowed to vary according to the respective S atom position. The S–C distance was restrained to 1.76(2) Å using the DFIX command, and the S atoms were constrained to have the same isotropic ADPs. In addition, terminal CH2–CH2 distances were restrained to 1.54(2) Å.

2.3. Tight-Binding Calculation

Calculations of molecular orbitals and intermolecular overlap integrals (S) between frontier molecular orbitals were carried out by the extended Hückel method. Reported sets of semi-empirical parameters for Slater-type atomic orbitals and valence shell ionization potentials for H [26], C [26], S [27], and Pd [28] were used for the calculations. Intermolecular transfer integrals, t (eV), were estimated using the equation t = − 10S. Since the unit cell contains four [Pd(dddt)2] molecules (molecules 1, 2, 3, 4: Figure 1), four HOMOs (H1, H2, H3, H4) and four LUMOs (L1, L2, L3, L4) are considered in the calculation. For later discussions on the electrical structure, we define a new cell as a = – (ao + co), b = –bo, c = co, where ao, bo, and co are the original lattice vectors [11]. In the new unit cell, the a-axis is parallel to Layers 1 and 2. The band energies E (k) are obtained as eigenvalues of an 8 × 8 Hermite matrix H (k), where a wavevector k = kxa* + kyb* + kzc* = (kx, ky, kz), and ka = 2πkx, kb = 2πky, and kc = 2πkz. Matrix elements hmn described in Appendix A1 correspond to the HOMO–HOMO couplings (m, n = 1–4), the LUMO–LUMO couplings (m, n = 5–8), and the HOMO–LUMO couplings (m = 1–4, n = 5–8 and m = 5–8, n = 1–4). Intermolecular transfer integrals between frontier molecular orbitals in hmn are shown in Table 1, Table 2, Table 3, Table 4 and Table 5. The intralayer transfer integrals are given by b1 and p (1,2) for Layer 1, and b2 and q(1,2) for Layer 2. The interlayer transfer integrals are represented by a (1,2) and c (1,2). These transfer integrals are indexed by H (between HOMOs), L (between LUMOs), and HL (between HOMO and LUMO). In the case of the disordered structure, we examined two extreme crystal structures in which one of the possible conformations for molecule 2(4) is fully occupied (Structures A and B).

2.4. Magnetoresistance Measurements

Magnetoresistance measurements were performed with a Quantum Design physical property measurement system (PPMS) in a magnetic field range of −8 to 8 T in the range of 2–100 K. As shown in Figure 3a,b, the orientation of the four-probe attachment on samples was such that the magnetic field was either perpendicular or parallel to the current direction. As for samples 7 and 8, magnetoresistance was measured after the measurement of the temperature dependence of resistivity down to 2 K.

3. Results

3.1. High-Pressure Electrical Properties

A series of new high-pressure electrical resistivity measurements was performed using a diamond anvil cell (DAC) (Figure 2a), in which the pressure was carefully controlled for closer inspection of the material’s behavior. The resistivity was measurable from 1.3 GPa, at which pressure the room temperature conductivity (σrt) was 2 × 10⁻⁵ S cm−1 (Figure 2b). The temperature dependence of the resistivity was measured from 2 GPa, at which pressure the activation energy (Ea) was 0.29 eV. The room temperature resistivity (ρrt) and Ea were found to initially decrease with increasing pressure then, at 13 GPa, a weak metal-like behavior was observed from room temperature to 230 K (see Figure 2c). At pressures higher than 13 GPa, ρrt and Ea were found to increase with increasing pressure, as observed previously [12]. Measurements performed on multiple samples (Figure 2b) and at multiple pressures (Figure 2c) show that the temperature dependence of the resistivity under various pressures is reproducible and consistent with previous results [11].

3.2. High-Pressure Single-Crystal Structure

To provide experimental structural information to explain the physical properties, high-pressure single-crystal X-ray diffraction measurements were performed. The single crystal of [Pd(dddt)2] used was from the same batch of crystals that had been synthesized for high-pressure electrical property measurements. Unlike previously reported high-pressure single-crystal structure measurements of the isostructural system [Ni(dddt)2] [29], crystals of [Pd(dddt)2] suffered from twinning even at pressures below 1 GPa. To avoid twinning of [Pd(dddt)2] crystals, the crystal was encapsulated with layer of Araldite epoxy resin, made thin to reduce background scattering. The improved hydrostatic conditioning effect of a mixture of alumina and araldite layers was demonstrated by previous DAC high-pressure resistivity measurements [5].
High-pressure diffraction data collection was performed at increasing pressures of 0.1 MPa (ambient pressure), 1.0 GPa, 4.0 GPa, 5.9 GPa, 7.8 GPa, 8.4 GPa, 10.6 GPa and 12.4 GPa (see Supplementary Materials). The monoclinic system and P21/n space group of the ambient pressure structure were maintained at all measured pressures. Figure 3a shows the pressure dependence of unit cell parameters. The unit cell lengths and volume were found to gradually decrease with increasing pressure: at 10.6 GPa, the a, b and c axes reduce to 0.9, 0.87 and 0.94 times their ambient pressure values, respectively. On the other hand, the β angle decreases from 111.631° at 0 GPa to 110.04° at 4 GPa, then increases again to 112.8° at 10.6 GPa. At this pressure, the change in unit cell volume is reduced to 73.6% of its ambient pressure value, reflecting the soft nature of the organic crystal. Interestingly, at 4.0 GPa, coupling between the mechanical responses of the different axes results in decreases in b and c, alongside an increase in a. Unlike in well-understood winerack, honeycomb, helical or polyhedral framework structures [30], there is not an obvious structural motif that is responsible for this complex behavior in [Pd(dddt)2]. However, it is not unusual for certain axes to expand upon compression (so-called negative linear compressibility) so long as the fundamental thermodynamic requirement for volume to decrease as pressure increases is obeyed, which is true in this case.
Crystal structures could be solved and refined at ambient pressure (0.1 MPa), 5.9 GPa, 7.8 GPa and 10.6 GPa. Unfortunately, degradation of crystal quality prevented structure refinement at 1.0 GPa, 4.0 GPa, 8.4 GPa and 12.4 GPa. At ambient pressure, there was no evidence of structural disorder. At 5.9 GPa, the crystal structure was also refined without disorder [31]. It should be mentioned that the data quality was not good enough to completely eliminate the existence of a disordered state. The crystal structure could be solved even with disorder, with similar refinement statistics to the ordered structure; however, when using anisotropic atomic displacement parameters (ADPs) for sulfur atoms, the disorder appears to be absent. We believe that better single-crystal structure measurements will be needed in the future to determine the structure with greater precision.
In all successful structure determinations at high pressure above 5.9 GPa, evidence was found in the residual electron density for disorder at one of the thin S atoms in molecule 2(4) within Layer 2 (Figure 1 or Figure 3b). Modeling this as 2-fold disorder resulted in a decrease in the residual factor R1 of approximately 1% for each dataset. In addition, the atomic displacement parameter for the neighboring CH2 unit was larger than average, indicating it may also be affected by the positional disorder. The cause of the disorder is likely to be increasing steric congestion at high pressure, which forces the molecules to adopt one of two conformations, giving rise to two distinct CH-S hydrogen bonds (Figure A1).
While the b-axis (i.e., the intermolecular Pd–Pd distance) decreases monotonously with increasing pressure, as shown in Figure 3a, changes in intramolecular distances are less smooth and vary depending on the molecule. At ambient pressure, all Pd–S distances are almost identical (2.26 Å). At 5.9 GPa the values decrease to within the range 2.21–2.24 Å, before diverging further at 7.8 GPa (2.21–2.26 Å) and 10.6 GPa (2.18–2.29 Å). In the latter case, Pd–S distances in Layer 2 are approximately 0.08 Å shorter that those found in Layer 1. This typifies the difference between the molecules that underlies their different contributions to the electronic structure at high pressure. C–C distances within the conjugated part of each molecule increase with increasing pressure, further suggesting subtle changes in electronic structure. At ambient pressure, they are 1.37 Å and 1.40 Å, increasing to 1.38/1.41 Å, 1.45/1.44 Å and 1.45/1.50 Å at 5.9 GPa, 7.8 GPa and 10.6 GPa, respectively.
The application of high pressure causes increasing distortion of the [Pd(dddt)2] molecules. Bond angles, such as S–Pd–S angles, vary between the molecules in question; however, owing to low precision in atomic positions, there is insufficient evidence to indicate whether or not the application of high pressure causes any significant changes. On the other hand, with the exception of half of the CH2 groups, the molecules are flat at ambient pressure but buckle significantly under pressure, owing to increasing steric congestion. This effect can be most clearly seen in the terminal CH2-CH2 groups, which bend out of the plane at 7.8 GPa (Figure 3b,c) and 10.6 GPa.
Structural disorder in Layer 2 (molecule 2(4)) also has a significant effect on the distance between adjacent molecules along the stacking direction. The structure, denoted as Structure A, in which all sulfur atoms, including the disordered atom (S8A), are almost coplanar, is descended from the low-pressure molecular structure. On the other hand, in the alternative structure, denoted as Structure B, the disordered sulfur atom (S8B) in the outer heteroring deviates significantly from the molecular plane (Figure 4). The occupancy of S8A and S8B (i.e., the probability of Structure A and Structure B existing in any part of the crystal) are 0.55 and 0.45 at 7.8 GPa, and 0.64 and 0.36 at 10.6 GPa, respectively. As shown in Table 6, this protruding sulfur atom provides a very short intermolecular S···S distance (d1) between molecules 2(4) in the stacking direction.

3.3. Band Structure

To understand the high-pressure electronic states, the experimentally determined crystal structures were examined using a tight-binding band model based on the extended Hückel molecular orbital method [32]. Focusing on the 5.9 GPa structure, we reported details of the theoretical model and mechanism of the Dirac cone formation separately [31]. The measured cell volume at 5.9 GPa (1152.8 Å3) is close to that obtained by the DFT calculation for the theoretically optimized 8 GPa structure (1147.5 Å) in the previous work [11]. The calculated transfer integrals for the 5.9 GPa structure (Table 1) provide considerable difference from the previous tight-binding model [31]. An important point is the existence of the direct interlayer HOMO–LUMO couplings between molecule 1(3) and molecule 2(4) (h16, h18, h36, h38 and their complex conjugate elements) that were neglected in the previous model. The present model, however, reproduces the essential features of the DFT band calculations well. Figure 5 shows the electronic band structure at 5.9 GPa connecting TRIMs (time reversal invariant momenta) where the Dirac cone emerges on the Y–G line. In single-component molecular conductors, the Dirac cone can be formed at a point where the HOMO and LUMO bands cross without the HOMO–LUMO couplings [33]. As for the present system, the Dirac cone originates from the HOMO band in Layer 1 and the LUMO band in Layer 2 (Figure 6). The HOMO band is convex upward and the LUMO is convex downward, which leads to the HOMO-LUMO band crossing. This is because the major transfer integrals, b1H in Layer 1 and b2L in Layer 2, have opposite signs. The interlayer HOMO-LUMO couplings remove the degeneracy at the intersection of the HOMO and LUMO bands and open an energy gap. In this system, however, there is a surface on which the HOMO-LUMO interaction is zero and gap formation cannot occur. When this nodal surface of the HOMO-LUMO couplings meets a crossing plane of the HOMO and LUMO bands, the Dirac cones emerge in the k-space. The present model, revealed by the new X-ray diffraction data, includes both direct and indirect interlayer HOMO-LUMO couplings, and both of them play an important role in the Dirac cone formation [31]. The indirect HOMO–LUMO couplings are obtained by a second-order perturbation using the intralayer HOMO–LUMO and interlayer LUMO–LUMO or HOMO–HOMO couplings [11].
A unique feature of this Dirac electron system is that the Dirac point describes a closed line (loop) within the first Brillouin zone (Figure 7). The Dirac point in the single-component molecular Dirac electron system is located near the Fermi level, because charge carriers are generated by electron transfer from the fully occupied HOMO band to the completely empty LUMO band. The energy at the Dirac point ED shows slight variations from the Fermi energy EF on the loop, which gives hole and electron pockets (Figure 8). This means that the system is a nodal line semimetal. The deviation δE = EDEF is very small (|δE| < 0.4 meV) at 5.9 GPa.
In discussing the electronic structure at higher pressures (7.8 GPa and 10.6 GPa) with the disordered crystal structure, we start with Structure A, because Structure A relates more closely with the low-pressure structures including the 5.9 GPa structure. Indeed, the electronic band structures of Structure A at 7.8 and 10.6 GPa indicate that the system remains a nodal line semimetal (Figure 6, Figure 7, Figure 9 and Figure 10). One effect of the higher pressure is enlargement of the nodal loop. This can be explained by an enhancement of the LUMO–LUMO coupling b2L (Table 2 and Table 4), which gives wider LUMO bands and expanded contact of the HOMO and LUMO bands. Another effect of the increased pressure is an enhancement of the deviation from the Fermi level, which lies within the range −6.7 meV < δE < 8.7 meV at 7.8 GPa and −3.6 meV < δE < 5.2 meV at 10.6 GPa. This results in enlarged hole and electron pockets (Figure 8). In addition, it should be noted that an inversion of the hole and electron pockets occurs at 7.8 and 10.6 GPa (Figure 7).
Structure B is only found at higher pressures. Table 3 and Table 5 indicate that the very short intermolecular S···S distance (d1) between molecules 2(4) in the stacking direction significantly affects intermolecular couplings b2 between frontier molecular orbitals (b2H, b2L, b2HL). In particular, the change of b2L reduces the bandwidth of the LUMO bands and varies the curvature of the LUMO bands, which provides a semiconducting band structure with no Dirac cone (Figure 9 and Figure 10). The drastic difference in the electronic state of structures A and B suggests that the system is not a simple Dirac electron system when disorder is present.

3.4. Magnetoresistance

Temperature-dependent anisotropic MR measurements under various pressures were performed on [Pd(dddt)2] crystals by measuring the electrical response in orientations parallel to and perpendicular to the crystallographic b-axis. Figure 11a schematically shows the crystal shape, axes, and orientation of the four-probe attachment on the samples, as determined by single-crystal X-ray diffraction face-indexing. The first measurement, in which the magnetic field was perpendicular to the direction of electrical current, was performed at 11.8 GPa (Sample 8). At this pressure, the resistivity is almost temperature independent (Figure 2) and the system may be expected to be closest to the Dirac electron state. However, only a small signature of conventional semiconductor MR (i.e., a parabolic response) was observed below 10K (see Figure A2).
When the pressure was reduced to 10.5 GPa, a small negative MR is observed in the low magnetic field region (B < 1 T) at all measured temperatures, and linear MR appears in the low temperature and the high magnetic field region (Figure 11b and Figure A3). The minimum value of the negative MR at 2 K was −0.86% and the maximum value was 9.14%. At higher temperatures, MR was reduced to less than 1%; however, negative MR at fields below 1 T and a linear relationship between the MR and magnetic field at higher fields was still observed up to 70 K. Interestingly, when the magnetic field and current directions were perpendicular, the MR effect increased at lower pressures. The second crystal (Sample 7) was mounted in the same orientation as shown in Figure 11a, i.e., with the magnetic field perpendicular to the direction of electrical current. Figure 11c shows temperature dependence of MR at 9.6 GPa. A relatively large MR was observed at 2 K: the maximum MR was 42.29% and the minimum negative MR was −2.41%.
The most interesting MR was observed when the magnetic field and current directions were parallel. Figure 11d shows a schematic of the crystal shape, axes and the orientation of the four-probe attachment on Sample 9, for which the temperature dependence of resistivity is shown in Figure A4. The σrt and Ea were 94 S cm−1and 38 meV at 8.7 GPa, and 219 S cm−1 and 19 meV at 9.3 GPa, respectively. At 9.3 GPa, a relatively large negative MR was observed below 1 T over a wide temperature range from 2 K to 50 K and, in the B >1 T region, the MR showed a linear relationship with magnetic field (see Figure 11e and Figure A5). At 2 K, the MR showed a maximum value of 6.56% and the negative MR decreased with increasing temperature up to 10 K, reaching −4.2%. At higher temperatures, both positive and negative MR decreased with increasing temperature, with no MR observed at 100 K. At 8.7 GPa, the linear relationship above 1 T and negative MR below 1 T was similar to that obtained at 9.3 GPa (Figure 11f). The maximum MR was 7.07% and minimum negative MR was −3.53%. Interestingly, at these two pressures, the MR at different temperatures was almost identical between 2 K and 20 K. At high temperatures, MR decreased and the negative to positive transition field remained constant.

4. Discussion

For isostructural single-component molecular conductors, the contribution of the central transition metal d-orbitals to the LUMO is often assumed to be similar. However, our experimental results show that the central metal substitution in [M(dddt)2] (M = Ni, Pd), directly effects the high-pressure properties and structure. In contrast to the high-pressure structure of the Ni analogue [29], the Pd-Pd distance in [Pd(dddt)2] decreases smoothly from 4.7281 Å at 1 bar to 4.117 Å at 10.6 GPa. Unlike [Ni(dddt)2], which does not exhibit a structural transition up to 11.2 GPa [
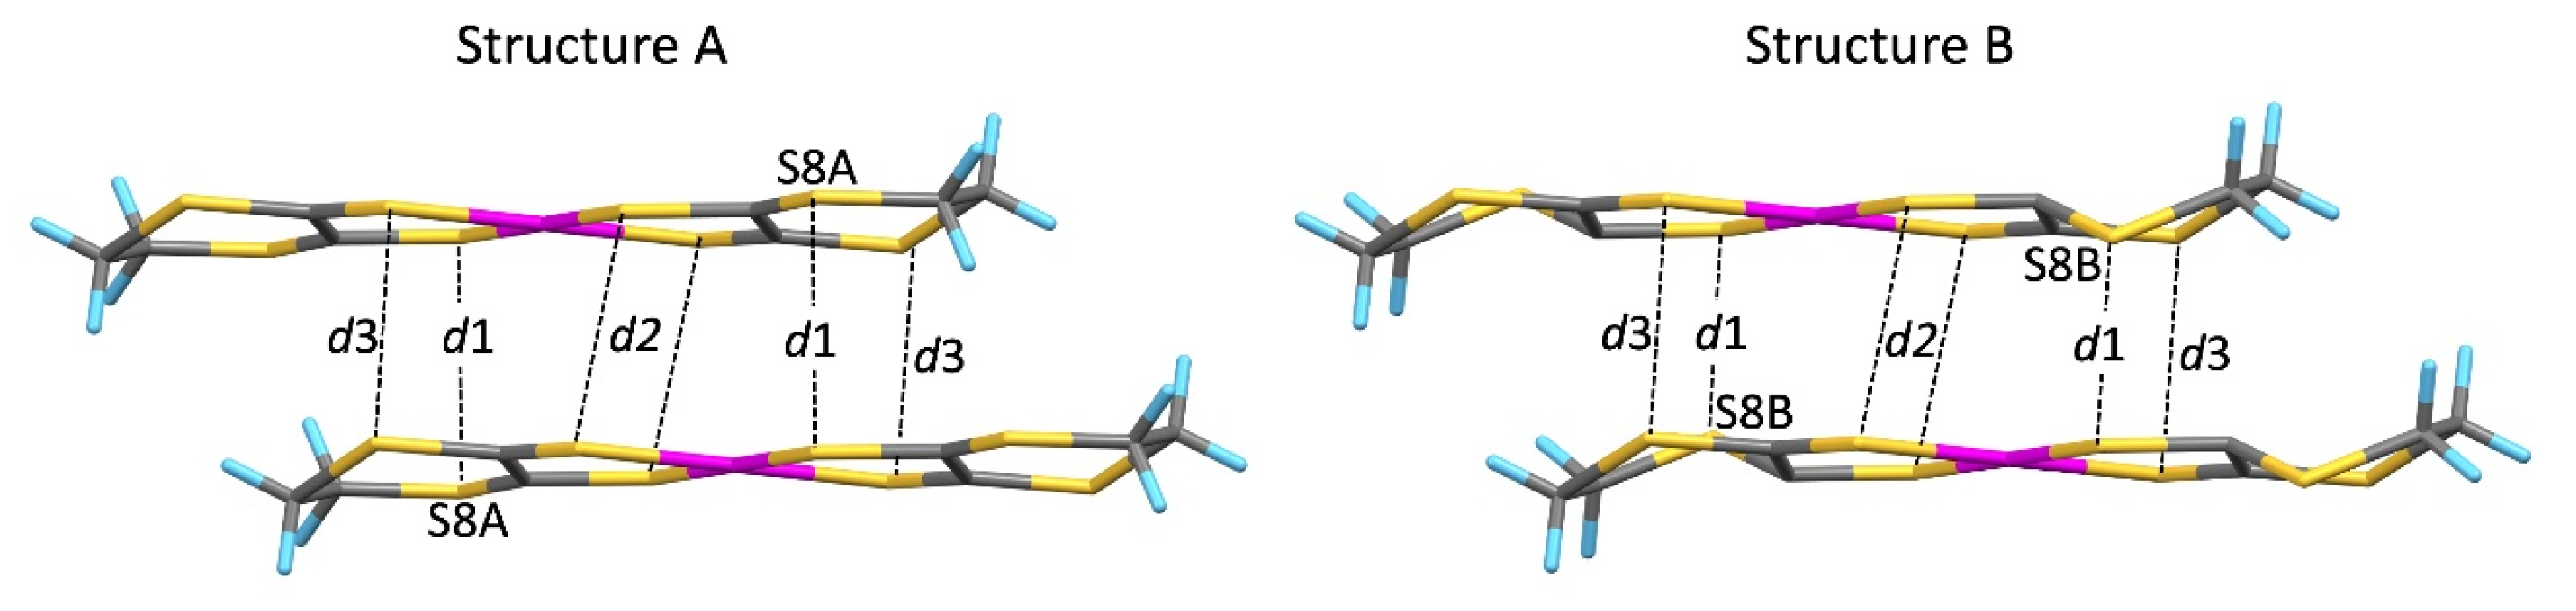
29], [Pd(dddt)2] undergoes an order–disorder transition, which may be the cause of the increase in resistivity and coexistence of the Dirac cone state with semiconductivity in the higher-pressure region.
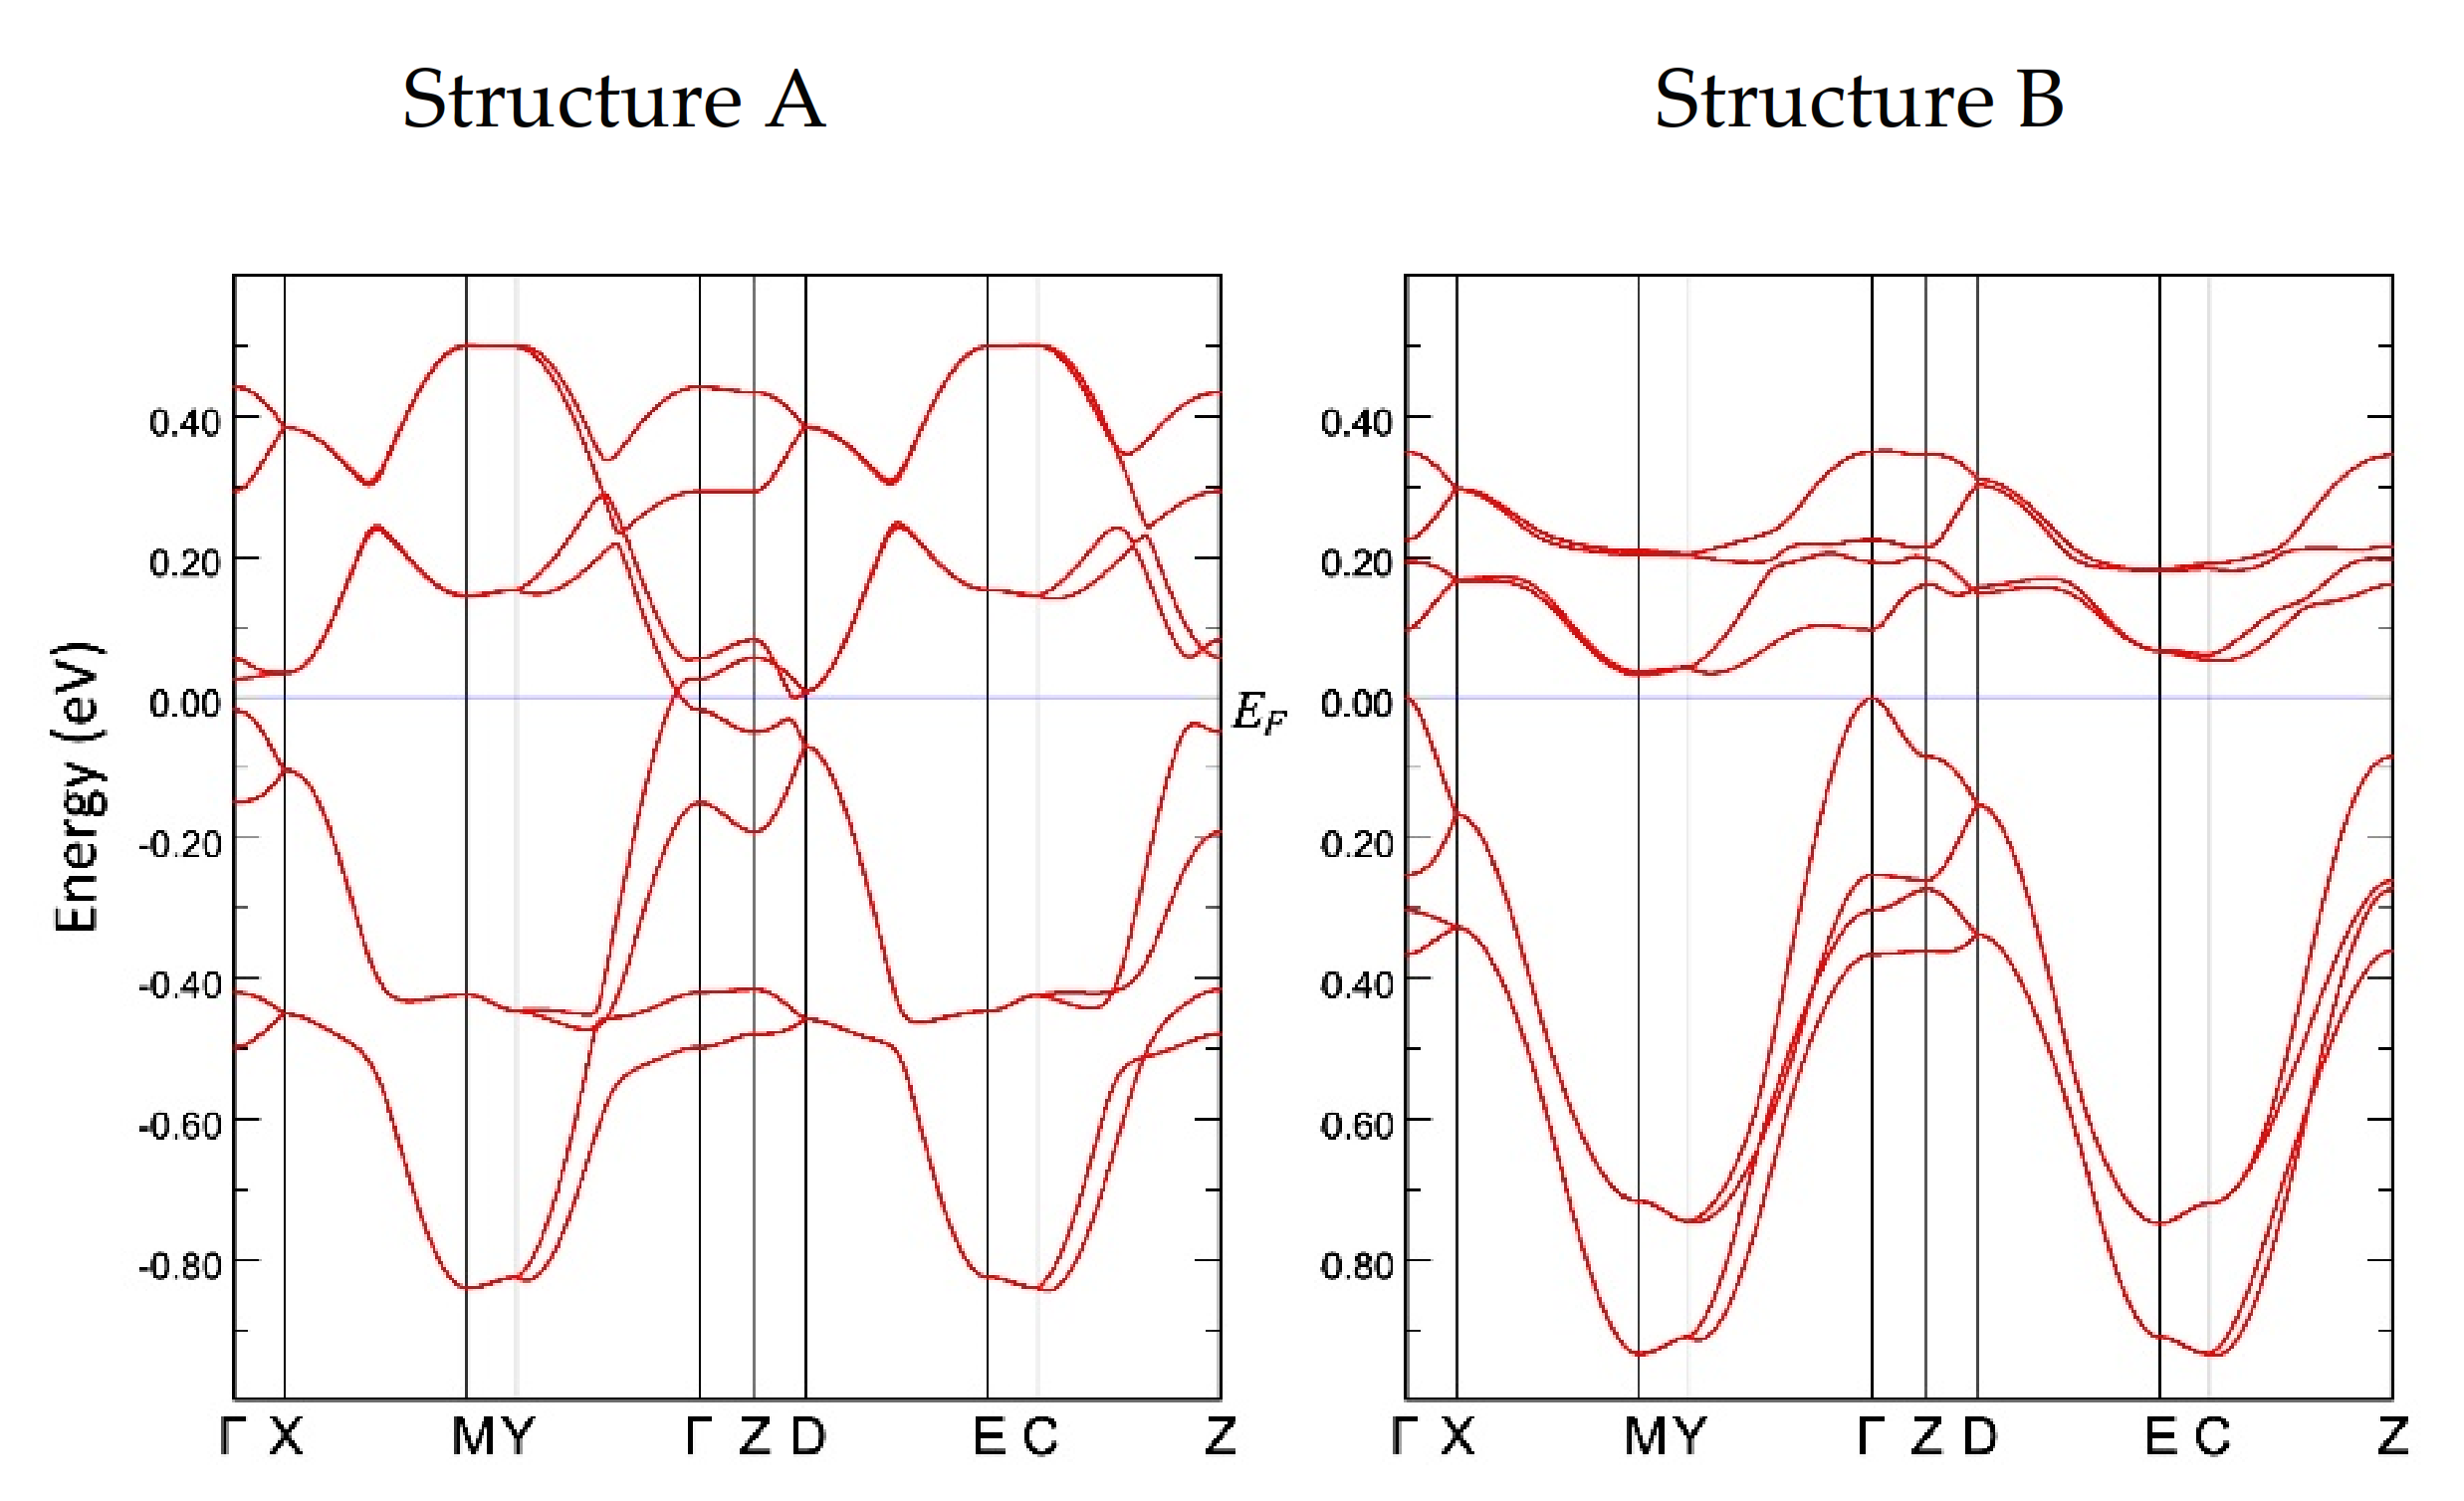
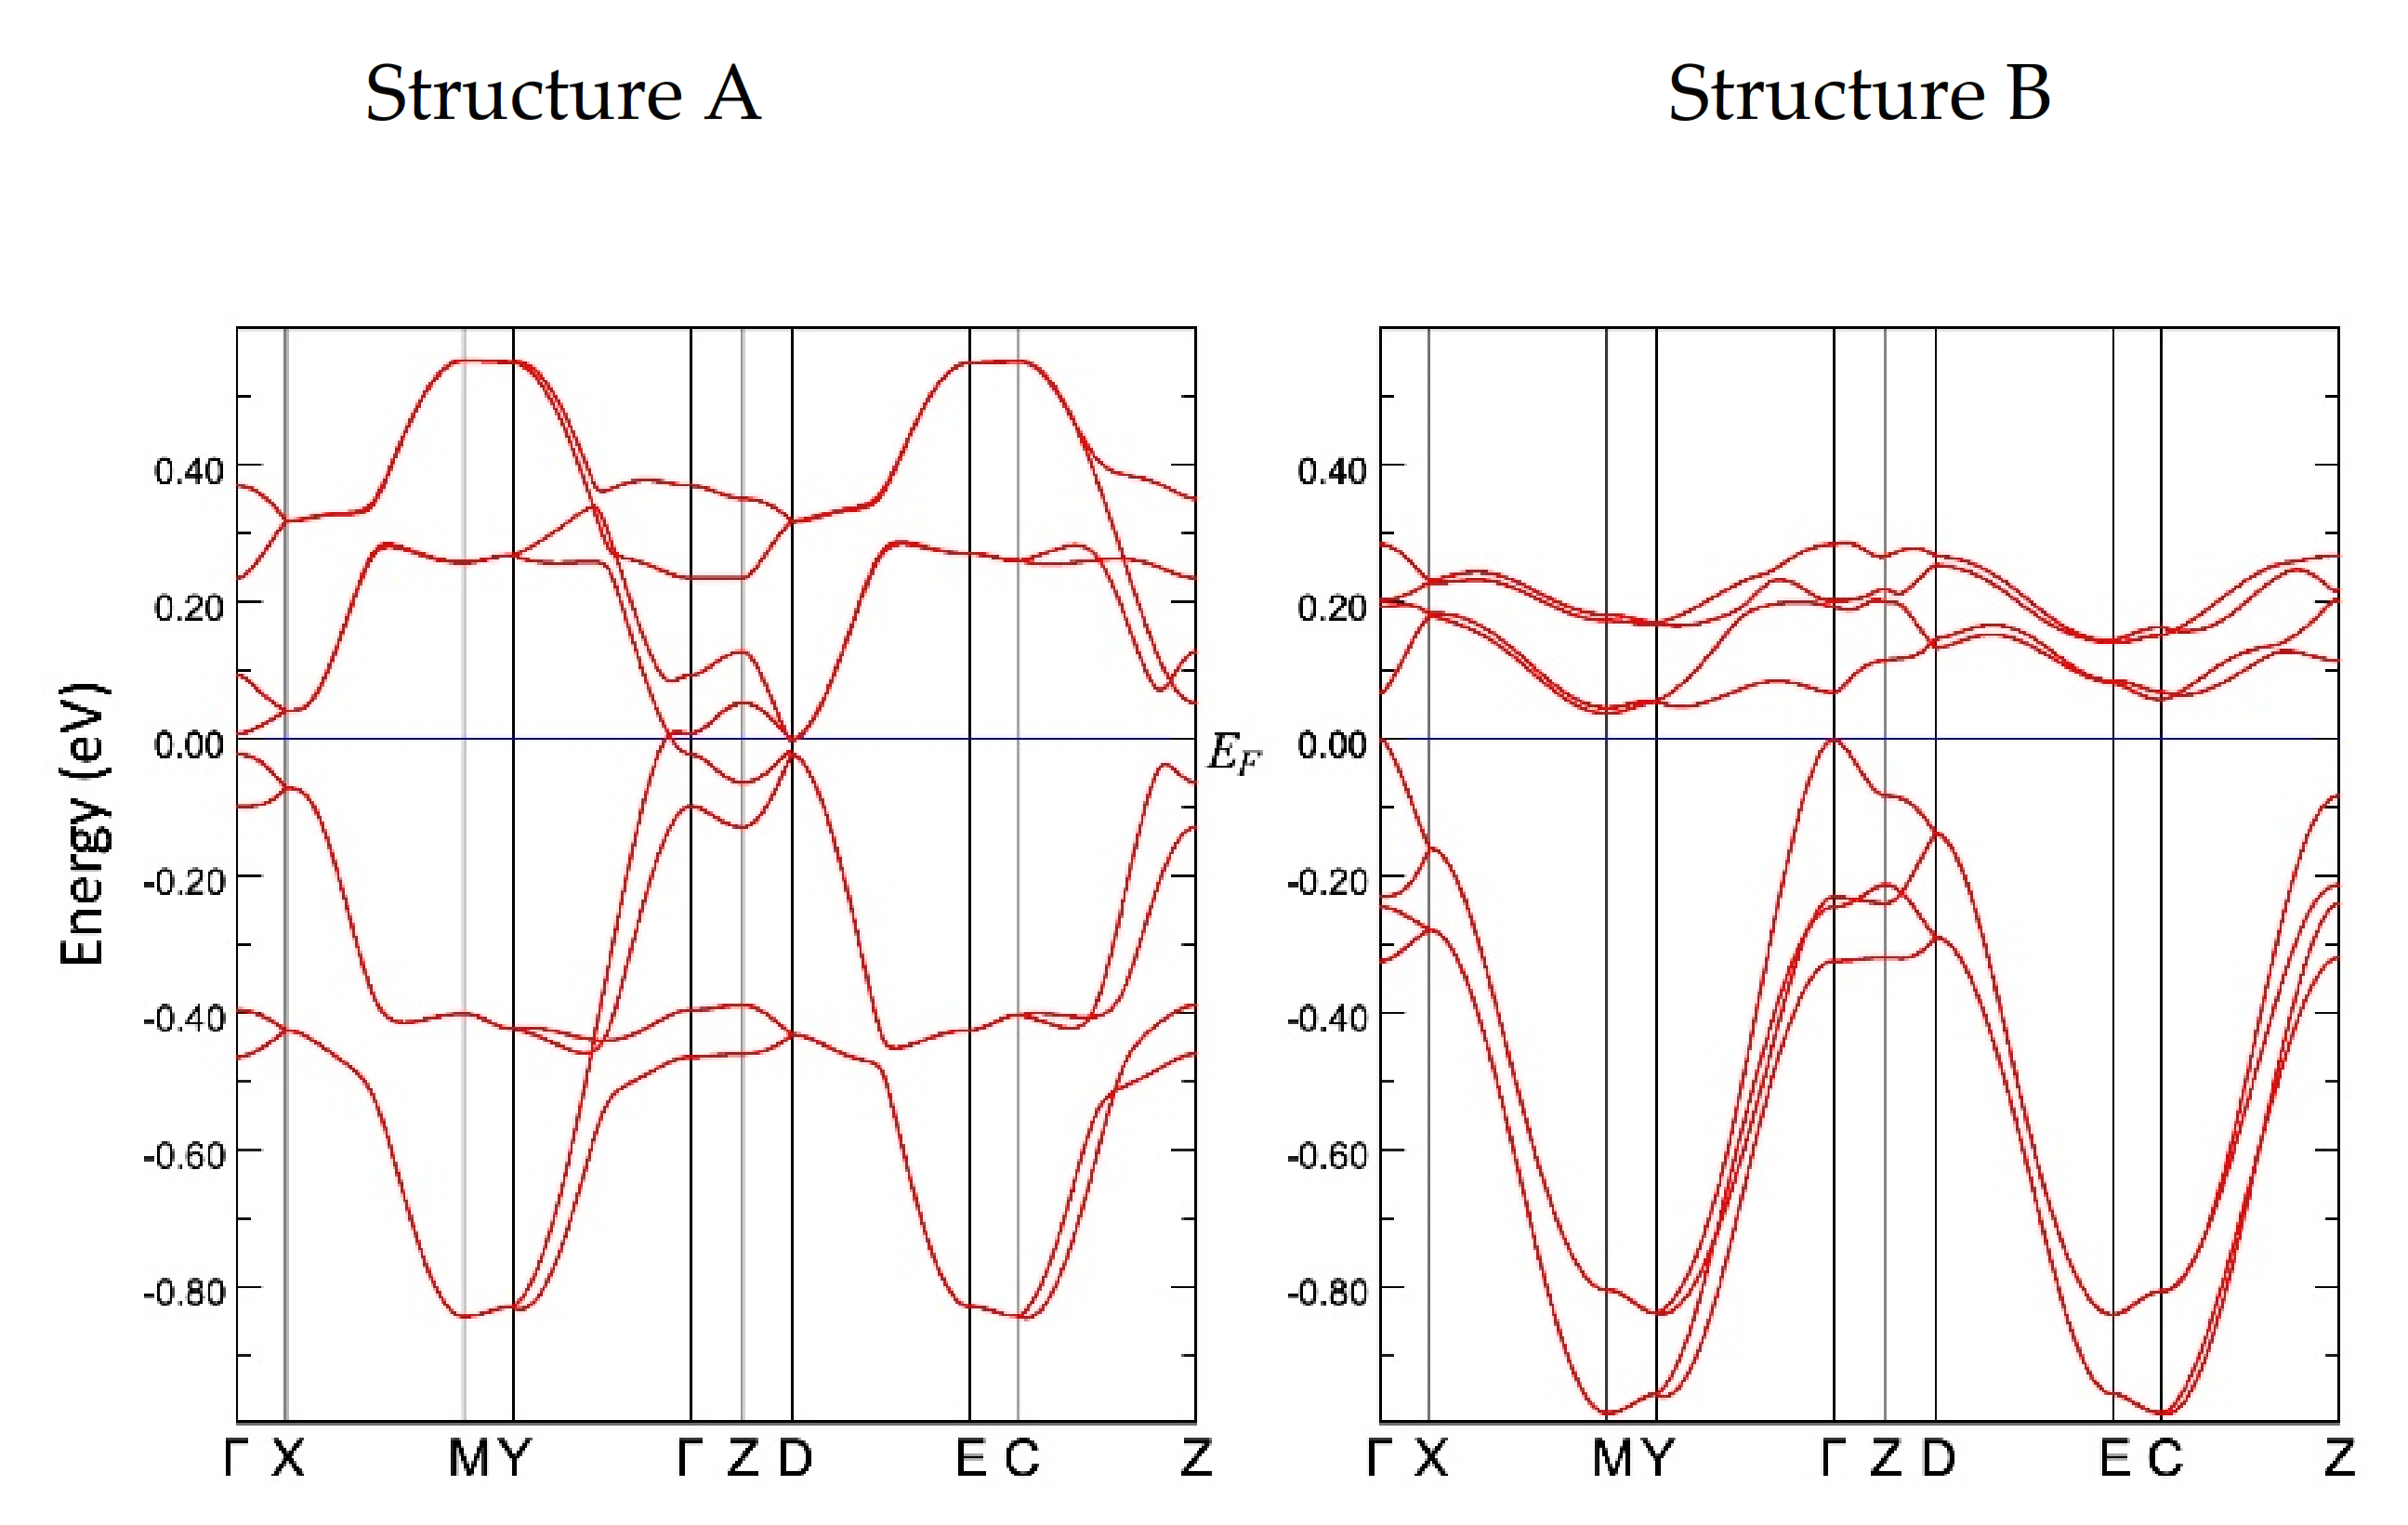
The tight-binding band structure calculations using the experimentally determined crystal structures show that the Dirac fermion state appears at least from 5.9 GPa. At 7.8 GPa and 10.6 GPa, the structural disorder causes coexistence of the Dirac cone state and a semiconducting state. This semiconductor gap state steadily appears in the resistivity data, manifesting as increasing resistivity.
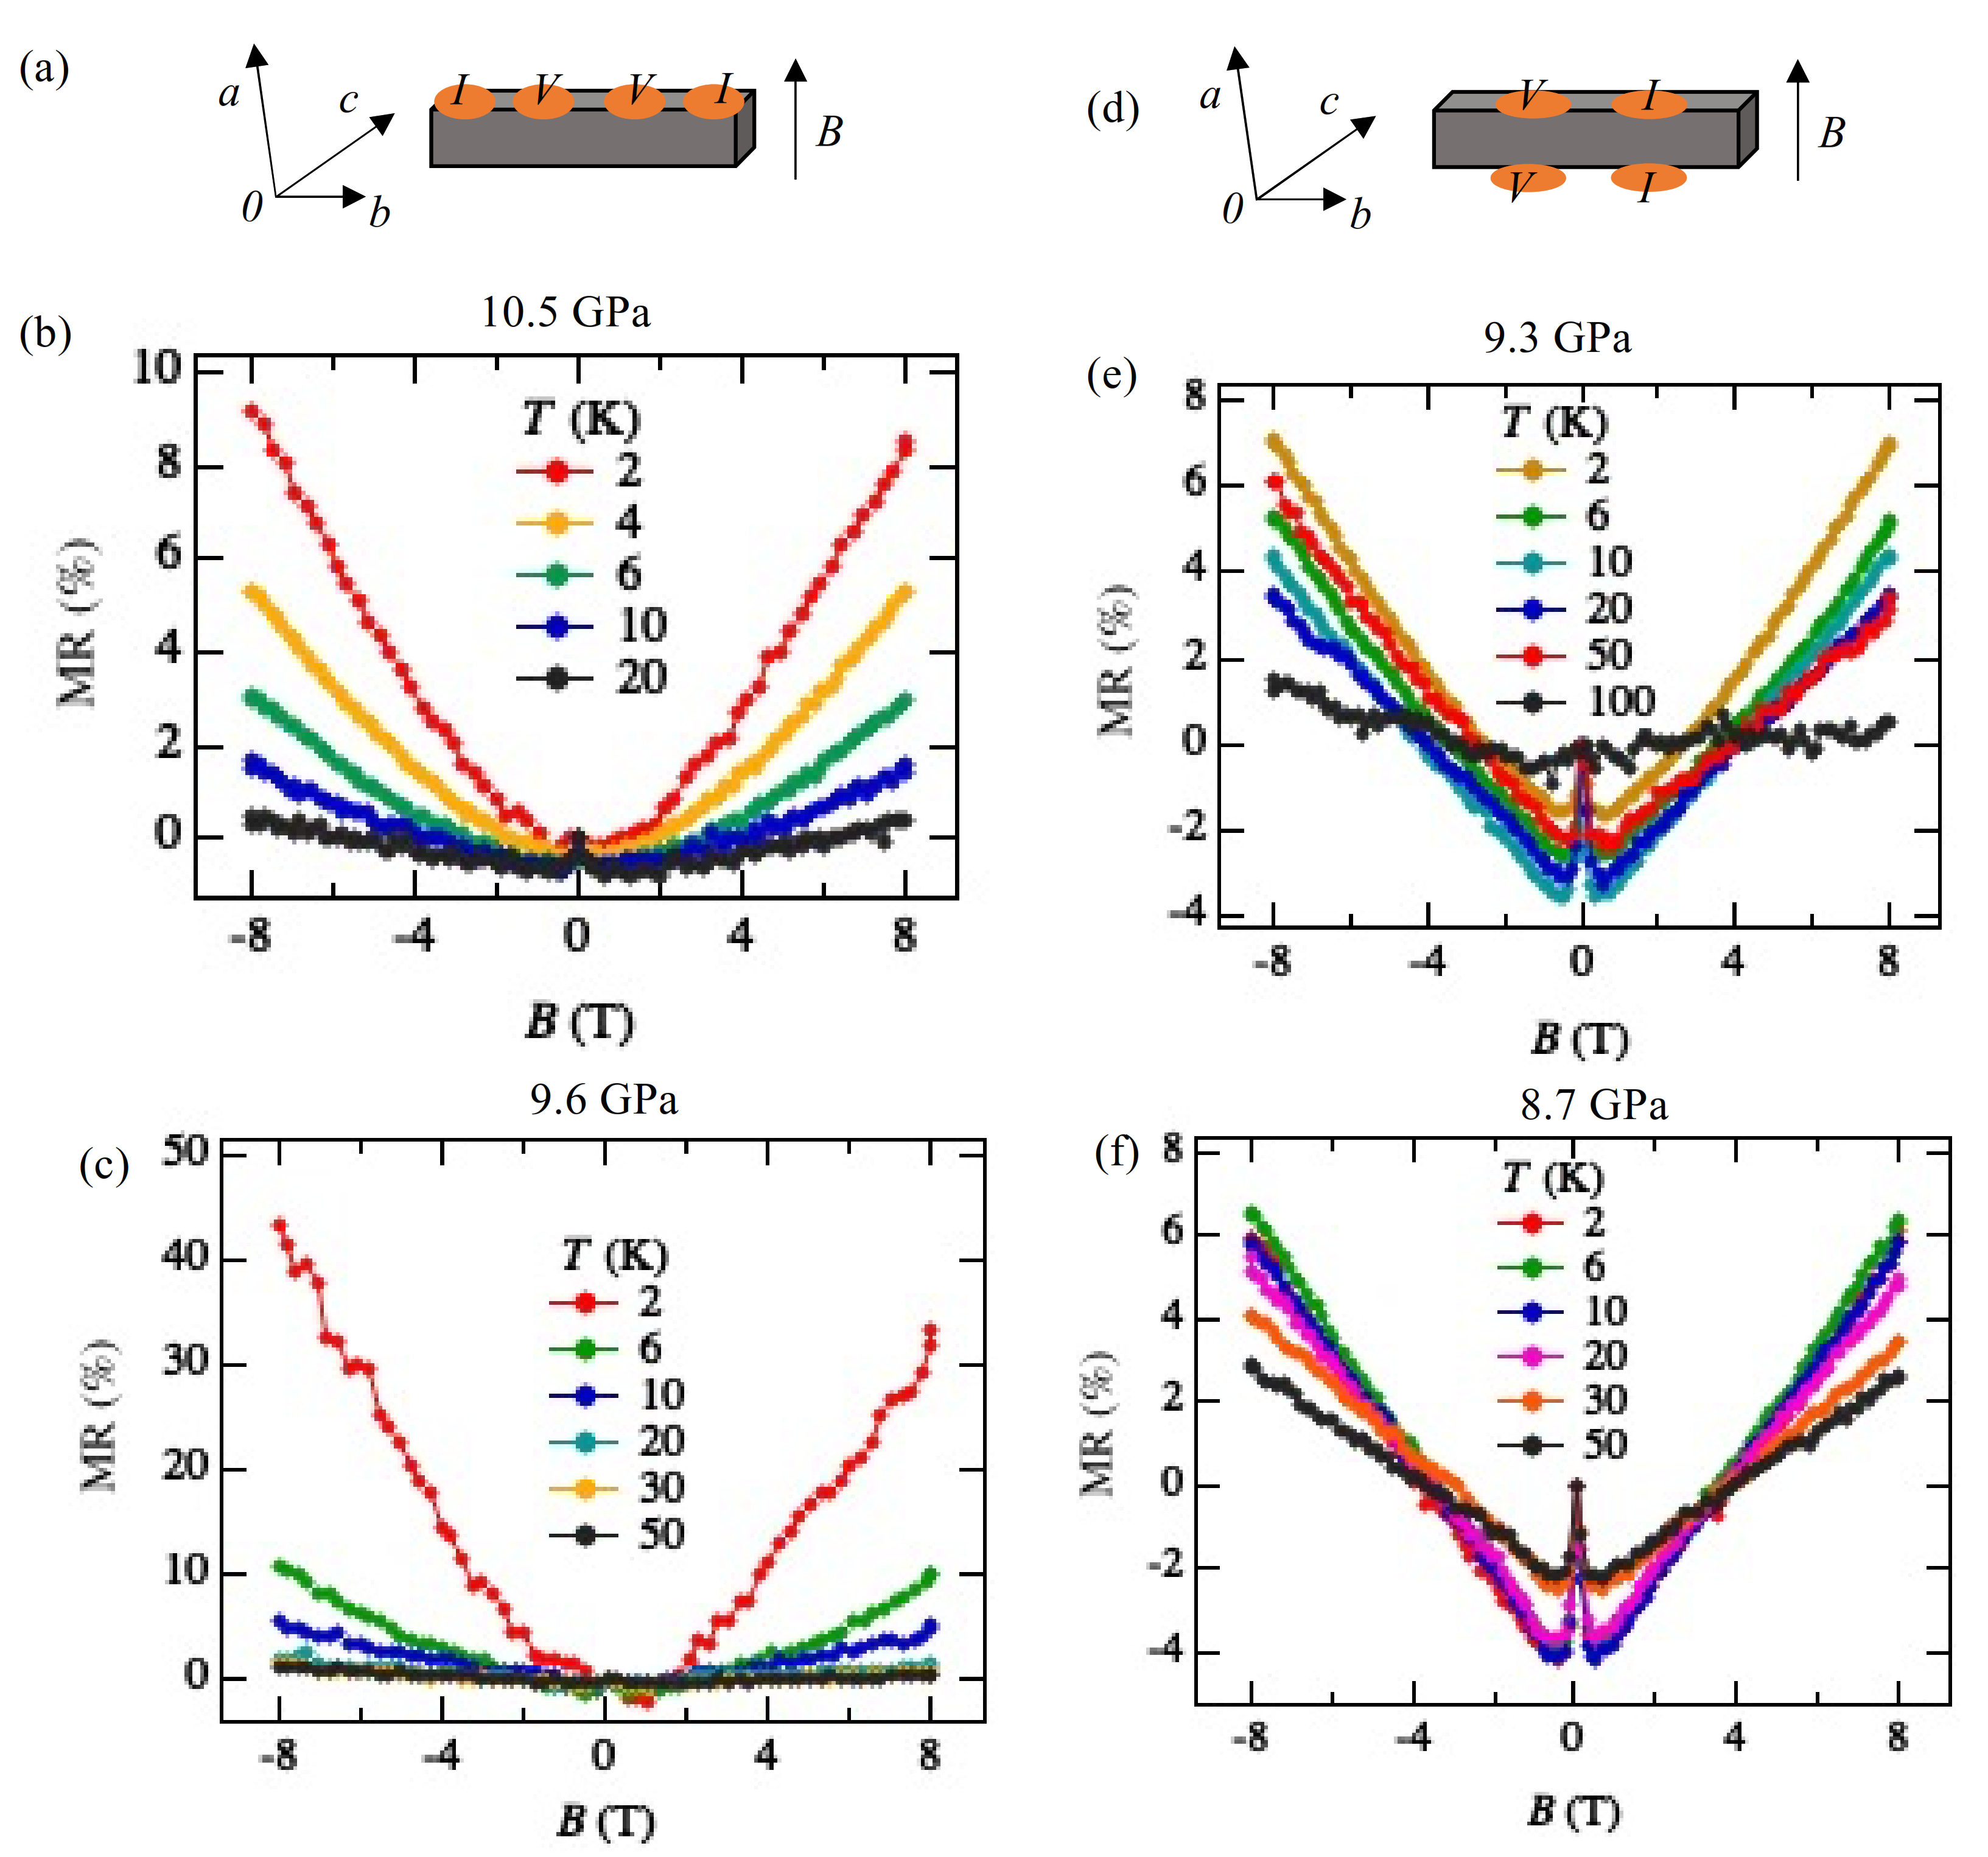
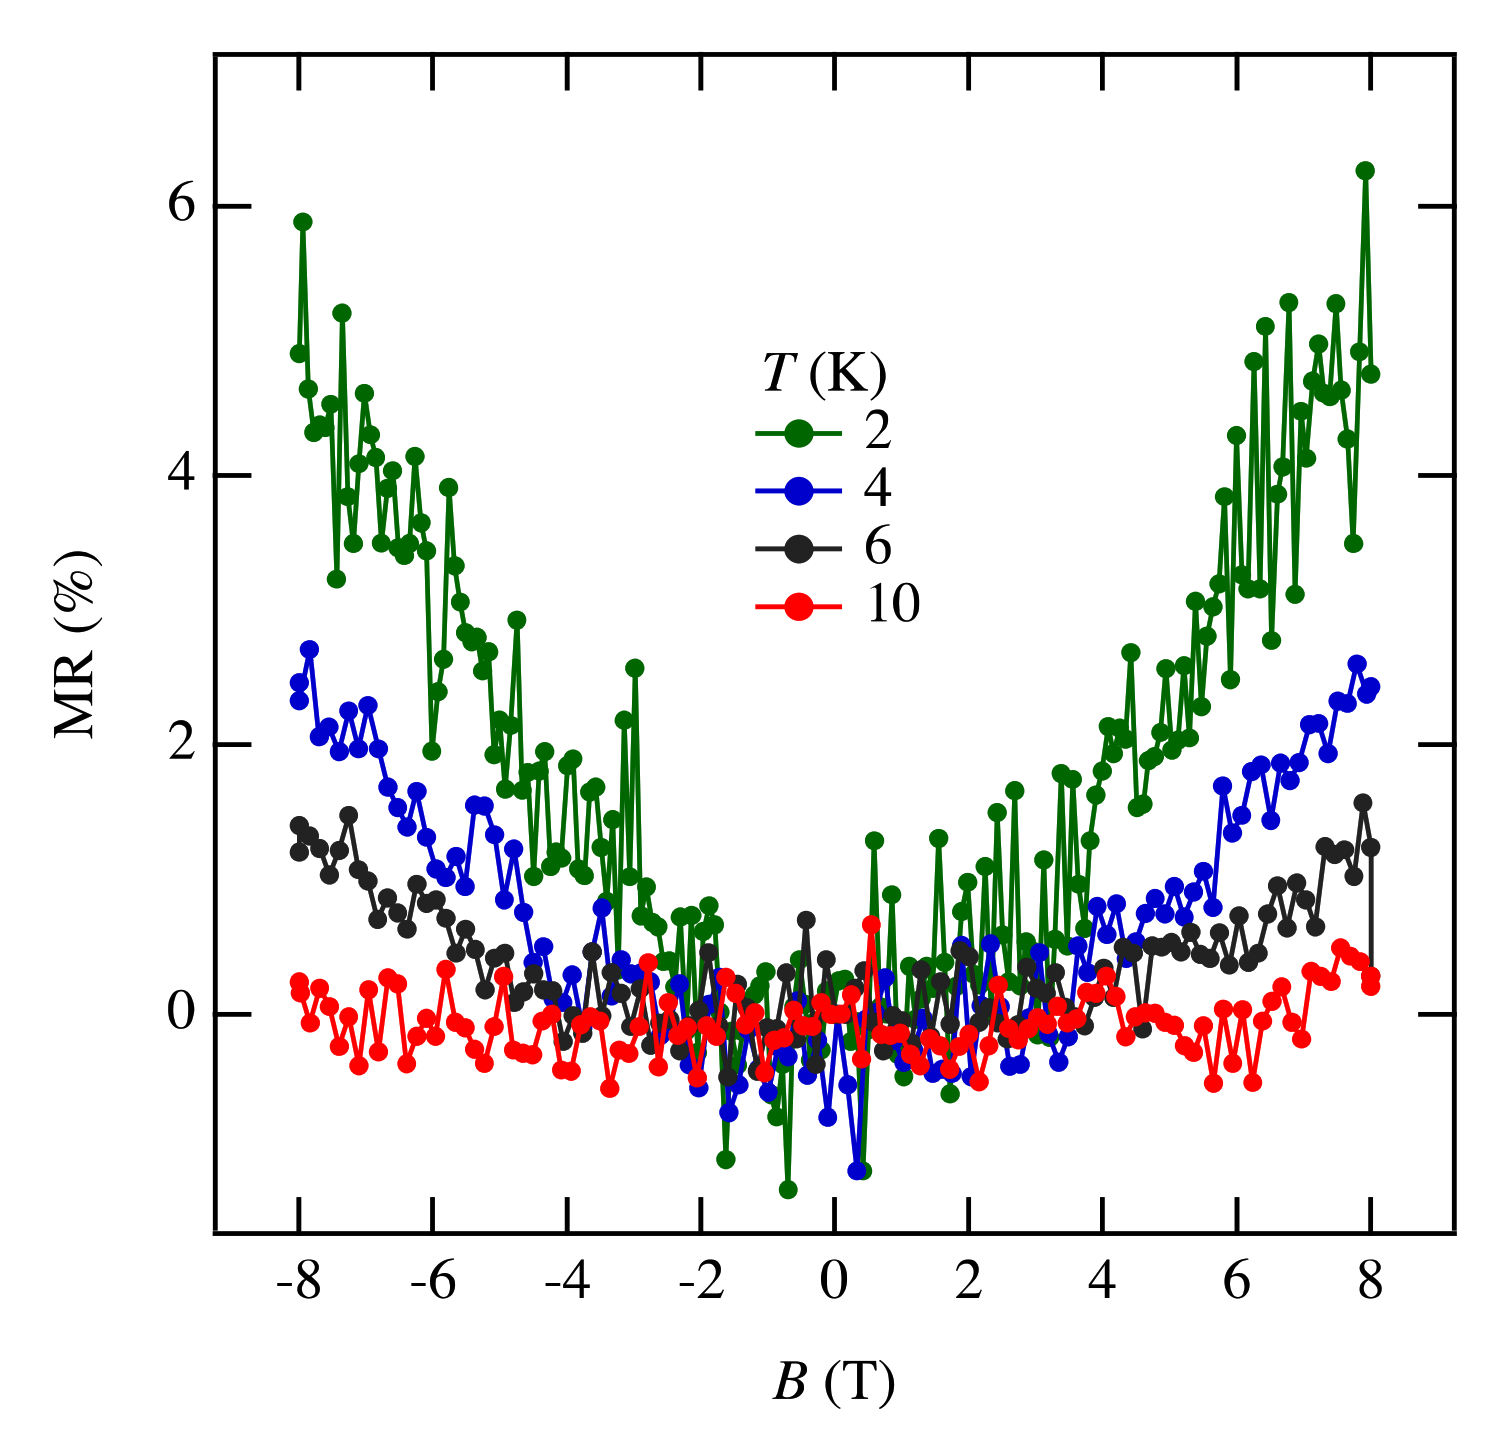
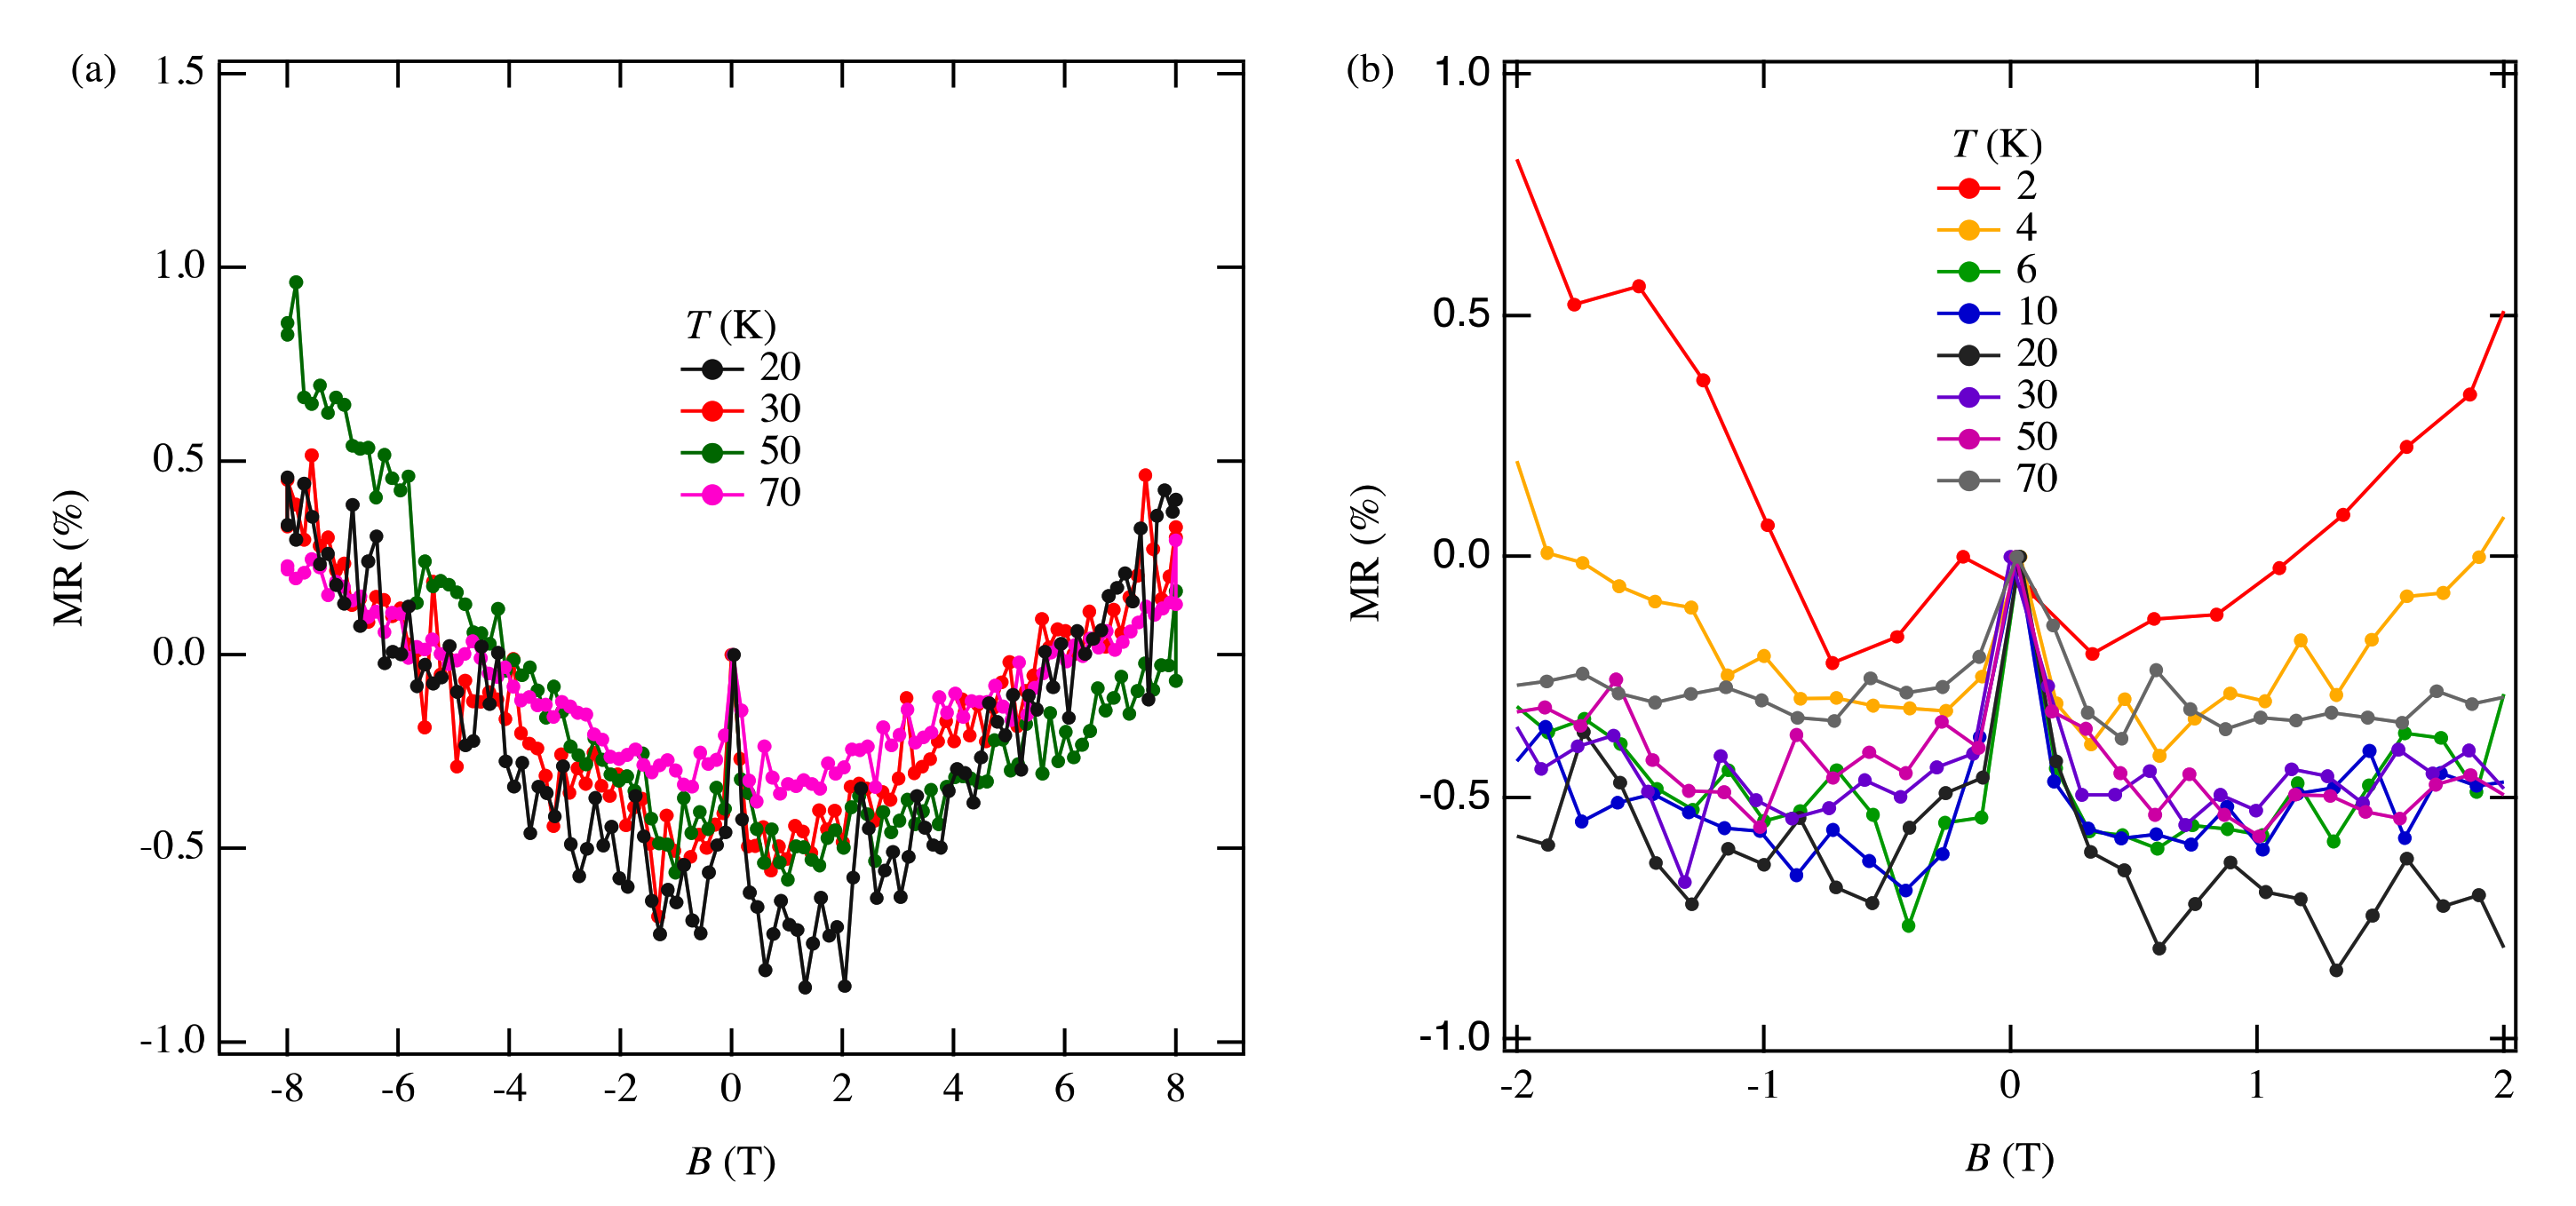
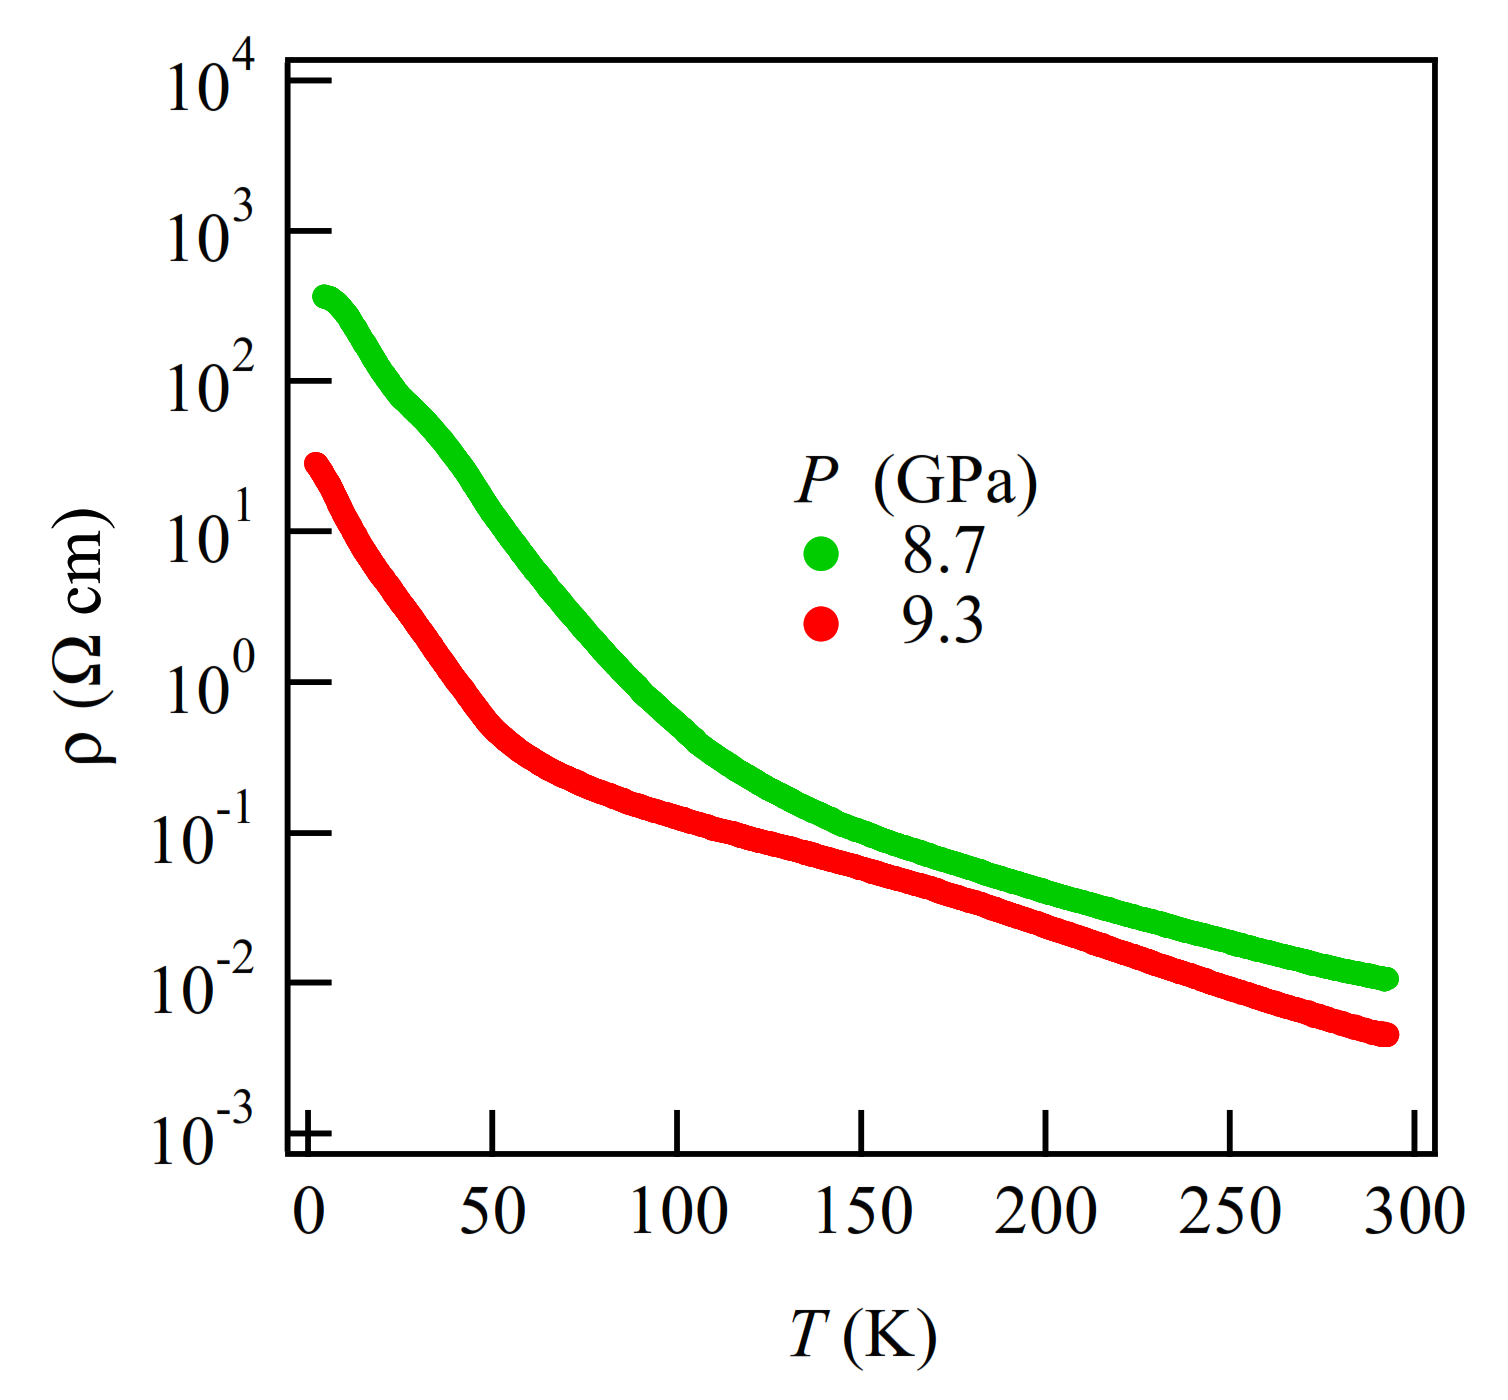
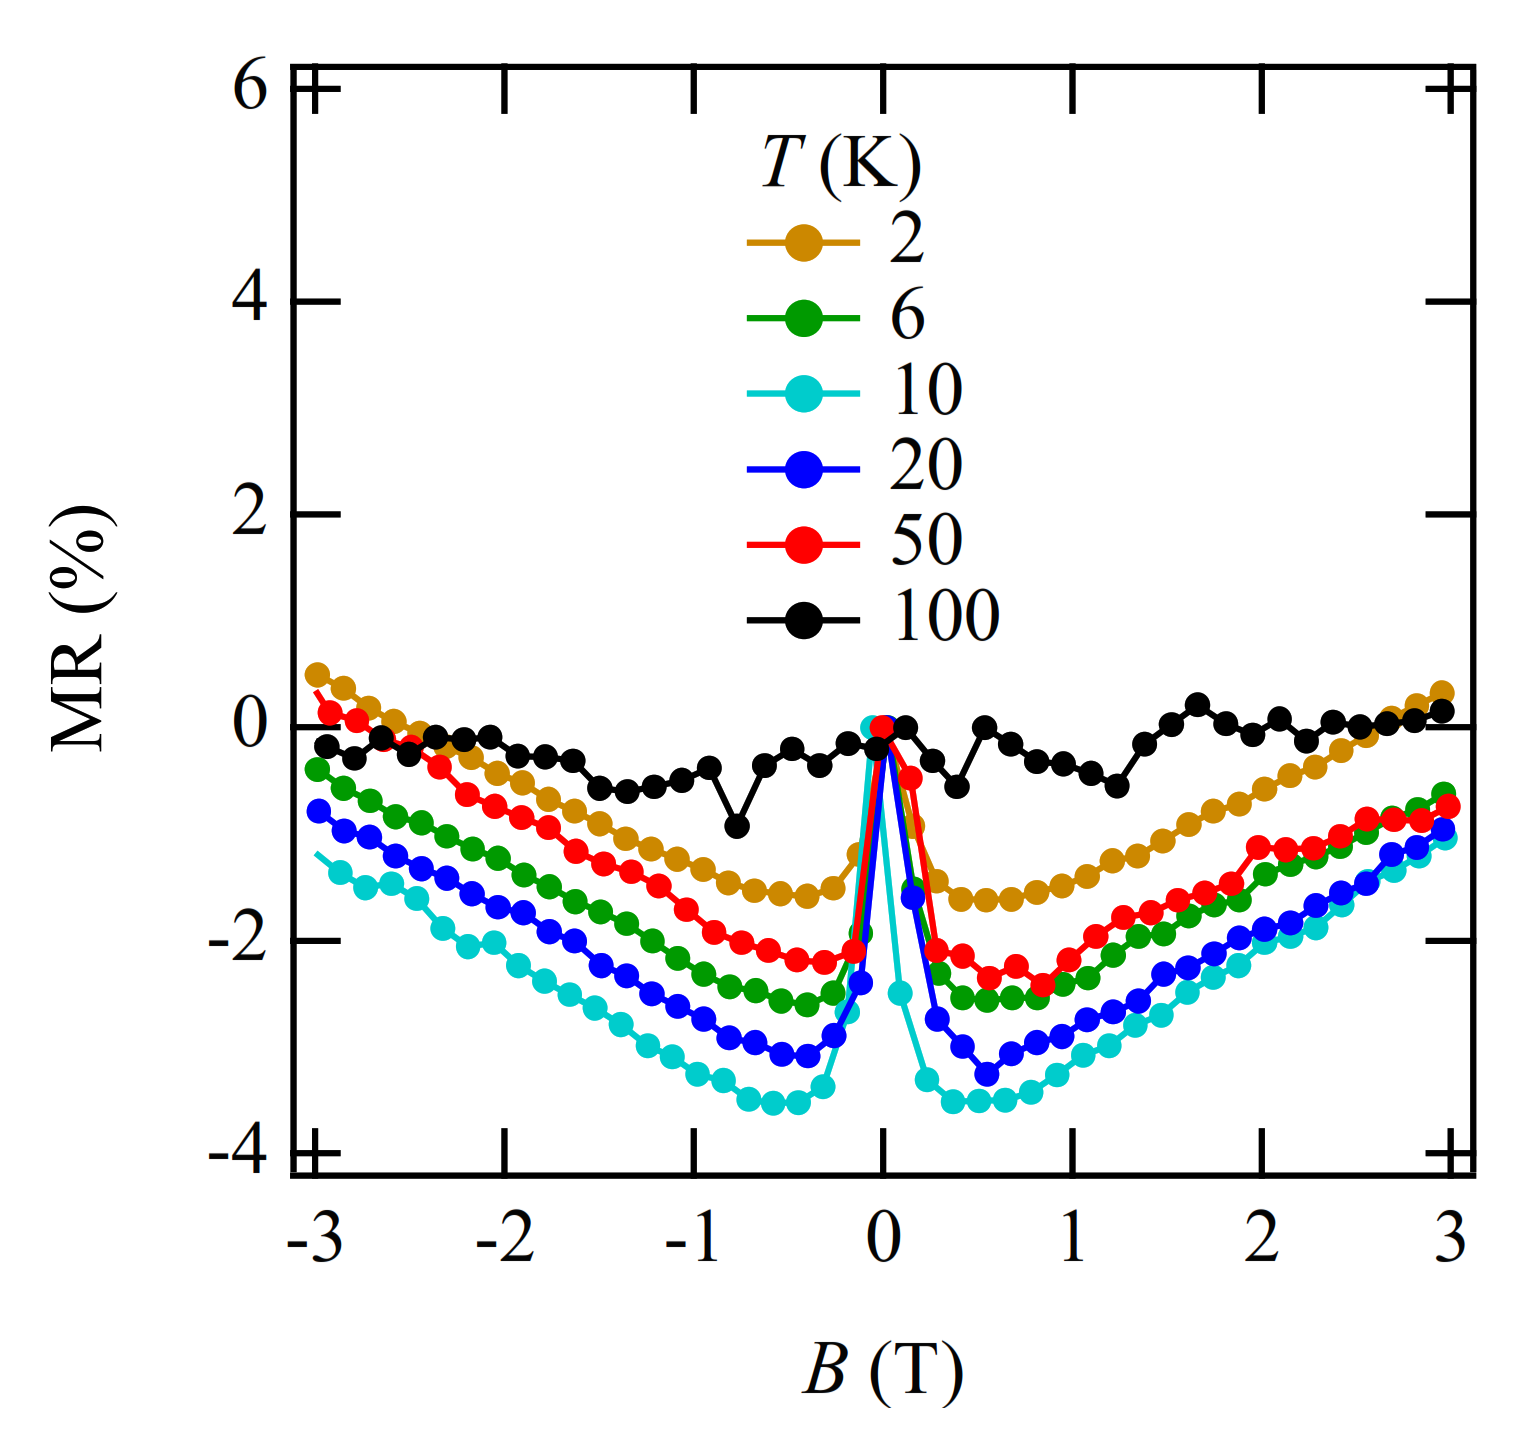
The MR measurements show a linear relationship over wide temperature and pressure ranges. If the MR linear relationship is correlated with the Dirac electron, our results indicate that Dirac cones emerged in the pressure range from 8.7 GPa to 10.5 GPa at least. This result is consistent with the theoretical calculations for resistivity under pressure that indicates a nodal line semimetal state from 7.7 GPa to 8 GPa [34]. In this calculation, a weak metal-like behavior was also observed near the room temperature, which is in good agreement with the measured resistivity at 13 GPa. Previous studies have suggested that the temperature-independent resistivity at 12.6 GPa may be associated with the Dirac electron state [11]. However, in the case of Sample 7 under the same sample mounting conditions as the previous measurement, no linear MR results were observed above 12.5 GPa. It is possible that the sample mounting direction was not good for MR measurements or the disordered structure may not show linear MR. To fully understand the Dirac electronic state of this material, it is necessary to measure the Hall effect by applying electric current and magnetic field in different crystal directions. The topological property of wave function given by the Berry phase [35] is important for understanding Dirac nodal lines; it is predicted that the Hall effect may be observed when the Berry phase component is oriented parallel to the magnetic field [34]. To clarify these issues, additional MR measurements and Hall effect measurements are ongoing.
Regarding the negative MR below 1 T, such behavior has been previously observed in weakly localized semiconductor CrVTiAl thin films [36] or multilayer graphene [37]. Interestingly, in the absence of the Dirac cone, the negative MR quickly disappeared above 10 K [36]. In the multilayer graphene measurement, the magnetic field was parallel to the current direction [37]. MR measurements of few-layer graphene with the magnetic field perpendicular to current direction showed that increasing the number of layers enhances the weak localization effect [38]. In both of those experiments the negative MR appears in magnetic fields below 1 T and persists up to 50 K. By comparing these results with ours, we suggest that the negative MR observed in [Pd(dddt)2] can be understood through the localization of the Dirac electron system.
Finally, we note that the critical pressure for observation of the Dirac electron state appears to be different depending on hydrostatic conditions in different pressure cells, pressure media and in silico pressurization methods. Our resistivity measurements show the smallest band gap at 13 GPa, while first principles DFT calculations showed that the Dirac cones appear at 8 GPa. However, the result of tight-binding calculations using the structure data from high-pressure crystal structure measurements indicates that Dirac cones appear at 5.9 GPa [31]. Several factors make the different methods challenging to compare directly. On one hand, solidification of pressure transmitting media, which occurs at different pressures depending on composition, can induce uniaxial effects in resistivity measurements. To mitigate this risk, the samples involved in both the structural and the electrical measurements were covered with a protective layer to improve the hydrostatic condition. On the other hand, the generalized gradient approximation (GGA) used in first principles calculations cannot describe long-range attractive van der Waals interactions (dispersion forces), which affects the estimation of lattice parameters in the lower pressure region. In addition, GGA calculations tend to underestimate electronic band gaps, which induces a difference between the calculated and experimental pressures [39].

5. Conclusions

By carefully controlling pressure and re-measuring the electrical properties under high pressure, we obtained a clearer understanding of the electrical behavior of [Pd(dddt)2] at low pressure and reproduced the temperature-independent resistivity and increase in resistivity under high pressure. Furthermore, we successfully found a high-pressure-induced order–disorder transition in [Pd(dddt)2] using synchrotron X-ray diffraction measurements. The unit cell lengths decrease as the pressure is increased, and crystal maintains monoclinic symmetry with the space group P21/n at all pressures up to 12.4 GPa. To understand the high-pressure electronic state, tight-binding band structure calculations were performed using the experimentally obtained structures at 7.8 GPa and 10.6 GPa. Because of disorder at these two pressures, we examined two extreme crystal structures in which a single conformation of the disordered molecule 2(4) is fully occupied (Structures A and B). In Structure A, Dirac cones emerge in k-space; however, in Structure B, the system exhibits a semiconducting band structure. Therefore, it is suggested that the transition from the Dirac electron system to the semiconductor at high pressure is triggered by the structure transition. In addition, we have observed a linear relationship in the variable-pressure variable-temperature MR data as a function of the magnetic field and negative MR owing to the weak localization of the Dirac fermion system.

Supplementary Materials

Crystallographic information files are available from the CCDC, reference numbers 2072169-2072173. These data can be obtained free of charge via http://www.ccdc.cam.ac.uk/conts/retrieving.html.

Author Contributions

Conceptualization, H.C., H.H.-M.Y. and R.K.; Data Collection, H.C., T.M., H.H.-M.Y., Y.K. and L.K.S.; Writing—Original Draft Preparation, H.C., H.H.-M.Y. and R.K.; Writing—Review & Editing, H.C., H.H.-M.Y., and R.K. All authors have read and agreed to the published version of the manuscript.

Funding

This research was funded by JSPS Grant-in-Aid for Scientific Research (S) grant number JP16H06346, JSPS Grant-in-Aid for Scientific Research (C) grant number JP17K05850.

Informed Consent Statement

Not applicable.

Data Availability Statement

“MDPI Research Data Policies” at https://0-www-mdpi-com.brum.beds.ac.uk/ethics (accessed on 11 May 2021).

Acknowledgments

Research leading to these results was supported by Diamond Light Source (beamtime MT20934-1). We thank Ben Williams, Richard Gildea and Graeme Winters for continuing improvements to the xia2 software.

Conflicts of Interest

The authors declare no conflict of interest. The funders had no role in the design of the study; in the collection, analyses, or interpretation of data; in the writing of the manuscript, or in the decision to publish the results.

Appendix A

Figure A1. Two distinct CH-S hydrogen bonds by the positional disorder.
Crystals 11 00534 g0a1
A1. Matrix elements of H(k)
h11 = b1H[eikb + eikb]
h12 = a1H[eik(a+c) + eikb] + a2H[1 + eik(a+b+c)]
h13 = pH[1 + eikb + eika + eik(a+b)]
h14 = c1H[1 + eikc] + c2H[eikb + eik(−bc)]
h15 = b1HL[eikb − eikb]
h16 = a1HL[eikb − eik(a+c)] + a2HL[1 − eik(a+b+c)]
h17 = p1HL + p2HLeikbp1HLeik(a+b)p2HLeika
h18 = c1HL[1 − eikc] + c2HL[eikb − eik(−bc)]
h22 = b2H[eikb + eikb]
h23 = c1H[1 + eikc] + c2H[eikb + eik(bc)]
h24 = qH[eik(−ac) + eik(−bc) + eik(−abc) + eikc]
h25 = a1HL[eik(−ac) − eikb] + a2HL[1 − eik(−abc)]
h26 = b2HL[eikb − eikb]
h27 = c1HL[eikc − 1] + c2HL[eikb − eik(bc)]
h28 = q1HLeik(−abc) + q2HLeik(−ac)q1HLeikcq2HLeik(−bc)
h33 = b1H[eikb + eikb]
h34 = a1H[1 + eik(−abc)] + a2H[eik(−ac) + eikb]
h35 = −p2HLp1HLeikb + p2HLeik(−ab) + p1HLeika
h36 = c1HL[1 − eikc] + c2HL[eikb − eik(−b+c)]
h37 = b1HL[−eikb + eikb]
h38 = a1HL[1 − eik(−abc)] + a2HL[eikb − eik(−ac)]
h44 = b2H[eikb + eikb]
h45 = c1HL[1 − eikc] + c2HL[eik(b+c) − eikb]
h46 = q1HLeik(a+c) + q2HLeik(a+b+c)q1HLeik(b+c)q2HLeikc
h47 = a1HL[1 − eik(a+b+c)] + a2HL[ek(a+c) − eikb]
h48 = b2HL[eikb − eikb]
h55 = ΔE + b1L[eikb + eikb]
h56 = a1L[eik(a+c) + eikb] + a2L[1 + eik(a+b+c)]
h57 = pL[1 + eikb + eika + eik(a+b)]
h58 = c1L[1 + eikc] + c2L[eikb + eik(−bc)]
h66 = ΔE + b2L[eikb + eikb]
h67 = −c1L[1 + eikc] − c2L[eikb + eik(bc)]
h68 = qL[eik(−ac) + eik(−bc) + eik(−abc) + eikc]
h77 = ΔE + b1L[eikb + eikb]
h78 = −a1L[1 + eik(−abc)] − a2L[eik(−ac) + eikb]
h88 = ΔE + b2L[eikb + eikb]
The energy difference between HOMO and LUMO ΔE is set to 0.696 eV to reproduce the energy band obtained by the DFT calculation.
Figure A2. Temperature dependence of MR as a function of magnetic field at 11.8 GPa (sample 8).
Crystals 11 00534 g0a2
Figure A3. (a) Temperature dependence of MR as a function of magnetic field at 10.5 GPa (sample 8). (b) Enlarged view of low magnetic field region of MR as a function of magnetic field and temperature at 10.5 GPa.
Crystals 11 00534 g0a3
Figure A4. Temperature dependence of resistivity (sample 9).
Crystals 11 00534 g0a4
Figure A5. Enlarged view of Figure 11e in the low magnetic field region of MR as a function of magnetic field and temperature at 9.3 GPa.
Crystals 11 00534 g0a5

References

  1. Tanaka, H.; Okano, Y.; Kobayashi, H.; Suzuki, W.; Kobayashi, A. A three-dimensional synthetic metallic crystal composed of single-component molecules. Science 2001, 291, 285–287. [Google Scholar] [CrossRef] [PubMed]
  2. Suzuki, W.; Fujiwara, E.; Kobayashi, A.; Fujishiro, Y.; Nishibori, E.; Takata, M.; Sakata, M.; Fujiwara, H.; Kobayashi, H. Highly conducting crystals based on single-component gold complexes with extended-TTF dithiolate ligands. J. Am. Chem. Soc. 2003, 125, 1486–1487. [Google Scholar] [CrossRef] [PubMed]
  3. Le Gal, Y.; Roisnel, T.; Auban-Senzier, P.; Bellec, N.; Íñiguez, J.; Canadell, E.; Lorcy, D. Stable metallic state of a neutral-radical single-component conductor at ambient pressure. J. Am. Chem. Soc. 2018, 140, 6998–7004. [Google Scholar] [CrossRef] [PubMed]
  4. Zhou, B.; Ishibashi, S.; Ishii, T.; Sekine, T.; Takehara, R.; Miyagawa, K.; Kanoda, K.; Nishibori, E.; Kobayashi, A. Single-component molecular conductor [Pt(dmdt)2]—A three-dimensional ambient-pressure molecular Dirac electron system. Chem. Commun. 2019, 55, 3327–3330. [Google Scholar] [CrossRef]
  5. Cui, H.; Brooks, J.S.; Kobayashi, A.; Kobayashi, H. Metallization of the single component molecular semiconductor [Ni(ptdt)2] under very high pressure. J. Am. Chem. Soc. 2009, 131, 6358–6359. [Google Scholar] [CrossRef]
  6. Zhou, B.; Idobata, Y.; Kobayashi, A.; Cui, H.; Kato, R.; Takagi, R.; Miyagawa, K.; Kanoda, K.; Kobayashi, H. Single-component molecular conductor [Cu(dmdt)2] with three-dimensionally arranged magnetic moments exhibiting a coupled electric and magnetic transition. J. Am. Chem. Soc. 2012, 134, 12724–12731. [Google Scholar] [CrossRef]
  7. Cui, H.; Tsumuraya, T.; Miyazaki, T.; Okano, Y.; Kato, R. Pressure-induced metallic conductivity in the single-component molecular crystal [Ni(dmit)2]. Eur. J. Inorg. Chem. 2014, 2014, 3837–3840. [Google Scholar] [CrossRef]
  8. Cui, H.; Kobayashi, H.; Ishibashi, S.; Sasa, M.; Iwase, F.; Kato, R.; Kobayashi, A. A single-component molecular superconductor. J. Am. Chem. Soc. 2014, 136, 7619–7622. [Google Scholar] [CrossRef]
  9. Tenn, N.; Bellec, N.; Jeannin, O.; Piekara-Sady, L.; Auban-Senzier, P.; Íñiguez, J.; Canadell, E.; Lorcy, D. A single-component molecular metal based on a thiazole dithiolate gold complex. J. Am. Chem. Soc. 2009, 131, 16961–16967. [Google Scholar] [CrossRef]
  10. Yzambart, G.; Bellec, N.; Nasser, G.; Jeannin, O.; Roisnel, T.; Fourmigué, M.; Auban-Senzier, P.; Íñiguez, J.; Canadell, E.; Lorcy, D. Anisotropic chemical pressure effects in single-component molecular metals based on radical dithiolene and diselenolene gold complexes. J. Am. Chem. Soc. 2012, 134, 17138–17148. [Google Scholar] [CrossRef]
  11. Kato, R.; Cui, H.; Tsumuraya, T.; Miyazaki, T.; Suzumura, Y. Emergence of the Dirac electron system in a single-component molecular conductor under high pressure. J. Am. Chem. Soc. 2017, 139, 1770–1773. [Google Scholar] [CrossRef]
  12. Cui, H.; Kato, R. Electrical properties of single-component molecular crystals under high pressure. Rev. H. Pres. Sci. Tech. 2018, 28, 217–224. [Google Scholar] [CrossRef]
  13. Novoselov, K.; Geim, A.; Morozov, S.; Jiang, D.; Grigorieva, M.; Dubonos, S.; Firsov, A. Two-dimensional gas of massless Dirac fermions in graphene. Nature 2005, 438, 197–200. [Google Scholar] [CrossRef]
  14. Hasan, M.; Kane, C. Colloquium: Topological insulators. Rev. Mod. Phys. 2010, 82, 3045–3067. [Google Scholar] [CrossRef] [Green Version]
  15. Huynh, K.K.; Tanabe, Y.; Tanigaki, K. Both electron and hole Dirac cone states in Ba(FeAs)2 confirmed by magnetoresistance. Phys. Rev. Lett. 2011, 106, 217004. [Google Scholar] [CrossRef] [Green Version]
  16. Tajima, N.; Sato, M.; Sugawara, S.; Kato, R.; Nishio, Y.; Kajita, K. Spin and valley splittings in multilayered massless Dirac fermion system. Phys. Rev. B 2010, 82, 121420(R). [Google Scholar] [CrossRef] [Green Version]
  17. Kato, R.; Suzumura, Y. Novel Dirac electron in single-component molecular conductor [Pd(dddt)2] (dddt =5,6-dihydro-1,4-dithiin-2,3-dithiolate). J. Phys. Soc. Jpn. 2017, 86, 064705. [Google Scholar] [CrossRef]
  18. Tsumuraya, T.; Kato, R.; Suzumura, Y. Effective hamiltonian of topological nodal line semimetal in single-component molecular conductor [Pd(dddt)2] from first-principles. J. Phys. Soc. Jpn. 2018, 87, 113701. [Google Scholar] [CrossRef]
  19. Evans, P.R.; Murshudov, G.N. How good are my data and what is the resolution? Acta Crystallogr. Sect. D Biol. Crystallogr. 2013, 69, 1204–1214. [Google Scholar] [CrossRef]
  20. Winn, M.D.; Ballard, C.C.; Cowtan, K.D.; Dodson, E.J.; Emsley, P.; Evans, P.R.; Keegan, R.M.; Krissinel, E.B.; Leslie, A.G.W.; McCoy, A.; et al. Overview of the CCP4 suite and current developments. Acta Crystallogr. Sect. D Biol. Crystallogr. 2011, 67, 235–242. [Google Scholar] [CrossRef] [Green Version]
  21. Winter, G.; Waterman, D.G.; Parkhurst, J.M.; Brewster, A.S.; Gildea, R.J.; Gerstel, M.; Fuentes-Montero, L.; Vollmar, M.; Michels-Clark, T.; Young, I.D.; et al. DIALS: Implementation and evaluation of a new integration package. Acta Crystallogr. Sect. D Struct. Biol. 2018, 74, 85–97. [Google Scholar] [CrossRef] [Green Version]
  22. Evans, P. Scaling and assessment of data quality. Acta Crystallogr. Sect. D Biol. Crystallogr. 2006, 62, 72–82. [Google Scholar] [CrossRef]
  23. Winter, G. xia2: An expert system for macromolecular crystallography data reduction. J. Appl. Crystallogr. 2010, 43, 186–190. [Google Scholar] [CrossRef]
  24. Sheldrick, G.M. SHELXT—Integrated space-group and crystal-structure determination. Acta Crystallogr. Sect. A Found. Adv. 2015, 71, 3–8. [Google Scholar] [CrossRef] [Green Version]
  25. Dolomanov, O.V.; Bourhis, L.J.; Gildea, R.J.; Howard, J.A.K.; Puschmann, H. OLEX2: A complete structure solution, refinement and analysis program. J. Appl. Crystallogr. 2009, 42, 339–341. [Google Scholar] [CrossRef]
  26. Hoffmann, R. An Extended Hückel theory. I. hydrocarbons. J. Chem. Phys. 1963, 39, 1397. [Google Scholar] [CrossRef]
  27. Clementi, E.; Roetti, C. Roothaan-Hartree-Fock atomic wavefunctions: Basis functions and their coefficients for ground and certain excited states of neutral and ionized atoms, Z ≤ 54. At. Data Nucl. Data Tables 1974, 14, 177–478. [Google Scholar] [CrossRef]
  28. QuantumATK R-2020.09 Documentation, Manual of Atomic data. Available online: https://docs.quantumatk.com/manual/AtomicData.html#sect3-atomicdata-huckel-muller (accessed on 11 May 2021).
  29. Cui, H.; Tsumuraya, T.; Yeung, H.H.-M.; Coates, C.S.; Warren, M.R.; Kato, R. High pressure crystal structure and electrical properties of a single component molecular crystal [Ni(dddt)2] (dddt = 5,6-dihydro-1,4-dithiin-2,3-dithiolate). Molecules 2019, 24, 1843. [Google Scholar] [CrossRef] [Green Version]
  30. Cairns, A.B.; Goodwin, A.L. Negative linear compressibility. Phys. Chem. Chem. Phys. 2015, 17, 20449–20465. [Google Scholar] [CrossRef] [Green Version]
  31. Kato, R.; Cui, H.; Minamidate, T.; Yeung, H.H.-M.; Suzumura, Y. Electronic Structure of a Single-Component Molecular Conductor [Pd(dddt)2] (dddt = 5,6-dihydro-1,4-dithiin-2,3-dithiolate) under High Pressure. J. Phys. Soc. Jpn. 2020, 89, 124706. [Google Scholar] [CrossRef]
  32. Mori, T.; Kobayashi, A.; Sasaki, Y.; Kobayashi, H.; Saito, G.; Inokuchi, H. The intermolecular interaction of tetrathiafulvalene and bis(ethylenedithio) tetrathiafulvalene in organic metals. Calculation of orbital overlaps and models of energy-band Structures. Bull. Chem. Soc. Jpn. 1984, 57, 627–633. [Google Scholar] [CrossRef]
  33. Kato, R.; Suzumura, Y. A Tight-binding model of an ambient-pressure molecular Dirac electron system with open nodal lines. J. Phys. Soc. Jpn. 2020, 89, 044713. [Google Scholar] [CrossRef]
  34. Suzumura, Y.; Cui, H.; Kato, R. Conductivity and resistivity of Dirac electrons in single-component molecular conductor [Pd(dddt)2]. J. Phys. Soc. Jpn. 2018, 87, 084702. [Google Scholar] [CrossRef] [Green Version]
  35. Berry, M.V. Quantal phase factors accompanying adiabatic changes. Proc. R. Soc. Lond. Ser. A 1984, 392, 45–57. [Google Scholar]
  36. Stephen, G.M.; Lane, C.; Buda, G.; Graf, D.; Kaprzyk, S.; Barbiellini, B.; Bansil, A.; Heiman, D. Electrical and magnetic properties of thin films of the spin-filter material CrVTiAl. Phys. Rev. B 2019, 99, 224207. [Google Scholar] [CrossRef] [Green Version]
  37. Bodepudi, S.C.; Singh, A.P.; Pramanik, S. Current perpendicular to plane magnetoresistance in chemical vapor deposition grown multilayer graphene. Electronics 2013, 2, 315–331. [Google Scholar] [CrossRef]
  38. Liu, Y.; Lew, W.S.; Sun, L. Enhanced weak localization effect in few-layer graphene. Phys. Chem. Chem. Phys. 2011, 13, 20208–20214. [Google Scholar] [CrossRef]
  39. Heyd, J.; Peralta, J.E.; Scuseria, G.E.; Martin, R.L. Energy band gaps and lattice parameters evaluated with the Heyd-Scuseria-Ernzerhof screened hybrid functional. J. Chem. Phys. 2005, 123, 174101. [Google Scholar] [CrossRef]
Figure 1. Molecular structure and crystal structure of [Pd(dddt)2] at 5.9 GPa with symbols of intermolecular couplings. Palladium, sulfur and carbon atoms are shown in pink, yellow and grey, respectively. Hydrogen atoms are omitted for clarity.
Crystals 11 00534 g001
Figure 2. (a) Optical microscope image of the [Pd(dddt)2] sample at 21.6 GPa assembled in a Diamond Anvil Cell (DAC). (b) The pressure dependence of room temperature resistivity (samples 1~4 = data from previous work [11]). (c) Temperature-dependent resistivity ρ under various pressures from 1.3 GPa to 13 GPa.
Crystals 11 00534 g002
Figure 3. (a) Pressure dependence of cell parameters a, b, c, β and V. (b) Crystallographically independent [Pd(dddt)2] molecules at different pressure in Layer 1 and Layer 2. (c) Crystal structure of [Pd(dddt)2] at 7.8 GPa. Palladium, sulfur, carbon and hydrogen atoms are shown in pink, yellow, grey and cyan, respectively.
Crystals 11 00534 g003
Figure 4. Two extreme crystal structures in which one of the possible conformations for molecule 2(4) is fully occupied (Structures A and B).
Crystals 11 00534 g004
Figure 5. Electronic band structure of [Pd(dddt)2] at 5.9 GPa connecting TRIMs.
Crystals 11 00534 g005
Figure 6. Dirac cone at kz = 0 in [Pd(dddt)2] at 5.9 GPa, 7.8 GPa and 10.6 GPa.
Crystals 11 00534 g006
Figure 7. Nodal loops in [Pd(dddt)2] at 5.9 GPa, 7.8 GPa and 10.6 GPa. Points with hole-like characteristics are indicated in red and points with electron-like characteristics in blue.
Crystals 11 00534 g007
Figure 8. Fermi surfaces in [Pd(dddt)2] at 5.9 GPa, 7.8 GPa and 10.6 GPa.
Crystals 11 00534 g008
Figure 9. Electronic band structure of [Pd(dddt)2] at 7.8 GPa connecting TRIMs.
Crystals 11 00534 g009
Figure 10. Electronic band structure of [Pd(dddt)2] at 10.6 GPa connecting TRIMs.
Crystals 11 00534 g010
Figure 11. (a) Schematic of the crystal shape, axes and orientation of the four-probe attachment on Samples 7 and 8, in which the magnetic field (B) is perpendicular to the current direction. (b) Temperature (T) dependence of magnetoresistance (MR) as a function of B at 10.5 GPa (Sample 8). (c) Temperature dependence of MR as a function of B at 9.6 GPa (Sample 7). (d) Schematic of the crystal shape, axes and the orientation of the four-probe attachment on Sample 9, in which the magnetic field is parallel to the current direction. (e) MR as a function of B and T at 9.3 GPa (Sample 9). (f) MR as a function of B and T at 8.7 GPa (Sample 9).
Crystals 11 00534 g011
Table 1. HOMO–HOMO (H–H), LUMO–LUMO (L–L), and HOMO–LUMO (H–L) transfer integrals (meV) at 5.9 GPa.
H–HL–LH–L
b1209.3−1.9−51.2Layer 1
p1 (p)28.1−12.419.9
p217.1
b249.9−80.4−67.2Layer 2
q1 (q)10.88.19.3
q29.2
a1−28.214.6−20.1Interlayer
a22.21.3−1.7
c115.412.714.1
c2−3.915.8−11.8
Table 2. HOMO–HOMO (H–H), LUMO–LUMO (L–L), and HOMO–LUMO (H–L) transfer integrals (meV) at 7.8 GPa (Structure A).
H–HL–LH–L
b1190.253.2−34.3Layer 1
p1 (p)28.1−17.023.1
p220.5
b2−0.9−121.5−71.9Layer 2
q1 (q)7.37.28.5
q26.1
a1−37.719.0−26.6Interlayer
a23.32.7−3.1
c19.16.07.3
c21.29.4−5.6
Table 3. HOMO–HOMO (H–H), LUMO–LUMO (L–L), and HOMO–LUMO (H–L) transfer integrals (meV) at 7.8 GPa (Structure B).
H–HL–LH–L
b1190.253.2−34.3Layer 1
p1 (p)28.1−17.023.1
p220.5
b2107.2−5.4−46.2Layer 2
q1 (q)11.211.012.1
q210.2
a1−32.916.2−22.9Interlayer
a22.01.9−2.0
c1−7.7−15.2−12.6
c2−9.312.4−11.3
Table 4. HOMO–HOMO (H–H), LUMO–LUMO (L–L), and HOMO–LUMO (H–L) transfer integrals (meV) at 10.6 GPa (Structure A).
H–HL–LH–L
b1203.46.1−67.5Layer 1
p1 (p)24.7−13.418.6
p217.7
b2−0.3−135.0−81.6Layer 2
q1 (q)7.87.29.3
q25.9
a1−36.321.4−28.4Interlayer
a24.94.1−4.6
c17.64.86.0
c2−5.017.9−12.5
Table 5. HOMO–HOMO (H–H), LUMO–LUMO (L–L), and HOMO–LUMO (H–L) transfer integrals (meV) at 10.6 GPa (Structure B).
H–HL–LH–L
b1203.46.1−67.5Layer 1
p1 (p)24.7−13.418.6
p217.7
b2143.932.7−49.8Layer 2
q1 (q)13.912.914.8
q212.2
a1−31.621.1−26.4Interlayer
a22.02.4−2.4
c1−6.4−15.3−11.7
c2−9.69.3−9.3
Table 6. Intermolecular S···S distances (Å) between Molecules 2(4) in Layer 2 along the stacking direction.
Ambient Pressure5.9 GPa7.8 GPa10.6 GPa
Structure AStructure BStructure AStructure B
d13.9533.6123.7803.1993.7073.028
d23.9223.5963.4843.4843.5173.517
d33.8503.5473.4533.4533.3523.352
Publisher’s Note: MDPI stays neutral with regard to jurisdictional claims in published maps and institutional affiliations.

