
Molecular Dynamics Simulation in the Interlayer of Mixed-Layer Clays Due to Hydration and Swelling Mechanism

1
School of Civil Engineering and Transportation, South China University of Technology, Guangzhou 510641, China
2
School of Architecture and Construction Management, Kennesaw State University, Marietta, GA 30060, USA
*
Author to whom correspondence should be addressed.
Crystals 2021, 11(6), 586; https://0-doi-org.brum.beds.ac.uk/10.3390/cryst11060586
Submission received: 13 April 2021
/
Revised: 19 May 2021
/
Accepted: 20 May 2021
/
Published: 23 May 2021
(This article belongs to the Special Issue Surfaces and Interfaces of Clay Minerals)
Abstract
:The swelling behavior of clay minerals is widely known for its importance in soil and environmental sciences and its detrimental effects in engineering fields. Although more than 70 percent of all clays are of mixed-layer types, the vast majority of the previous experiments and simulations are focused on pure clays, which cause the swelling mechanism of the widespread mixed-layer clay (MLC) and its role in soils are little understood, especially the most common illite-montmorillonite (I-M) mixed-layer clay (MLC). This paper reports on a molecular dynamics (MD) study of the differences in swelling behavior between I-M MLCs containing K+ and Na+ and Na-montmorillonite (MMT). It captures the evolution of quantitative properties such as basal spacing d, interaction energy, and many hydrogen bonds in the clay interlayer, increasing hydration for the first time through the scripts. It is found that MLCs have smaller swellings than Na-MMT due to the asymmetric interlayer charges and mixed counterions in the I-M interlayer. However, in terms of the interaction energy for the in-depth reason of swelling, it is found that the clay-clay interaction energy and the clay-ion interaction energy drop, while the clay-water interaction energy increases with increasing hydration. In addition, the attractive interaction of clay-bound water seriously promotes swelling, and it is mainly composed of Coulomb interaction and Van der Waals interaction. The higher the K+ concentration, the more noticeable these phenomena are. Besides, it is also reported that the number and distribution mechanism of hydrogen bonds in MLCs are very different from that of pure clay. This work provides insight into the molecular mechanism for initial swelling and clay-bound water interaction in widespread MLCs. This will help to decipher its specific role in soils and minimize clay swelling.
1. Introduction
The swelling behavior of clay minerals is widely known for its importance in soil and environmental sciences and its detrimental effects in engineering fields throughout the world, including civil, geotechnical, and petroleum engineering, etc. [1]. These clay minerals are abundant in nature and are the main components of many soils [2]. Even a tiny amount in the soil can cause swelling. The main reason is that these expansive clays undergo a significant volumetric change when exposed to water, but shrink quickly when they lose water. If these expansions are restricted, they can exhibit a large amount of stress, causing damage to various engineering structures [3]. Many studies and theories have attempted to understand the swelling process and interpret the most critical issue, the interactions between clay and water in the interlayer [4].
Most studies in the past, whether experimental or computational, have focused on pure clays of one type or another [5]. However, there are a wide variety of mixed-layer (ML) clays in sedimentary rocks that include an intermixed stacking sequence of two or more types of distinct layers within a single crystal [6]. For example, a study indicated that more than 70% of sedimentary rocks in the United States contain some form of ML clays [7]. Therefore, they are more likely to be found in geological formations than pure clays, and the most abundant and interesting mixed layer type is illite-montmorillonite (I-M) clay [8]. So far, most of the research data on the hydration of clay minerals have been interpreted in terms of a monomineralic system. Although MLCs may exist more widely in soils, the relevant research is very limited, which will undoubtedly lead to some incorrect judgment statements. In reality, ML clays have different layer types, layer charge positions, and cation types, so the interaction between these surfaces and their interaction with the interlayer species and water may also be different. Due to the lack of understanding of the swelling mechanism for all types of clays, geological disasters in expansive soils have not been completely controlled. Thus, it is of great theoretical and engineering significance to learn about the characteristics of ML clay and its interaction with water molecules.
Traditional research on expansive clays includes theoretical and experimental methods. The swelling behavior is classified into crystalline swelling and osmotic swelling. Among them, crystalline swelling is short-range swelling, which represents the initial hydration mechanism of clay. The diffuse double layer theory is one of the earlier models that tried to describe clay-bound water interactions [9]. Another theory, named the Derjaguin, Landau, Verwey, and Overbeek (DLVO) theory, describes the stability of clay suspension quite well for larger spacing but is not satisfactory for interlamellar spacing less than 20 Å (×10 − 1 nm) [10]. Despite the wide prevalence of these theories, they failed in this regime and were incapable of describing the early stages of clay swelling. Nevertheless, in the case of sufficiently homogeneous and well-compacted clay, most of the water will exist in the clay interlayer. Some scanning electron microscopy (SEM) images of well-compacted clays confirm this well, where they show a highly stratified system with a small percentage of voids [11]. In addition, scientists have also discovered in practical engineering that the molecular interactions between clay and interlayer water greatly impact its microstructure and macro properties [12,13]. These all mean that it is vital to concentrate work on the clay interlayer region.
The experiments employed to study clay swelling are mainly divided into two strategies: macroscopic measurement and microscopic characterization. Among them, the macro experimental data enable preliminary qualitative descriptions to be achieved, but the micro-mechanisms cannot be identified. Nowadays, experiments at the molecular level are unrealistic. The microscopic properties of clay materials are usually characterized by advanced tools, such as SEM, X-ray diffraction (XRD) and quasi-elastic neutron scattering (QENS) [14,15,16], etc. Nevertheless, there are still many problems that seem difficult to solve. For example, The SEM technique can only characterize the microstructure of clay minerals in an anhydrous state. The XRD technique can be used to determine the interlayer spacing, but it yields no direct information about internal species’ arrangement. Further, whilst the QENS technique can be used to study the dynamics of a clay interlayer, it is unable to detect the adsorption process from absolute dryness to micro-water content. In general, the existing methods lack detailed explanations and render it hard to obtain quantitative interaction parameters. Whereas regarding MLC, although we know of the existence of this type of clay, we know very little about it, and only a small amount of research has been carried out [17]. The main reason is that it is challenging to prepare experimental samples of this type of clay, because they have the complications of stacking disorder, poor crystallinity, and mixed charge [18]. Secondly, the accurate characterization of clay materials is inherently challenging due to their small platelet size and lack of long-range order. However, computer simulation offers the possibility of solving these problems.
Most of the calculation methods used in the geotechnical field are of the finite element method based on continuum mechanics and the discrete element modeling method based on granular mechanics. Although they can be used to predict the macroscopic properties of granular materials like soils, they fail to predict their nature due to several factors, such as particle-size variation, irregular geometry, chemical composition, and environmental history [19]. The most serious issue is that these methods can only be used to predict the behavior of non-swelling clays [20]. However, there is an urgent need for the fundamental investigation of molecular interactions between swelling clays and water, and understanding the fundamental mechanisms that initiate crystalline swelling [21].
Molecular dynamics (MD) and grand canonical Monte Carlo (MC) simulations are computational techniques, used to understand molecular-scale behavior, which are based upon classical statistical mechanics and dynamics, respectively. Among them, MC methods are carried out using rigid clay layers to allow the efficient arrangement and loading of interlayer water. In contrast, MD methods based on Newtonian mechanics are conducted, typically with flexible clay layers, to determine the factors that affect swelling [22]. Generally, the combination of these two methods is most appropriate to obtain optimal results. These methods can help disclose underlying changes in microstructure, dynamics, and energy and decipher complex mechanisms that can hardly be grasped from a macro perspective [23]. Furthermore, their applications in some micro-scale geotechnical problems have become a research hotspot [24], as these problems occur in frozen, saline, and expansive soils. As the main component of most soils, clay minerals have been widely studied, including the micro-mechanisms of surface wettability [25], matter adsorption [26], mechanical properties [27], and, most importantly, clay swelling [28]. With the advancement of computer power and algorithms [29], they are increasingly used to obtain information on clay swelling, where the interlamellar spacings are smaller than the Debye length (∼20 Å), and the hydration effects become essential [30]. Additionally, insight into the molecular interactions between clay and water can also be gained in this way [31]. However, to our knowledge, molecular simulations of widespread MLCs are rare. Some recent studies have only focused on their thermodynamic properties [32] but have revealed little about internal interactions and H-bond distribution. Considering that the relevant experimental values that can be used are also minimal, it is necessary to understand these characteristics of MLCs further.
In this work, the molecular modeling of I-M MLCs with increasing hydration has been performed to understand the effects of asymmetric interlayers and mixed counterions on crystalline swelling and clay-water interaction, using MD techniques. We have focused on the molecular dynamics of three MLC models with different ratios of K+ and Na+ and reported the same phenomenon in MMT only whose interlayer contains Na+ to grasp their differences. During the hydration, the incremental insertion of water molecules into the clay interlayer has been carried out by editing the script, which simulates the initial phase of water sorption to the greatest extent, including the adsorption order, position, and configuration. Sufficient MD simulations have been carried out to obtain the basal spacing d after swelling, followed by subsequent insertion to obtain the dynamic swelling value. Furthermore, the relative d-spacing has been calculated and the internal matter distribution has been observed, to conduct a preliminary analysis of hydration swelling. Since the clay-water interactions contain the fundamental mechanisms that lead to crystalline swelling [33], a script has been written to obtain the quantitative interaction energies among the various components (clay sheets, water, and cations). In addition, considering the different H-bonding networks and properties of interlayer water with bulk water and their essential role in clay hydration [34], another script has also been edited to extract the H-bond number distributions of different types of clay.
2. Theoretical Calculations
To implement theoretical calculations from the MD perspective, the molecular model of MLC, computational details, and properties’ formulae are presented in this section.
2.1. Molecular Model of Mixed-Layer Clay
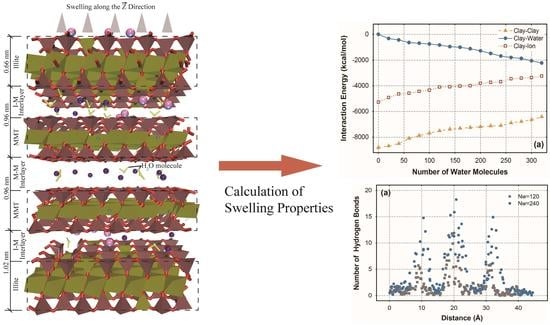
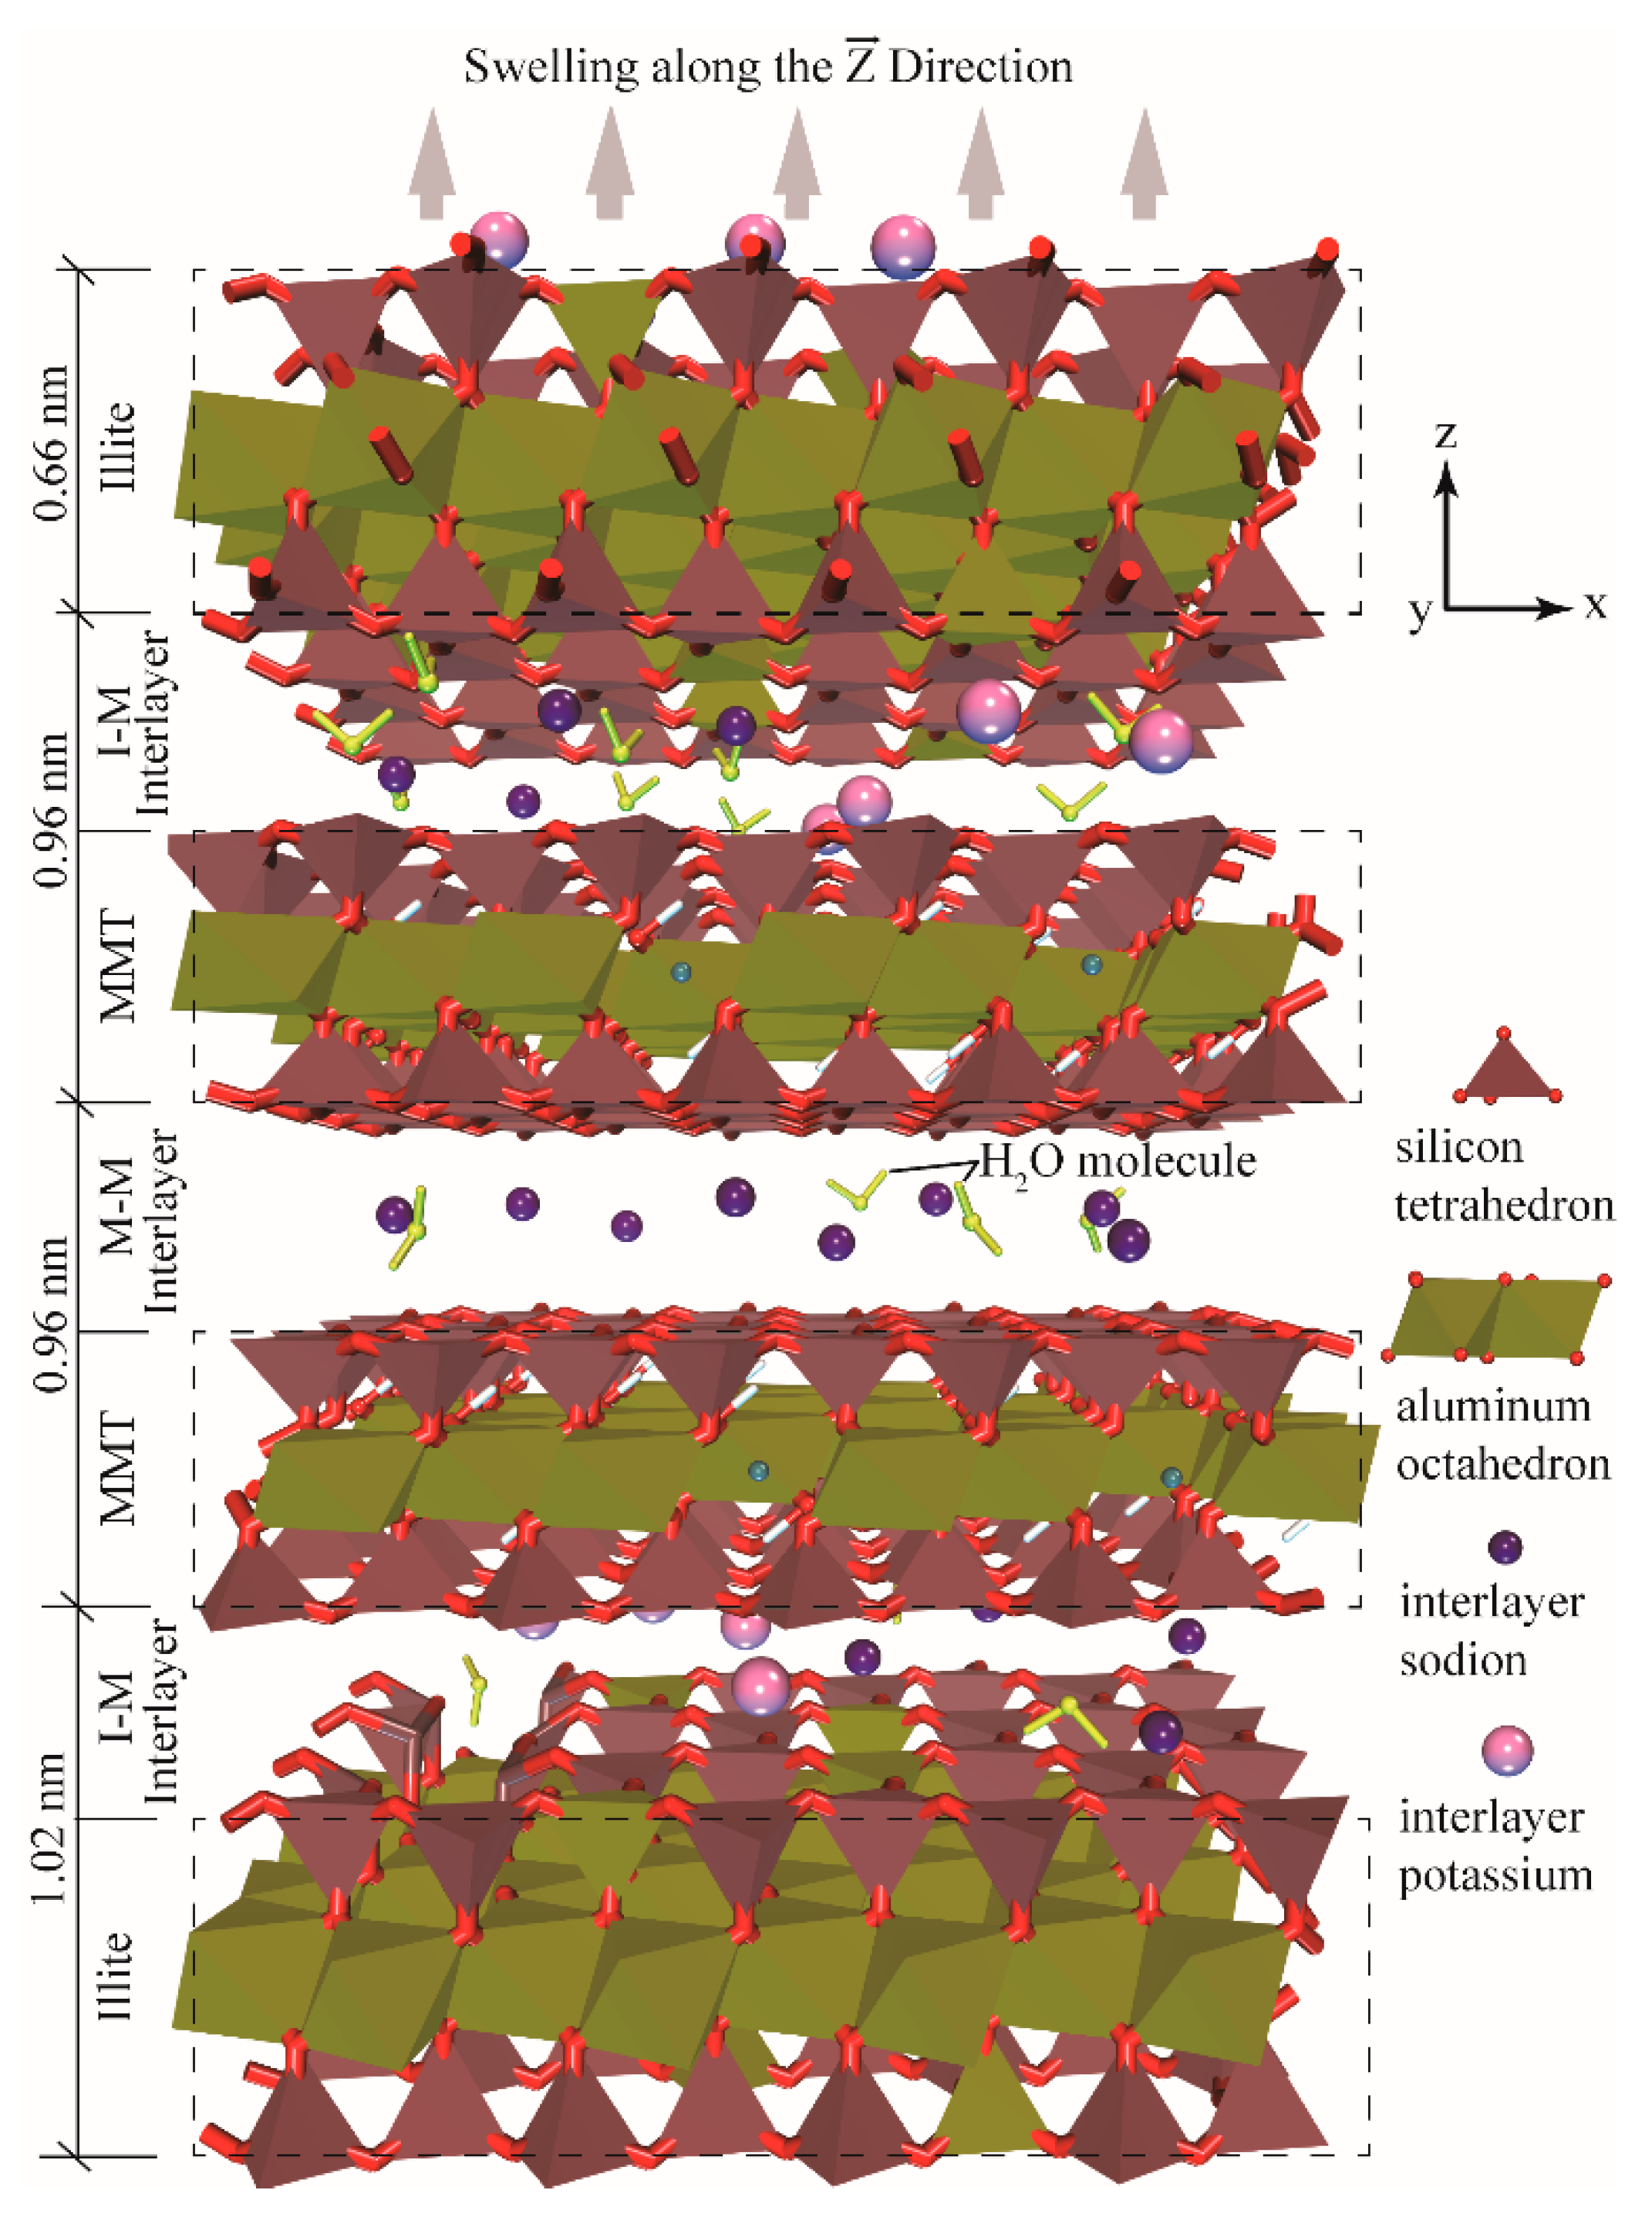
One major factor for the abundance of MLCs is that, under a solid-state conversion, pure clays are transformed into MLCs under the effects of earth temperature and pressure [35]. For instance, in smectite illitization, the interlayer montmorillonite is replaced by illite. Further, many Na ions are replaced by K ions, forming the mixed layer illite−montmorillonite (I-M) clay. Figure 1 shows the most typical MLC model with 50% Na+ and 50% K+ in the form of I-M-M-I, where the bottom and top layers are illite, and MMT builds the two central ones. The structure is symmetric with respect to the central line located between the MMT sheets. The thickness and composition elements of each clay layer are also shown in the figure.
Among them, the basic molecular units of illite and montmorillonite are both acquired from the latest American Mineralogist Crystal Structure Database [36], of which the type of illite is RM30, which originates from Silver caldera, San Juan Mountains, Colorado, and the montmorillonite type is Arizona-MMT [37], where only octahedral substitutions occur. The chemical formula for the illite can be expressed as K1.5 [Si7Al1][Al3.5Mg0.5]O20(OH)4·nH2O, while the formula of Arizona-MMT can be written as Na[Si8][Al3Mg]O20(OH)4·nH2O. To minimize the differences between the dimensions of illite and MMT sheets along with the x and y directions, they are organized as 4 × 2 unit cells. Therefore, under dry conditions, the three dimensions of the entire MLC cell are approximately 20.85 Å × 18.01 Å × 39 Å. Although both illite and MMT structures are composed of an octahedral sheet sandwiched between two tetrahedral sheets, that is, the T−O−T pattern, their layer charges are exclusively in the tetrahedral and octahedral sheets, separately, to better isolate the influence of charge location on clay hydration.
Under initial conditions, the I−I and M−M interlayers contain K+ and Na+ severally to equilibrate the charges, and the loading of these ions are realized through the Monte Carlo adsorption module. Considering the mixed counterions in the I-M interlayer [38,39], three MLC models with K+ content of 50%, 75% and 100% are used to study the effects of counterion ratio on clay hydration, which respectively correspond to 50% Na+ and 50% K+ in the I-M interlayer, K+ replaces all Na+ in the I-M interlayer, and all Na+ in the model are replaced by K+. In order to understand the differences from pure clay, we also report on the same phenomenon in the MMT only, which is one of the most representative swelling clays in soils [40,41]. All the initial models are constructed on Materials Studio 6.0 software, which was developed by Accelrys Software Inc. of San Diego, California, USA, for the subsequent adsorption of water molecules that are flexible simple point charge (SPC) water models. They are obtained by stacking clay layers such as illite and montmorillonite along the cell z-direction in the Build Layers module. Three-dimensional periodic boundary conditions are employed to model an infinite stack of clay sheets, very similar to natural clay minerals.
2.2. Computational Details
The computational details of the molecular force field and realization of MD calculation are discussed in this section.
2.2.1. Force Field
The molecular force field is defined as the interaction parameters between atoms, including bond and non-bond interactions. In this work, the recently developed CLAYFF force field [42] is employed to describe the interatomic interactions, and charges are assigned to each atom. CLAYFF is available in molecular simulation codes and was developed by Sandia National Laboratories chemist Randall Cygan. It treats most inter-atomic interactions as point charges and non-bonding, which allows the force field to be used for a wide variety of phases and complete translational freedom within the framework, while keeping the parameters number small enough to permit modelling of highly disordered and relatively large systems such as clays. The CLAYFF approach has been proven to be particularly successful in the simulation of hydrated and multi-component mineral systems and their interfaces with aqueous solutions [43]. It can correctly predict the thermophysics, mechanical properties and interactions with water of mineral materials [44]. The flexible SPC water model is used in conjunction with the CLAYFF force field for water behavior.
2.2.2. Simulation Procedure
First of all, the constructed clay models were geometrically optimized to obtain a low-energy configuration, which was conducive to the subsequent simulations of water adsorption. A smart algorithm was used for minimization, which was a cascade of methods using conjugate gradient and successive steepest-descent algorithms. It was found that the potential energy of the clay reached its minimum after 2000 iterations. In the detailed settings, the particle-particle particle-mesh (PPPM) solver algorithm [45] was applied to treat the electrostatic interaction in accuracy of 0.0001 kcal/mol, and the atom-based summation was employed for van der Waals interaction with a cutoff radius of 10.5 Å.
Next, the script was executed to realize the incremental insertion of water molecules into the interlayer of clay structures [42]. Water molecules were inserted eight at a time, followed by an equilibrium step before the subsequent insertion. In this equilibrium process, the MD simulations in the NPT ensemble (constant number of particles, pressure, and temperature) were conducted to perform a full swelling simulation using the LAMMPS package, which was developed by Sandia National Laboratory in the United States, and all the constraints of atoms and cell parameters were released.
It should be noted that each swelled model here is used for the next step of water adsorption. In this way, the initial phase of water sorption can be simulated to the greatest extent, including the adsorption order in different interlayers, adsorption positions, and configurations. Further, the dynamic basal spacings and structural properties can be obtained by systemically increasing the water content in small steps, from 1 to 320 molecules in the interlayer region.
As mentioned above, the system was free to expand or shrink, while the interlayer species could freely translate and rotate to better study the clay-water interactions. Since the swelling gradually entered a stable state after a certain time, and the simulations of 1 ns and 5 ns were proved to yield very similar results; thus, the time of MD equilibrium and MD production in the NPT ensemble were both 1 ns, and the time step was 1fs (1 ns = 103 ps = 106 fs). The reliability and rationality of the running time will be further discussed in the subsequent swelling discussion section. The dry system was first equilibrated at room temperature and pressure with T = 298 K and p = 1 atm, and the dry basal spacing d was calculated from the production stage. Then, MD simulations were also carried out to calculate the relative d-spacings for all independent cases with different water content under the same temperature and pressure conditions. Each of the production simulations was repeated three times and averaged to reduce random errors. A Nosé-Hoover-Langevin (NHL) thermostat was applied to control the temperature effectively [46], and the Berendsen method of pressure control was used to offer swift equilibration of the system and changes in cell size. The motion equation was solved using the Verlet algorithm, and the atomic trajectories and thermodynamic data were collected every 5 ps for subsequent analyses.
After the swelling simulation, we switched to the canonical NVT ensemble (constant number of particles, volume, and temperature) and continued the simulation for another 2 ns. Here the equilibrated models in NPT simulations were used as the input for NVT. The method of controlling temperature and detailed settings were the same as the previous steps. Finally, the results of four types of clays were used to capture the evolution of intermolecular interactions, such as interaction energy and a number of hydrogen bonds in the clay interlayer, by editing the property scripts.
2.3. Properties
The quantitative properties such as basal spacing d, interaction energy, and several hydrogen bonds in the clay interlayer are analyzed simultaneously in this section to better understand and discuss the initial swelling for MLCs.
2.3.1. Basal Spacing d
The basal spacing d is defined as the sum of the clay sheet’s thickness and the interlayer distance between that sheet and its neighboring one. The entry of water molecules into the interlayer causes the expansion of clay volume and the change of cell parameters. Therefore, the basal spacing value is obtained by averaging the cell volume during the production stage of NPT simulation [47]:
where represents the statistically averaged volume, while , , and represent the statistical average of the corresponding cell parameters.
The relative basal spacing d, relative to the dry state, can be expressed as:
Here is the basal spacing when the water content is n, and is the basal spacing of dry state.
2.3.2. Interaction Energy
Since the clay-water system interactions contain the key mechanisms that lead to crystalline swelling, they mainly depend on nonbonding electrostatic and van der Waals potentials. The quantitative interaction energies are calculated through the script, which is read in a trajectory and, frame by frame, calculates the cell’s energy. The script first establishes the different components of the clay-water system as different sets. Then, through the loop statement, only the required two sets are retained, and the other components are deleted. Then it will calculate the total energy when the two sets coexist, and their respective energy, and obtain their interaction energy through Equation (3). Finally, by looping over each pair of sets, the calculation of the interaction energy between each pair of sets is realized. The interaction energy is defined as [48]:
where is the total energy of the two components. is the energy of the component 1 and is the energy of the component 2.
The computed interaction energy is decomposed into Coulomb interaction energy and van der Waals interaction energy:
where indicates the Coulomb interaction energy and indicates the van der Waals interaction energy.
2.3.3. Calculation of Hydrogen Bonds
The water molecules within a distance of 3 Å (×10−1 nm) of the clay sheet and the counterion are defined as clay-bound water and ion-bound water, respectively, of which properties are different from bulk water. The magnitude of this distance is the characteristic range for H-bond interactions [49]. Due to its close intermolecular distance, this interaction is strong. The interfacial water structure can be described by the characteristic features of H-bonds.
Firstly, a hydrogen bond between two atoms is created through the script when the hydrogen bond criteria are met [50], which are: (i): One atom is an H atom. The H-atom is single-bonded, while the attached atom can act as an H-bond donor. (ii): The second atom can act as an H-bond acceptor and have at least one lone electron pair. (iii): The distance between the H-atom and the acceptor is less than or equal to the Maximum H acceptor distance. (iv): The value of the angle constituted by the donor, H and acceptor atoms is at least the minimum donor-hydrogen-acceptor angle. (v): If both the H and acceptor atoms are within the same molecule, they are split by at least the four nearest neighboring shells.
Based on these criteria, the H-bonds are calculated through the following procedure [51]: (i): Test all selected H-bonds for compliance with the H-bond criteria, and then delete non-compliant bonds. (ii): Create donor-acceptor pairs applying all selected atoms and their symmetry images on one side and the entire structure on the other. (iii): Create H-bonds between all pairs that satisfy the H-bond criteria. Finally, a trajectory of atoms representing hydrogen bonds is created, and analysis tools are used to analyze their concentration profile along the cell z-direction.
3. Results and Discussions
The calculation results of MLCs’ swelling properties, interaction energy, and H-bonds distribution in clay interlayer were analyzed and discussed in this section.
3.1. Hydration Swelling
In this work, the water-adsorbed clay system was subjected to sufficient MD simulation under the NPT ensemble to ensure its thermodynamic potential reached a global minimum, where the system reached an equilibrium state of convergence with the time of MD simulation, as shown in Figure 2. It can be seen that the volume V and density of the clay-water system were close to a stable state at about 200 ps. Additionally, it can also be found from the calculation output file that the energy and temperature of the system also converged within the running time. In actuality, all hydrated clay models shown here with different water contents have been proven to converge. Therefore, the data collected through the 1 ns MD production run was sufficient to sample the structural characteristics. By averaging certain end states, the density and volume of hydrated MLC with 50% Na+ and 50% K+ at the water content of 160 can be obtained as 2.32 g/cm3 and 19125 Å3, respectively. Through the above data and Equation (1), we extracted the balanced clay model and computed its basal spacing d.
To better compare the swelling properties of MLCs, we calculated the relative basal-spacing d of hydrated clay relative to the dry state. Figure 3 presents the relative d-spacings of four types of clay, both mixed and pure, that we have studied as a function of the number of water molecules. It shows that the relative d-spacings gradually increase with hydration. Among them, Na-MMT swells the most, and its curve is not linear. There are three prominent flattened segments with slow growth. Our results for MMT interlayer swelling are very close to the existing experimental and computational results [52,53], which illustrates the reliability of this simulation work and provides a unique interpretation.
The swellings of the I-M MLCs we studied are significantly different from that of pure clay. On the whole, they have a smaller swelling compared to Na-MMT, and the higher the K+ content, the smaller the value. Among them, K-MLC (I-M MLC with 100% K+) has the lowest extent of expansion, and its initial swelling curve is closer to linear. However, when the water content is low (less than 60), the d value of K-MLC is greater than that of other clays. This may be due to the small number of water molecules, which makes it hard to form a hydration shell around the counterions, and the ionic radius of K+, 1.52 Å, is larger than that of Na+, 1.2 Å. Besides, the curve of I-M MLC with 50% Na+ is between Na-MMT and K-MLC and has an intermediate level of swelling. Due to 50% Na+, there are also some flattened segments similar to the Na-MMT. Nevertheless, their starting points are postponed to higher water contents, which may be due to the presence of K+ and their interactions with the asymmetric clay layers. We will return to this soon.
Water adsorption in clays happens in two steps. First, some adsorption happens to form the hydration shell for the counter ions that causes the interlayer expansion. In contrast, in the second step, the increase in the number of water molecules fills up the remaining volume of the interlayer space without much swelling [54]. The flattened part in the swelling curve is the second step. For example, the three flattened segments in the Na-MMT curve correspond to one-layer (1W), two-layer (2W), and three-layer (3W) hydration of the clay, respectively. As shown in Figure 3, although both MLC with 50% Na+ and Na-MMT manifest the aforementioned 1W, 2W, and 3W states, the swelling degree of this MLC is lower, and its flattened states occur at higher water contents. This is because the hydration enthalpy of K+ is much weaker than Na+, so the swelling caused by the hydration shell around the cations is smaller. On the other hand, due to the strong interactions between the mixed ions (Na+ and K+) and the more negatively charged illite tetrahedral layer, this asymmetry in interlayer charge also promotes the delay in transition. Besides, it can also be found that both clays with high Na+ content tend to hydrate to high water contents and continuously swell. However, the swelling effect of K-MLC containing only K+ is very limited. This MLC tends to be stable at the water content of 300, and its expansion is closer to linear. This is because K ions have weak water interactions, and they disturb the existing hydration, so the swelling happens more monotonically.
As mentioned above, many studies have shown that the counterions in clay play significant roles in the swelling of various interlayers. Among them, K+, which has weak hydration and strong interaction with the clay surface, tends to form the attached inner-sphere surface complexes (ISSCs), while Na+ has strong hydration and tends to form the loose outer-sphere surface complexes (OSSCs). By observing the interlayer of hydrated clay, it can be found that the matter distributions of MLCs and pure MMT were also very different. For Na-MMT, the adsorbed water molecules exhibited a strong affinity to Na ions. When the water content was small, sodium ions were adsorbed above the ditrigonal siloxane cavities at the octahedral substitution site. Around the Na+, clustering of water molecules was observed, in which oxygen atoms were found pointing towards Na. Na ions diffused to the middle of the interlayer domain with the increase of adsorbed water and transformed into highly solvated counterions. The oxygen atoms in interlayer water molecules surrounded these Na+ to form the hydration shell and the H-bond network. Meanwhile, it was found that many water molecules were adsorbed on the mineral surface to form the hydration layer and reduced the interactions between clay layers. Since the layer charge of MMT is more concentrated in the octahedral sheet, the weaker ion−surface interactions cause fully hydrated ions and, therefore, more significant swelling than in MLCs.
The ion distribution of MLC with 50% Na+ was very different from that of pure clay. The mixed Na+ and K+ in the interlayer had a strong interaction with the more negatively charged clay surface. When the water content was small, it was observed the K ions in the MLC were mainly adsorbed on the tetrahedral-substituted illite and formed ISSCs, which was consistent with the previous research [55]. While the more strongly hydrated Na+ especially formed ISSCs above the basal oxygen atoms of clay surface, and only a few formed OSSCs. For example, in the double-layer hydration state with a water content of 120, both inner-sphere and outer-sphere surface complexes were observed. Also, since K+ effectively screened the negatively charged surface, the interlayer water molecules tended to be adsorbed on the MMT side and exhibited aggregation around Na+. Overall, the MLCs presented tighter structures than Na-MMT at low water content, thereby yielding smaller basal spacings and more stable clay particles at the macro level. The higher the K + concentration, the more noticeable this phenomenon becomes.
But when the water content became higher, about 300 water molecules forming three hydration layers, the Na+ showed substantial diffusional motion, including ‘hopping’ events, whereas the K+ displayed a more restricted movement due to a stronger interaction with the clay surface than with the mobile water. Therefore, the water molecules and sodium ions formed fully hydrated OSSCs in the interlayer, with about 6–8 water molecules surrounding them. Nevertheless, the K+ was still firmly adsorbed on the illite surface, and about 2–3 water molecules covered it. The phenomenon that only the Na+ component was hydrated explained why the interlayer swelling of MLC with 50% Na+ was between that of pure MMT and K-MLC. Finally, for MLC containing only K ions, illite with stronger surface-ion interaction caused cation accumulation near its surface and formed ISSCs only. The adsorption of K+ increased the hydrophobicity of illite surface. Thus, in the asymmetric I-M interlayer, K+ limited the hydration and controlled the swelling of MLCs. Because potassium ions also have a strong ion exchange capacity and only perturb the water molecules’ location instead of hydration [56], it can be used to inhibit the swelling of sodium-based MLCs.
Our simulations showed I-M MLC was also a swelling-type clay mineral. Even if the moisture content was small, it was sufficient to allow the interlayer to swell. Whereas this swelling mainly occurred in the I-M interlayer and the M-M interlayer with high Na+ content, and its swelling property was less than that of Na-MMT, which continued to osmotic swelling but was greater than the K+-type clay where only crystalline hydration occurred. These properties were related to the relative content of K+ in the interlayer, where the higher the K+ content, the less likely to swell. Therefore, the swelling of MLCs can be predicted by the ratio of K ions to cations, which can be obtained experimentally, and the swelling of the sodium-saturated MLC can also be controlled in engineering by increasing the K+ concentration. It should be emphasized that the deep reason why the interlayer spacing of these clays varied with the cations and the number of contained water molecules was that the swelling force generated by the hydration of cations and clay sheets moderated the inherent interactions in clay. Thus, it was necessary to conduct an in-depth interaction energy analysis for the clay-water system.
3.2. Interaction Energy
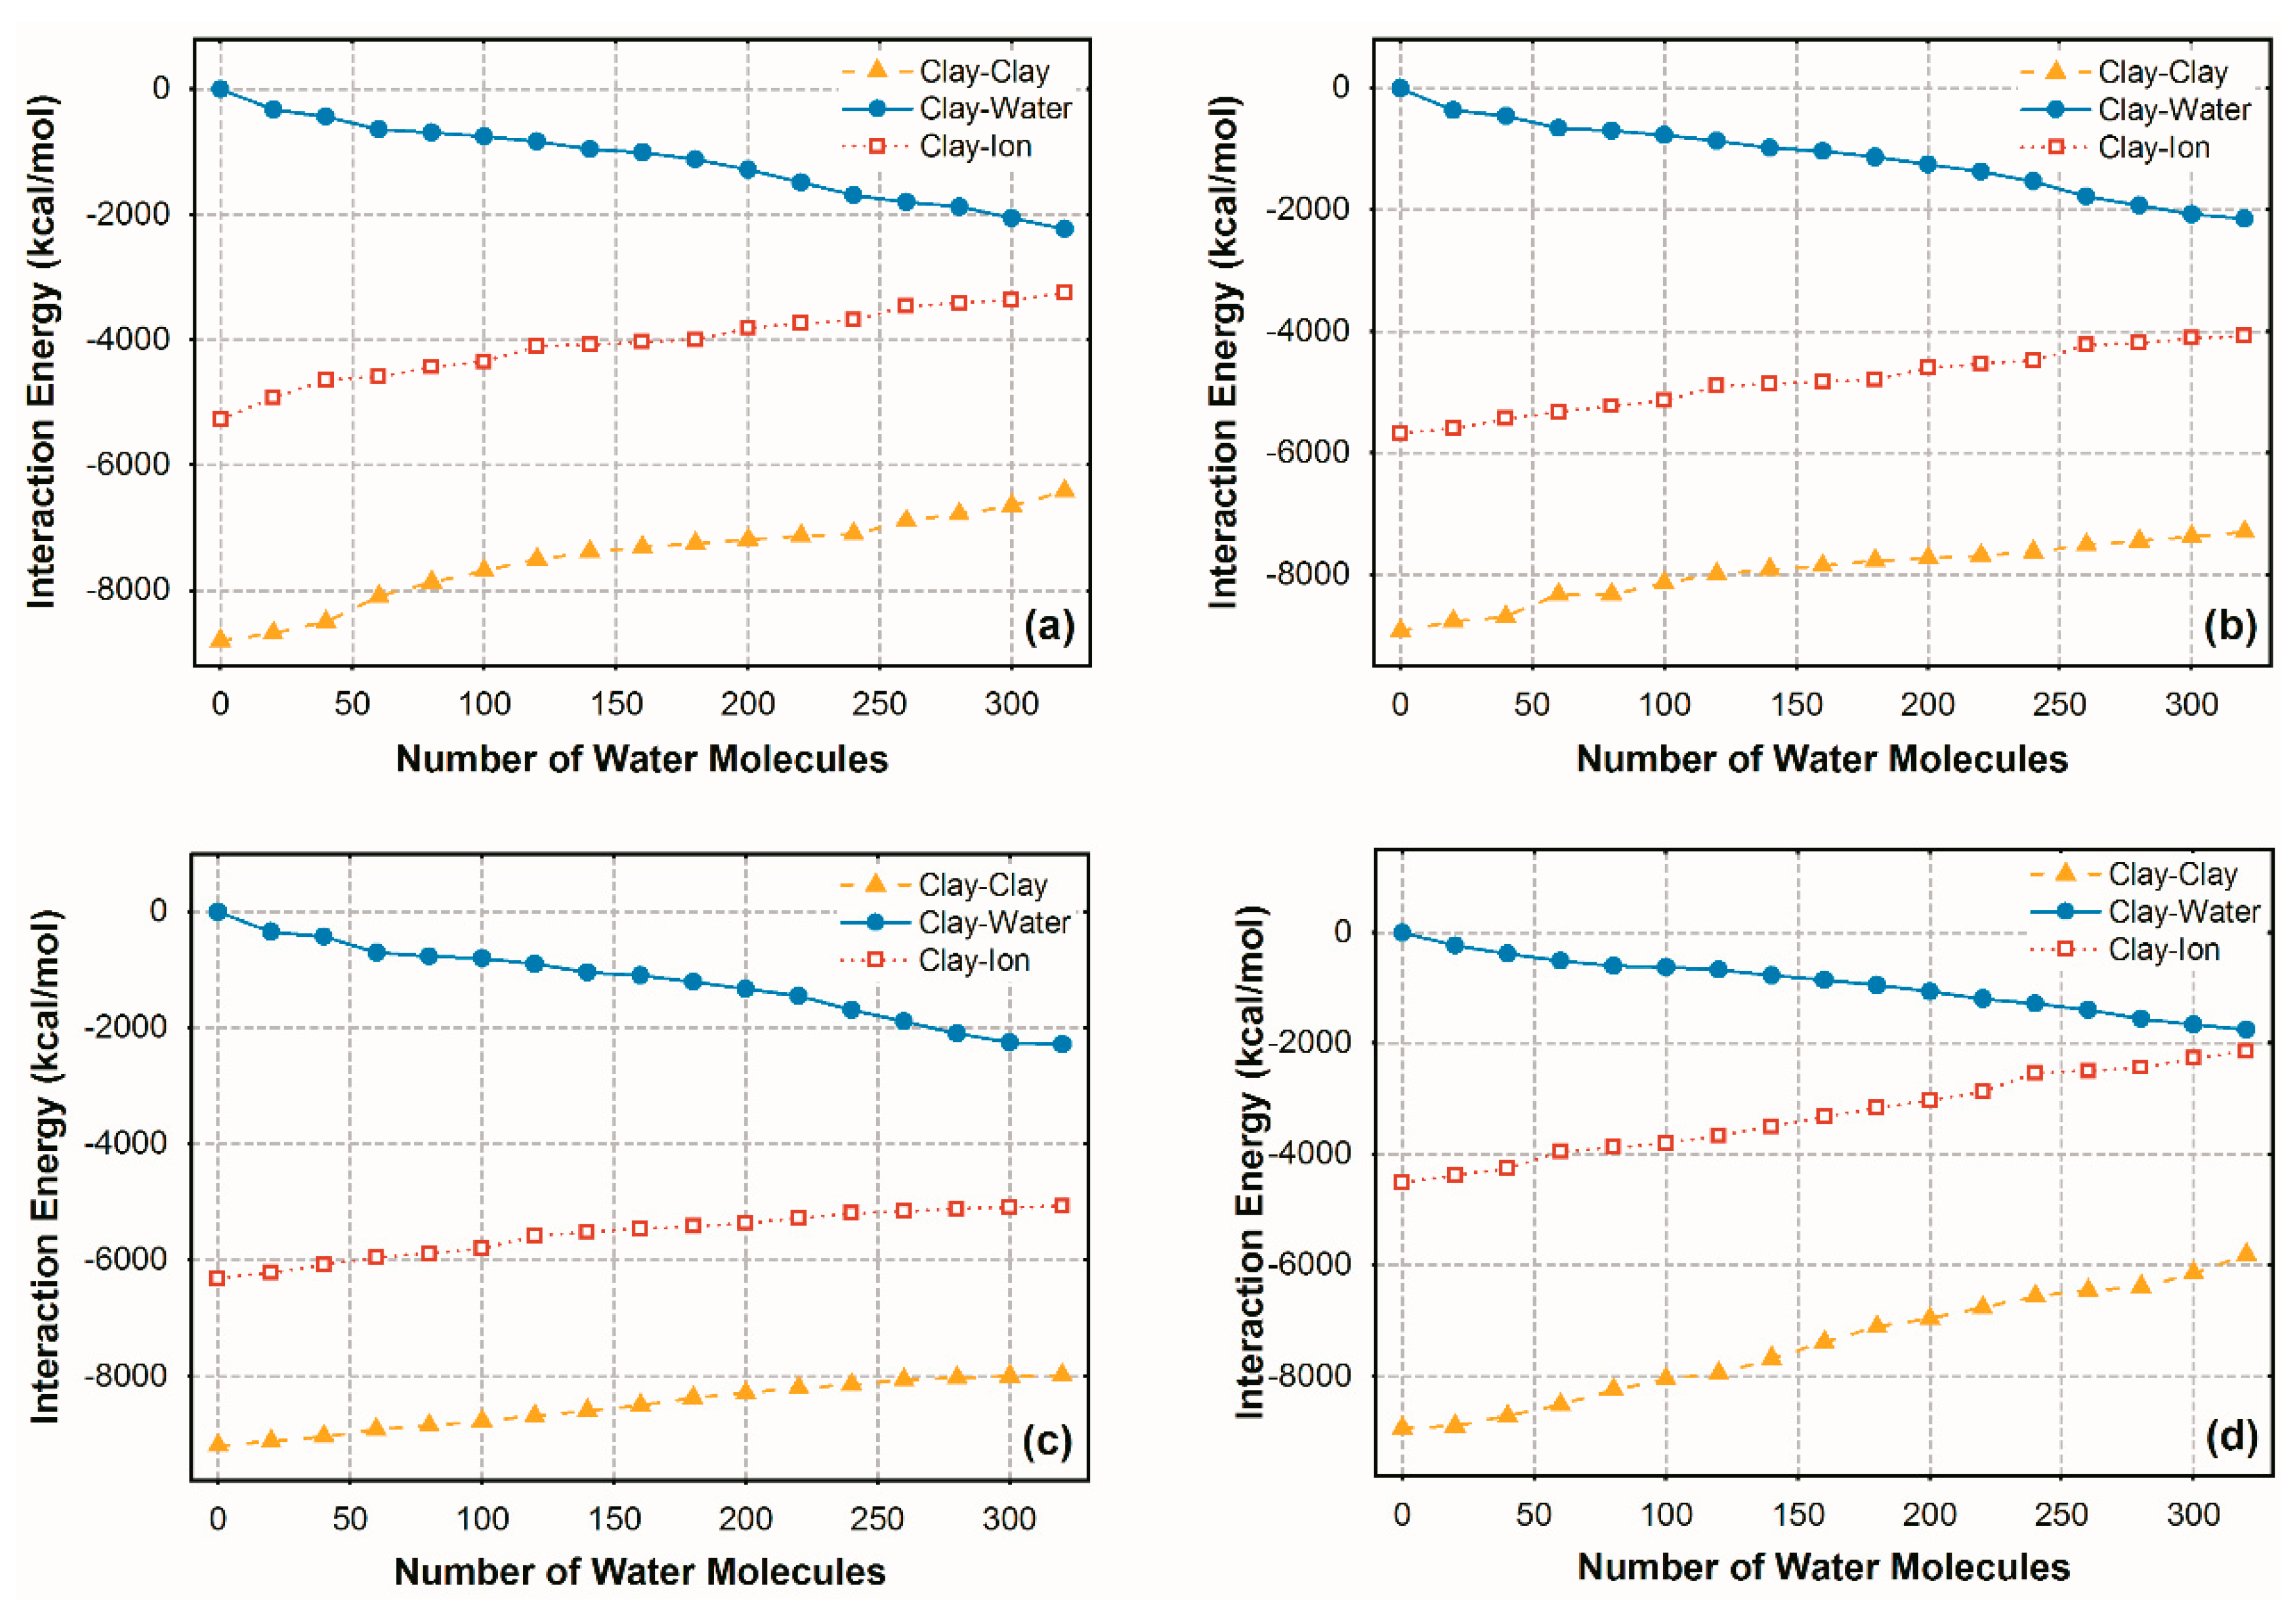
Many studies have shown that the intracrystalline swelling of clay is driven by both the clay sheets’ hydration and the solvation of counterion [57]. The combined effect of swelling force overcomes the attractive interactions in clay and further pushes it apart. Thus, the equilibrium of non-bonding interactions among clay sheets, counterions, and water determines the resultant interlayer spacing. Among them, the interaction energy between any two components in clay-water system is defined as the energy required to separate them. It is obtained by repeatedly calling the energy calculation module in the script, which uses the thermodynamic definition of the calorie, 1 kcal/mol is equivalent to 4.184 kJ/mol. However, the negative interaction energy means attractive interaction in nature, whereas the positive value implies repulsion. Figure 4 shows the interaction energies of four types of clay as a function of water content, obtained through the MD calculations, including clay-clay interaction energy, clay-water interaction energy, and clay-ion interaction energy. These interaction energies have the same trend as a whole: the interaction energy between the clay layers and the interaction energy between the clay layer and cations drop. In contrast, the interaction energy between the clay layer and bound water increases with increasing interlayer water. The clay-clay interaction energy is the largest under the same water content, followed by clay-ion interaction energy (as a result of primarily Columbic interaction), and finally clay-water interaction energy. It should be mentioned that the variation trend of interaction energies for pure MMT is consistent with the study by Kalpana S. Katti et al. [58], which further increases the credibility of these simulated data.
It can also be found that I-M MLC’s energy variation is very different from that of pure MMT in detail. As shown in Figure 4, the variation range of clay-clay interaction energy for MLCs is smaller than that of MMT, and the higher the K+ concentration, the smaller the variation range. Similarly, the variation range of clay-ion interaction energy for MLCs is also smaller than that of MMT, and the higher the K+ concentration, the smaller the range. Also, at the dry state, the clay-ion interaction energy of MLC is also more significant than that of MMT, and the higher the K+ concentration, the greater the interaction energy. When the water content becomes higher, about 300 water molecules, the clay-water interaction energy of MLC is also slightly larger than that of MMT, which may be due to the relatively smaller change in interlayer spacing for MLC. These phenomena all indicate that compared with pure MMT, the interactions in I-M MLCs are more substantial and less likely to swell, and the higher the K+ concentration, the more noticeable this phenomenon.
By observing the structure of the hydrated clay and its interlayer, it can be found that the adjacent clay sheets of MMT were all oxygen-atomic surfaces and the isomorphous substitutions were mainly in the Al-O octahedron. In the dry state, the interaction energy between clay and Na+ was 4513 kcal/mol. The water molecules can easily enter the interlayer and cluster around the Na+ to form the fully hydrated OSSCs and a thick hydration film, resulting in greater swelling force, increased basal spacing, and greater range of clay-clay interaction energy. However, the substitutions of illite in MLCs were mainly in the Si-O tetrahedron, and the resulting negative charge was close to the crystal surface. Therefore, in the dry state, the clay had stronger interaction energy with the K+ adsorbed on it, which was −5770 kcal/mol. Besides, the K+ had limited interactions with water, resulting in the formation of only ISSCs. The smaller interlayer swelling made the variation range of clay-clay interaction energy in MLCs smaller than that of pure MMT. The higher the K+ concentration, the more ISSCs formed, the stronger the attractive interactions between the clay layers, the less likely the interlayer to swell, and the smaller the variation range of clay-clay interaction energy.
It was shown that, for the dry condition, the clay was held together by attractive interactions between the clay layer and cations and between the clay layers. The cations attracted the negatively charged clay layers and maintained them together. For Na+-type clay, with the increase of adsorbed water, the Na+ diffused to the interlayer’s middle domain to form the fully hydrated OSSCs, and the clay-ion interaction energy became weaker. The higher the Na+ concentration, the more OSSCs were formed, and the greater the variation range of interaction energy, which explained why the range of the clay-ion interaction energy for MLC was smaller than that of pure MMT. For MLCs, however, the presence of K+ made the surface repel water, to a certain extent. Due to the strong surface-ion interactions in the mixed interlayer, the variation range of clay-ion interaction energy was smaller, and its value was also significantly greater than that of MMT with more Na+. It was also found that the higher the K+ concentration, the more noticeable this mechanism becomes. However, for MLC with only K+, it was challenging to absorb more water molecules when the water content reached 300, which seemed to be energetically the most stable state.
Our MD simulations also showed that some polar water molecules were bound on clay surfaces during the hydration process and had strong interactions with them, which played a crucial role in clay swelling. As the additional water molecules interacted with the surface, the clay-bound water interaction energy was continuously increased. These energies moderated the attractive energies to hold the stacked structure together and compensated for the drop in attractive interactions between the framework and ions, thereby promoting swelling. However, these increased interactions were smaller than the decrease in clay-clay and clay-ion interactions, which implied that the interactions between ions and water were also the leading cause of the swelling. As more water entered the interlayer, their interactions with the clay surface were saturated to a certain extent, including electrostatic interactions, van der Waals interactions and hydrogen bonds, etc. Only more hydration layers could be formed around the cations, unceasingly pushing the clay sheets apart.
The script was also used to decompose the clay-water interaction energy to gain a detailed understanding of the parameters contributing to clay swelling. It was found that these interactions were the results of electrostatic interaction and Van der Waals interaction. Figure 5 shows the evolution of clay-water interaction energy with increasing water content for MLC with 50% Na+ and 50% K+ and the decomposed Coulomb interaction energy and Van der Waals interaction energy. Among them, the total interaction energy and Coulomb interaction energy are both negative values, representing attractive interactions, and they increase with hydration. However, the Van der Waals interaction energy is positive, that is, repulsive interaction, and it grows approximately linearly. It was found that the variation curve of Coulomb interaction energy is close to that of total interaction energy, and the difference between the two is the Van der Waals interaction energy.
Moreover, the Coulomb interaction energy is always much larger than the Van der Waals interaction energy. For example, when the water content is 120, the total interaction energy of MLC is −840 kcal/mol, which consists of −1023 kcal/mol Coulomb interaction energy and 184 kcal/mol Van der Waals interaction energy. When the water content is 320, the magnitude of total interaction energy is −2229 kcal/mol composed of −2659 kcal/mol Coulomb interaction energy and 430 kcal/mol Van der Waals interaction energy. It can be concluded that the Coulomb interaction plays a major positive role in the hydration of clay sheets. In contrast, the Van der Waals interaction is small but not conducive to the binding of water molecules on the clay surface. The dominance of this Coulomb interaction energy becomes more evident with increased hydration. In addition to these important interaction energies, a large number of hydrogen bonds formed by the tight organization of water on the clay surface and around the cations also play a crucial role in swelling. Hence, understanding these intermolecular interactions in the form of the secondary bond at a fundamental level is essential, including the number and distribution mechanism of hydrogen bonds in clay interlayers.
3.3. Distribution of Hydrogen Bonds
For the study of hydrogen bonds in the clay-water system, the previous related research primarily focused on the number of all H-bonds in the system but ignored the detailed H-bonding interactions between some main components. To this end, we extracted data on the number of hydrogen bonds formed along the z-direction on the clay surface and around the cations to study their distribution mechanism. Two representative water contents corresponding to 120 and 240 (approximately two-layer hydration and three-layer hydration respectively) were selected to study the formation of H-bonds in the clay interlayer. Figure 6 displays the H-bond numbers of the four types of clays, both mixed and pure, that we have studied for the two water contents as a function of the distance along the z-direction. It can be seen that when the water content is 120, the peak of the H-bonds number appears on the clay surface, which is the result of clay-bound water interaction; when the water content increases to 240, the number of hydrogen bonds formed in the interlayer increases. The regularly distributed H-bond layers are also formed around the cations in the interlayer’s middle domain, which are the results of water molecules forming hydration layers around the cations and the strong interactions between them. In addition, the distributions of these hydrogen bonds all shift to varying degrees along the X-axis (the cell z-direction) as the clay swells.
It can also be found that the internal H-bond distribution of MLC is significantly different from that of MMT in detail. For example, the MMT interlayer has the highest H-bond number peaks, and they are evenly distributed among the layers. When the water content is 120, there are three H-bond peaks in the interlayer, indicating that in addition to the two H-bond layers on the clay surface, one H-bond layer is also formed by the interactions between two layers of water molecules. When the water content reaches 240, more hydrogen bonds are included in the interlayer and more concentrated in the middle area, suggesting that many water molecules surround the interlayer Na+ to create the hydration layers of OSSCs. For MLCs, however, the number of hydrogen bonds in the I-M interlayer (at about 10 Å and 30 Å, respectively) is significantly lower than that in the M-M interlayer (at about 20 Å).
In the I-M interlayer of MLC with 50% Na+ and 50% K+, the hydrogen bonds are first concentrated on the illite side with a strong surface charge. As the water content increases, the apparent H-bond networks appear around the Na ions in the interlayer’s middle domain. The distribution of these hydrogen bonds confirms that the water molecules in the I-M interlayer surround the Na+ to form the hydration layers. For the MLC with 75% K+, most of the H-bonds generated by ion-hydration are concentrated in the M-M interlayer. It is difficult for water molecules to form a hydration layer and hydrogen bond network around the I-M interlayer cations. Moreover, in the I-M interlayer of this type of clay, due to the strong interaction of K+ with the clay surface and its weak hydration capacity, water molecules are more adsorbed on the MMT side and form H-bonds with it. This is because the K ions have a shielding effect on the illite charge so that the surface is hydrophobic. Finally, for the MLC containing only K ions, the K+ dominates and limits the interlayer’s swelling, and the distribution of H-bonds in each interlayer is uniform. Since there is no obvious hydration-layer and H-bond network around the cations, it is not easy to absorb more water molecules when the water content reaches 300. Relatively more H-bonds are formed in the M-M interlayer; this is because MMT-K interaction is weaker than that of illite-K, and it is relatively easier to absorb water, thereby forming more H-bonds.
By observing the distribution of internal matter and the H-bond network during the hydration process, it can be found that hydrogen atoms in H2O molecules preferentially formed H-bond coordination with the oxygen atoms on the mineral surface, followed by H-bonding between water molecules. These bound-water H-bonds existed in two different structural environments: (i) in the center of ditrigonal cavities giving two H-bonds to the surface O-atoms and (ii) above the surface oxygen and H-bonded to it by one of its H atoms. Because the charged clay surface adsorbed hydrogen atoms in water and repelled oxygen atoms, the interface water with increased polarization formed an ordered H-bond network. They approximated the arrangement of oxygen atoms on the clay surface. These increased H-bonding interactions are shown in Figure 6 as the significantly sharper hydrogen peaks at the clay surface. It can also be found that the H-bonding strength around Na+ in the clay interlayer was more substantial than that of K+. Strong attractive interactions were observed between the Na+ and water molecules, which caused the clustering of water molecules around Na+, and the creation of the H-bond network between them. At this time, the OSSCs were formed, and the oxygen atoms in water pointed to Na+ under the local electrostatic field. Na-MMT appeared, such that once the hydration shell around Na+ and the H-bond network were formed, swelling continued.
For MLCs, water molecules preferentially formed many H-bonds in the M-M interlayer, followed by the I-M interlayer. In the mixed interlayer, the higher the K+ content, the more difficult it was to form H-bonds. When the K+ content in the I-M interlayer was 50%, the peak of H-bonds on the illite side was higher. This was because the substitutions of illite were closer to the surface, so their H-bonding interactions with water were stronger. Furthermore, the Na+ in the I-M interlayer hydrated with the increase of water content, from the illite surface to the added water, giving rise to OSSCs and H-bond network formation, similar to the M-M interlayer. However, due to the asymmetric interlayer charge and strong illite-ion and illite-water attraction interactions, hydration and swelling were postponed to higher water contents, which further confirmed the section’s conclusion. However, when the K+ content in the I-M interlayer was high, the hydration H-bonds were more concentrated on the MMT side. The K+ was adsorbed near the illite surface, shielding its surface charge and making it hydrophobic, so the H-bonds were more formed on the MMT surface. Coupled with the strong K+-surface interactions and the weak hydration capacity of K+, the interlayer swellings of MLCs were severely restricted.
These MD results quantitatively decipher the complex mechanism and microstructure of adsorbed water in clay interlayers at the molecular scale. They will help disclose underlying changes in dynamics, energy, and intermolecular interaction for widespread MLCs that can hardly be understood from a macro perspective.
4. Conclusions
The MD study of clay with increasing hydration was conducted to compare I-M MLC’s swelling behavior containing K+ and Na+ with Na-MMT. This work captures the evolution of quantified properties such as basal spacing d, interaction energy, and the number of hydrogen bonds in the interlayer of four types of clay with increasing water content and insight into the swelling mechanisms of MLCs. It is found that MLCs have smaller swelling compared to Na-MMT, and the higher its K+ concentration, the less likely it is to hydrate. This is due to the asymmetric interlayer charges and mixed counterions in the I-M interlayer, making the structure more compact. These different swelling behaviors have been observed and explained from the MD perspective.
The in-depth reason for these basal spacing changes is that the swelling forces generated by the hydration of clay sheets and counterions moderate the inherent interaction energy in clay. It is found that the clay-clay interaction energy and clay-ion interaction energy drop, while the clay-water interaction energy increases with increasing hydration. The variation ranges of clay-clay interaction energy and clay-ion interaction energy for MLCs are smaller than that of MMT, while their clay-ion interactions are stronger and less likely to swell. The higher the K+ concentration, the more significant these phenomena are. The micro-mechanisms of these energy changes have been explained from the MD perspective. Among them, the attractive interaction of clay-bound water seriously promotes swelling, and it is mainly composed of Coulomb interaction and Van der Waals interaction. The Coulomb interaction plays a significant positive role in the hydration of clay sheets. In contrast, the Van der Waals interaction is small but not conducive to the binding of water molecules on clay surface. The dominance of this Coulomb interaction energy becomes more obvious with increased hydration.
In addition to these important interaction energies, H-bonds’ number and distribution mechanism in the clay-water system also play a key role in swelling. It is found that the hydrogen atoms in H2O molecules preferentially form H-bonding coordination with the oxygen atoms on the clay surface, followed by H-bonding between the water molecules in the clay interlayer. Unlike the H bonds in Na-MMT, which are evenly distributed among the interlayers, the water in MLCs preferentially forms many H-bonds in the M-M interlayer, followed by the I-M interlayer, and the number is relatively small. Moreover, in the mixed interlayer, the higher the K+ concentration, the more difficult it is to form H-bonds. The different H-bonding formation and distribution mechanisms of MLCs and MMT have been identified from the MD perspective.
This work provides the perception of the molecular mechanism for initial swelling and clay-water interaction in the widespread MLCs. From this study, it will help in disclosing underlying changes in dynamics, energy, and intermolecular interaction for MLC, identifying the specific role of this type of clay in soils, and developing efficient swelling inhibitors to control clay swelling in practical engineering.
Author Contributions
Conceptualization, Y.Y.; methodology, Y.Y.; software, Y.Y.; validation, S.A. and G.X.; formal analysis, S.A.; investigation, G.X. resources, G.X.; writing—original draft preparation, Y.Y.; writing—review and editing, S.A. and G.X.; supervision, G.X.; funding acquisition, G.X. All authors have read and agreed to the published version of the manuscript.
Funding
This research was funded by National Natural Science Foundation of China, grant number 51508200.
Acknowledgments
This research is financially supported by the National Natural Science Foundation of China under Grant 51508200 and 51078151.
Conflicts of Interest
The authors have declared of no conflict of interest.
References
- Karaborni, S.; Smit, B.; Heidug, W.; Urai, J.; Van Oort, E. The swelling of clays: Molecular simulations of the hydration of montmorillonite. Science 1996, 271, 1102–1104. [Google Scholar] [CrossRef] [Green Version]
- Katti, D.R.; Srinivasamurthy, L.; Katti, K.S. Molecular modeling of initiation of interlayer swelling in Na–montmorillonite expansive clay. Can. Geotech. J. 2015, 52, 1385–1395. [Google Scholar] [CrossRef]
- Buzzi, O.; Fityus, S.; Sloan, S.W. Use of expanding polyurethane resin to remediate expansive soil foundations. Can. Geotech. J. 2010, 47, 623–634. [Google Scholar] [CrossRef] [Green Version]
- Anderson, R.L.; Ratcliffe, I.; Greenwell, H.C.; Williams, P.A.; Cliffe, S.; Coveney, P.V. Clay swelling—A challenge in the oilfield. Earth Sci. Rev. 2010, 98, 201–216. [Google Scholar] [CrossRef]
- Amarasinghe, P.M.; Katti, K.S.; Katti, D.R. Insight into role of clay-fluid molecular interactions on permeability and consolidation behavior of Na-montmorillonite swelling clay. J. Geotech. Geoenviron. Eng. 2012, 138, 138–146. [Google Scholar] [CrossRef]
- Brown, G.; MacEwan, D.M.C. The interpretation of X-ray diagrams of soil clays. II. Structures with random interstratification. J. Soil Sci. 1950, 1, 239–253. [Google Scholar] [CrossRef]
- Weaver, C.E. The Distribution and Identification of Mixed-layer Clays in Sedimentary Rocks1. Clays Clay Miner. 1955, 4, 385–386. [Google Scholar] [CrossRef]
- Altaner, S.P.; Ylagan, R.F. Comparison of structural models of mixed-layer illite/smectite and reaction mechanisms of smectite illitization. Clays Clay Miner. 1997, 45, 517–533. [Google Scholar] [CrossRef]
- Jo, H.Y.; Katsumi, T.; Benson, C.H.; Edil, T.B. Hydraulic conductivity and swelling of nonprehydrated GCLs permeated with single-species salt solutions. J. Geotech. Geoenviron. Eng. 2001, 127, 557–567. [Google Scholar] [CrossRef]
- Verwey, E.J.W.; Overbeek, J.T.G. Theory of the stability of lyophobic colloids. J. Colloid Sci. 1955, 10, 224–225. [Google Scholar] [CrossRef] [Green Version]
- Hurst, A. Geochemistry of Clay-Pore Fluid Interactions. Clay Miner. 1993, 28, 657–659. [Google Scholar] [CrossRef]
- Amarasinghe, P.M.; Katti, K.S.; Katti, D.R. Nature of organic fluid-montmorillonite interactions: An FTIR spectroscopic study. J. Colloid Interface Sci. 2009, 337, 97–105. [Google Scholar] [CrossRef]
- Katti, D.R.; Shanmugasundaram, V. Influence of swelling on the microstructure of expansive clays. Can. Geotech. J. 2001, 38, 175–182. [Google Scholar] [CrossRef]
- Underwood, T.; Erastova, V.; Greenwell, H.C. Ion adsorption at clay-mineral surfaces: The Hofmeister series for hydrated smectite minerals. Clays Clay Miner. 2016, 64, 472–487. [Google Scholar] [CrossRef] [Green Version]
- Diaz-Perez, A.; Cortes-Monroy, I.; Roegiers, J.C. The role of water/clay interaction in the shale characterization. J. Pet. Sci. Eng. 2007, 58, 83–98. [Google Scholar] [CrossRef]
- Marry, V.; Dubois, E.; Malikova, N.; Breu, J.; Haussler, W. Anisotropy of water dynamics in clays: Insights from molecular simulations for experimental QENS analysis. J. Phys. Chem. C 2013, 117, 15106–15115. [Google Scholar] [CrossRef]
- Rahromostaqim, M.; Sahimi, M. Molecular Dynamics Study of the Effect of Layer Charge and Interlayer Cations on Swelling of Mixed-Layer Chlorite–Montmorillonite Clays. J. Phys. Chem. C 2020, 124, 2553–2561. [Google Scholar] [CrossRef]
- Kalo, H.; Milius, W.; Breu, J. Single crystal structure refinement of one- and two-layer hydrates of sodium fluorohectorite. Z. Anorg. Allg. Chem. 2012, 2, 8452–8459. [Google Scholar] [CrossRef]
- Anderson, M.T.; Lu, N. Role of microscopic physicochemical forces in large volumetric strains for clay sediments. J. Eng. Mech. 2001, 127, 710–719. [Google Scholar] [CrossRef]
- Anandarajah, A. Mechanism controlling permeability change in clays due to changes in pore fluid. J. Geotech. Geoenviron. Eng. 2003, 129, 163–172. [Google Scholar] [CrossRef]
- Jeanmairet, G.; Marry, V.; Levesque, M.; Rotenberg, B.; Borgis, D. Hydration of clays at the molecular scale: The promising perspective of classical density functional theory. Mol. Phys. 2014, 112, 1320–1329. [Google Scholar] [CrossRef] [Green Version]
- Liu, X.; Lu, X.; Wang, R.; Zhou, H. Effects of layer-charge distribution on the thermodynamic and microscopic properties of Cs-smectite. Geochim. Cosmochim. Acta 2008, 72, 1837–1847. [Google Scholar] [CrossRef]
- Ai, Y.; Zhao, C.; Sun, L.; Wang, X.; Liang, L. Coagulation mechanisms of humic acid in metal ions solution under different pH conditions: A molecular dynamics simulation. Sci. Total Environ. 2020, 702, 135072. [Google Scholar] [CrossRef]
- Zhang, C.; Liu, Z.; Deng, P. Using molecular dynamics to unravel phase composition behavior of nano-size pores in frozen soils: Does Young–Laplace equation apply in low temperature range? Can. Geotech. J. 2018, 55, 1144–1153. [Google Scholar] [CrossRef]
- Zhang, B.; Kang, J.; Kang, T. Effect of water on methane adsorption on the kaolinite (0 0 1) surface based on molecular simulations. Appl. Surf. Sci. 2018, 439, 792–800. [Google Scholar] [CrossRef]
- Yang, Y.; Adhikari, S.; Xu, G. Molecular simulation to discover rheological properties and soil-binding ability of PHPA polymer on montmorillonite surface. Surf. Interface Anal. 2020, 52, 665–675. [Google Scholar] [CrossRef]
- Hantal, G.; Brochard, L.; Laubie, H.; Ebrahimi, D.; Pellenq, R.J.M.; Ulm, F.J.; Coasne, B. Atomic-scale modelling of elastic and failure properties of clays. Mol. Phys. 2014, 112, 1294–1305. [Google Scholar] [CrossRef]
- Hensen, E.J.M.; Smit, B. Why clays swell. J. Phys. Chem. B 2002, 106, 12664–12667. [Google Scholar] [CrossRef] [Green Version]
- Lau, D.; Jian, W.; Yu, Z.; Hui, D. Nano-engineering of construction materials using molecular dynamics simulations: Prospects and challenges. Compos. Part B Eng. 2018, 143, 282–291. [Google Scholar] [CrossRef]
- Teich-McGoldrick, S.L.; Greathouse, J.A.; Jove-Colon, C.F.; Cygan, R.T. Swelling properties of montmorillonite and beidellite clay minerals from molecular simulation: Comparison of temperature, interlayer cation, and charge location effects. J. Phys. Chem. C 2015, 119, 20880–20891. [Google Scholar] [CrossRef]
- Rotenberg, B.; Marry, V.; Vuilleumier, R.; Malikova, N.; Simon, C.; Turq, P. Water and ions in clays: Unraveling the interlayer/micropore exchange using molecular dynamics. Geochim. Cosmochim. Acta 2007, 71, 5089–5101. [Google Scholar] [CrossRef]
- Rahromostaqim, M.; Sahimi, M. Molecular dynamics simulation of hydration and swelling of mixed-layer clays. J. Phys. Chem. C 2018, 122, 14631–14639. [Google Scholar] [CrossRef]
- Morrow, C.P.; Yazaydin, A.O.; Krishnan, M.; Bowers, G.M.; Kalinichev, A.G.; Kirkpatrick, R.J. Structure, energetics, and dynamics of smectite clay interlayer hydration: Molecular dynamics and metadynamics investigation of Na-hectorite. J. Phys. Chem. C 2013, 117, 5172–5187. [Google Scholar] [CrossRef] [Green Version]
- Asay, D.B.; Kim, S.H. Evolution of the adsorbed water layer structure on silicon oxide at room temperature. J. Phys. Chem. B 2005, 109, 16760–16763. [Google Scholar] [CrossRef]
- Reynolds, R.C.; Hower, J. The nature of interlayering in mixed-layer illite-montmorillonites. Clays Clay Miner. 1970, 18, 25–36. [Google Scholar] [CrossRef]
- Downs, R.T.; Hall-Wallace, M. The American Mineralogist crystal structure database. Am. Mineral. 2003, 88, 247–250. [Google Scholar]
- Viani, A.; Gualtieri, A.F.; Artioli, G. The nature of disorder in montmorillonite by simulation of X-ray powder patterns. Am. Mineral. 2002, 87, 966–975. [Google Scholar] [CrossRef]
- Carrier, B.; Wang, L.; Vandamme, M.; Pellenq, R.J.M.; Bornert, M.; Tanguy, A.; Van Damme, H. ESEM study of the humidity-induced swelling of clay film. Langmuir 2013, 29, 12823–12833. [Google Scholar] [CrossRef] [PubMed]
- Segad, M.; Jonsson, B.; Åkesson, T.; Cabane, B. Ca/Na montmorillonite: Structure, forces and swelling properties. Langmuir 2010, 26, 5782–5790. [Google Scholar] [CrossRef] [PubMed]
- Salles, F.; Douillard, J.M.; Bildstein, O.; Van Damme, H. Impact of the substitution distribution and the interlayer distance on both the surface energy and the hydration energy for Pb-montmorillonite. Appl. Clay Sci. 2011, 53, 379–385. [Google Scholar] [CrossRef] [Green Version]
- Salles, F.; Bildstein, O.; Douillard, J.M.; Jullien, M.; Raynal, J.; Van Damme, H. On the cation dependence of interlamellar and interparticular water and swelling in smectite clays. Langmuir 2010, 26, 5028–5037. [Google Scholar] [CrossRef] [PubMed]
- Cygan, R.T.; Liang, J.J.; Kalinichev, A.G. Molecular models of hydroxide, oxyhydroxide, and clay phases and the development of a general force field. J. Phys. Chem. B 2004, 108, 1255–1266. [Google Scholar] [CrossRef]
- Liu, X.; Lu, X.; Wang, R.; Zhou, H.; Xu, S. Molecular dynamics insight into the cointercalation of hexadecyltrimethyl-ammonium and acetate ions into smectites. Am. Mineral. 2009, 94, 143–150. [Google Scholar] [CrossRef]
- Carrier, B.; Vandamme, M.; Pellenq, R.J.M.; Van Damme, H. Elastic properties of swelling clay particles at finite temperature upon hydration. J. Phys. Chem. C 2014, 118, 8933–8943. [Google Scholar] [CrossRef]
- Neelov, A.; Holm, C. Interlaced P3M algorithm with analytical and ik-differentiation. J. Chem. Phys. 2010, 132, 234103. [Google Scholar] [CrossRef] [PubMed]
- Leimkuhler, B.; Noorizadeh, E.; Penrose, O. Comparing the efficiencies of stochastic isothermal molecular dynamics methods. J. Stat. Phys. 2011, 143, 921–942. [Google Scholar] [CrossRef]
- Zhang, L.; Lu, X.; Liu, X.; Zhou, J.; Zhou, H. Hydration and mobility of interlayer ions of (Na X, Ca Y)-montmorillonite: A molecular dynamics study. J. Phys. Chem. C 2014, 118, 29811–29821. [Google Scholar] [CrossRef]
- Xu, Y.; Liu, Y.L.; He, D.D.; Liu, G.S. Adsorption of cationic collectors and water on muscovite (0 0 1) surface: A molecular dynamics simulation study. Miner. Eng. 2013, 53, 101–107. [Google Scholar] [CrossRef]
- Luzar, A.; Chandler, D. Hydrogen-bond kinetics in liquid water. Nature 1996, 379, 55–57. [Google Scholar] [CrossRef]
- Luzar, A.; Chandler, D. Effect of environment on hydrogen bond dynamics in liquid water. Phys. Rev. Lett. 1996, 76, 928. [Google Scholar] [CrossRef]
- Durrant, J.D.; McCammon, J.A. HBonanza: A computer algorithm for molecular-dynamics-trajectory hydrogen-bond analysis. J. Mol. Graph. Model. 2011, 31, 5–9. [Google Scholar] [CrossRef] [Green Version]
- Bowers, G.M.; Bish, D.L.; Kirkpatrick, R.J. H2O and cation structure and dynamics in expandable clays: 2H and 39K NMR investigations of hectorite. J. Phys. Chem. C 2008, 112, 6430–6438. [Google Scholar] [CrossRef]
- Ngouana, W.B.F.; Kalinichev, A.G. Structural arrangements of isomorphic substitutions in smectites: Molecular simulation of the swelling properties, interlayer structure, and dynamics of hydrated Cs–montmorillonite revisited with new clay models. J. Phys. Chem. C 2014, 118, 12758–12773. [Google Scholar] [CrossRef]
- Cases, J.M.; Bérend, I.; Besson, G.; Francois, M.; Uriot, J.P.; Thomas, F.; Poirier, J.E. Mechanism of adsorption and desorption of water vapor by homoionic montmorillonite. 1. The sodium-exchanged form. Langmuir 1992, 8, 2730–2739. [Google Scholar] [CrossRef]
- Lammers, L.N.; Bourg, I.C.; Okumura, M.; Kolluri, K.; Sposito, G.; Machida, M. Molecular dynamics simulations of cesium adsorption on illite nanoparticles. J. Colloid Interface Sci. 2017, 490, 608–620. [Google Scholar] [CrossRef] [PubMed] [Green Version]
- Liu, X.D.; Lu, X.C. A thermodynamic understanding of clay-swelling inhibition by potassium ions. Angew. Chem. Int. Ed. 2006, 45, 6300–6303. [Google Scholar] [CrossRef]
- Boek, E.S. Molecular dynamics simulations of interlayer structure and mobility in hydrated Li-, Na- and K-montmorillonite clays. Mol. Phys. 2014, 112, 1472–1483. [Google Scholar] [CrossRef]
- Pradhan, S.M.; Katti, K.S.; Katti, D.R. Evolution of molecular interactions in the interlayer of Na-montmorillonite swelling clay with increasing hydration. Int. J. Geomech. 2015, 15, 04014073. [Google Scholar] [CrossRef]
Figure 1.
Snapshot of the molecular model of the hydrated mixed layer clay with 50% Na+ and 50% K+.

Figure 2.
Density and cell volume as a function of NPT simulation time for MLC with 50% Na+ and 50% K+ at the water content of 160.
Figure 2.
Density and cell volume as a function of NPT simulation time for MLC with 50% Na+ and 50% K+ at the water content of 160.

Figure 3.
Comparison of the relative d-spacing as a function of the water content for I−MMT MLC with 50% Na+ and 50% K+ (yellow), I−MMT MLC with 75% K+ and 25% Na+ (gray), I−MMT MLC with K+ only (blue), and MMT−MMT with Na+ only (red).
Figure 3.
Comparison of the relative d-spacing as a function of the water content for I−MMT MLC with 50% Na+ and 50% K+ (yellow), I−MMT MLC with 75% K+ and 25% Na+ (gray), I−MMT MLC with K+ only (blue), and MMT−MMT with Na+ only (red).

Figure 4.
Evolution of interaction energies with increasing water content for four types of clay; (a) I-MMT with 50% Na+ and 50% K+; (b) I-MMT with 25% Na+ and 75% K+; (c) I-MMT with K+ only; (d) MMT-MMT with Na+ only. The results for clay-clay interaction energy are represented by yellow, clay-water interaction energy by blue, and clay-ion interaction energy by red; negative values of interaction energies indicate attractive interactions.

Figure 5.
Evolution of clay-water interaction energy (blue) and the decomposed Coulomb interaction energy (gray) and Van der Waals interaction energy (red) with increasing water content for MLC with 50% Na+ and 50% K+.
Figure 5.
Evolution of clay-water interaction energy (blue) and the decomposed Coulomb interaction energy (gray) and Van der Waals interaction energy (red) with increasing water content for MLC with 50% Na+ and 50% K+.

Figure 6.
The number of hydrogen bonds along the cell z-direction at the water content of 120 (gray) and 240 (blue) for four types of clay; (a) I-MMT with 50% Na+ and 50% K+; (b) I-MMT with 25% Na+ and 75% K+; (c) I-MMT with K+ only; (d) MMT-MMT with Na+ only.
Figure 6.
The number of hydrogen bonds along the cell z-direction at the water content of 120 (gray) and 240 (blue) for four types of clay; (a) I-MMT with 50% Na+ and 50% K+; (b) I-MMT with 25% Na+ and 75% K+; (c) I-MMT with K+ only; (d) MMT-MMT with Na+ only.

Publisher’s Note: MDPI stays neutral with regard to jurisdictional claims in published maps and institutional affiliations. |
© 2021 by the authors. Licensee MDPI, Basel, Switzerland. This article is an open access article distributed under the terms and conditions of the Creative Commons Attribution (CC BY) license (https://creativecommons.org/licenses/by/4.0/).
Share and Cite
MDPI and ACS Style
Yang, Y.; Adhikari, S.; Xu, G. Molecular Dynamics Simulation in the Interlayer of Mixed-Layer Clays Due to Hydration and Swelling Mechanism. Crystals 2021, 11, 586. https://0-doi-org.brum.beds.ac.uk/10.3390/cryst11060586
AMA Style
Yang Y, Adhikari S, Xu G. Molecular Dynamics Simulation in the Interlayer of Mixed-Layer Clays Due to Hydration and Swelling Mechanism. Crystals. 2021; 11(6):586. https://0-doi-org.brum.beds.ac.uk/10.3390/cryst11060586
Chicago/Turabian StyleYang, Yu, Sanjeev Adhikari, and Guoyuan Xu. 2021. "Molecular Dynamics Simulation in the Interlayer of Mixed-Layer Clays Due to Hydration and Swelling Mechanism" Crystals 11, no. 6: 586. https://0-doi-org.brum.beds.ac.uk/10.3390/cryst11060586
Note that from the first issue of 2016, this journal uses article numbers instead of page numbers. See further details here.