Article

Experiments and Mechanical Simulation on Bubble Concrete: Studies on the Effects of Shape and Position of Hollow Bodies Mixed in Concrete

1
Department of Civil and Architectural Engineering, Kyushu Institute of Technology, Kitakyushu 804-8550, Japan
2
College of Civil Engineering, Fuzhou University, Fuzhou 350108, China
3
Department of Civil and Environmental Engineering, University Technology PETRONAS (U.T.P.), Bandar Seri Iskandar 32610, Malaysia
*
Author to whom correspondence should be addressed.
Submission received: 28 June 2021 / Revised: 16 July 2021 / Accepted: 20 July 2021 / Published: 23 July 2021

Abstract

:
This paper proposes a new type of lightweight concrete called bubble concrete, which was developed by mixing concrete with high-strength hollow bodies. In the present study, concave and spherical steel hollow bodies were used not only to form multiple cavities in the concrete but also to transfer internal stresses. Through compression tests, the shape effects and distribution effects of the hollow bodies on the strength and Young’s modulus of concrete were investigated. In addition, the mechanical characteristics of the bubble concrete were simulated by nonlinear elastoplastic finite element analysis to study the stress distribution and failure mechanism. The results indicate that with the proper combination, bubble concrete can reduce its density to 1.971–2.003 g/cm3 (83.3–84.7%, compared to control concrete) and its strength reaches 27.536–28.954 N/mm2.

1. Introduction

Lightweight concrete is characterized by low density, excellent thermal insulation, and good seismic performance, which have made it an increasingly popular building structure material in the world. Light aggregate concrete is considered as one of the most predominant types of lightweight concrete, which has been the subject of a lot of researches [1,2,3,4,5,6,7]. Currently, lightweight aggregates used in structural lightweight concrete are typically expanded shale, clay, or slate materials fired in a rotary kiln to develop a porous structure. Other products such as air-cooled blast furnace slag are also used. Materials such as clay, perlite, or vermiculite are convenient starting materials for the production of lightweight aggregates. A well-known lightweight aggregate with a very low apparent density and closed porosity is produced from glass by a foaming process [8].
In the previous studies, author Pei-Shan Chen proposed a new type of lightweight concrete inspired by hollow bird bones, which is formed by mixing high-strength hollow bodies into the concrete, and named it bubble concrete [9,10,11,12]. The bubble concrete is different from foamed concrete and biaxial voided concrete slabs [13,14,15,16,17], because the hollow bodies not only create multiple cavities inside the concrete but also transmit stresses. The schematic diagram of bubble concrete is shown in Figure 1. The bubble concrete can reduce the density of concrete, improve the thermal insulation performance, and reduce the impact of seismic load on the concrete structure while ensuring the strength and Young’s modulus of concrete material. As this is a novel solution for lightweight concrete, authors have tried to extend it to other fields, for example, shipbuilding, metal materials, aerospace materials, etc.
As a novel lightweight concrete material, pioneering research has been carried out [18,19,20]. However, the understanding of the mechanical properties and stress distribution of bubble concrete is lacking. In previous studies, authors studied the bubble concrete with different hollow body materials. The study results showed that the shape and position of the hollow bodies would affect the strength and stress distribution of the bubble concrete. Therefore, this study aims to investigate the effect of the shape and position of the hollow bodies on the strength and Young’s modulus of the bubble concrete. Consequently, a suitable hollow body model to improve the concrete performances can be found.
In this study, the authors firstly investigate the stress distribution of bubble concrete with a single sphere and single cubic concave body to explore the effect of hollow body shape on strength. Then, the authors study the bubble concrete using multiple spheres and multiple cubic concave surfaces to analyze the relationship between concrete density, Young’s modulus, and compressive strength. Moreover, numerical simulations are performed for the proposed concrete with nonlinear finite element elastoplastic analysis, and the stress distribution inside the concrete is also analyzed.
In addition, because the density of hollow bodies is less than that of concrete, the hollow bodies may float on the top of the mold and aggregate during the production of concrete specimens, which affects the experimental results [21,22,23]. Therefore, this paper also reports the research on the fixed position of the hollow bodies to explore the position’s influence on the bubble concrete compressive strength.

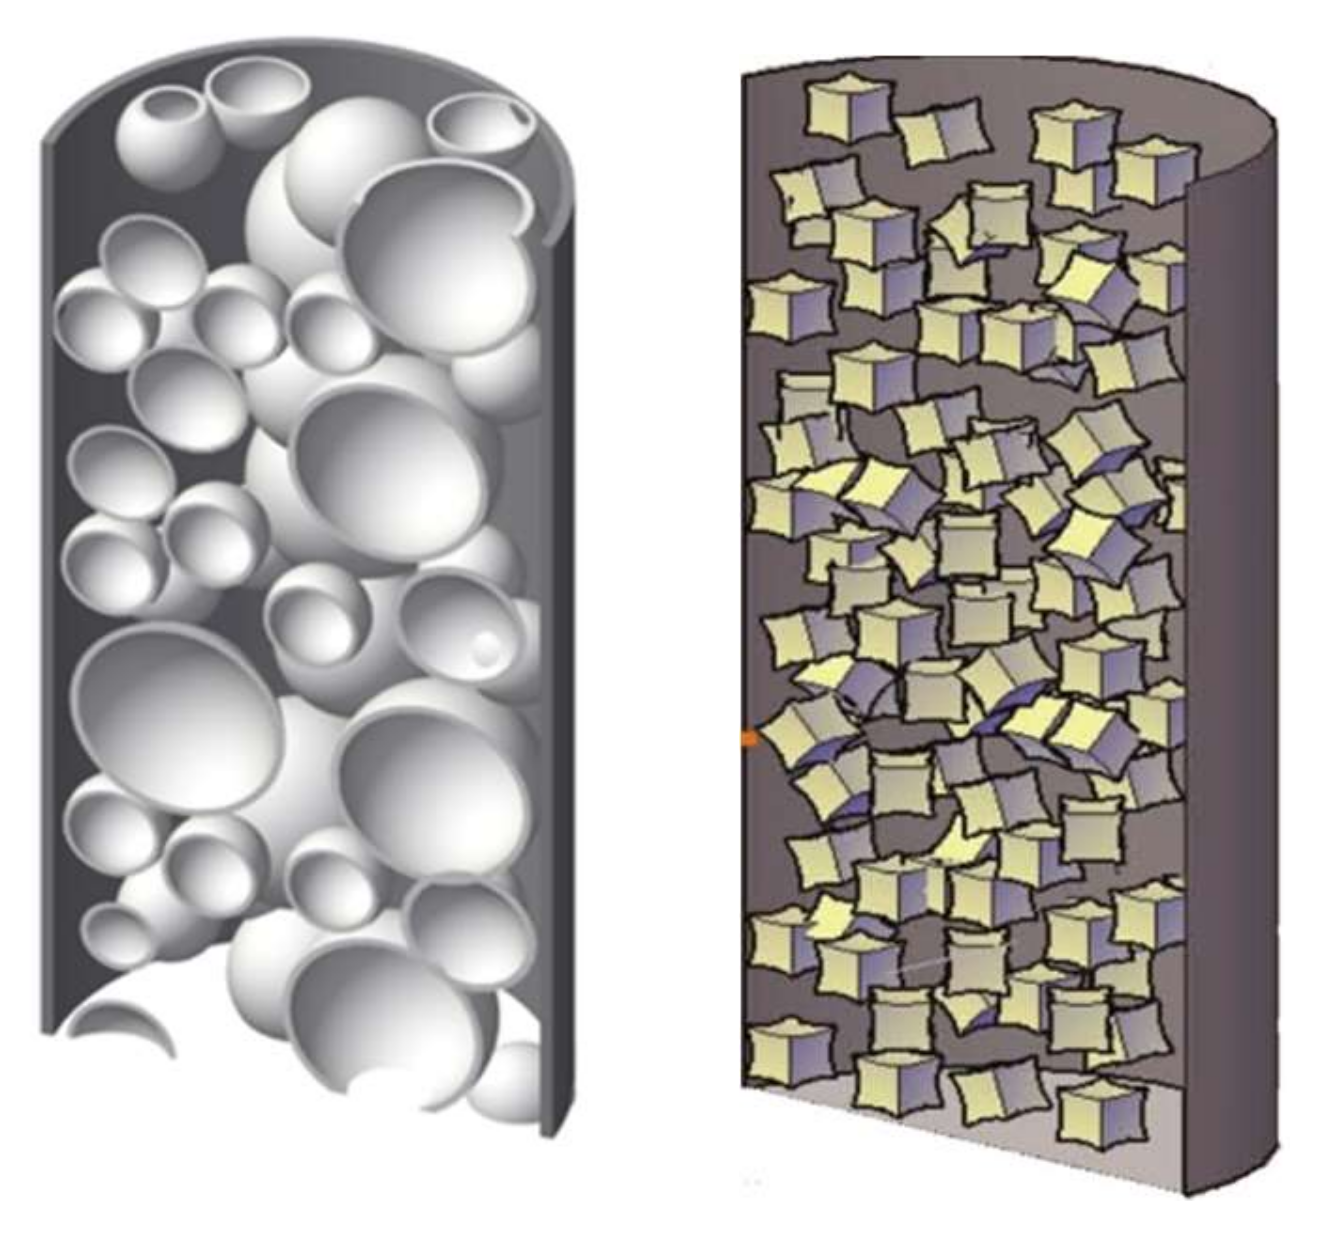
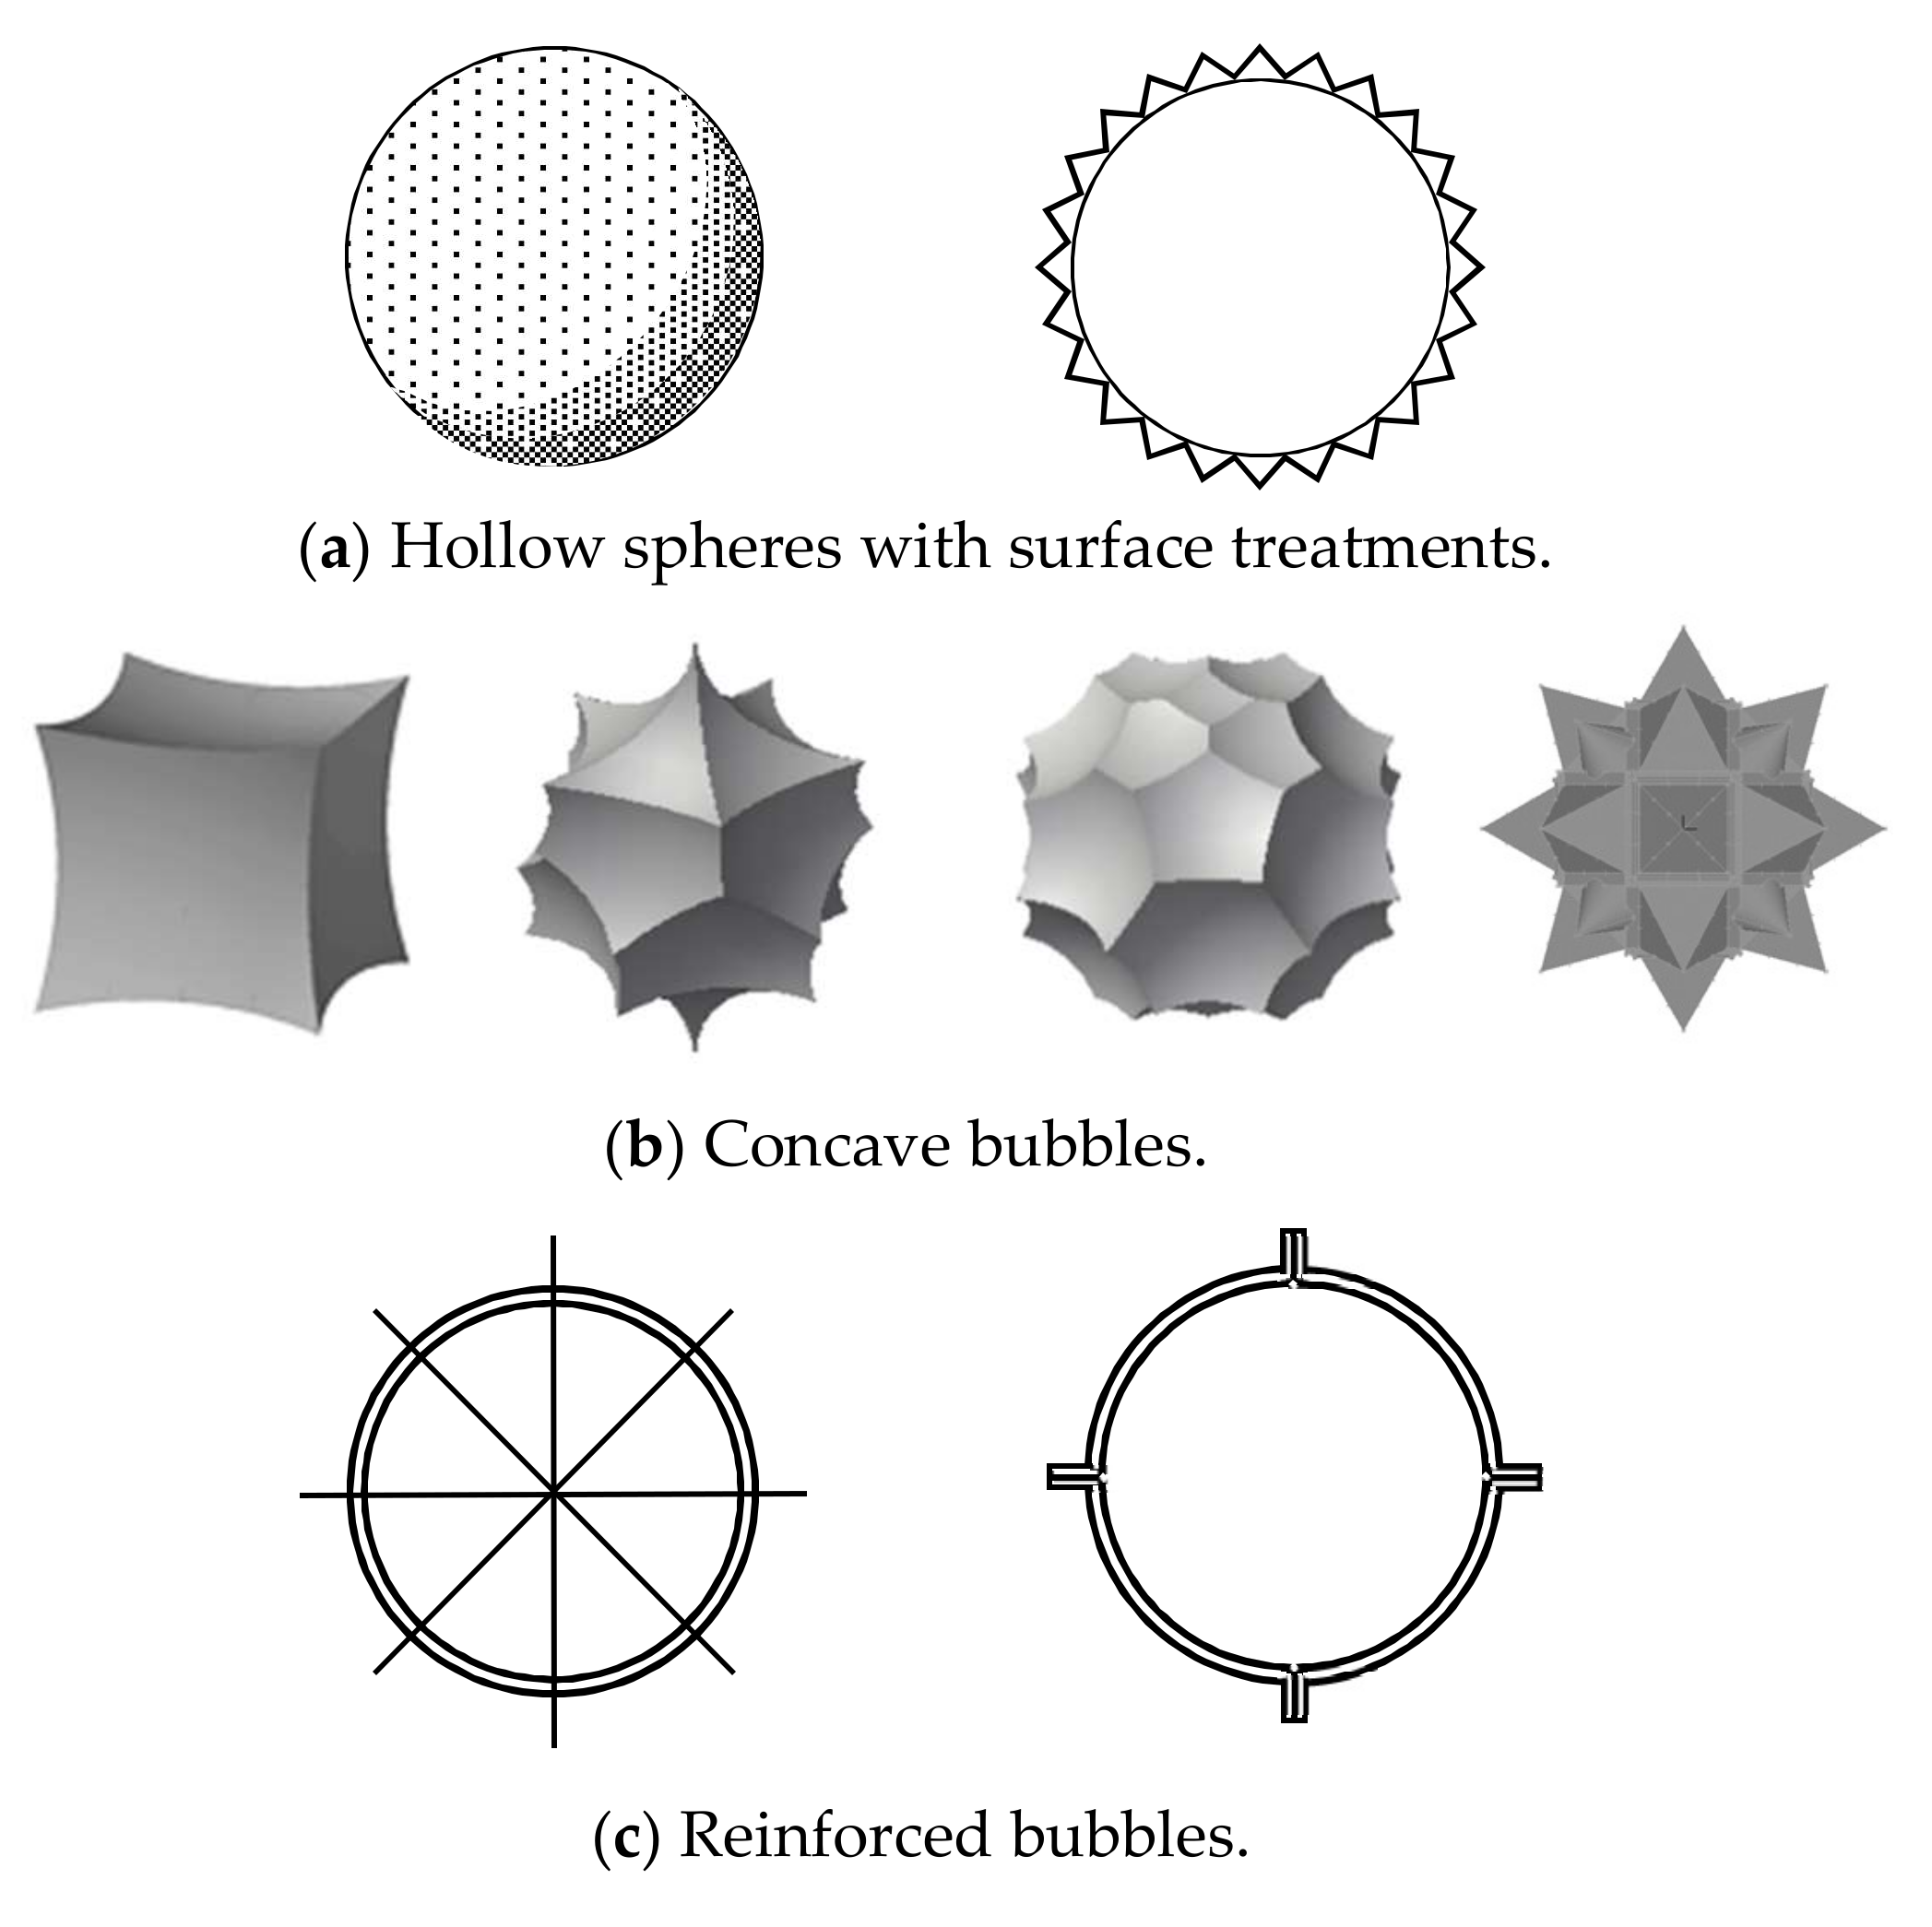
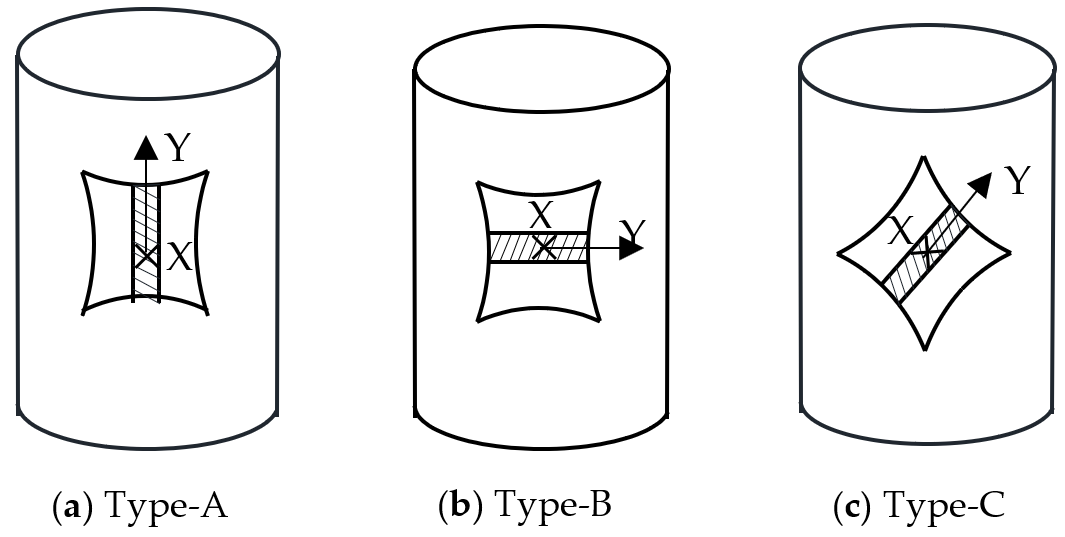
2. Fundamental Principle and Hollow Body Shapes

Under normal circumstances, cavities in lightweight concrete will reduce the effective cross-sectional area for internal stress transmission. Furthermore, multiple cavities can also lead to cracks when the concrete is stressed, thus reducing the strength of the concrete. However, the high-strength hollow bodies in the bubble concrete can provide an effective cross-sectional area to transmit stress. Moreover, with the contact between the concrete and the hollow bodies, it is possible to provide adhesion and avoid premature failure of the concrete.
The shape and material adhesion of the hollow bodies significantly affect the strength of the bubble concrete, therefore, hollow body shapes in various approaches have been considered, as shown in Figure 2. Among them, Figure 2a indicates the roughening surface of the hollow bodies to increase the adhesion of the hollow body to the concrete, Figure 2b illustrates the inner concave hollow bodies to reduce the lateral expansion of the hollow bodies, and Figure 2c shows the hollow body using the wires and/or ribs to enhance the compressive strength.
In previous studies, the shape of the hollow body was mainly spherical, but the sphere will expand outwards, resulting in a decrease in the ultimate strength of the concrete [9]. Therefore, the concave hollow body used in this concurrent study is used to solve this problem. When the cubic concave body is subjected to compressive stresses, its unique shape mechanism can be used to produce inward compression and reduce the extrusion of the hollow body to the surrounding concrete.

3. Mechanical Features of a Single Hollow Body

In this section, the stress distribution of a single sphere and cubic concave body are studied by concrete compression experiments and numerical simulations.

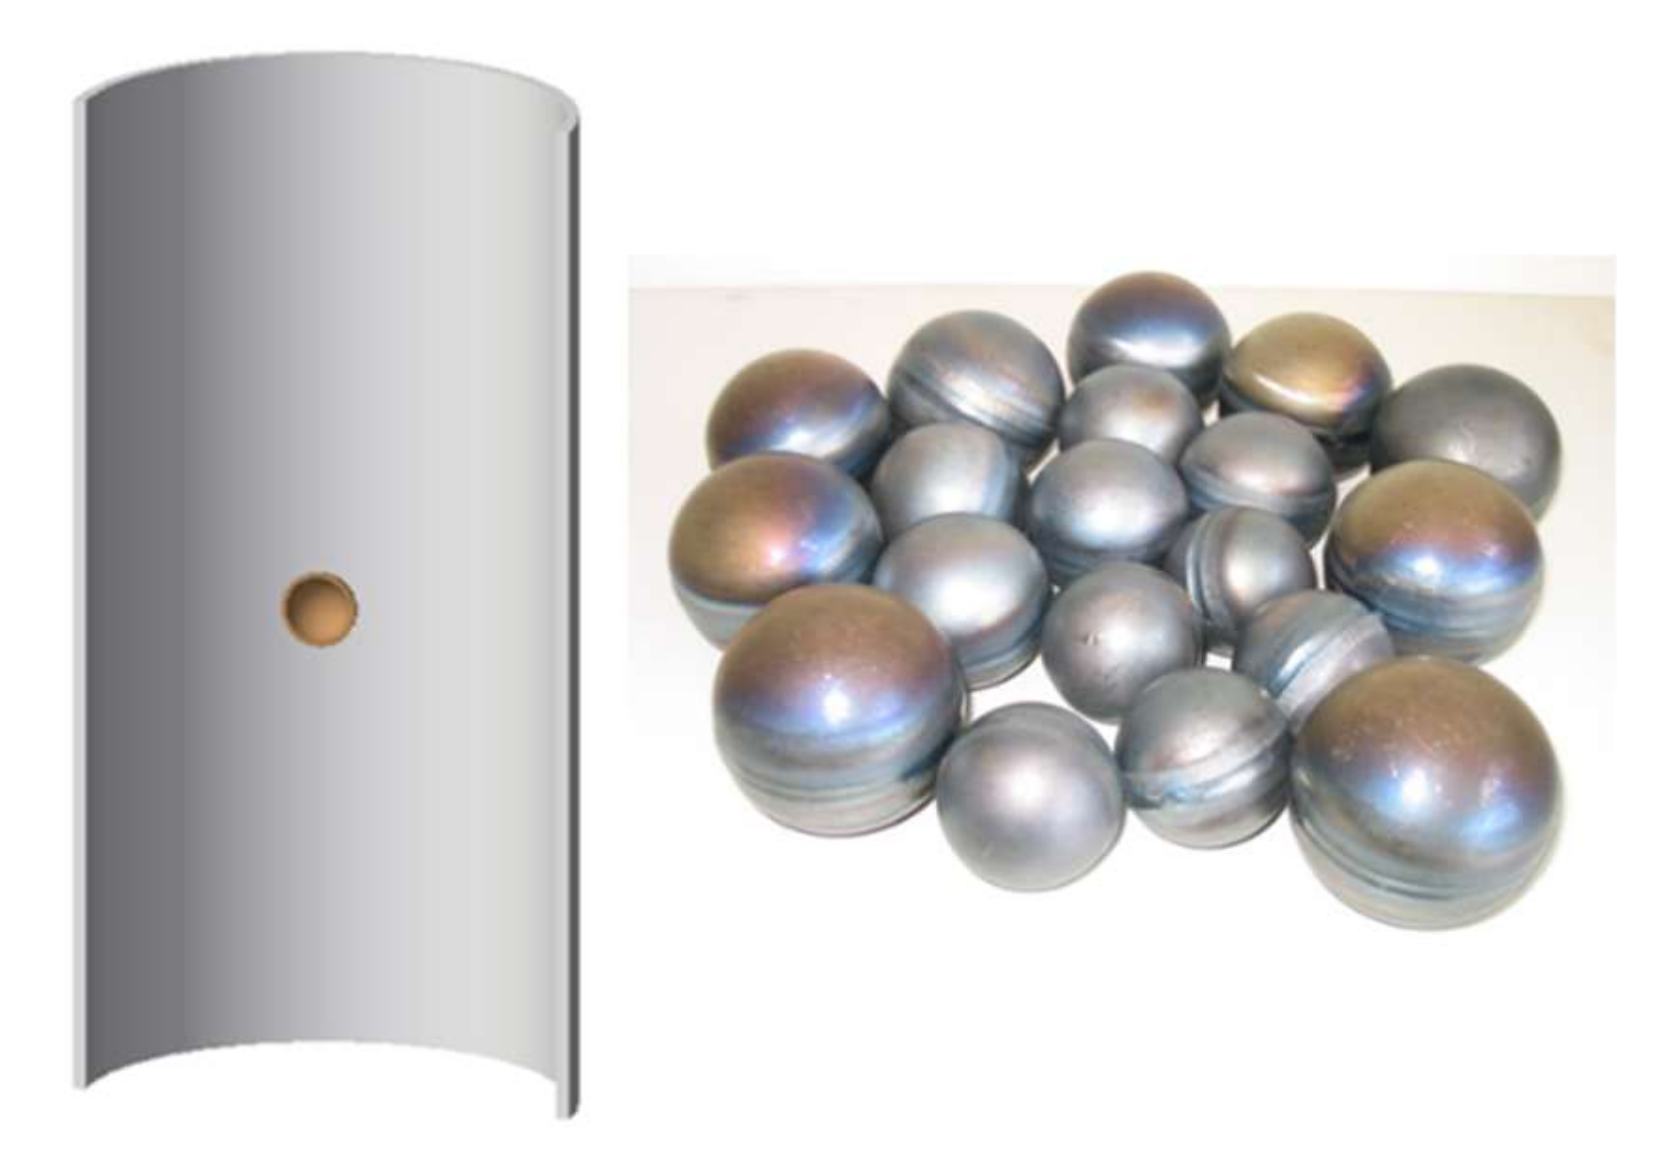
3.1. Mechanical Characteristics of a Single Sphere

A single steel sphere was placed in concrete for compression testing. Through the elastoplastic F.E.M., the authors simulated the stress distribution inside the concrete and analyzed the failure mechanism of bubble concrete. The experimental results were then compared with the analytical results.

3.1.1. Concrete Compression Test of a Single Sphere

As shown in Figure 3, the concrete mold used in the concrete experiment was a cylindrical mold with a diameter of 150 mm and a height of 300 mm (Japanese standard) [24]. The hollow body was a hollow steel sphere that was produced with a steel plate of SS400 (yield point = 235 N/mm2), which was welded hemispheres. The steel spheres chosen for this experiment were 40 mm, 50 mm, 60 mm in diameter, 2 mm in thickness, and 60 mm in diameter, 3 mm in thickness. Then, five concrete specimens without steel spheres were made as controls.
In order to measure the strain of the steel sphere buried inside the concrete, two of the five concrete specimens in each group were chosen to measure the strains of the spheres in four directions, as shown in Figure 4. Strain gauges with a length of 5 mm were attached to the equatorial and meridian lines of the steel spheres to record the strains in the four directions of the spheres. Thin wires were used to fix the steel sphere at the center of the concrete, and the concrete with a strength of Fc = 40 N/mm2 was poured. The concrete specimens were conventional concrete, but an air-entraining (A.E.) water reducing agent used as a mixture was added to ensure the fluidity of the concrete. The amount of the mixture used was 5.4 kg/m3, and the measured slump of the concrete was 21.7 cm. Considering that strain gauges were pasted around the steel spheres, concrete vibrator rods were used to vibrate the concrete at the bottom and sides. All the concrete specimens were cured for 28 days at 20 ± 3 °C under moist conditions.
The compressive strength of concrete specimens is shown in Figure 5. In this figure, the horizontal coordinates S40-2, S50-2, S60-2, S60-3 represent the diameters and thicknesses of the single spheres, respectively. The experimental results show that the strength of the concrete decreases with the increase in the diameter of the steel sphere, and the thickness of the steel sphere has no noticeable effect on the strength of the concrete. As the concrete specimens were cylindrical and no lubricant was applied to the top of the concrete specimens, the strength of the concrete specimens without the steel spheres was higher than 40 N/mm2. When the steel spheres were mixed into the concrete, the concrete strength was 41.88–48.36 N/mm2, and the maximum strength was 51.71 N/mm2.
The stress–strain curves of the concrete specimens are shown in Figure 6. The horizontal axis is the compressive strain, and the symbols G1-1, G1-2; G2-1, G2-2; G3-1, G3-2; G4-1, G4-2; G5-1, G5-2 represent the strain gauge on the left and right sides of five concrete specimens, respectively. The increase in steel sphere diameter leads to a decrease in concrete Young’s modulus, while the thickness has no significant effect on Young’s modulus.
The strain curves in four directions around the steel sphere inside the concrete are shown in Figure 7. The positive direction of the horizontal axis is compressive strain, and the negative direction is tensile strain. G-1 and G-2 are the strains on both sides of the concrete. G-ZX, G-ZY, G-YX, and G-YZ are the strains measured by the four strain gauges pasted on the sphere. The experimental results show that the sphere is compressed by pressure in the vertical direction and expanded by tension in the lateral direction. Under the conditions of different steel sphere diameters and thicknesses, the strain of the sphere is smaller than that of the concrete. As the diameter of the sphere increases, the lateral expansion also gradually increases, but the strain generated in other directions does not change significantly. Based on the failure modes of concrete (Figure 8), cracks were generated from top to bottom, and then concrete crumbled from the inside. The connection between the steel sphere and the concrete is poor, and the steel sphere peels off.

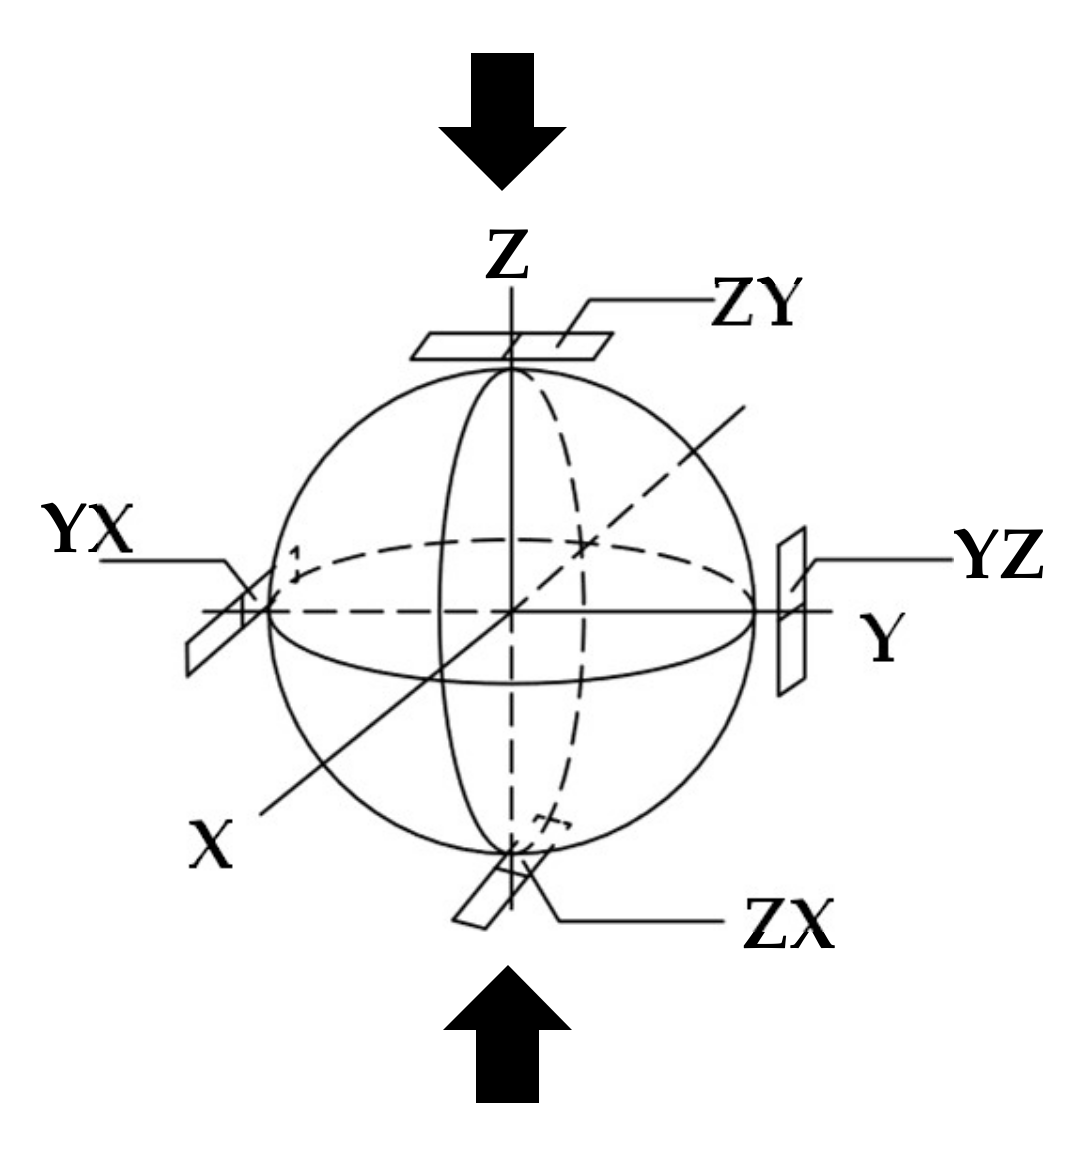
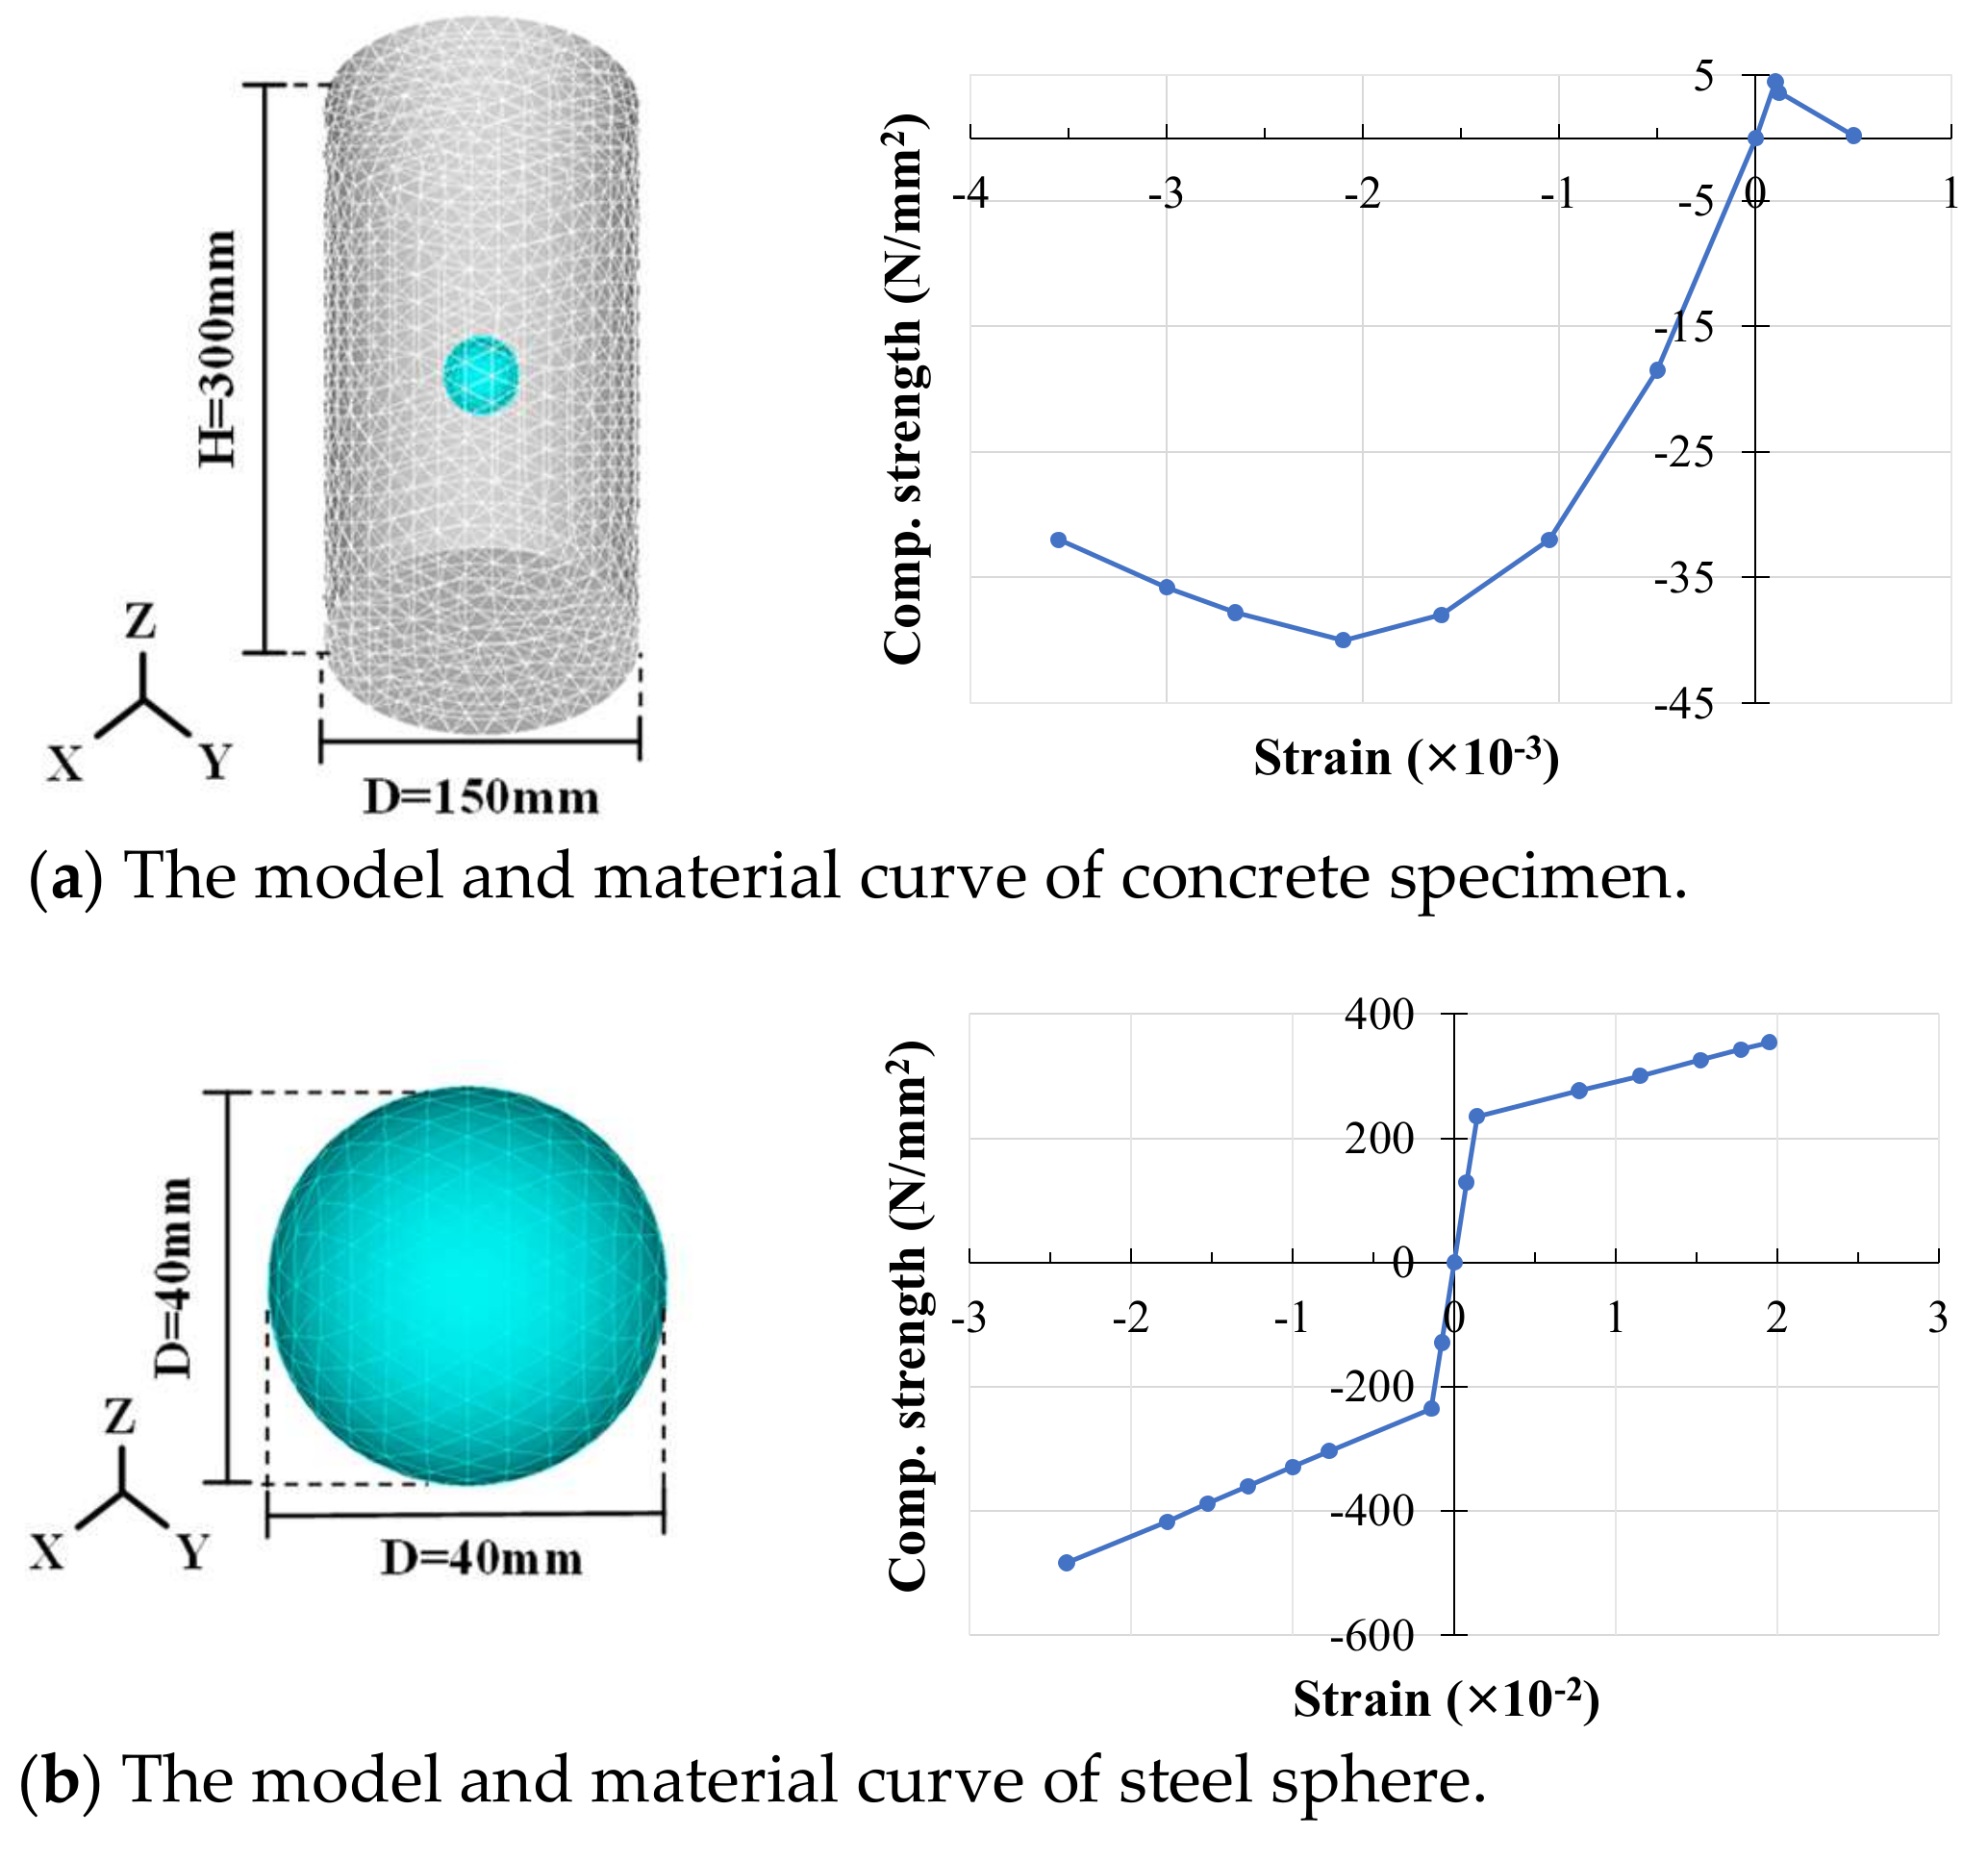
3.1.2. Nonlinear Finite Element Simulation for a Single Sphere

As the concrete experimental testing could not clearly show the stress distribution inside the concrete and sphere, nonlinear elastoplastic analysis for F.E.M. was adopted to analyze the bubbled concrete with a single steel sphere. The dimensions and material curves of the concrete and sphere model used for the analysis are shown in Figure 9. The sphere was placed in the center of the concrete, and a uniform load was applied at the top. In order to simulate the actual experimental conditions, the strength of concrete in each simulation was kept consistent with the strength of conventional concrete. The model was uniformly loaded and increased in ten steps, and then the strain and ultimate strength of the concrete were reached.
The analysis results of stress–strain curves are shown in Figure 6. The analytical results show that the simulated value of concrete strength is close to the experimental value. The increase in the diameter of spheres would cause a slight decrease in the concrete strength and Young’s modulus. The internal stress distribution of the concrete is shown in Figure 10. With the increased loading on the top of the concrete, significant stress is generated on the sphere surface, and it is concentrated near the equatorial line. The steel sphere undergoes compression in the vertical direction and expansion in four oblique directions after being subjected to the stress. The vertical deformation of the sphere leads to a reduction in stresses. The oblique deformation of the sphere, on the other hand, squeezes the surrounding concrete, leading to an increase in the stresses.
In the concrete compression experiment, the concrete crumbled from the inside to the outside. The spheres were stripped from the concrete, but the steel spheres did not break. Therefore, combining the results of the analysis, the causes of failure of the bubble concrete with a single sphere can be attributed to the following three points:
  • The steel sphere is compressed by stress in the vertical direction. The steel sphere squeezes the surrounding concrete in the oblique direction, resulting in a stress increase; in the vertical direction, the steel sphere is stripped from the concrete, decreasing stress.
  • The steel sphere stiffness is different from the stiffness of the concrete. After the sphere is subjected to stress, the two different materials cannot maintain the same deformation, which causes the steel sphere to be separated from the concrete.
  • The surface of the steel sphere was milled, which resulted in insufficient bonding between the sphere and concrete. Therefore, voids are easily created between them and the steel sphere cannot continue to bear and transmit the stress.

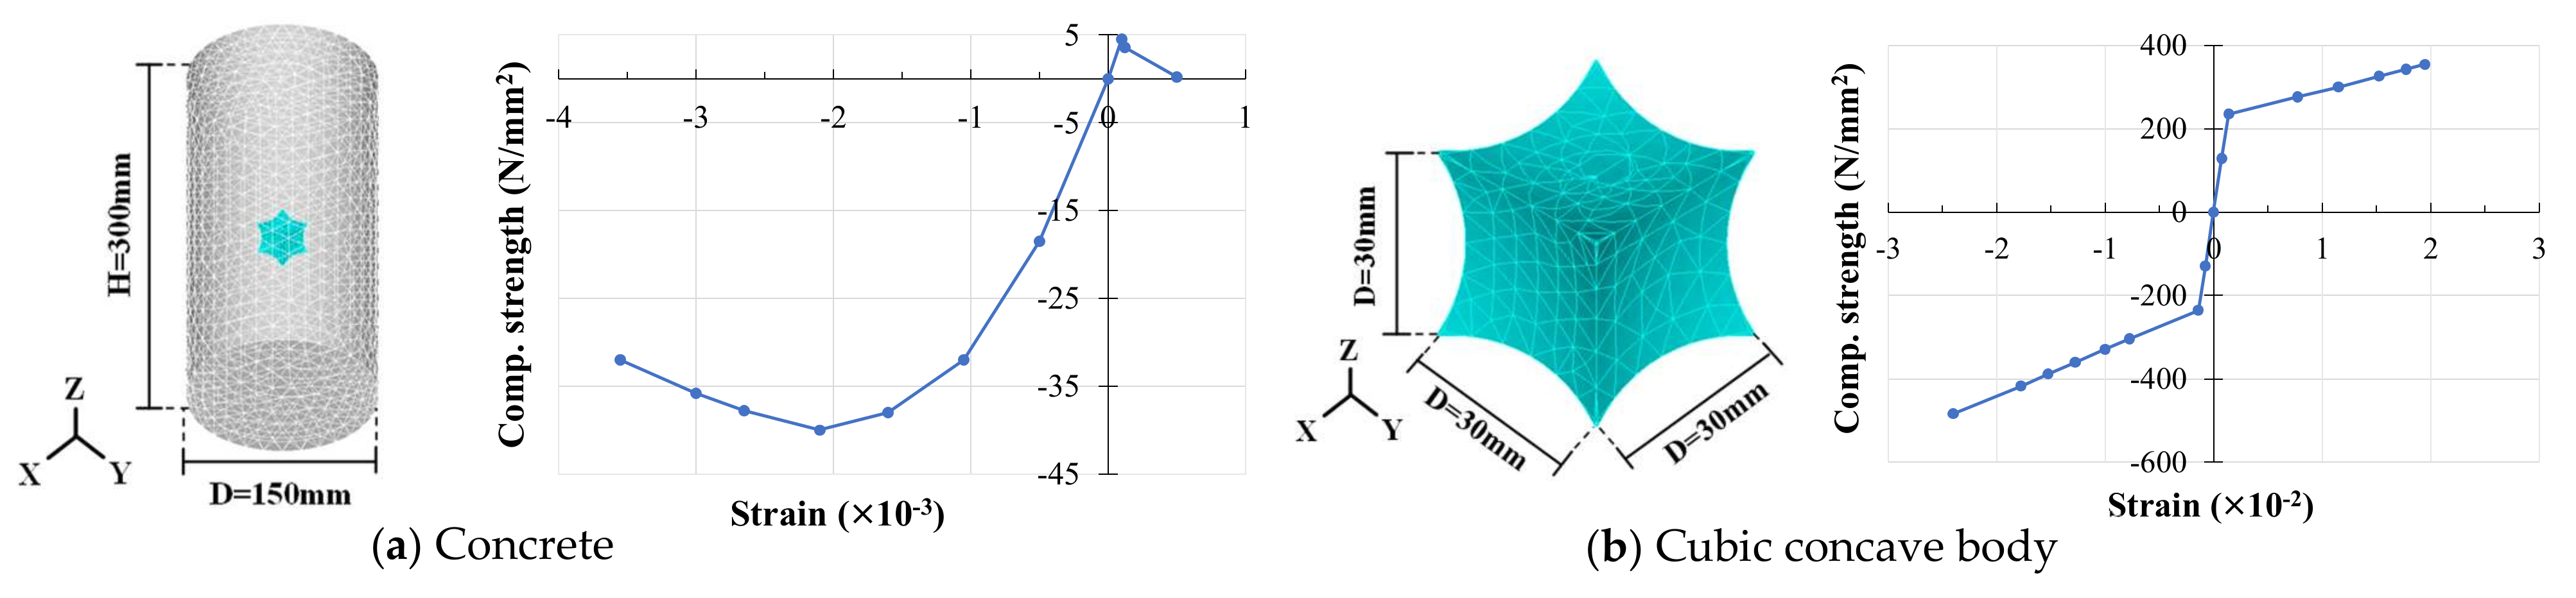
3.2. Mechanical Characteristics of a Single Cubic Concave Body

Cubic concave bodies can reduce the expansion in the lateral direction compared to spheres, so this section investigates the bubble concrete with a single concave body. Single cubic concave bodies were arranged in concrete for concrete compression experiments, and the orienting direction (inclination degree) of concavity was varied to observe the change in strength and Young’s modulus of concrete. Similarly, a concrete model was built to observe the damage mechanism inside the concrete, and the experimental results were compared with the analytical results.

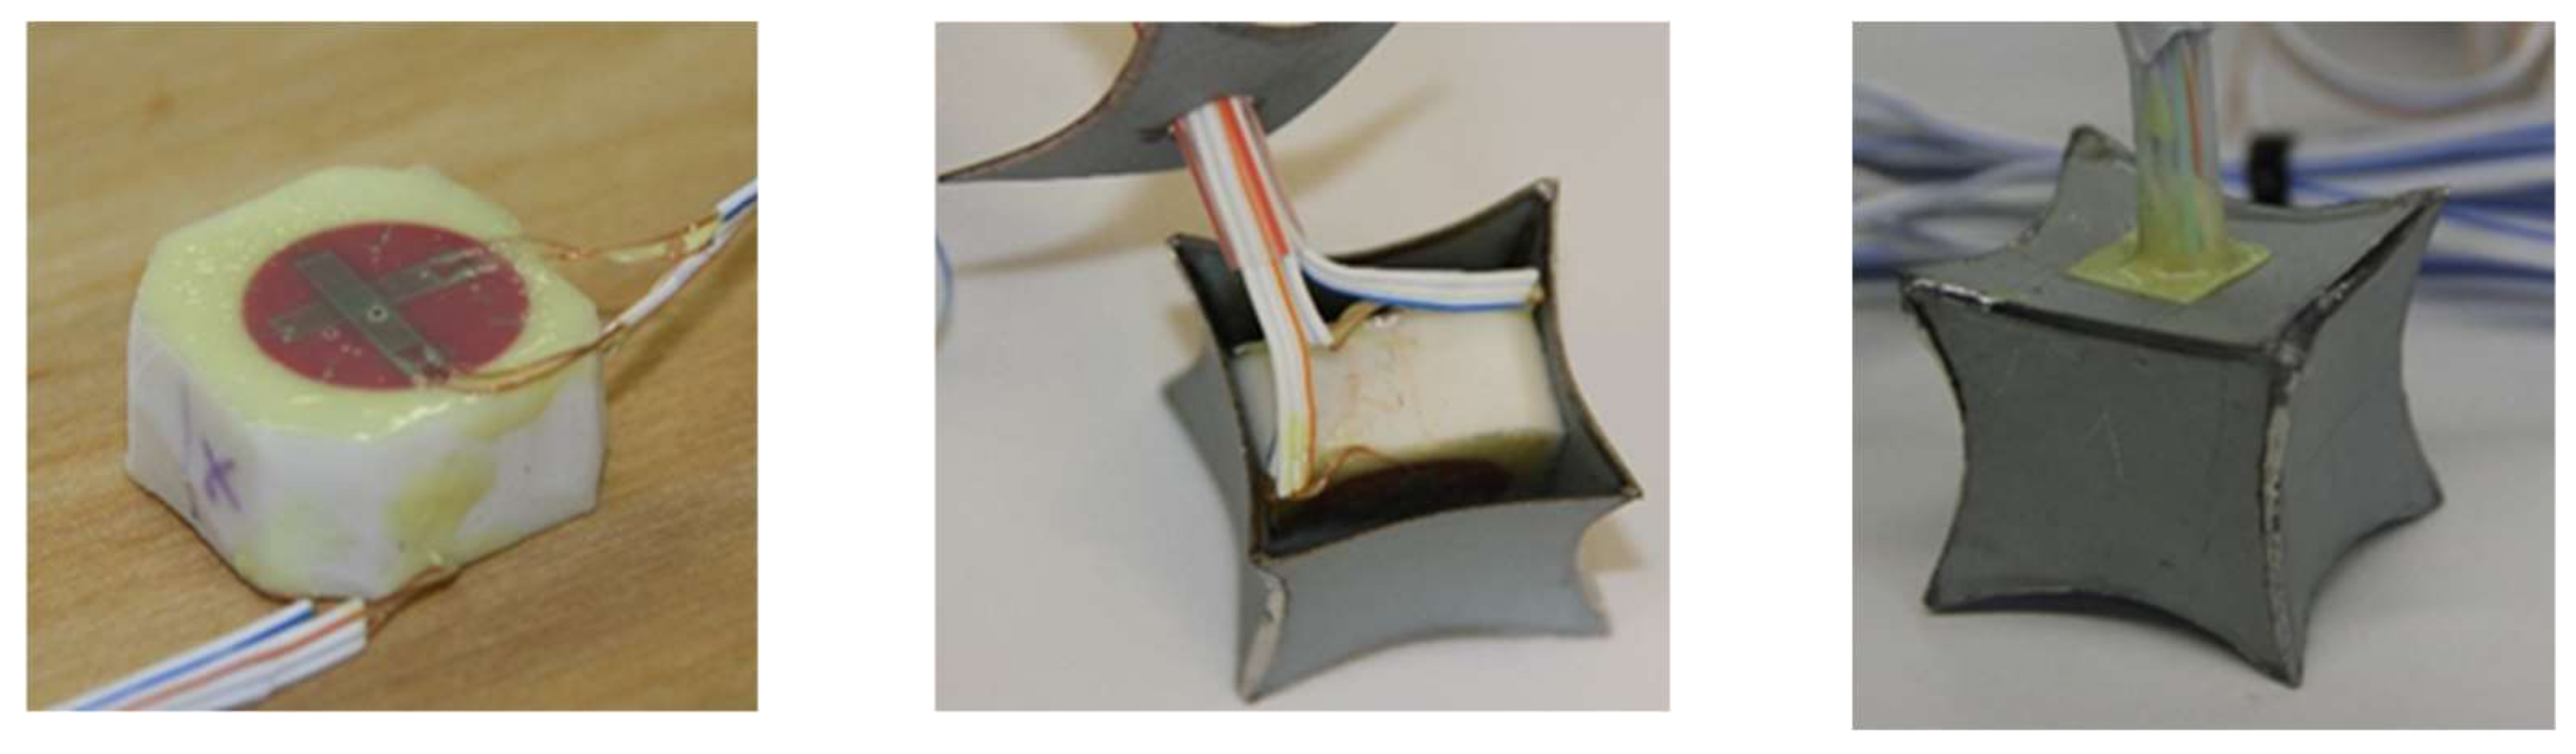
3.2.1. Compression Experiments of a Single Cubic Concave Body

The material used for the concave body was the same as the steel sphere, which was SS400 (235 N/mm2). As shown in Figure 11, the cubic concave body had a side length of 30 mm and a thickness of 0.8 mm, and each face of the cube was recessed inward. The six faces were assembled by welding. An octagonal rubber was placed inside the concave body, and the strain gauges were attached to the center of the rubber to measure the inward strain generated by the concave body. The strain gauge was covered with glass glue to avoid breakage, and a hole was made on one side of the concave surface to lead out the strain gauge wire (Figure 12). As the stress direction and the depression of the concave body affect the concrete strength, the experiment was classified according to the depression and the direction of stress. As shown in Table 1, the concrete compression experiments were divided into six groups, and two concrete specimens were made for each group, and three concrete specimens not mixed with concave bodies were made as controls. Three orienting directions of the concave body, Type-A, Type-B, and Type-C, are shown in Figure 13.
The strength of concrete specimens is shown in Figure 14. The strength range of the experiment was 36.65–40.23 N/mm2, which is similar to that when using a single sphere. The effect of depression and stress direction on the strength of the concrete was not noticeable. The stress–strain curves of the concrete are shown in Figure 15. The positive direction of the lateral coordinate represents the compression strain, while the negative direction represents the tension strain. The symbols G-1, G-2; GX-1, GX-2; GY-1, GY-2 represent the strain gauge on the left and right side of concrete specimens and the strain gauge of the concave body in the X and Y directions, respectively. Due to the poor welding quality and damage of some cubic concave bodies, some strain gauges failed to detect the strain inside the concave bodies (A2-2, C2-1, C3.5-1).
The concave body was compressed in the vertical direction for Type-A and expanded in the lateral direction, but both the compression and expansion were much smaller than the concrete deformation. The results of Type-B were similar to Type-A. For Type-C, the unique shape mechanism did not produce large deformation in X and Y directions. In addition, all three types of concrete specimens underwent a slight decrease in Young’s modulus as the depression of the cubic concave body increased.
According to the failure modes of the concrete cylinder (Figure 16), the concave body produces an inward depression when it is subjected to stress. After the surface of the concave body was stripped from the concrete, it could not carry the load continuously. Then, the concave body lost its ability to transfer stresses, and the stresses were transferred to the surrounding concrete, causing an increase in stresses around the concave body. Moreover, the poor welding quality of the concave bodies caused damage to the concave body before the failure strength was reached, which contributed to the reduction in the ultimate concrete strength.

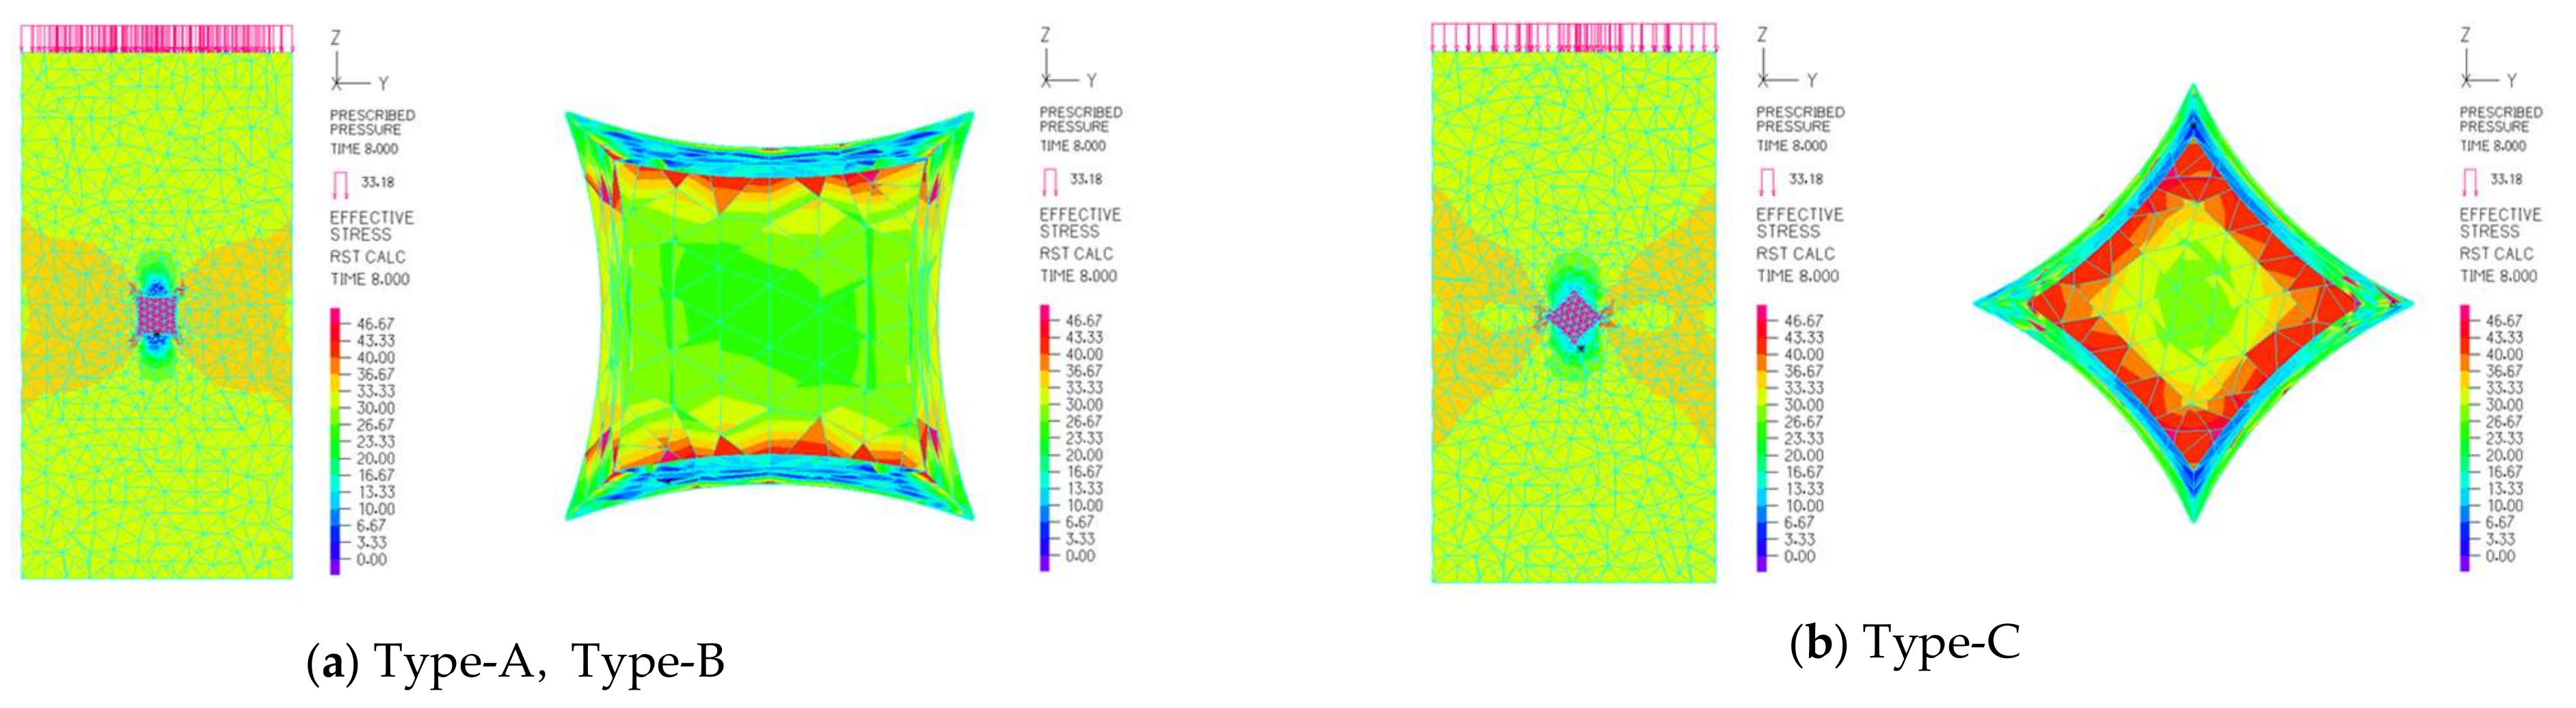
3.2.2. Nonlinear Finite Element Simulation for a Single Cubic Concave Body

The analytical model for the concrete and cubic concave bodies is shown in Figure 17, and their material curves are the same as those of analysis of the single steel spheres shown in the previous sections, in which the yield point of the concave body is 235 N/mm2 (SS400 steel sheet). The side length of the cubic concave model was 30 mm. The analysis conditions were kept the same as the experimental conditions.
The analysis results of stress–strain are shown in the simulation curves in Figure 15. The results show that the orienting direction of the concave body has no obvious effect on the strength of the concrete. However, the increase in the depression would slightly increase the average strength of the concrete. The stress distribution diagrams inside the concrete are shown in Figure 18. The concave body is compressed inward and prevents the generation of outward expansion. Therefore, the stress of concrete around the concave body is less than the stress when a sphere is used. After the side edge of the concave body is subjected to stress, stress concentration occurs, causing the model to deform. Moreover, since the thickness of the concave body is 0.8 mm, the concave body deformed very quickly and then peeled off from the concrete.
The ultimate strength of the experiments was lower than the simulated value due to the poor welding quality of the concave bodies. The premature destruction of concave bodies in concrete resulted in the inability to obtain more accurate deformations. However, based on the analytical results, it is possible to suggest the following three reasons for the failure of the concrete with a single cubic concave body:
  • The concave body is subjected to vertical compression and inward deformation after being loaded.
  • The thickness of the concave body is too thin, and the poor quality of the weld causes the concave body to be damaged.
  • The adhesion between the concave body and the concrete is insufficient, and when the concrete cracks, the concave body is unable to provide internal tension.

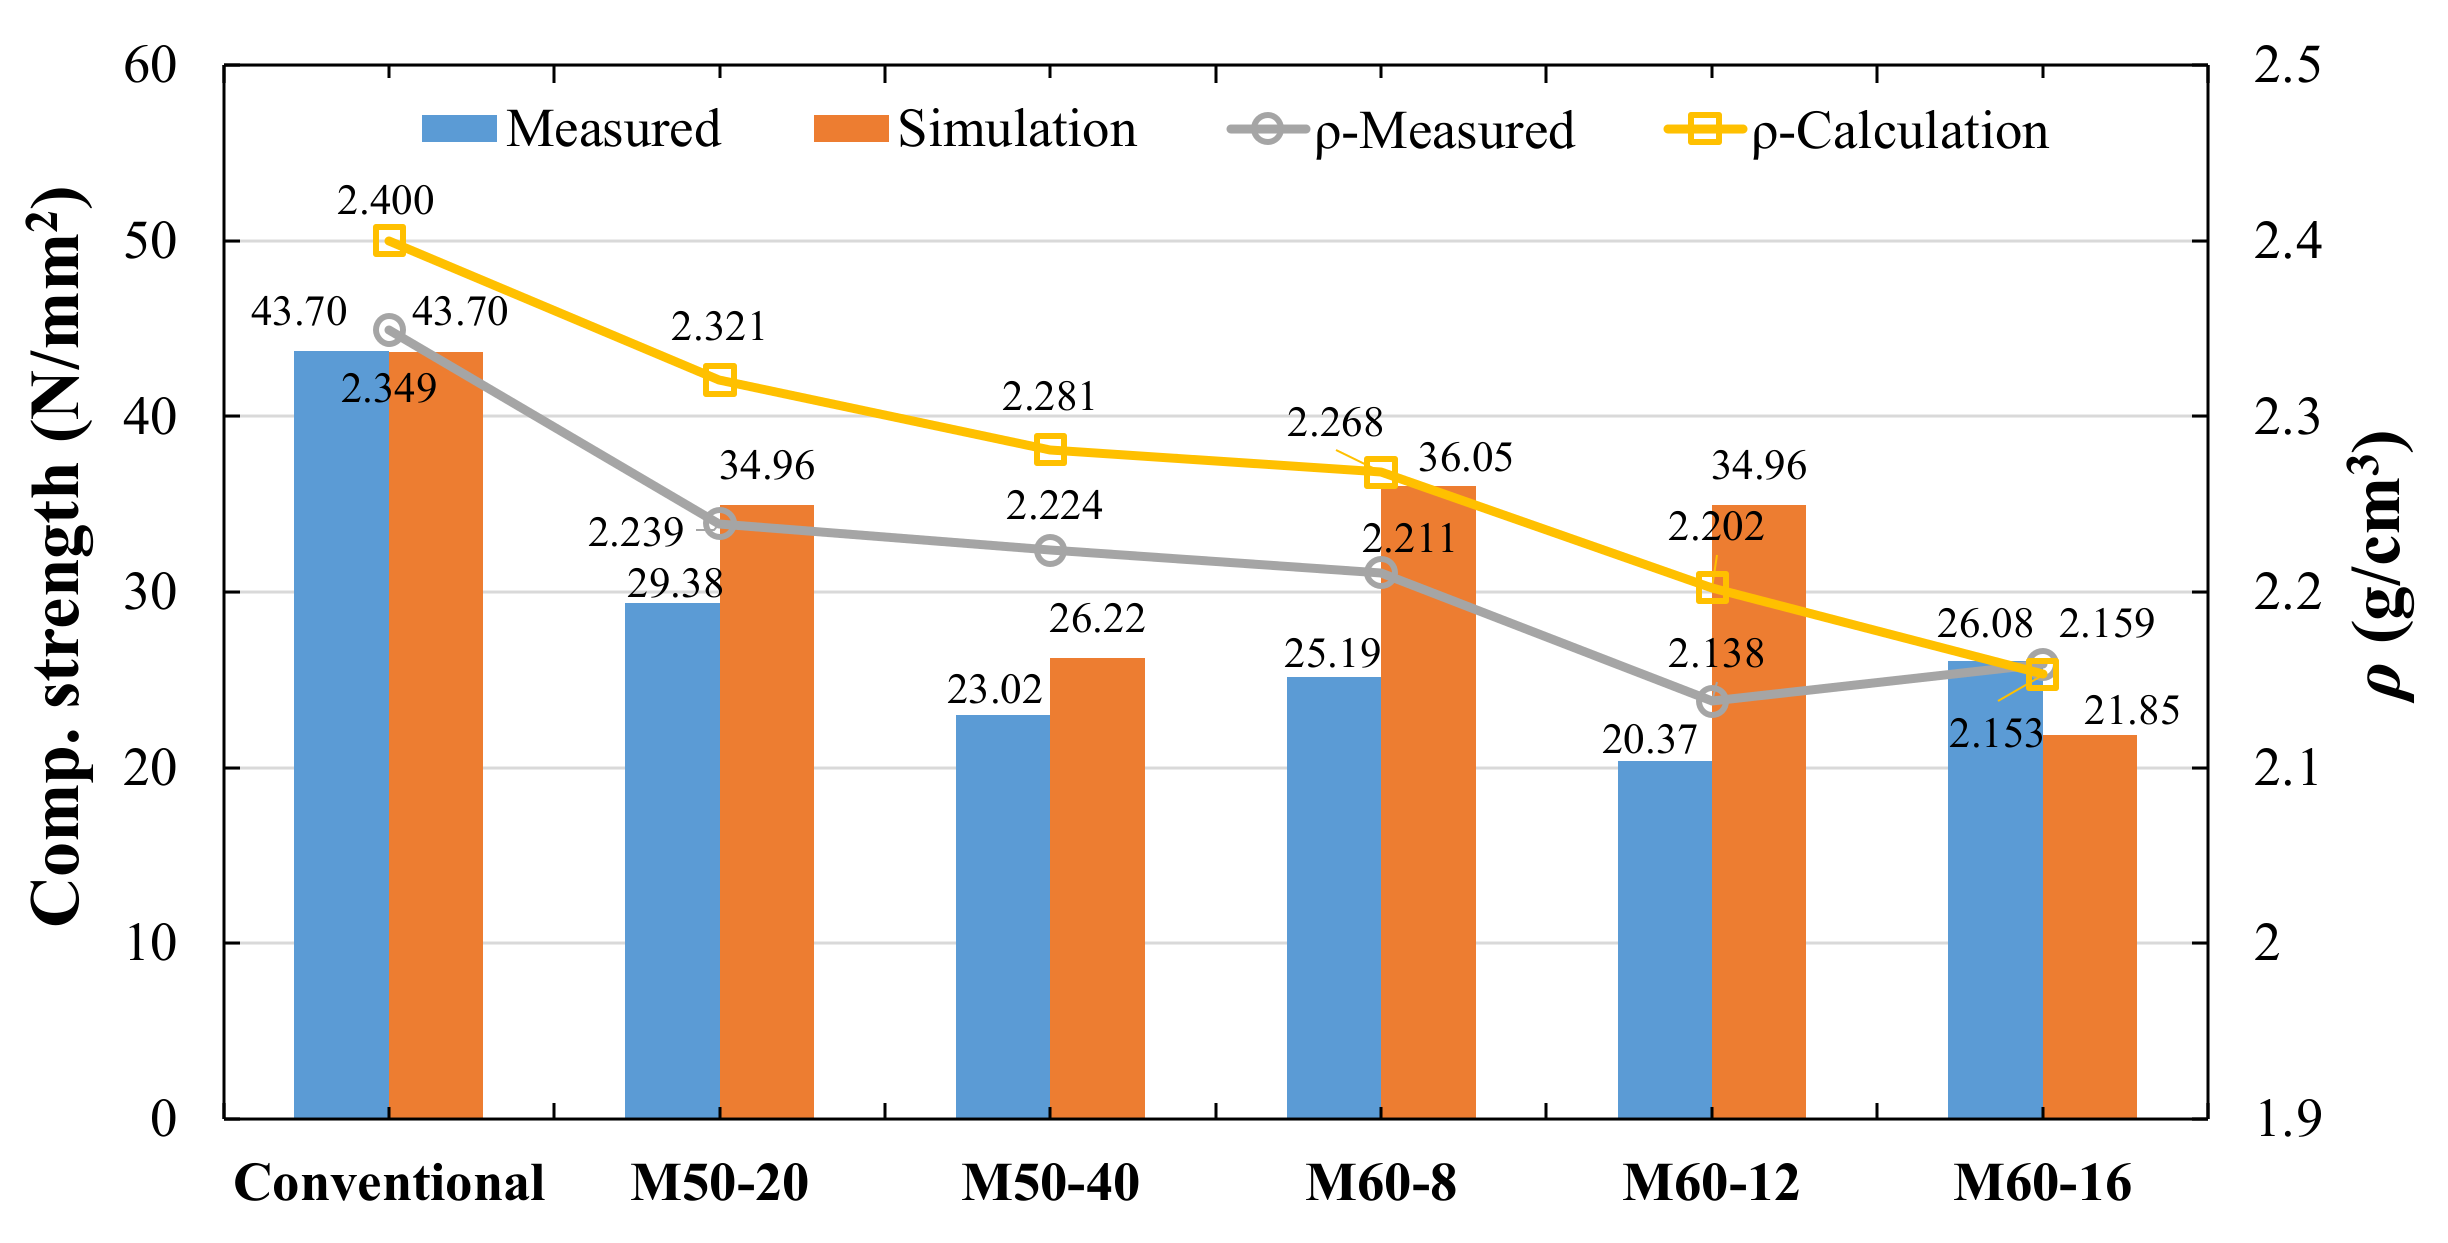
4. Mechanical Features of Multiple Steel Hollow Bodies

In order to investigate the effect of mixing a number of hollow bodies on the density, compressive strength, and Young’s modulus of the bubble concrete, this section describes the bubble concrete mixed with multiple spheres and cubic concave bodies. Compression experimental testing and numerical simulations were carried out for the study, while the experimental and analytical methods were the same as those in Section 3.

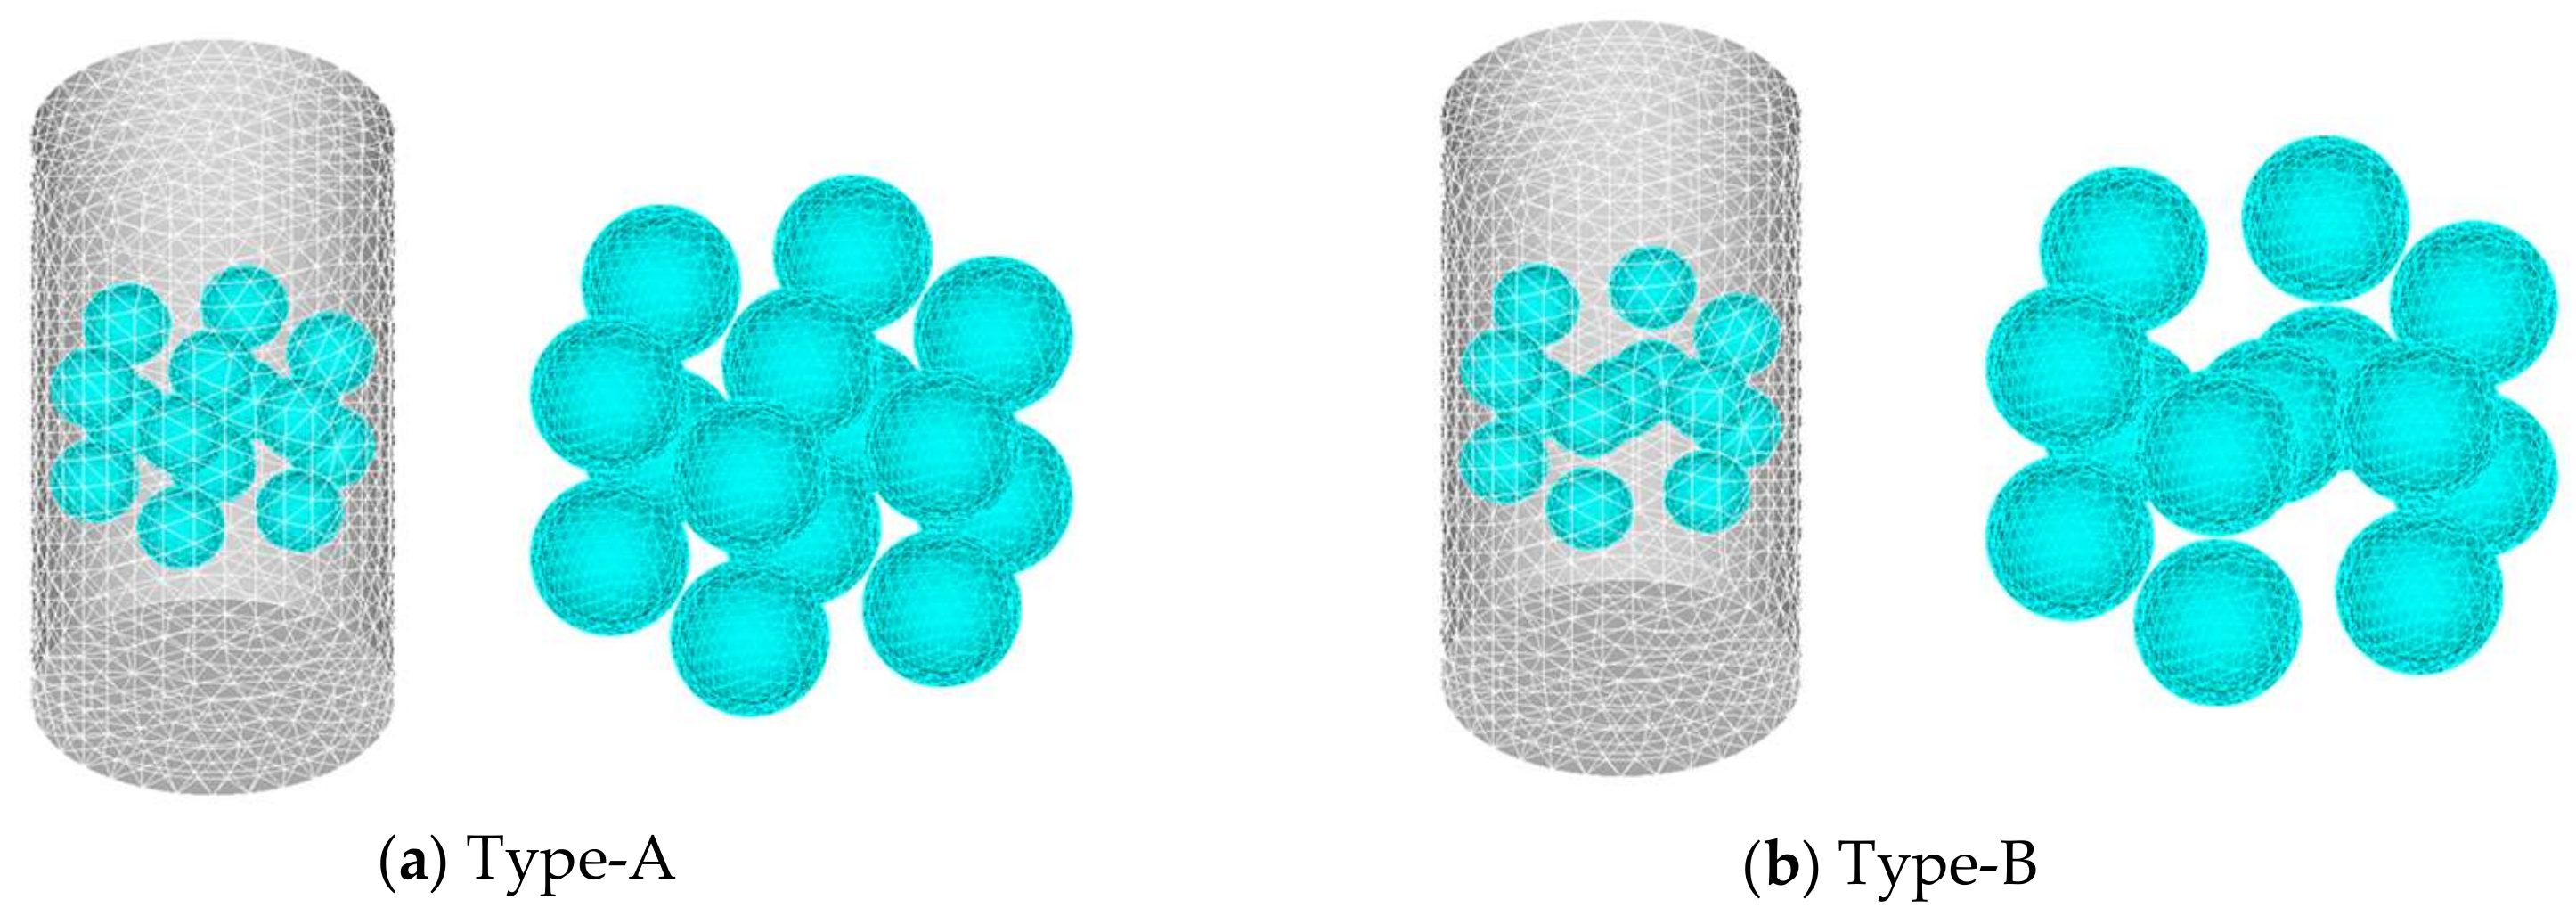
4.1. Mechanical Characteristics of Multiple Spheres

Multiple steel spheres were mixed into the concrete and the diameter and number of spheres were changed to study the effects on the strength, density, and Young’s modulus of the concrete. The experimental results are compared with the analytical results to explore the bubble concrete mechanical characteristics and failure mechanisms.

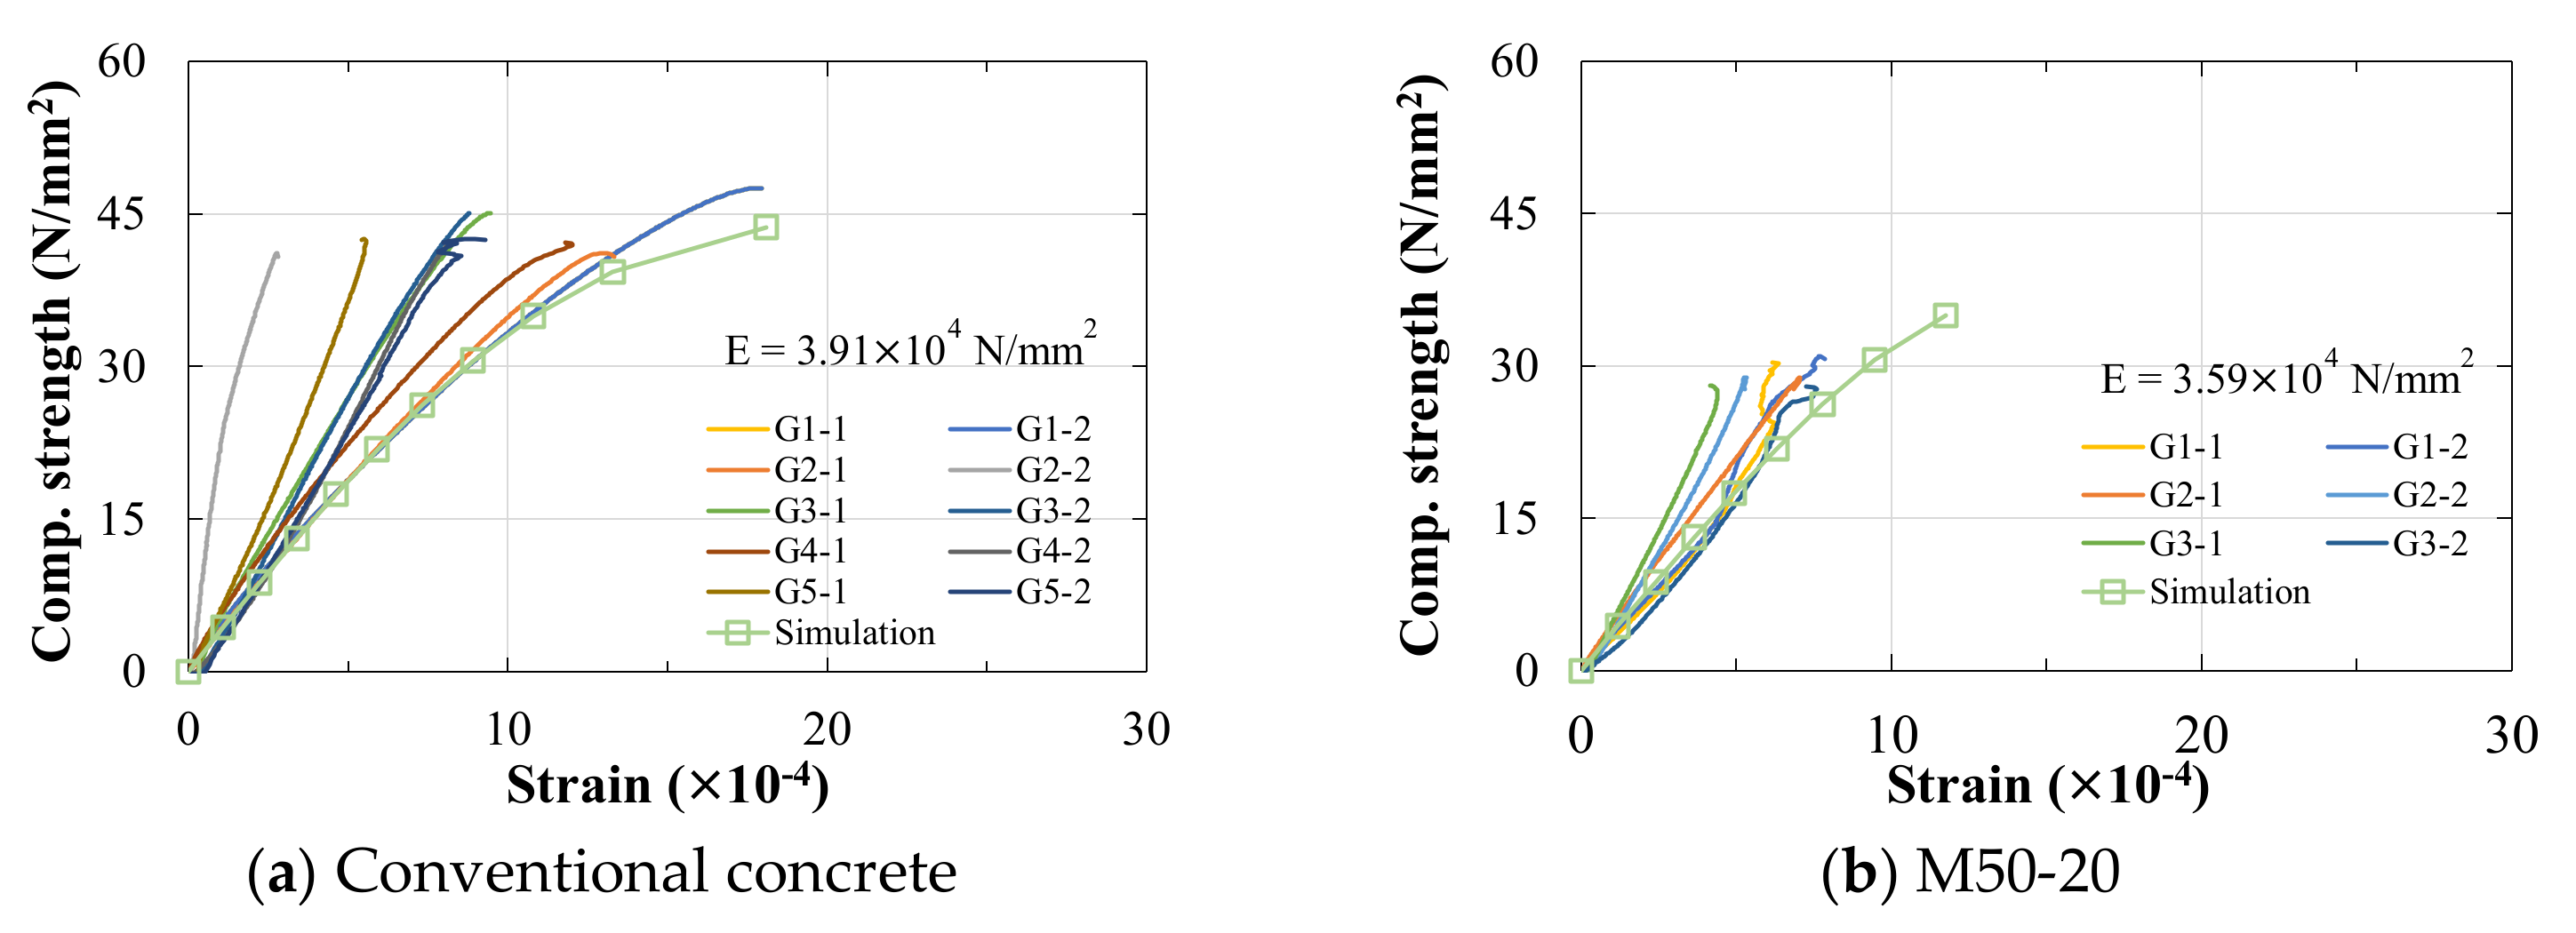
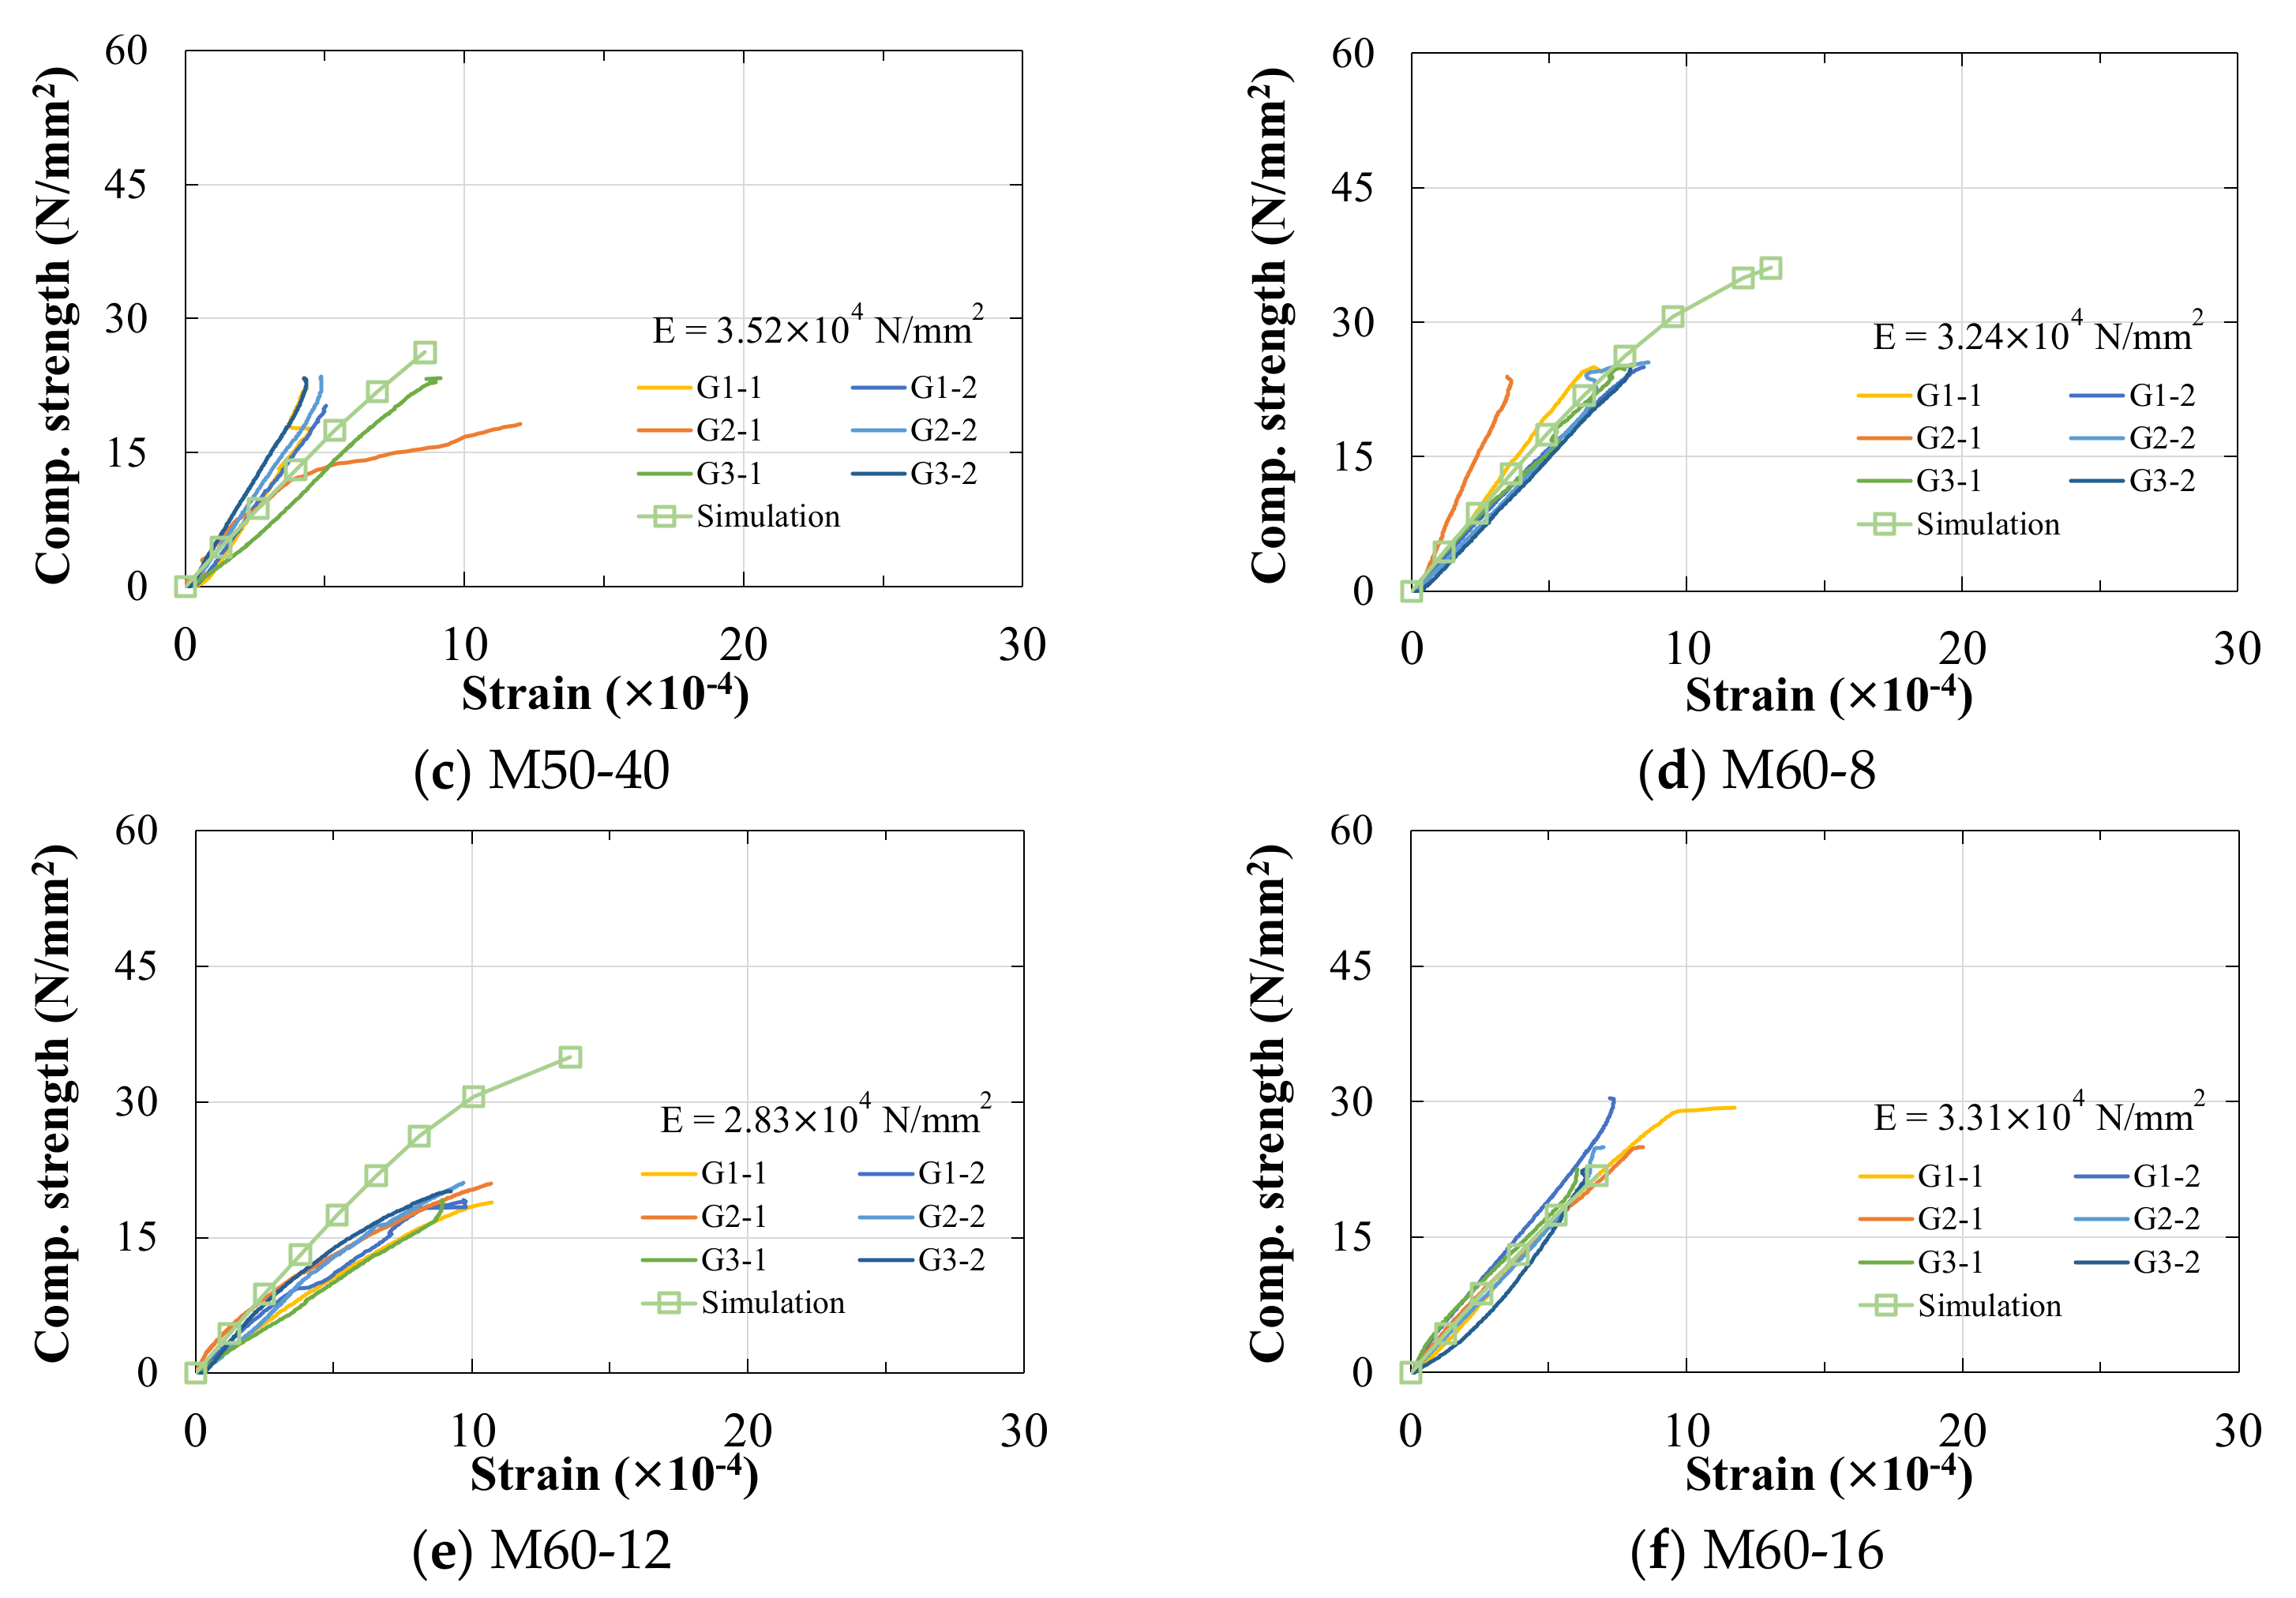
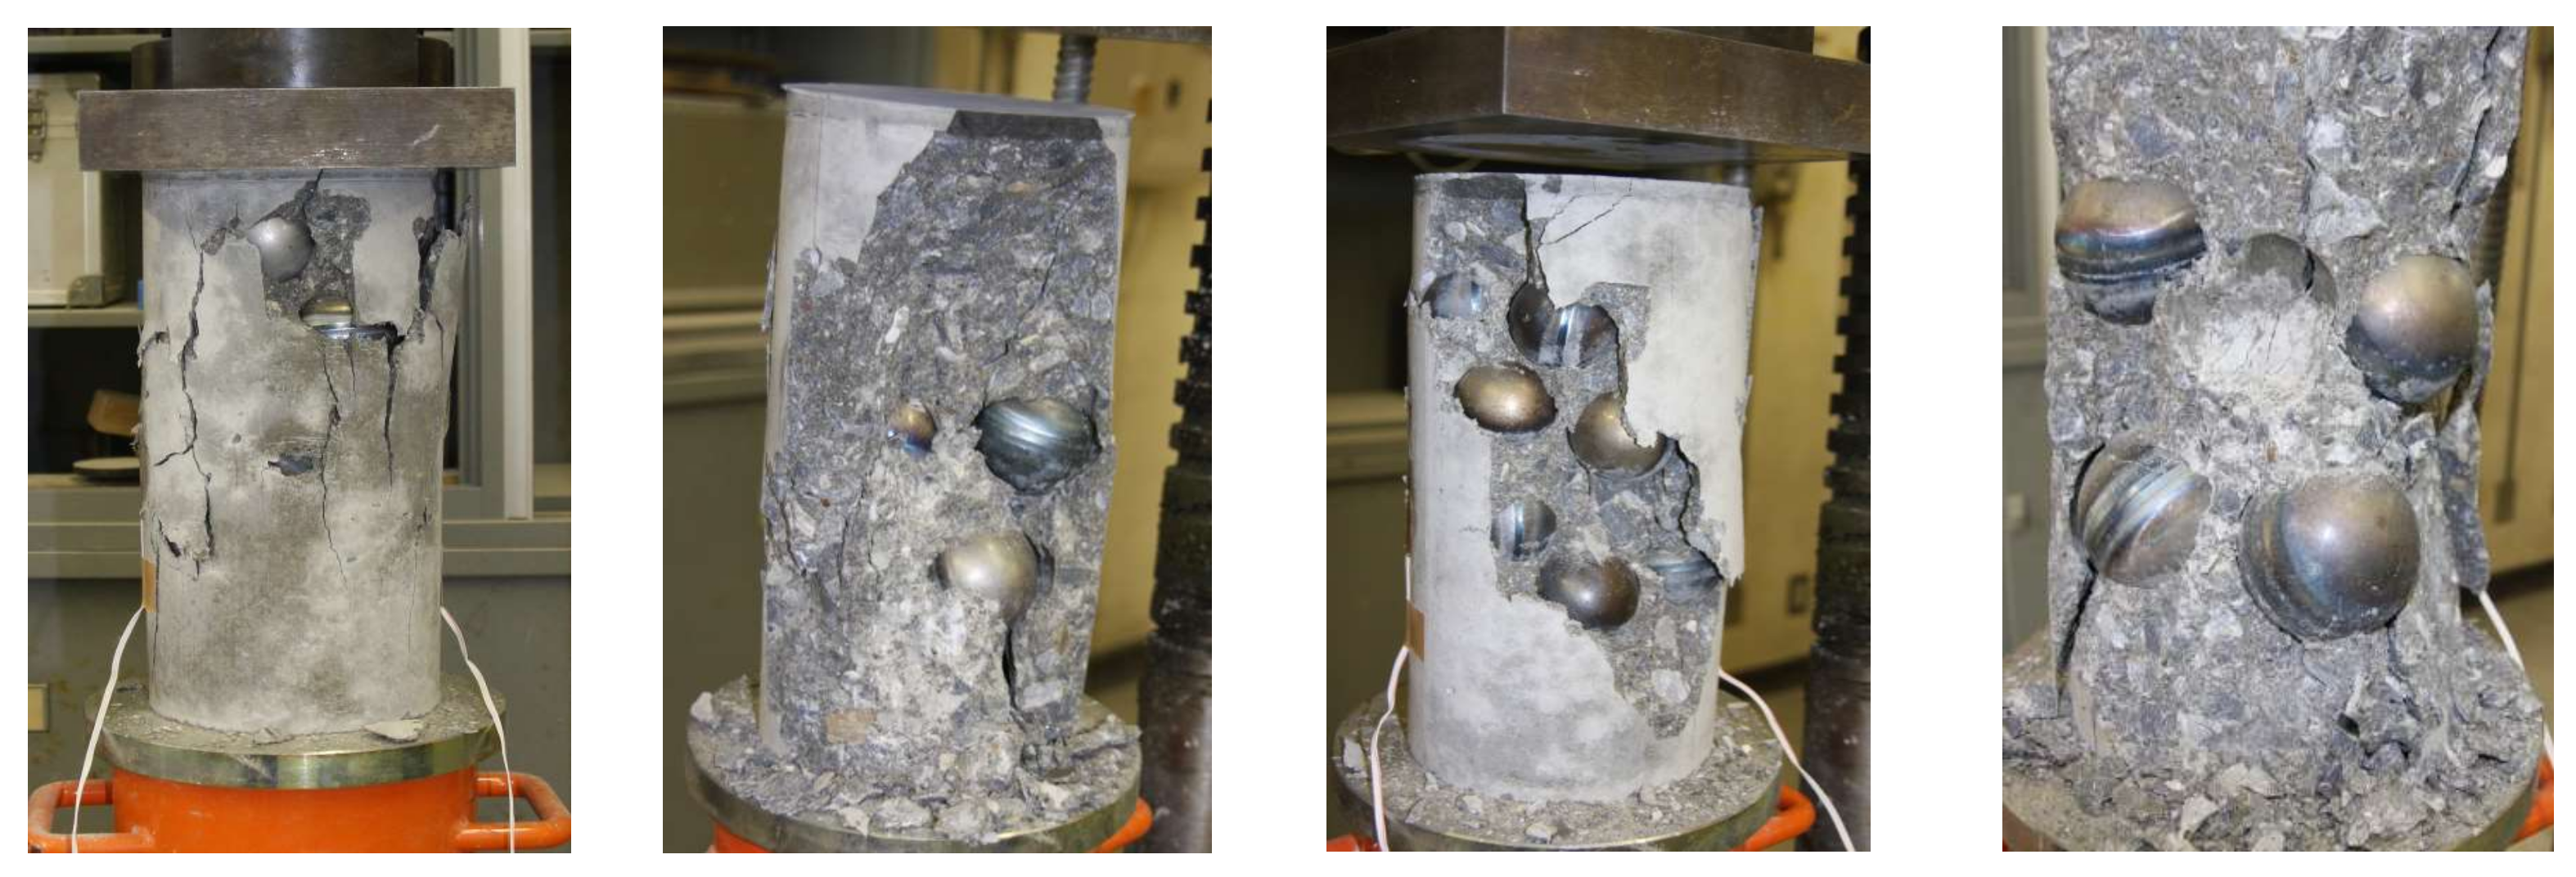
4.1.1. Concrete Compression Experiments of Multiple Spheres

Two types of steel spheres with diameters of 50 mm and 60 mm, and 2 mm in thickness were used, and the material was the same as that introduced in the previous sections. According to the diameters of steel spheres and the number of spheres, the experiments were divided into five groups, and three concrete specimens were made for each group. The actual sphere diameters and number used in each group of the experiment are shown in Table 2. The same concrete was used to produce three concrete specimens without the steel spheres for control. The concrete used in the experiment was ready-mixed concrete with a strength of Fc = 40 N/mm2, with a maximum aggregate diameter of 20 mm, mix (water reducing agent) of 5.4 kg/m3, and slump of 21.5 cm. The concrete specimens were filled in three times, vibrated at the bottom and side using a vibrating rod, and placed in water for 28 days for curing.
The density and strength of the concrete specimens are shown in Figure 19. The experimental strength of concrete is lower than the analytical strength, but as the number of steel spheres increases, the experimental value and the analytical value gradually decrease, and the experimental strength is even higher than the analytical strength (M60-16). The average density of concrete without spheres mixed in was 2.349 g/cm3, while the average density of bubble concrete was 2.159–2.224 g/cm3. The average strength of the specimens without steel spheres was 43.7 N/mm2, while the average strength of the bubble concrete was 25.19–29.38 N/mm2. The stress–strain curves of the concrete specimens are shown in Figure 20. The concrete Young’s modulus gradually decreases with the increase in the number of steel spheres.
Moreover, based on the four sets of experimental results for M50-20, M50-40 and M60-12, M60-16, it is clear that the increase in steel sphere diameter also decreases the strength and Young’s modulus of concrete. The photos of the failed concrete are shown in Figure 21. Several cracks from top to bottom were generated in the concrete specimens, and severe peeling of concrete and spheres occurred. Part of the concrete was crushed, and then the concrete failed. The contact surface between the sphere and concrete was smooth, and no damage occurred in the spheres.

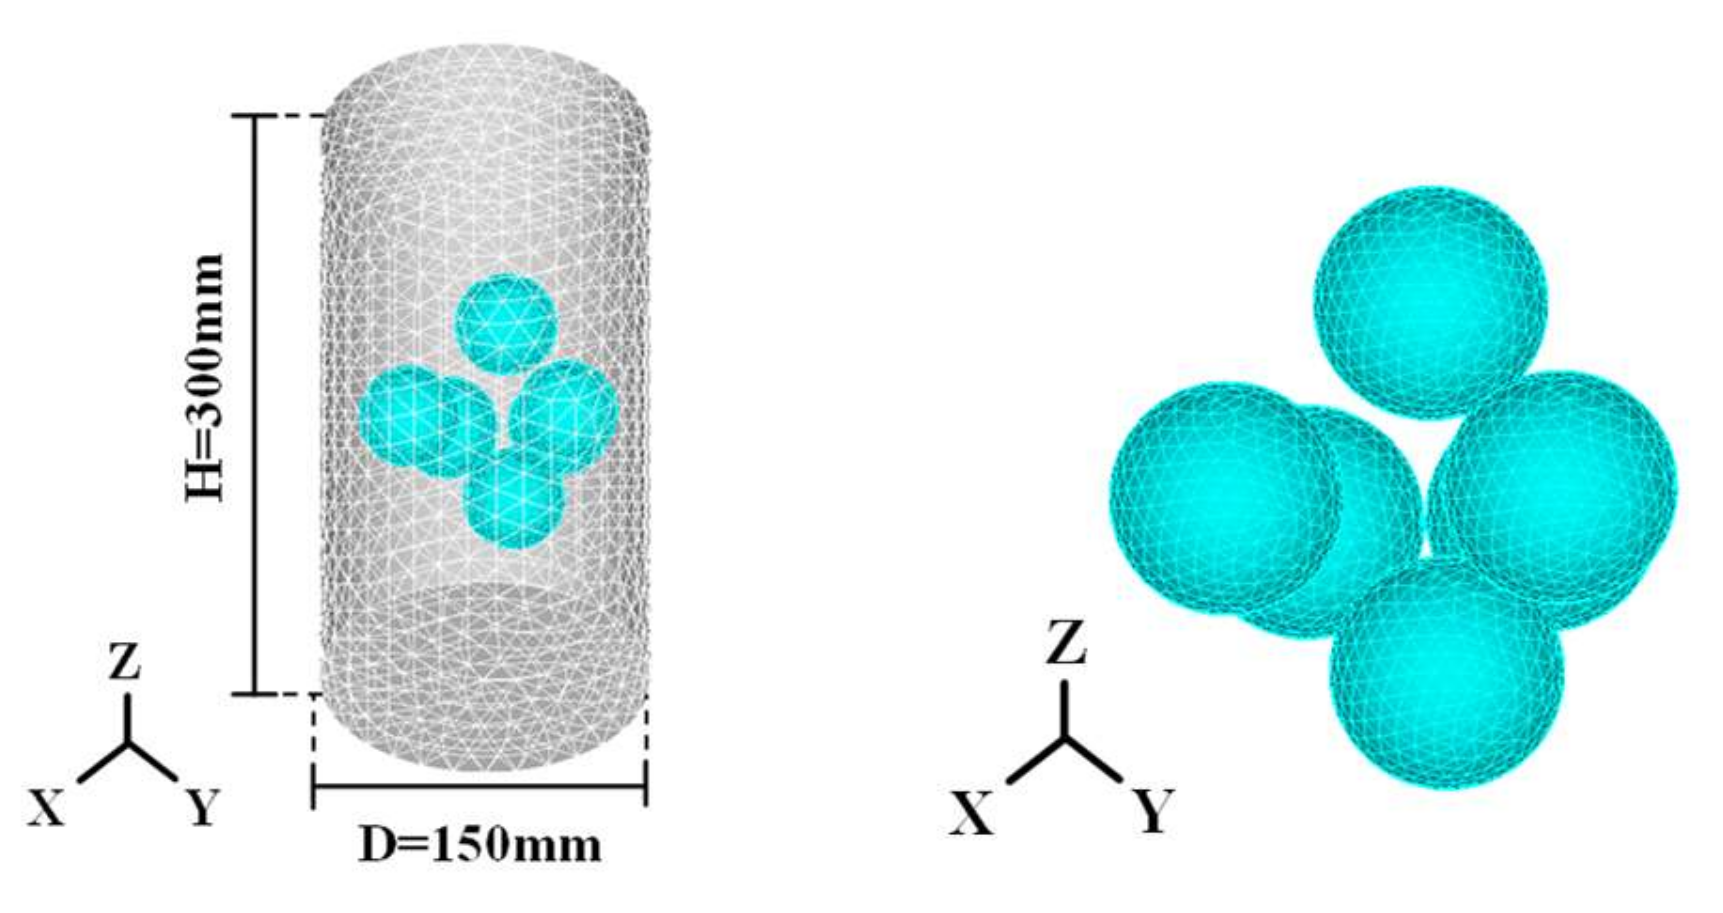
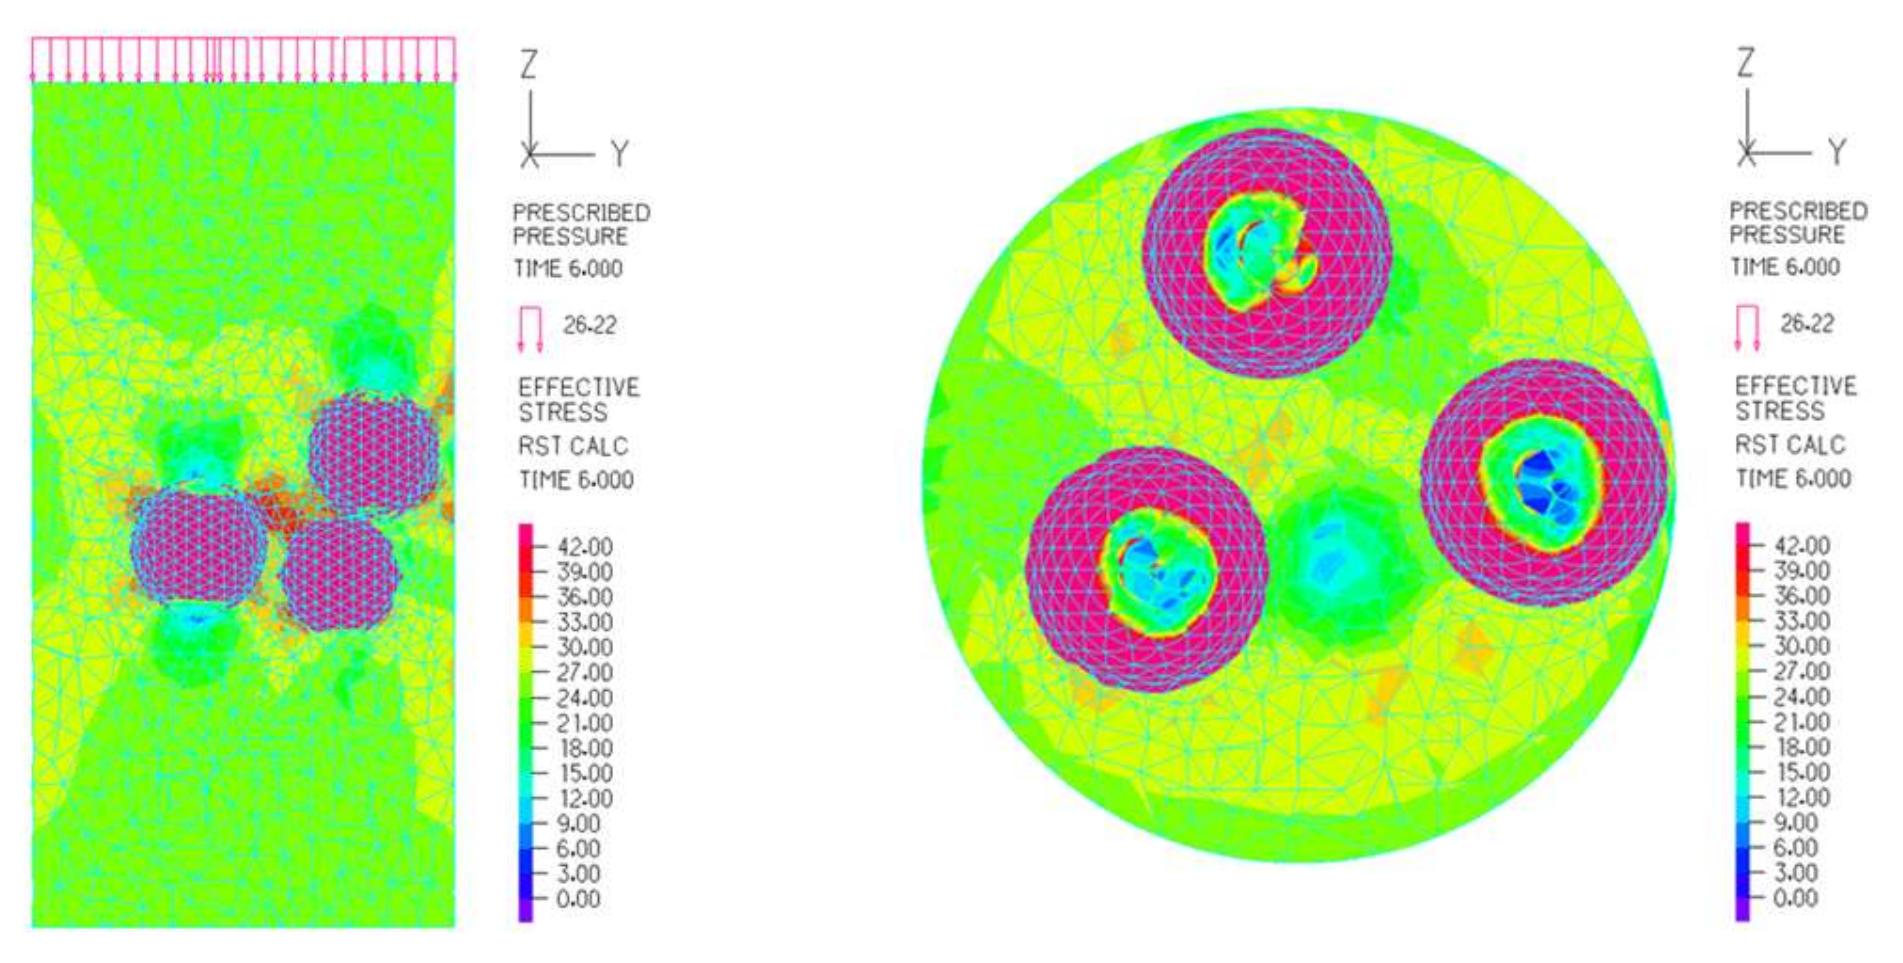
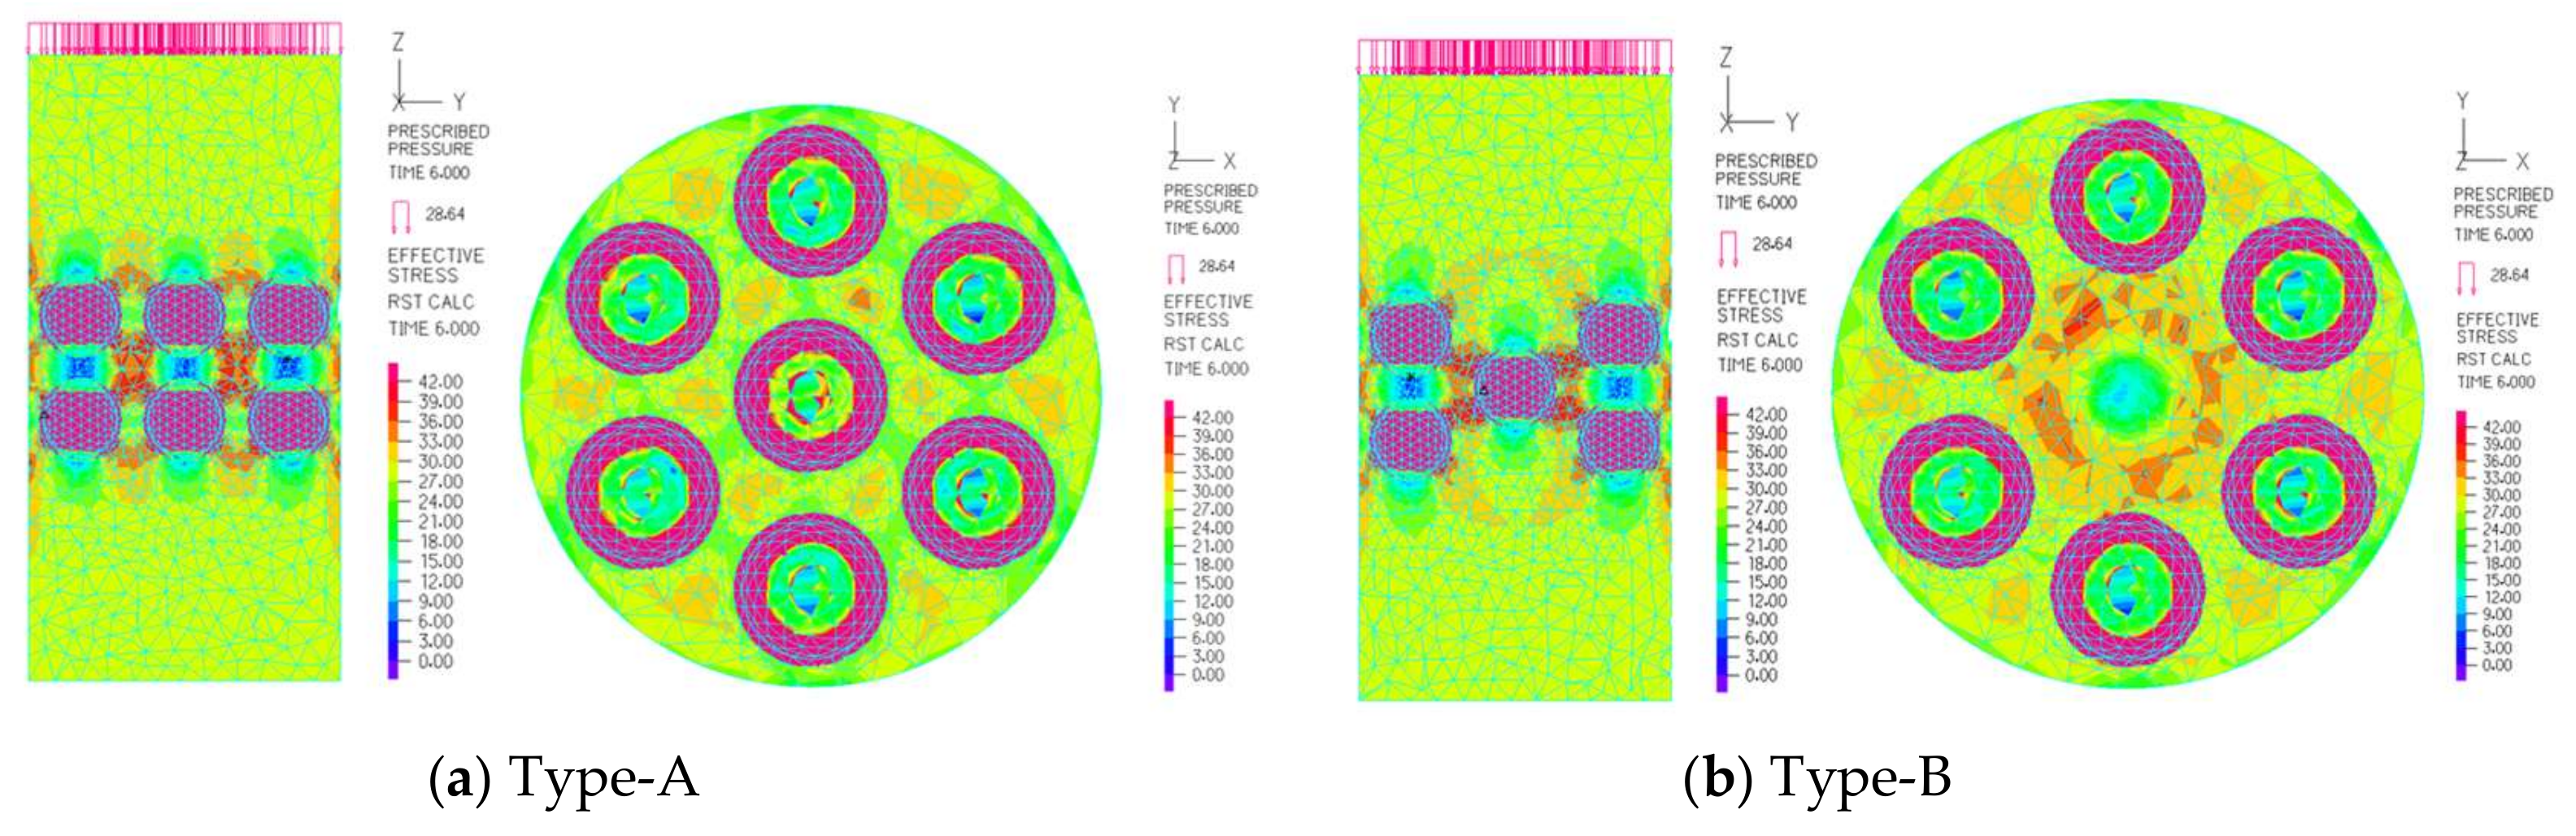
4.1.2. Nonlinear Finite Element Simulation of Multiple Spheres

The analytical model of the bubble concrete mixed with multiple steel spheres is shown in Figure 22. The same size concrete model was used, and the steel spheres were placed randomly in the concrete for the analysis. In order to save C.P.U. time for the nonlinear elastoplastic incremental analysis, spheres were buried in 1/3 of the height of the bubble concrete model, and the compressive strain of the analytical model were calculated for the 1/3 height.
The stress distribution inside the bubble concrete is shown in Figure 23. Due to the Z-directional load, when the concrete contains multiple spheres, significant stress is generated on the surface of the steel spheres, which causes the spheres to deform. The deformation of the spheres reduces stresses in the concrete on the upper and lower sides of the sphere and increases stress in the oblique direction. Moreover, the stresses around the spheres are superimposed, which affects the stresses in the surrounding concrete. The greater the number of spheres be, the greater the stress generated on the concrete. When the spheres are close to the edge of the concrete, premature damage to the concrete occurs.
Based on the results of the compression test and the stress distribution diagram, the main reasons for the failure of bubble concrete with multiple steel spheres can be summarized as the following three points:
(1)
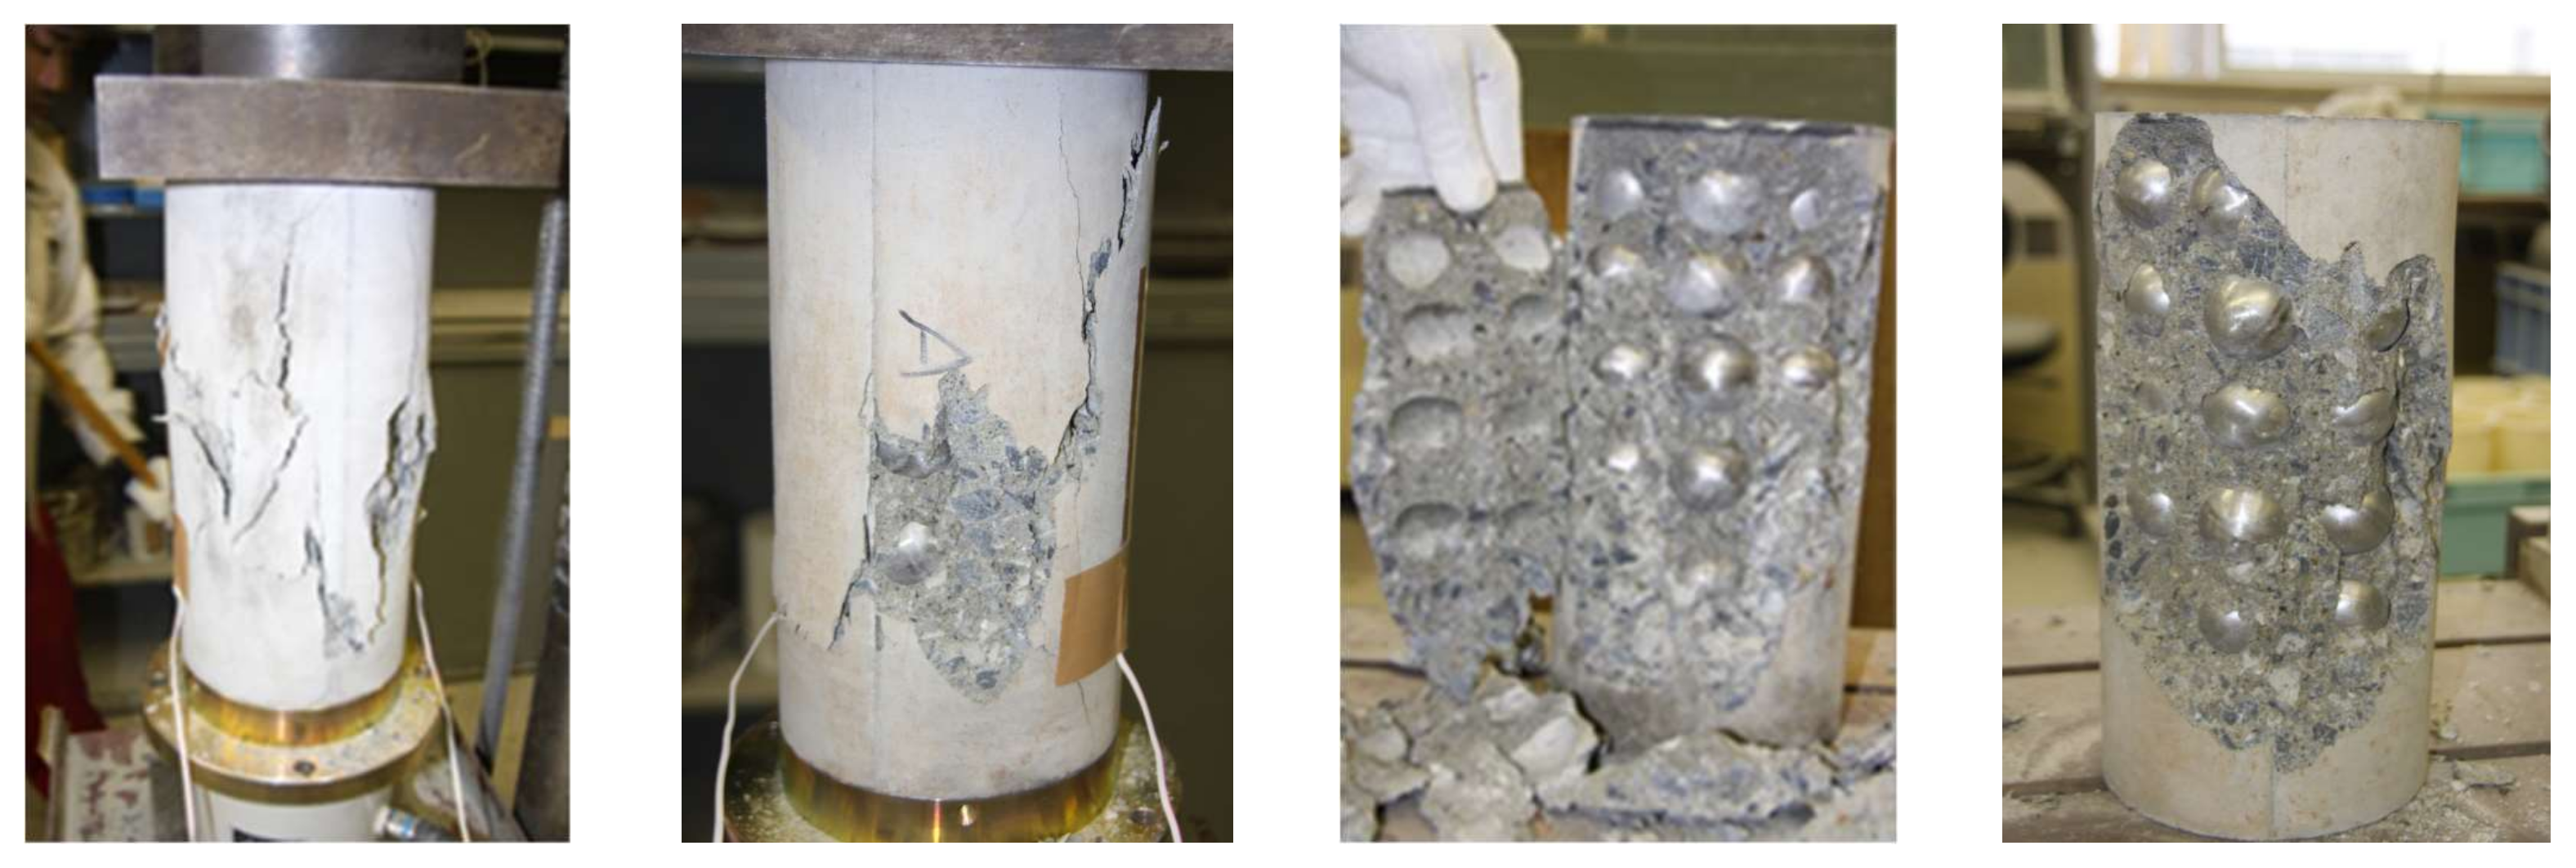
Compression occurs in the vertical direction. In contrast, the oblique direction produces expansion, increasing stress. If the steel sphere is close to the edge of the concrete, it may cause the outer concrete to peel off quickly.
(2)
The steel sphere has poor adhesion to the concrete, so the steel sphere is stripped from the concrete. Moreover, the concrete on the outside is susceptible to outward crumbling when it is extruded laterally.
(3)
The steel spheres, as additional aggregates, lead to a reduction in cement paste content, which causes the adhesion within the concrete to decrease. Moreover, since the density of steel spheres is lower than that of cement, the steel spheres tend to float on the concrete paste and aggregate when fabricating concrete specimens.

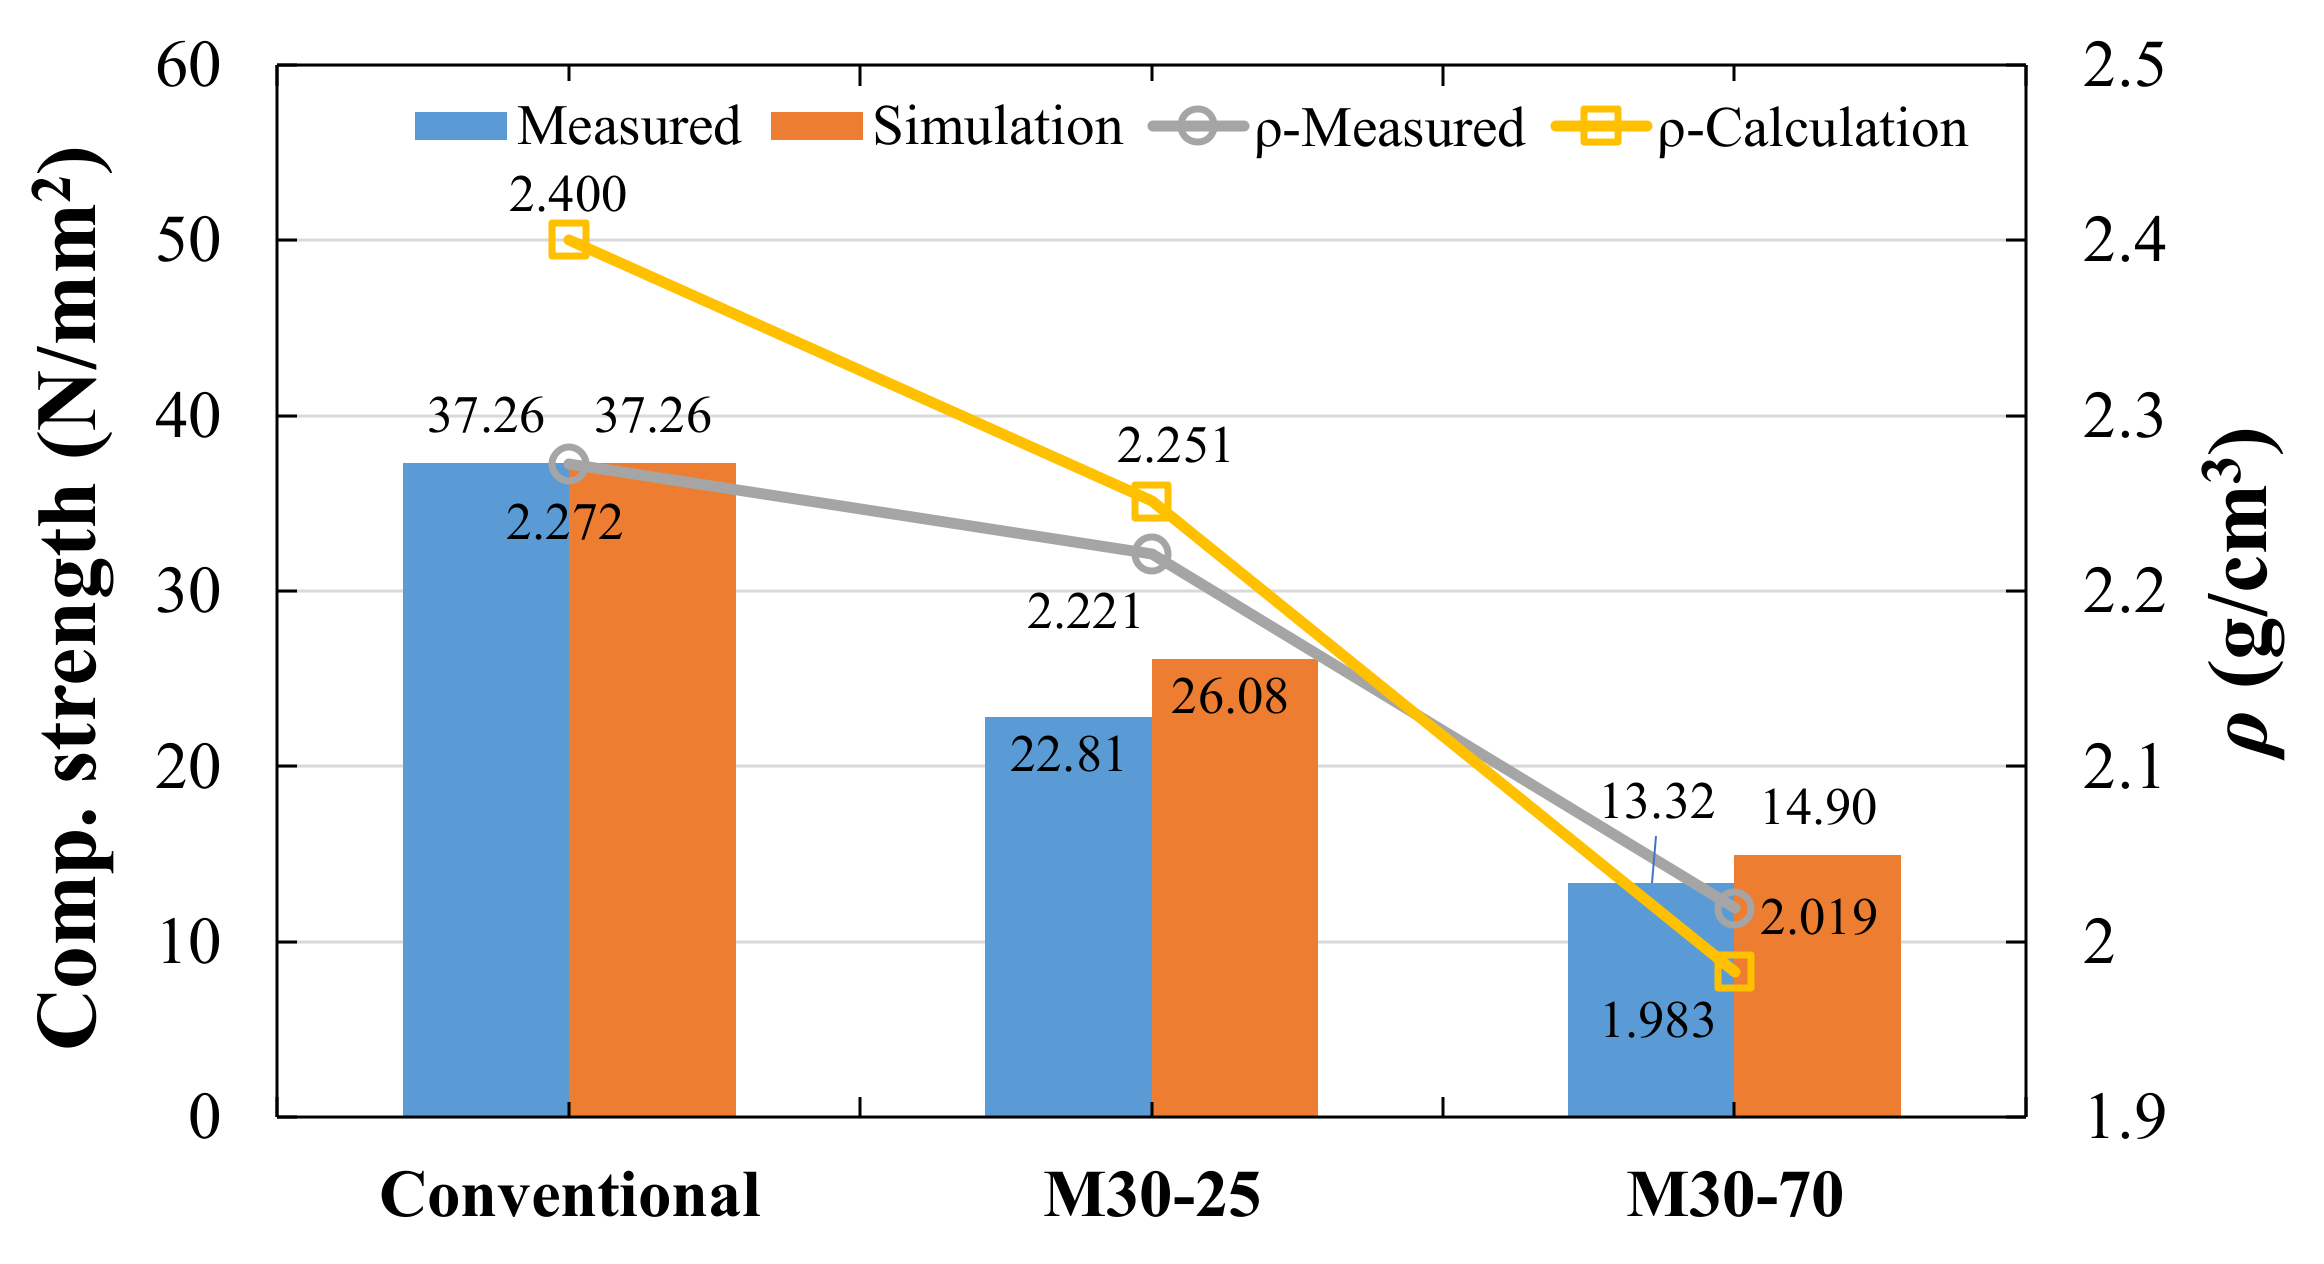
4.2. Mechanical Characteristics of Multiple Cubic Concave Bodies

Multiple concave bodies were mixed into the concrete, and the number of cubic concave bodies was changed to study the effect of the number of concave bodies on concrete density, strength, and Young’s modulus. Experiments and elastoplastic analyses were carried out to explore the mechanical characteristics and failure mechanism of bubble concrete.

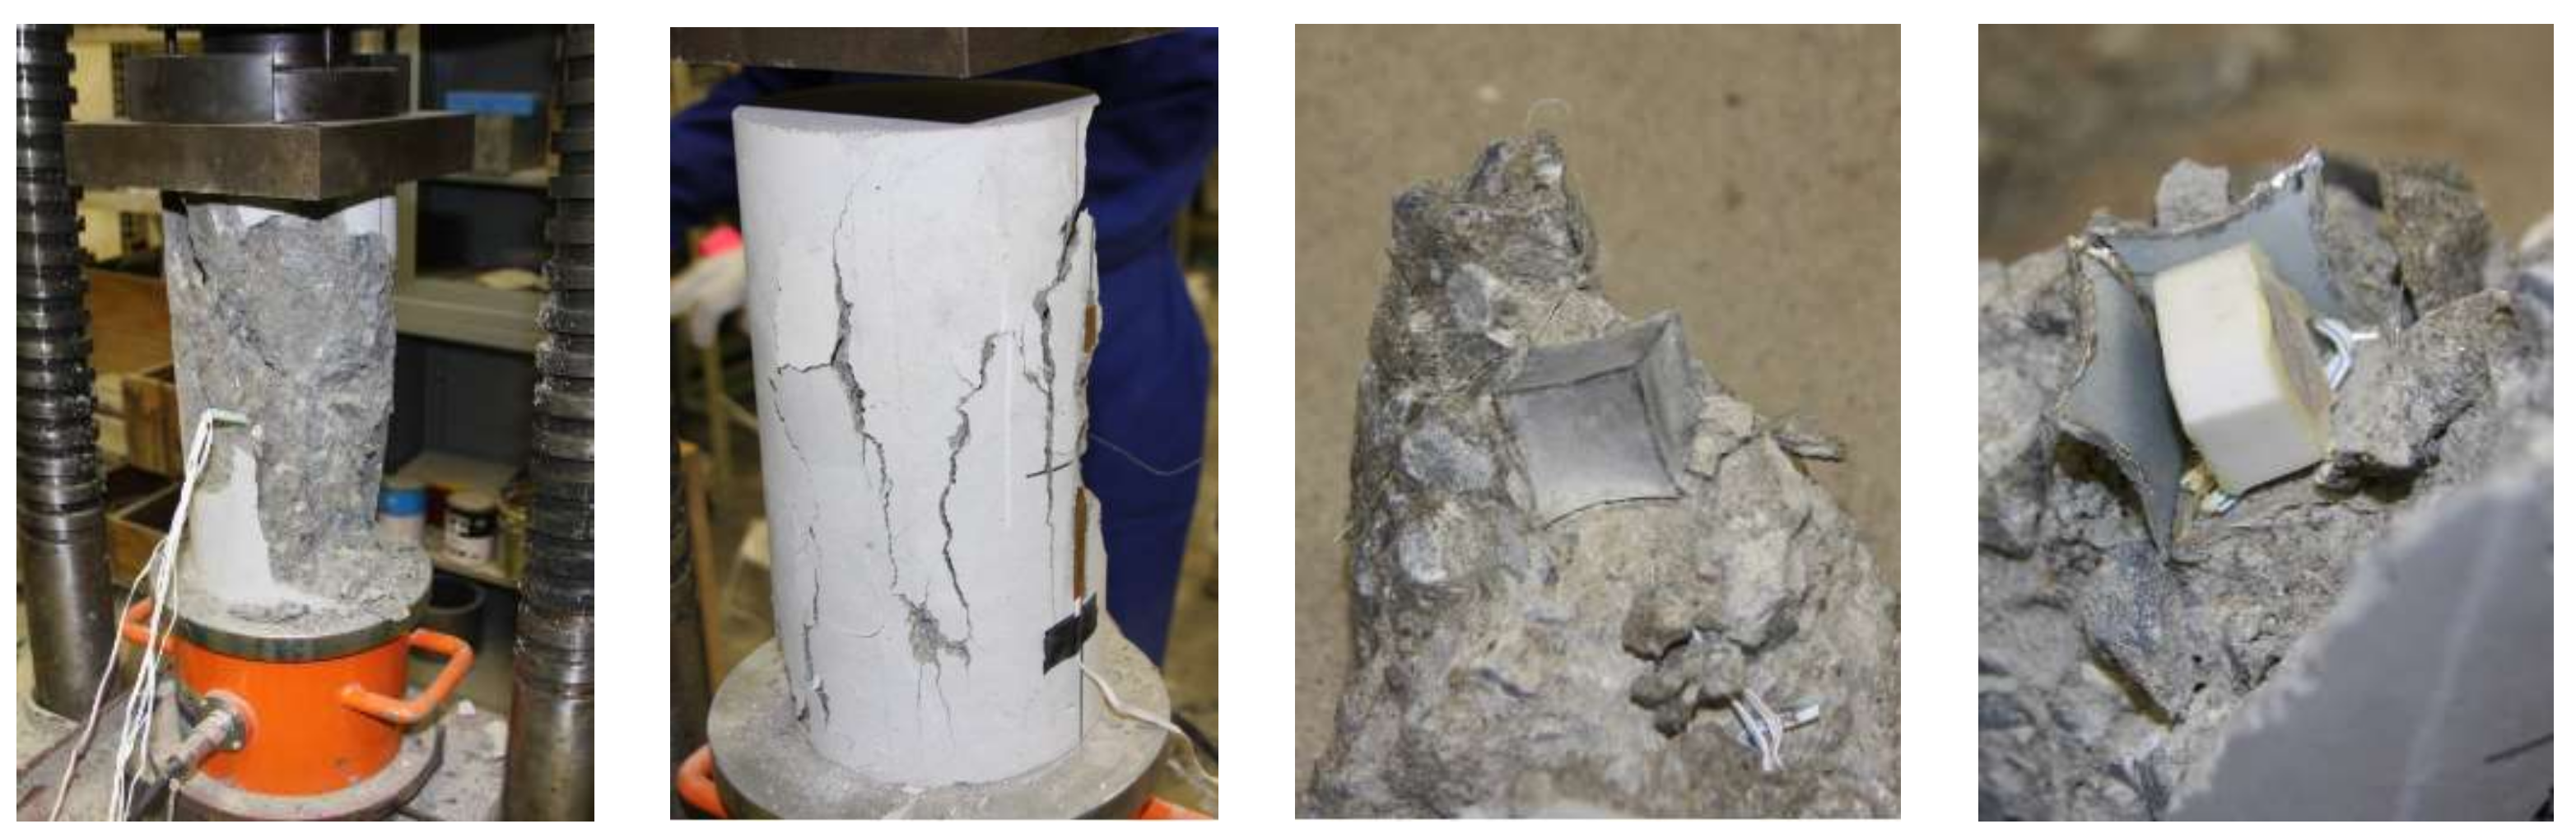
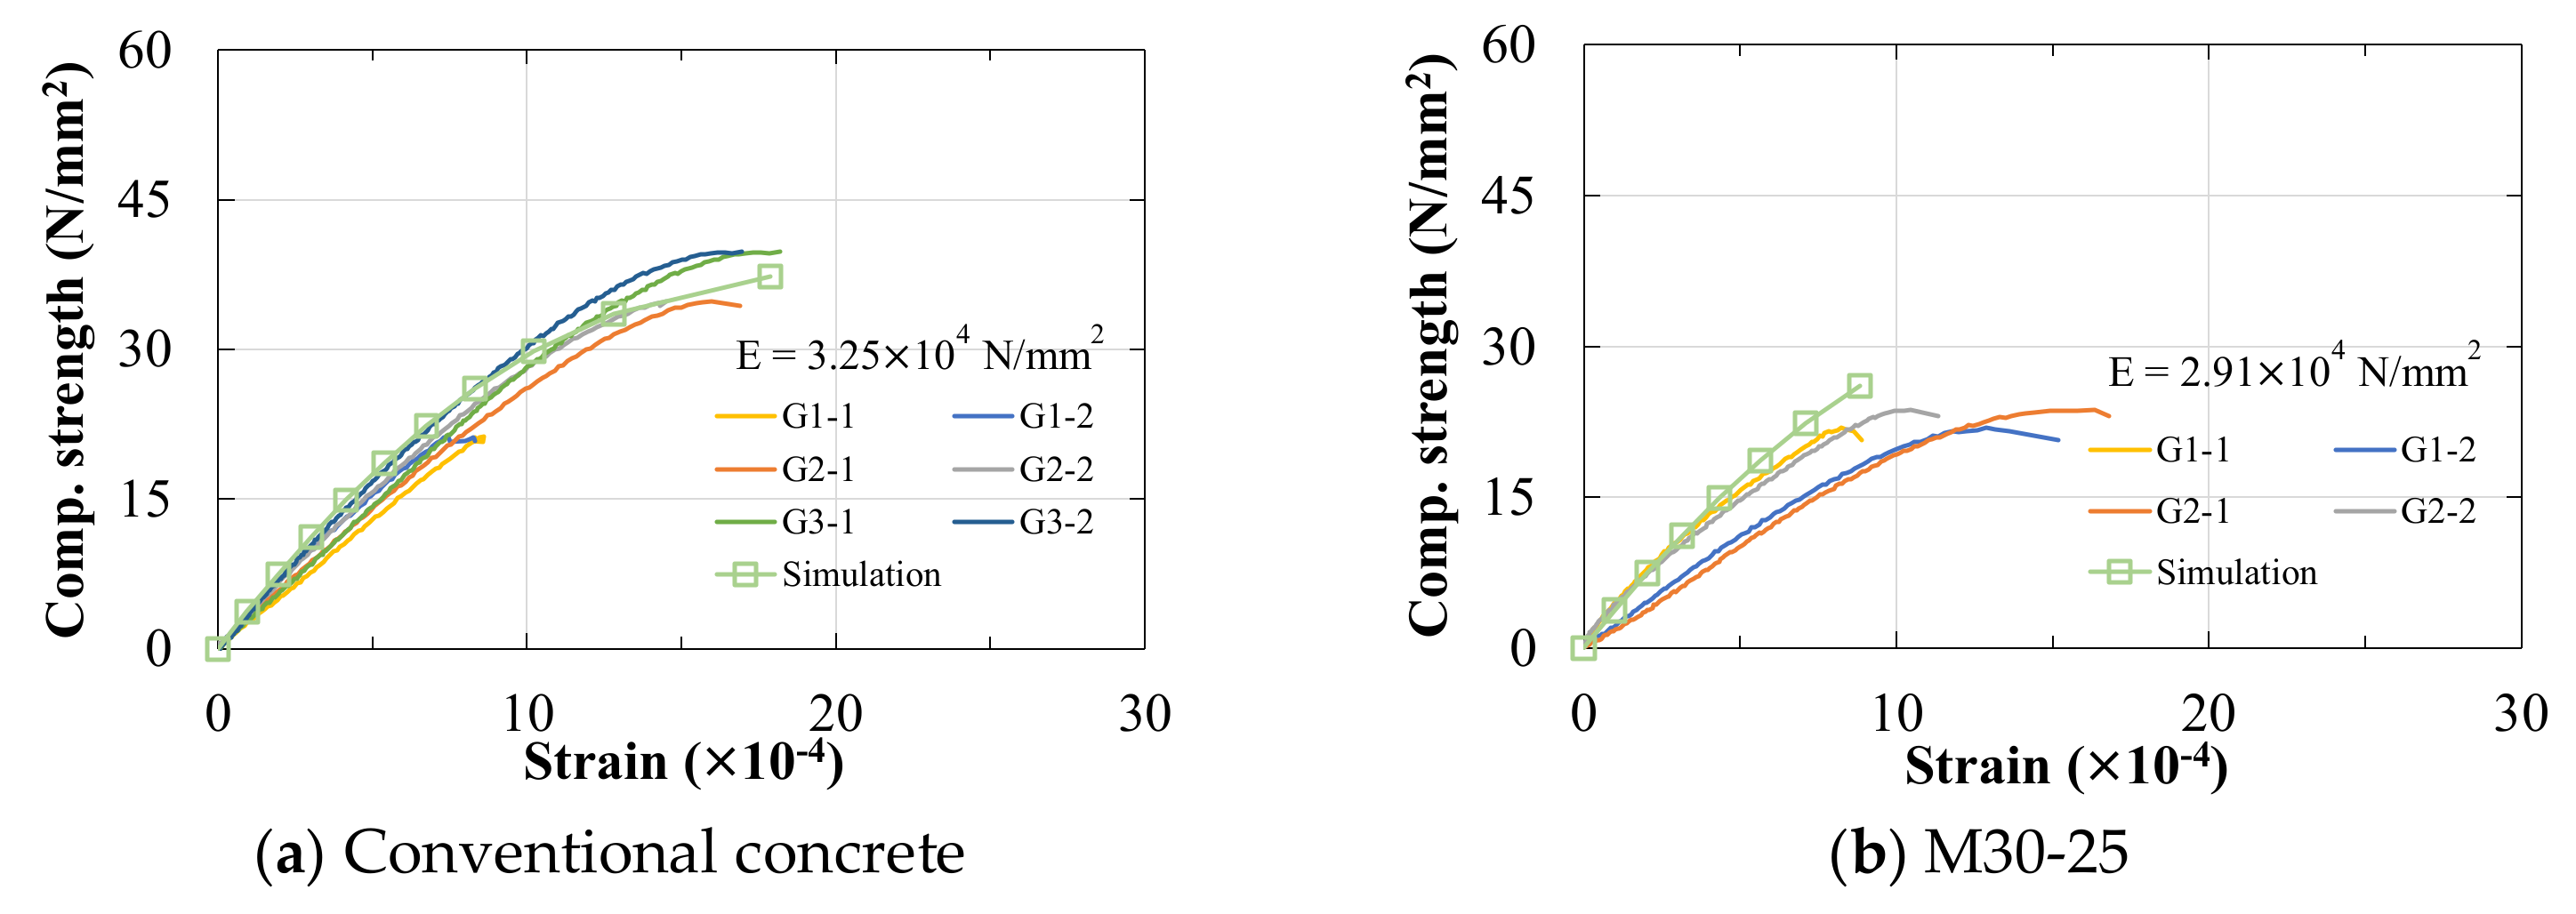
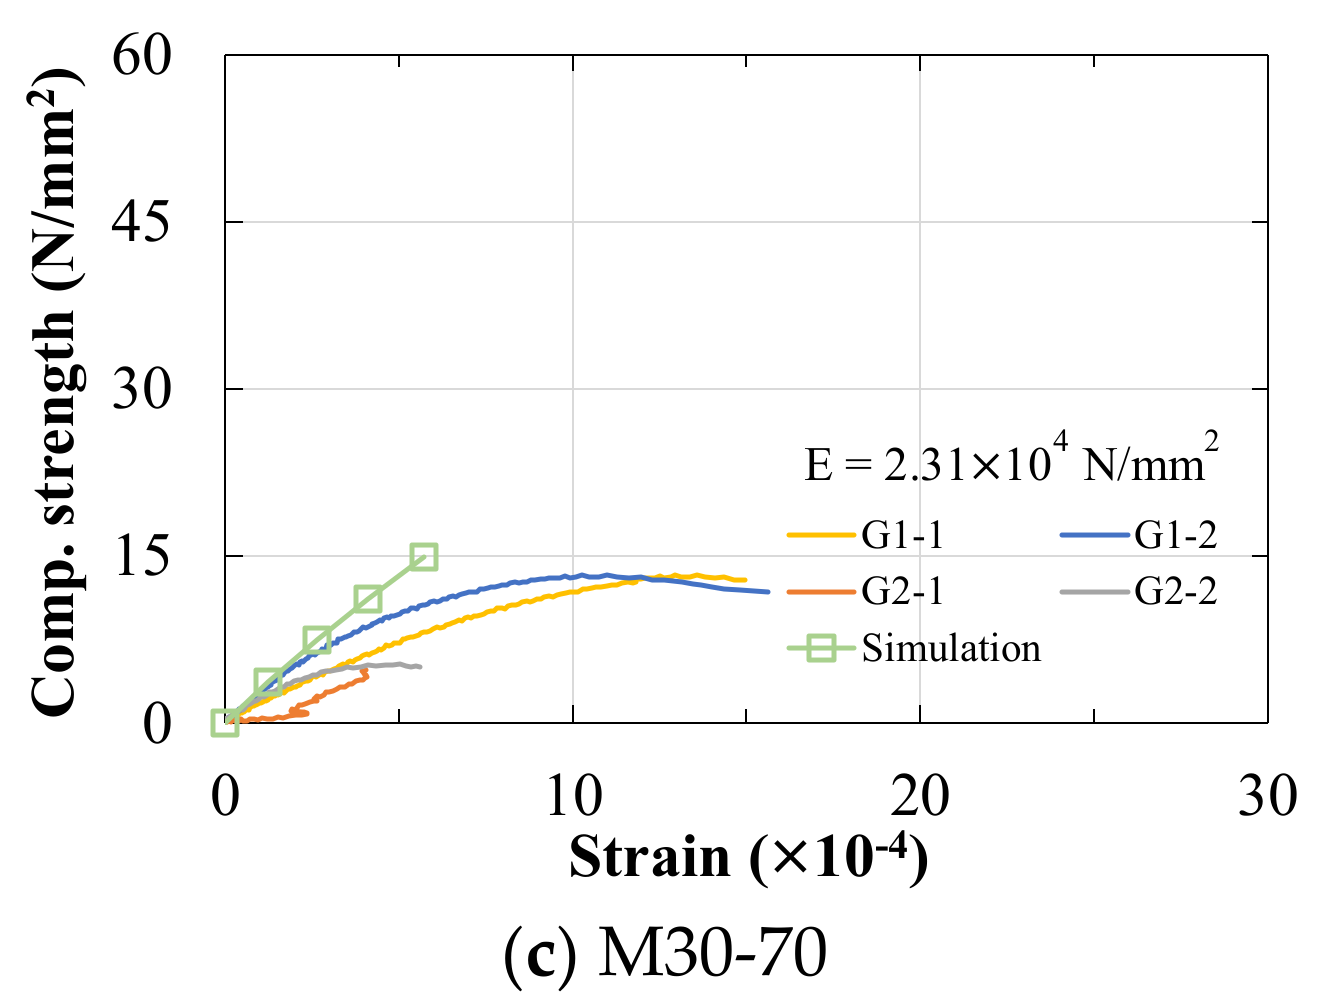
4.2.1. Concrete Compression Experiments of Multiple Cubic Concave Bodies

The cubic concave bodies used in this experiment had a diameter of 30 mm, a thickness of 0.8 mm, and depression of 2 mm, as mentioned in Section 3.2. Two concrete specimens, each with 25 and 70 concave bodies, were fabricated. Additionally, three concrete specimens without concave bodies were fabricated with the same concrete for comparison. The completed concrete specimens were cured in water for 28 days, and then the concrete compression test was performed.
The density and strength of the concrete specimens are shown in Figure 24. The experiment results were similar to those when steel spheres were used. The average density of conventional concrete was 2.272 g/cm3, while the bubble concrete was 2.019–2.221 g/cm3. The average strength of conventional concrete was 37.263 N/mm2, while the average strength of bubble concrete was 13.32–22.81 N/mm2. The stress–strain curves of the concrete specimens are shown in Figure 25. When many concave bodies are mixed into the concrete, the strength and Young’s modulus of the concrete drop significantly. The modes of failure concrete are shown in Figure 26. After the concrete was stressed, cracks were generated inside the concrete. As the load increases, the cracks further increase, the outer concrete falls off, and then the concrete specimens are destroyed as a whole.
The average strength of the fresh concrete in this experiment was lower than 40.0N/mm2, so the strength of the bubble concrete was lower than that with spheres. Moreover, since the thickness of the concave bodies used in this experiment was 0.8 mm, the concave bodies deformed quickly and peeled off from the concrete. Cracks were generated between the concrete and the concave bodies.

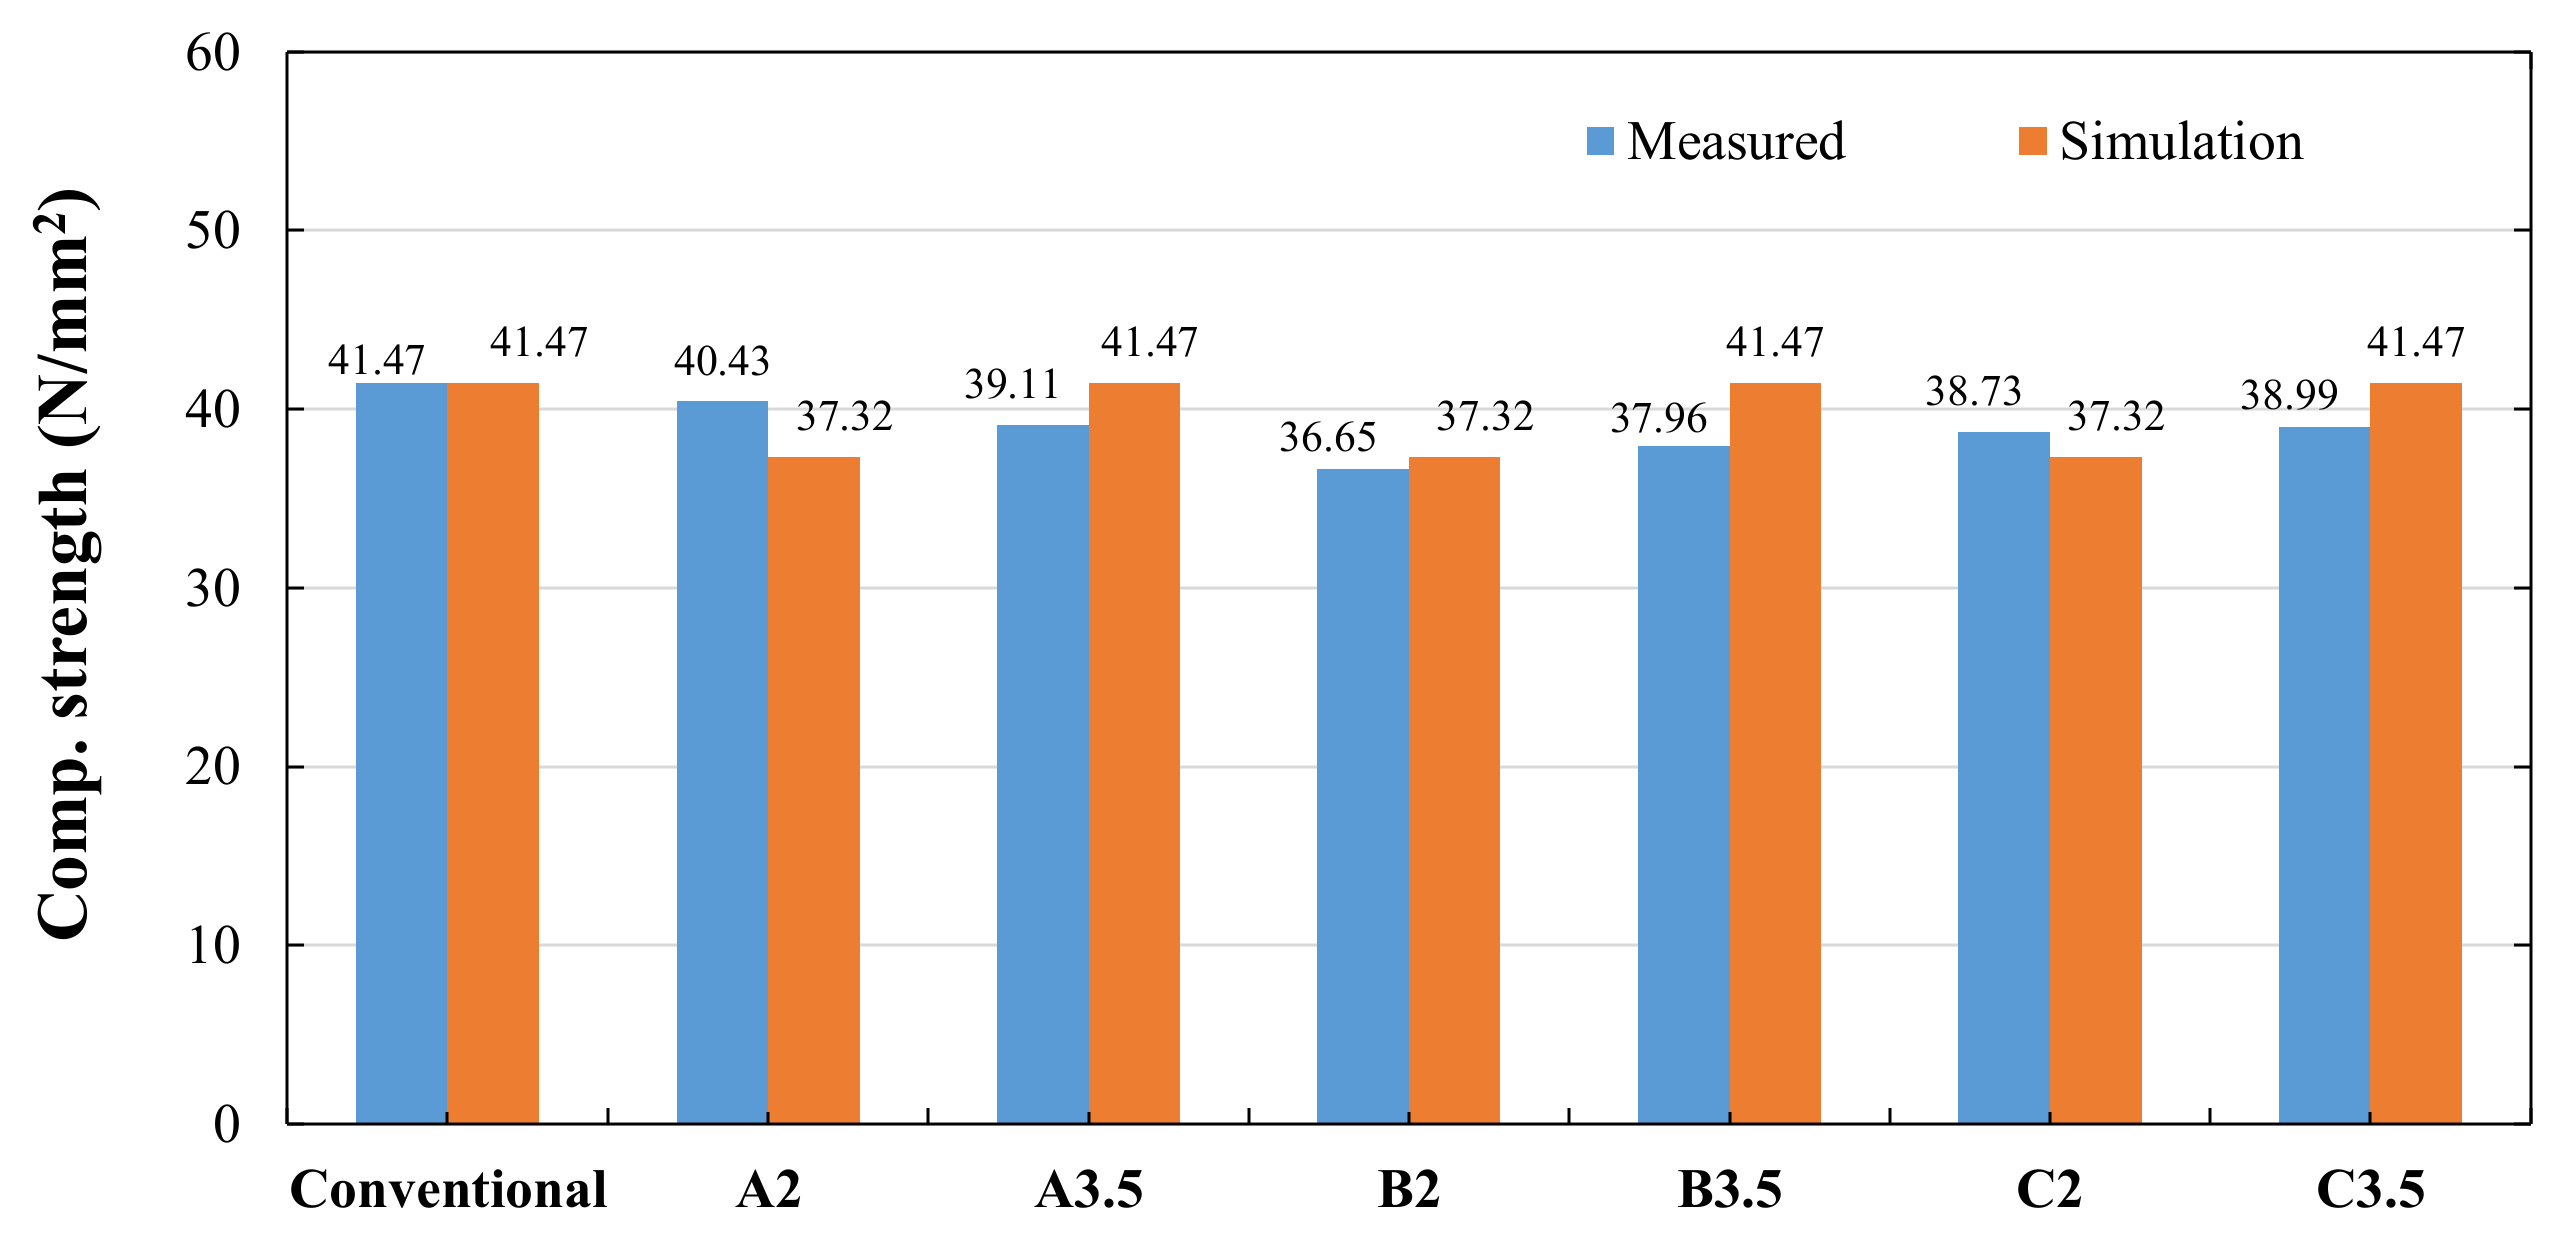
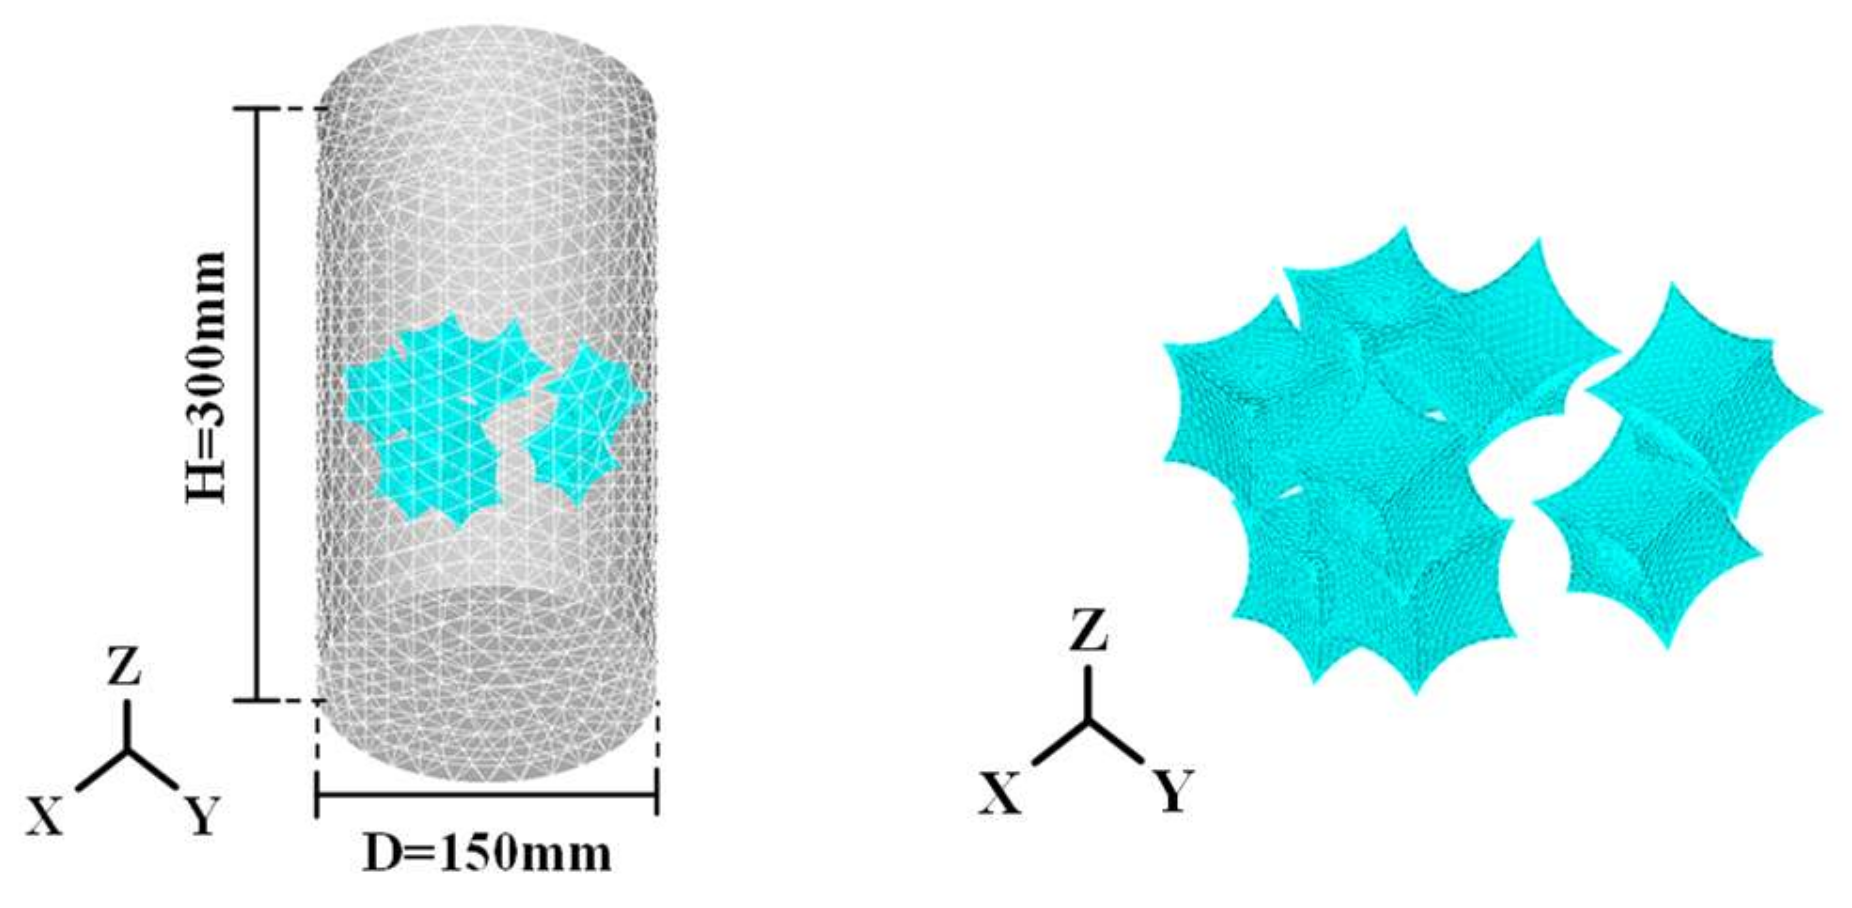
4.2.2. Nonlinear Finite Element Simulation of Multiple Cubic Concave Bodies

The bubble concrete model with multiple concave bodies is shown in Figure 27. The concave bodies were randomly placed in the concrete and parsed with the same method as before. The internal stress diagram of the bubble concrete is shown in Figure 28. In general, the stress characteristics of the concave bodies are similar to those when steel spheres were used. However, the deformation and stresses generated in the lateral direction are smaller than those when spheres are used.
Summarizing the above, the reasons for the concrete strength reduction when concave bodies were used can be attributed to the following three points:
  • Compared to spheres, concave bodies are prone to deformation because the thickness of the cubic concave model used in this study was only 0.8 mm. Moreover, it quickly peels off from the concrete after deformation.
  • The surface of the concave body is a milled face and the adhesion between the concave bodies and the concrete is poor. When the concrete bears the load, it easily produces many cracks between the concave bodies and the concrete.
  • Too many concave bodies were used, and the concave surface bodies cannot be fully contacted. When the concave surface body is deformed, it cannot provide enough cohesion stress.

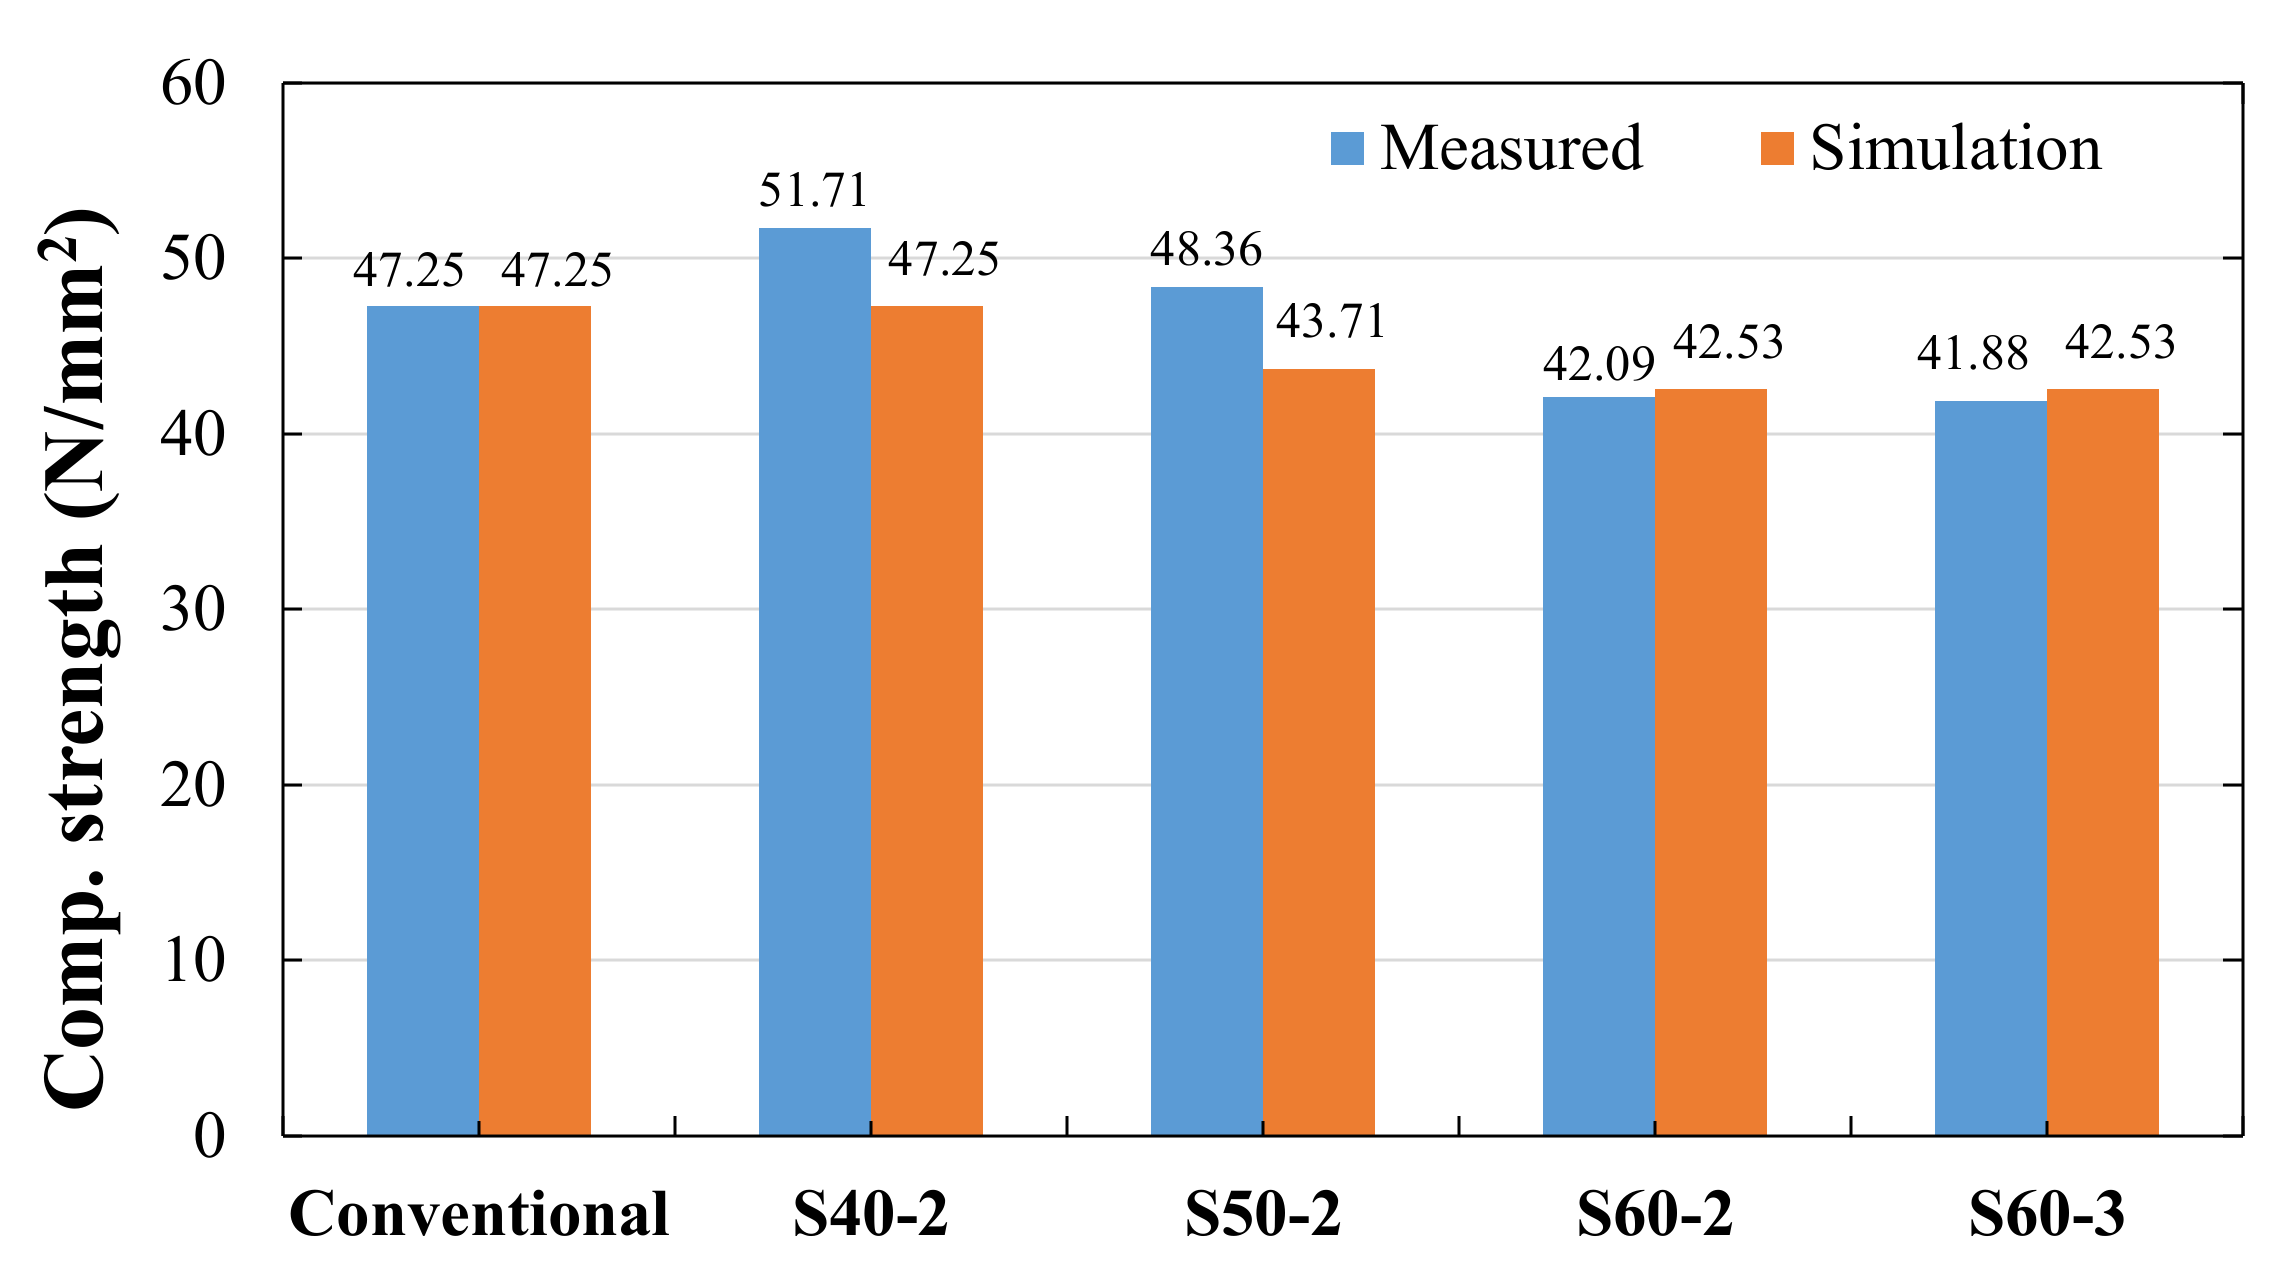
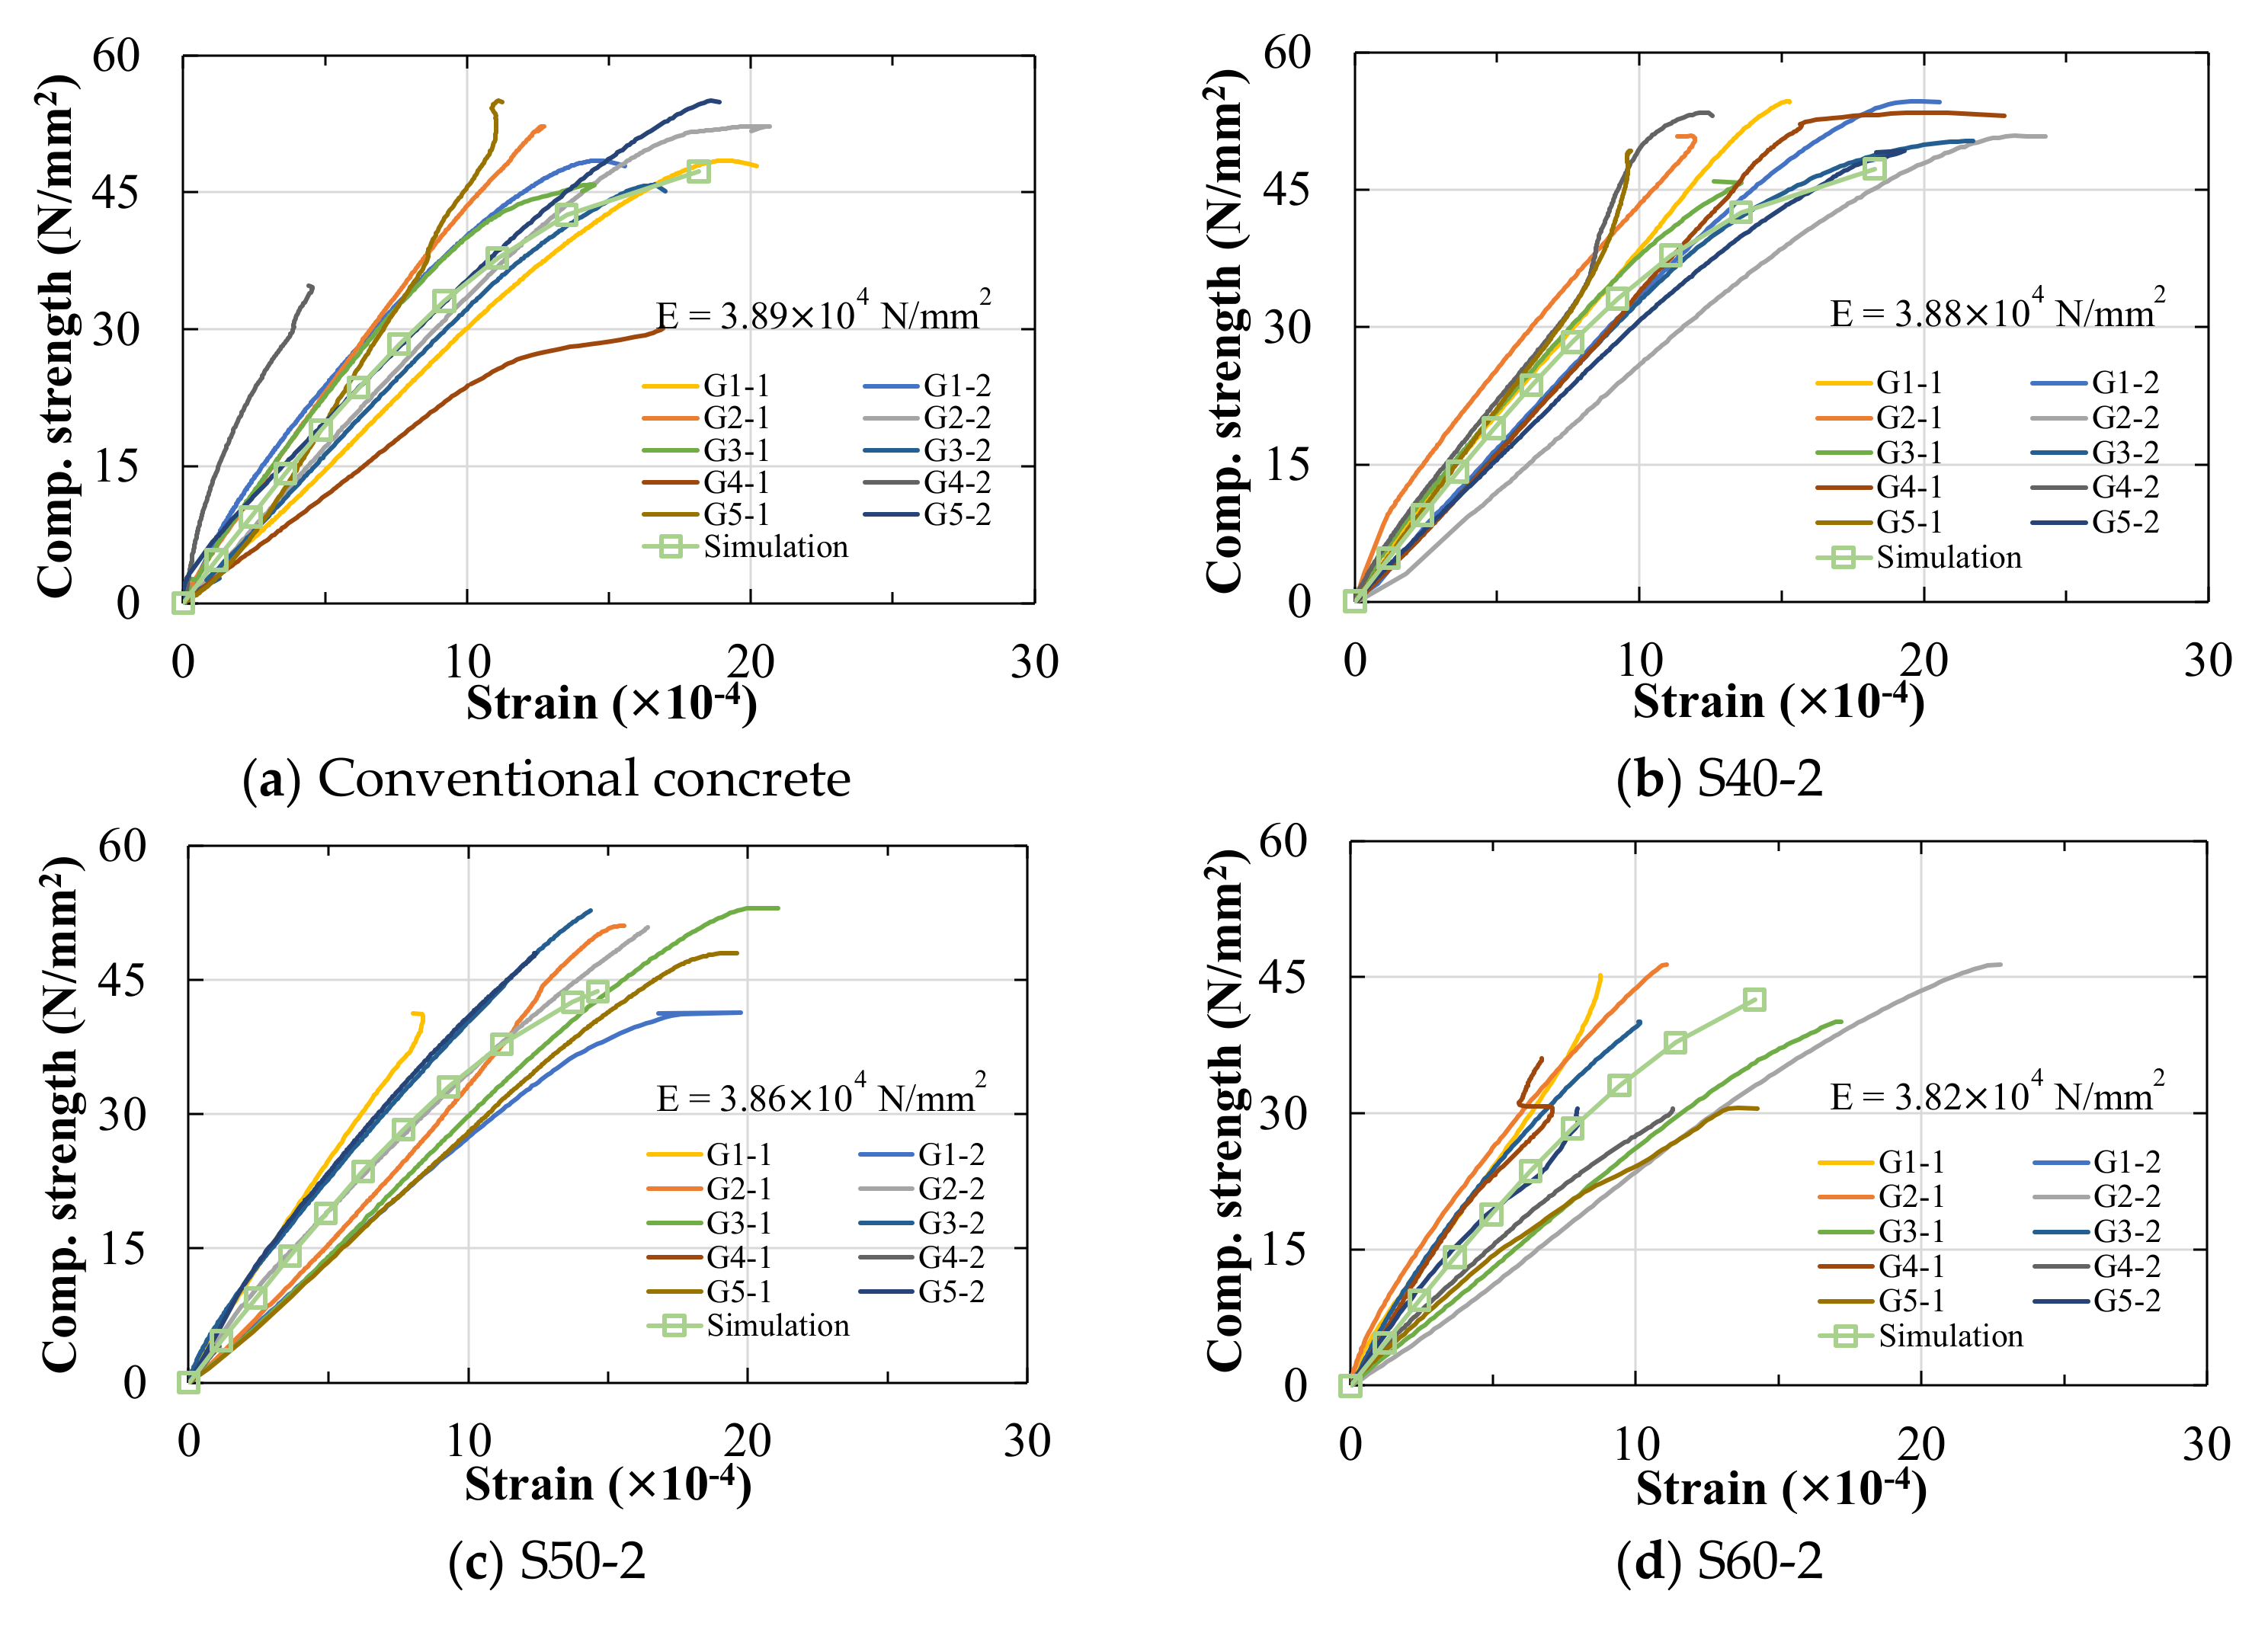
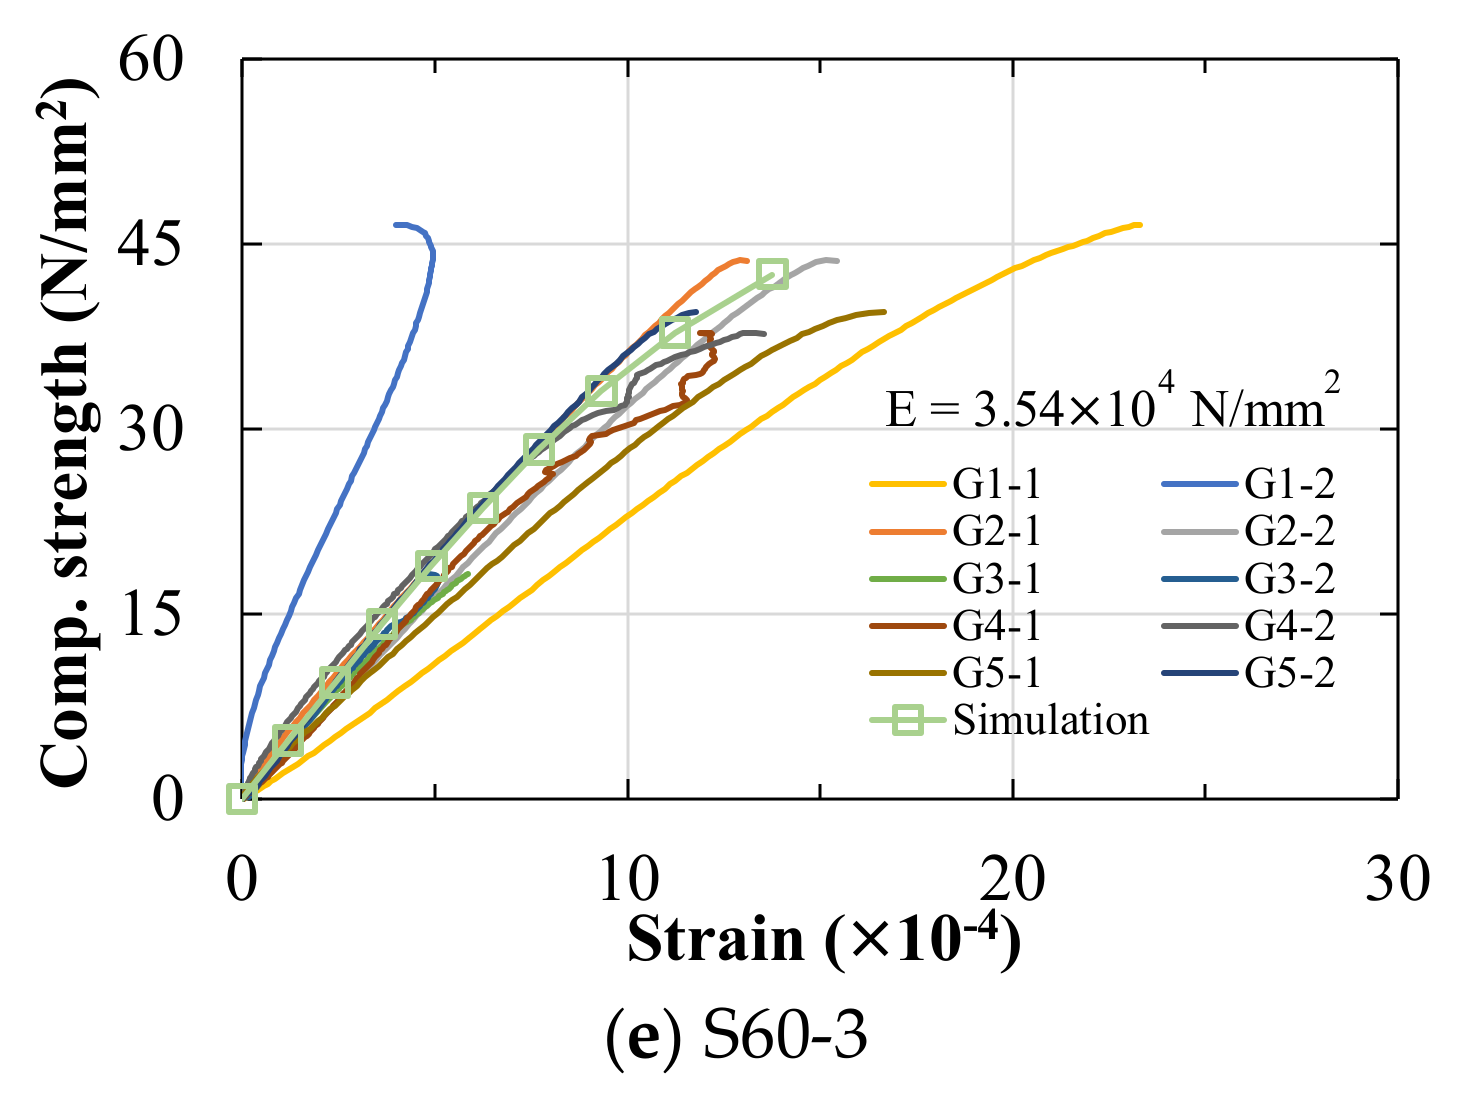
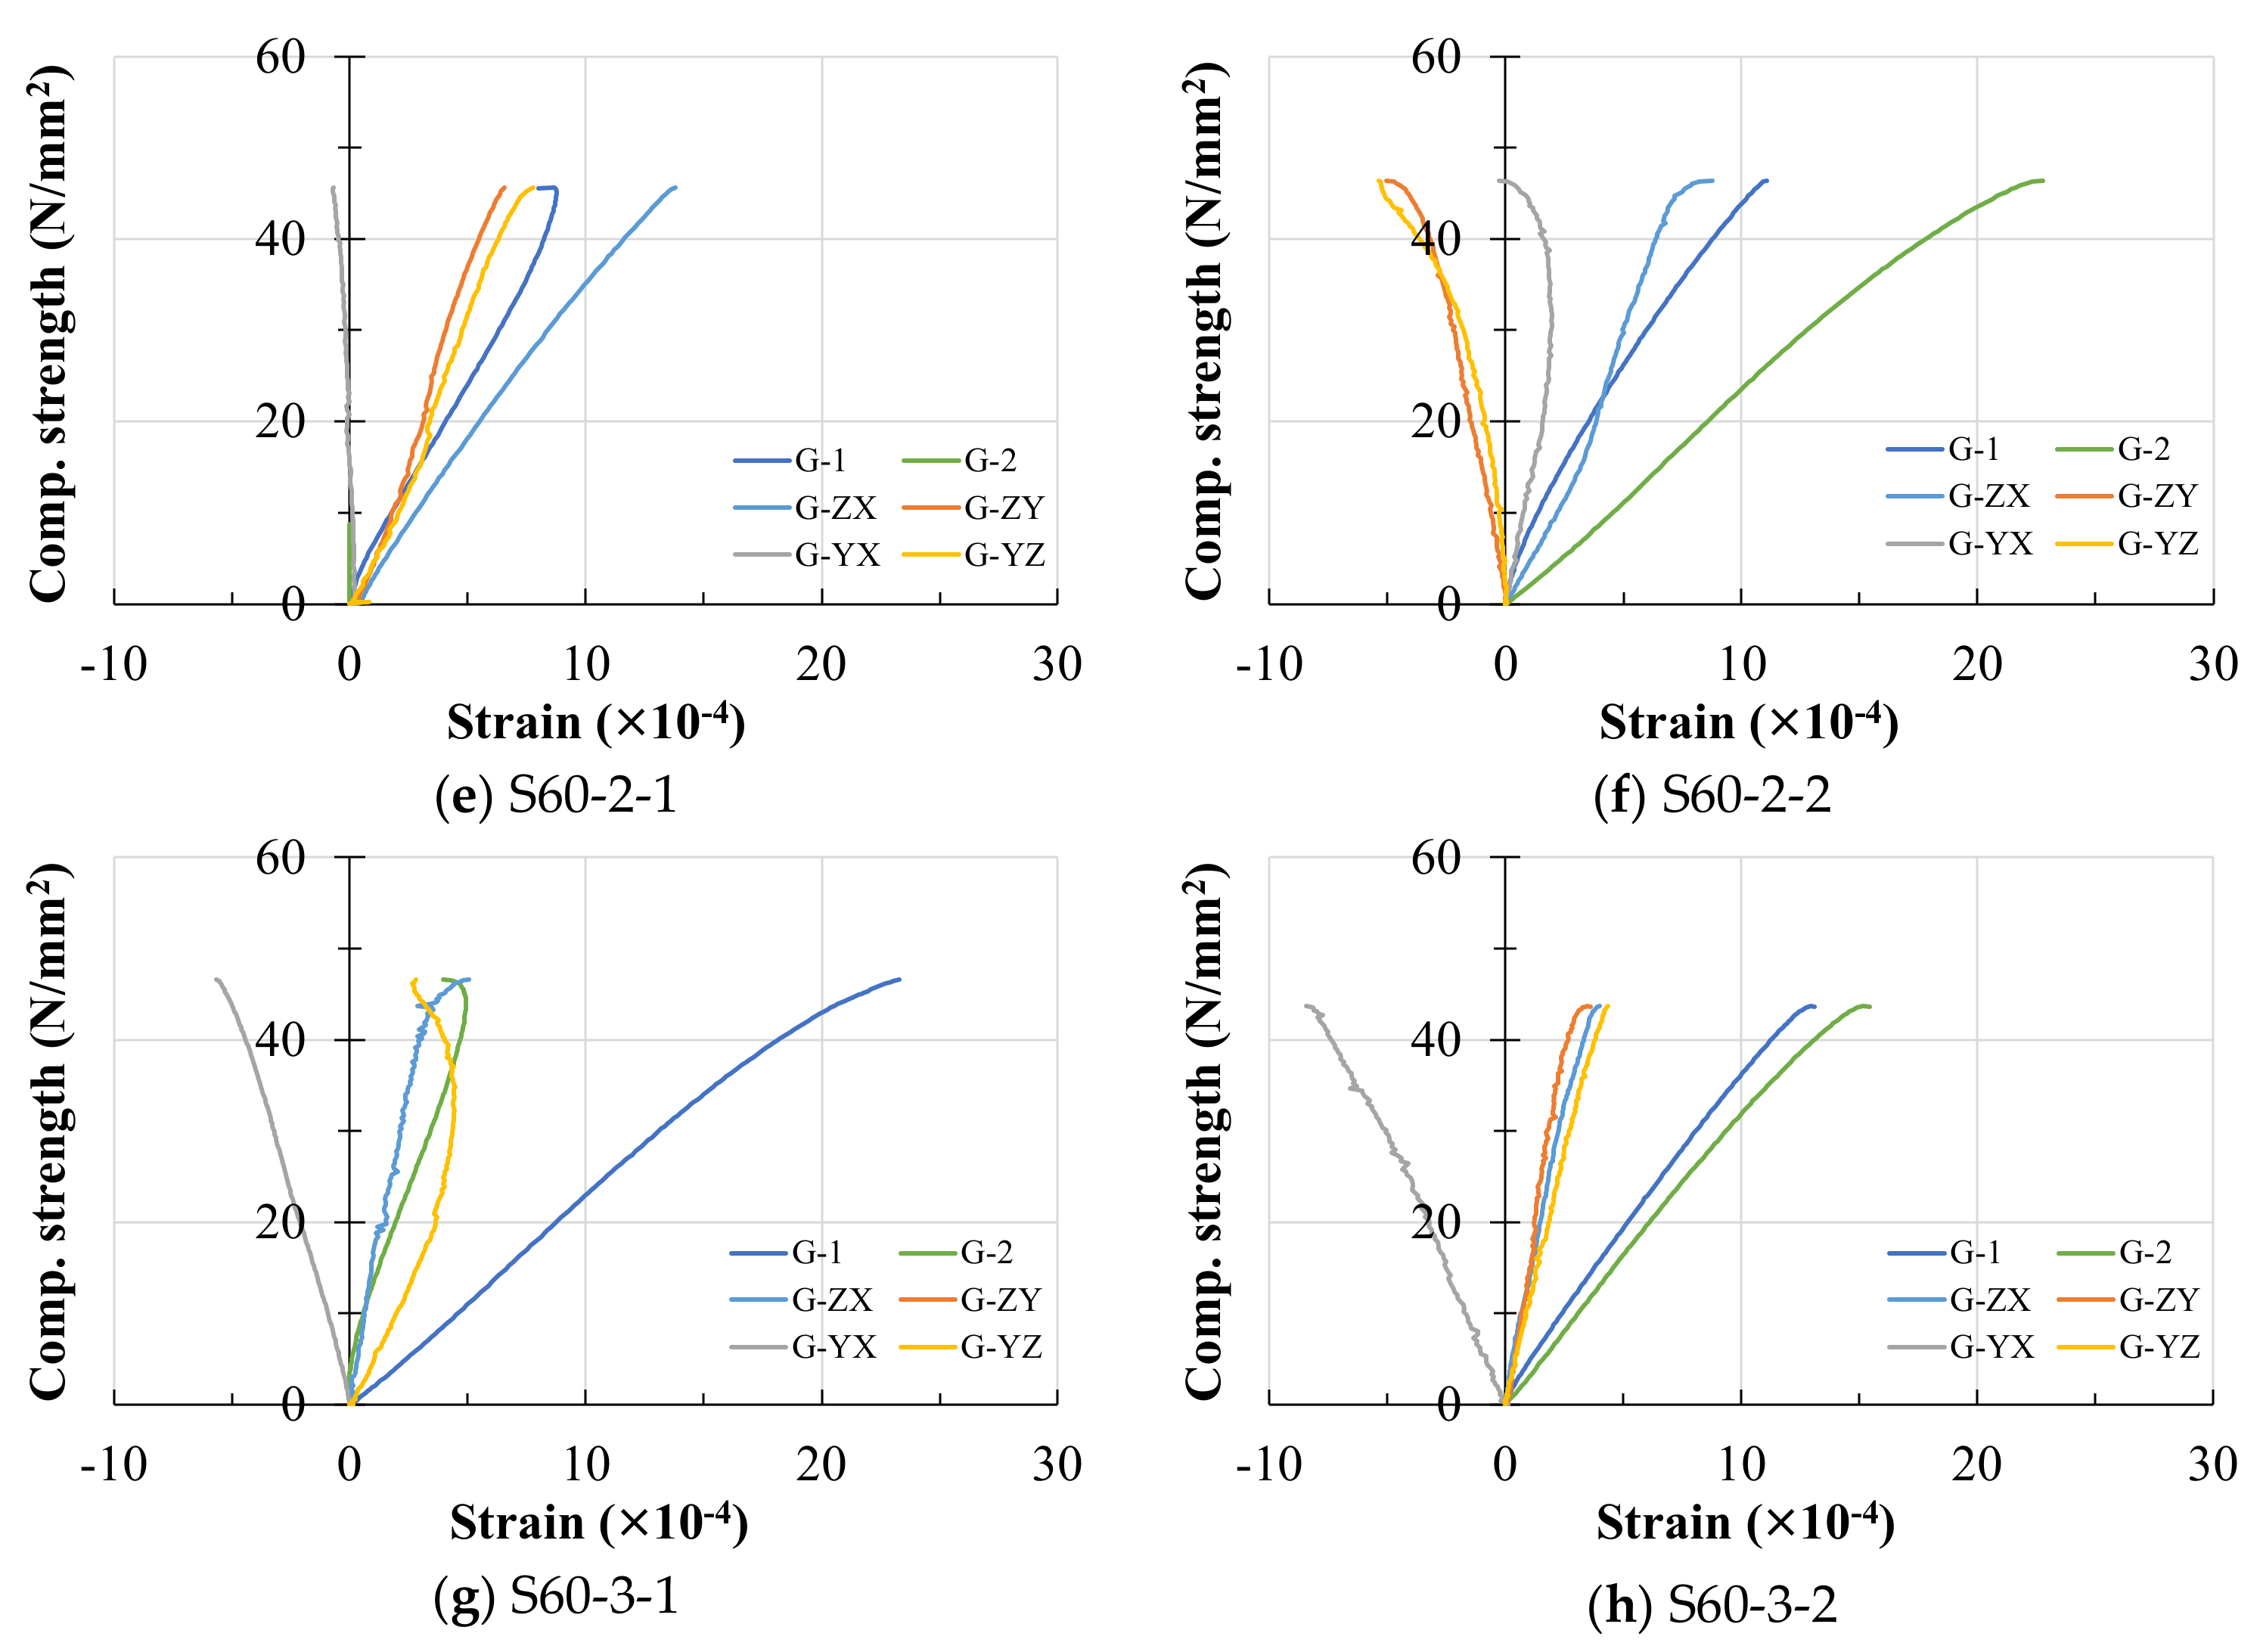
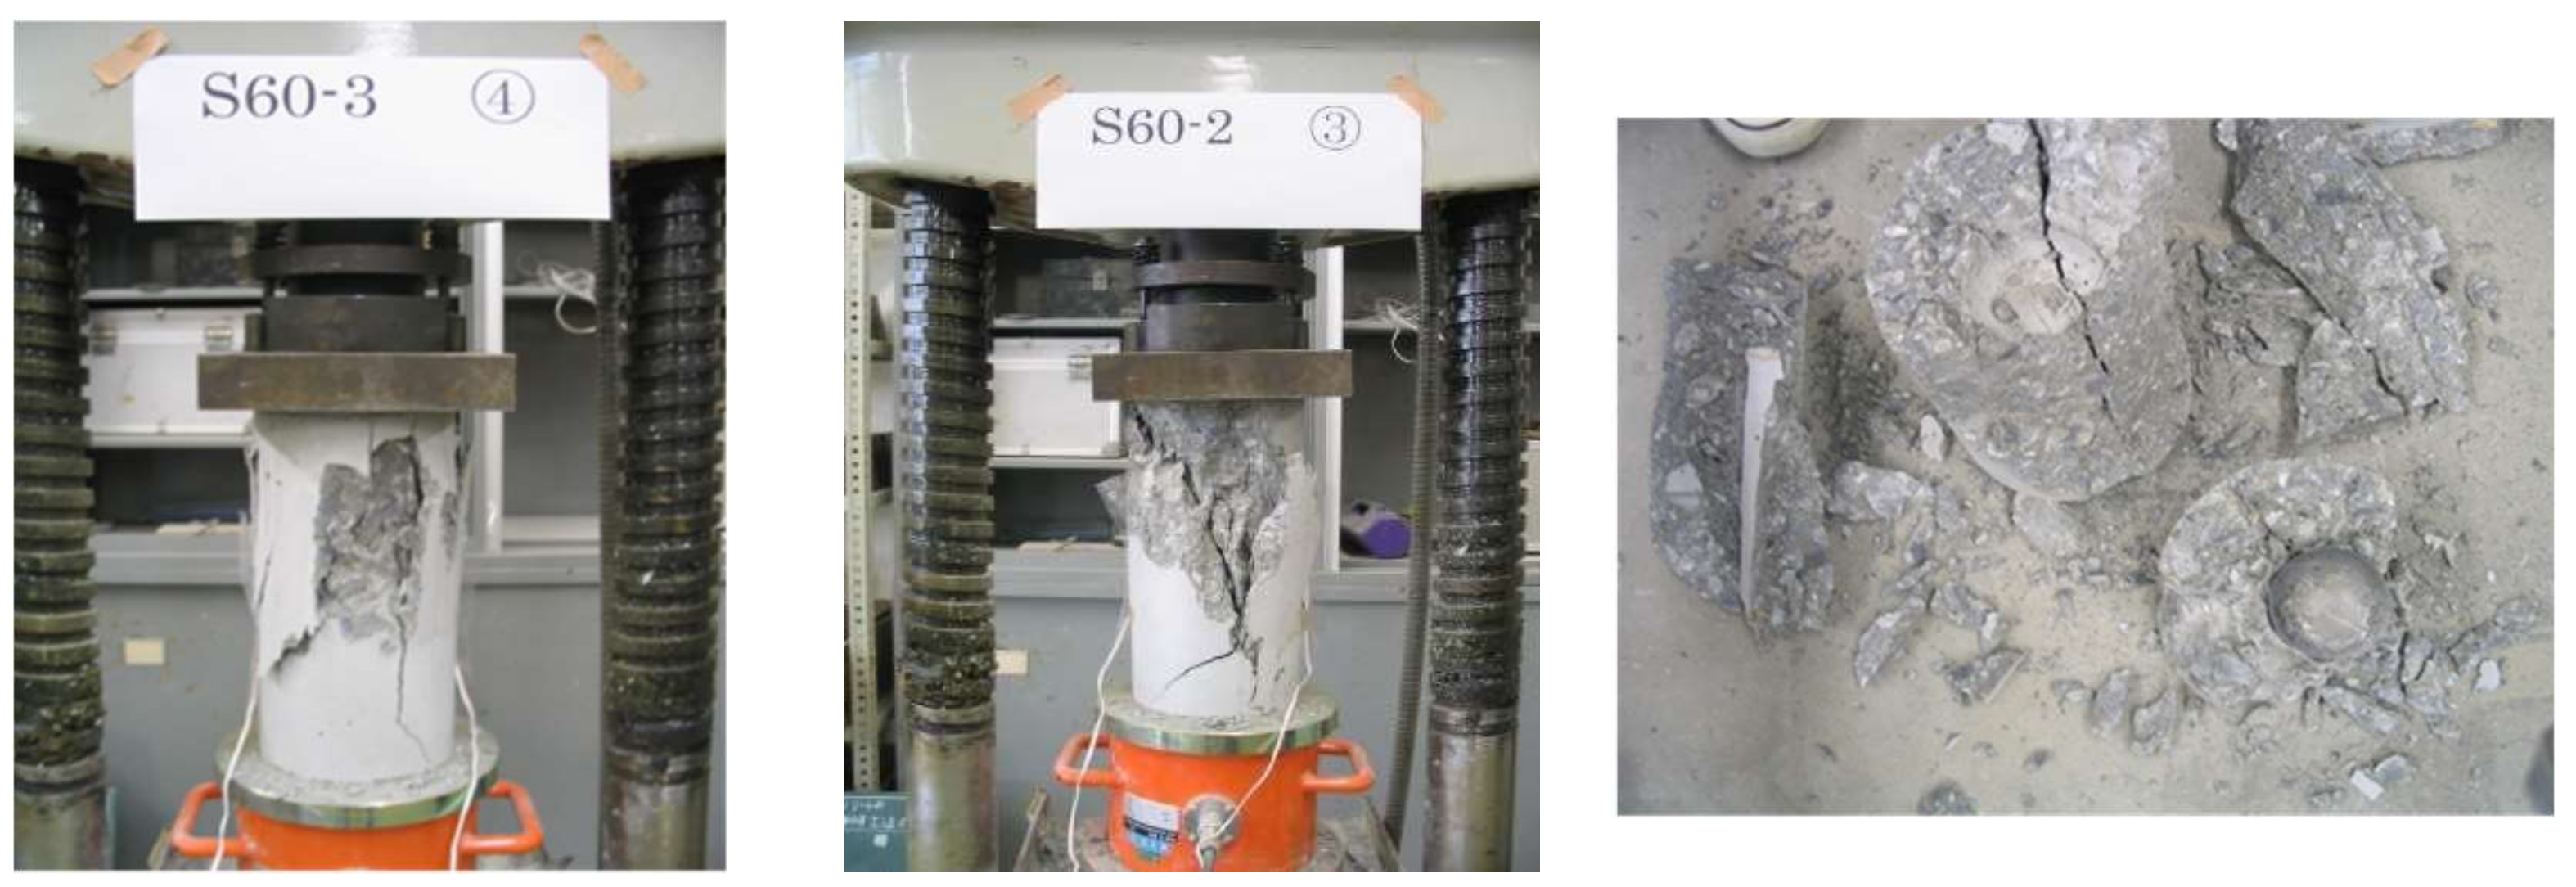
5. Mechanical Features of Hollow Bodies with Fixed Sphere Positions

In order to study the effect of hollow body position on the mechanical characteristics of the bubble concrete, experiments and F.E.M. analysis were carried out for concrete with fixed positions of the hollow bodies.

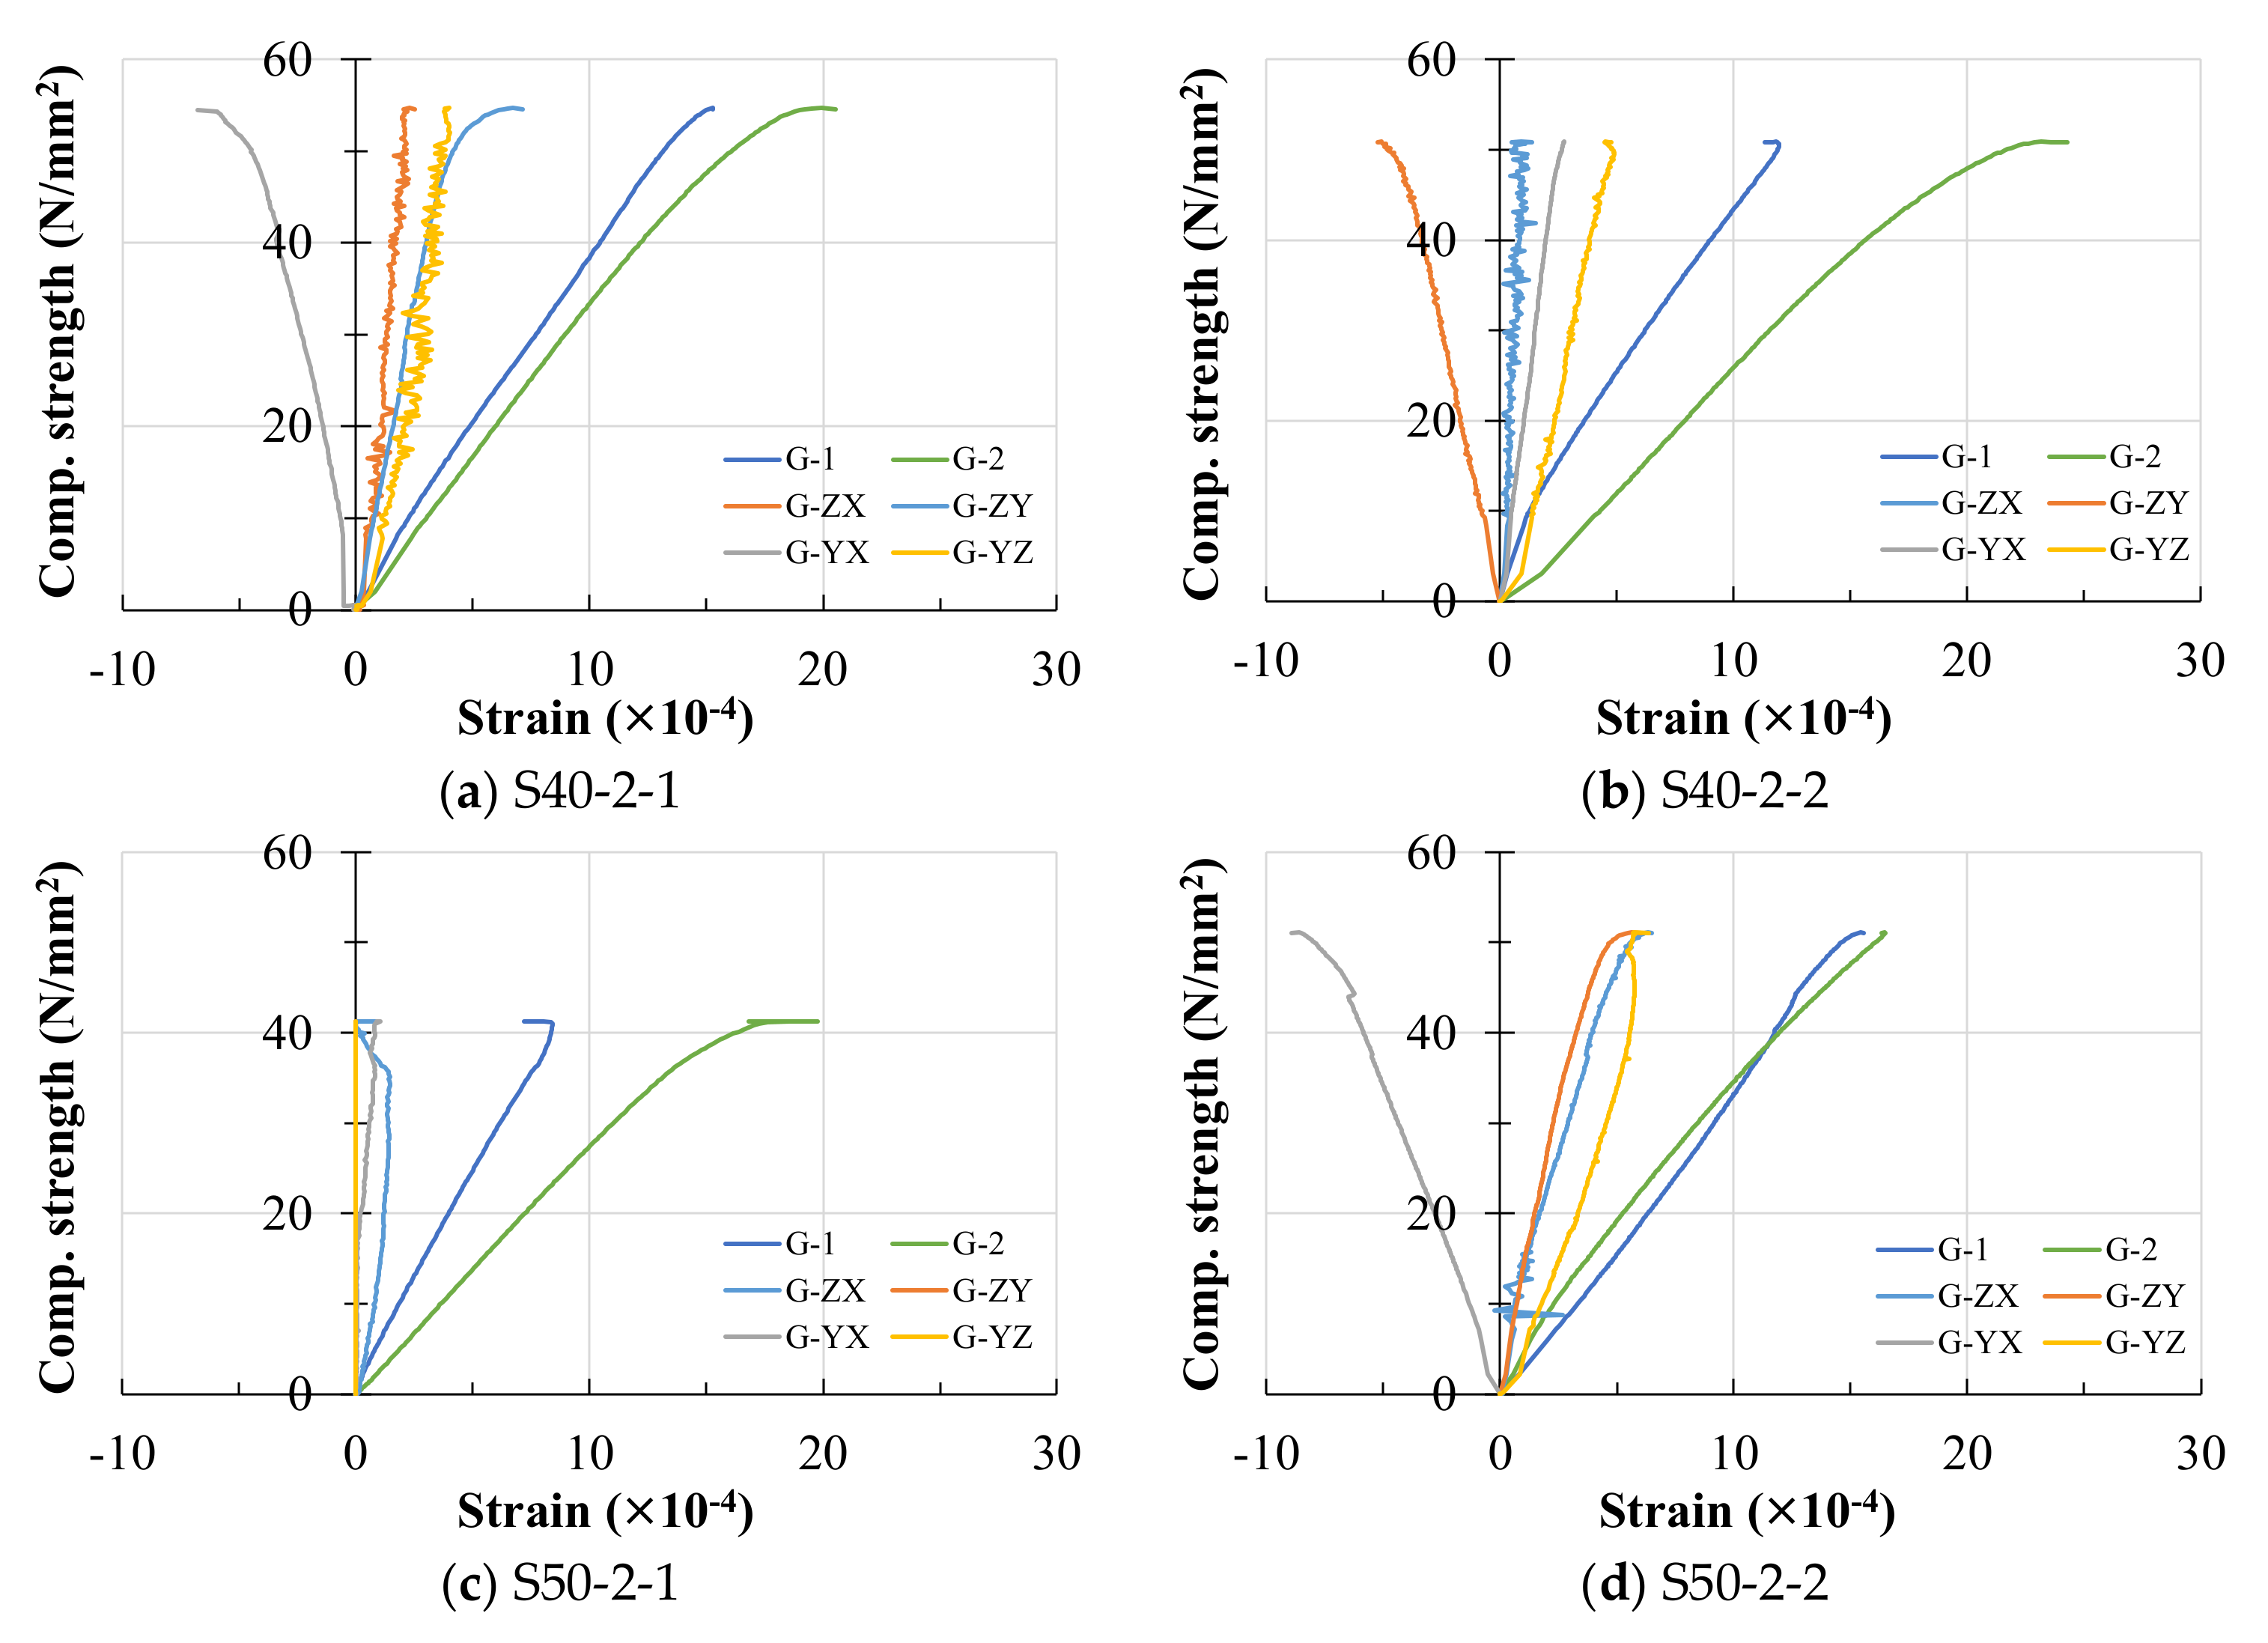
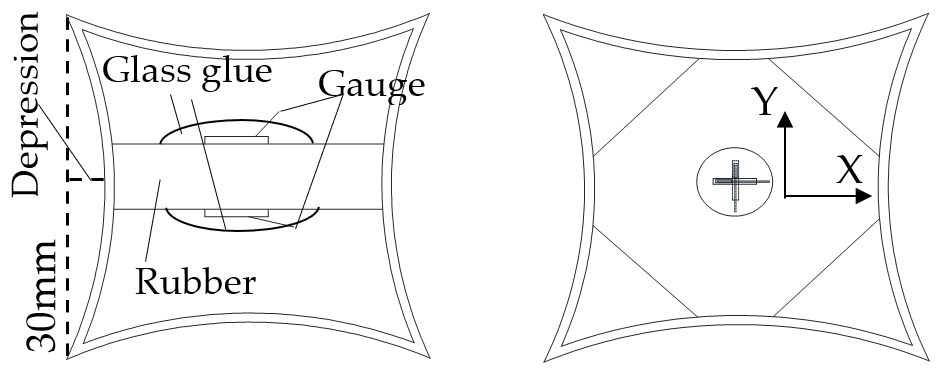
5.1. Concrete Compression Experiments of Fixed Sphere Positions

Figure 29a shows the steel spheres connected with thin wires to form a hollow body frame. The dimensions of the concrete model were the same as in the previous sections. The sphere’s diameter was 40 mm, the thickness was 1 mm, and the distance between neighboring spheres was about 10 mm. As shown in Figure 29b, two types of hollow body frames were made for the experiment. For the Type-A frame, hollow bodies were arranged in the same level with seven spheres in each layer, while the Type-B frames had six steel spheres fixed at the outer side and one fixed at the center between two layers. Three concrete specimens were made for each type of hollow body frame, and three concrete specimens without steel spheres were fabricated for control. The concrete strength used for the experiments was Fc = 40 N/mm2; the diameter of aggregate was less than 10 mm; water reducing agent was mixed in a ratio of 5.4 kg/m3, and slump flow was 50 cm. The concrete specimens were filled in three times, vibrated at the bottom and sides using a vibrating rod, and placed in water for 28 days for curing.
The density and strength of the concrete specimens are shown in Figure 30. The experimental strength of concrete is lower than the analytical strength, therefore, the strength of concrete can be improved up to analytical value by using appropriate methods. The average density of conventional concrete used for this experiment was 2.365 g/cm3, while the bubble concrete was 1.971–2.003 g/cm3. The average strength of conventional concrete was 47.73 N/mm2, while the average strength of bubble concrete was 27.54–28.95 N/mm2. Comparing the result with the randomly placed spheres (M50-20, M60-16) in Section 4.1, this type of bubble concrete could further reduce the concrete density by 6.3–13.3%. The stress–strain curve of the concrete is shown in Figure 31. Symbols G1-1, G1-2; G1-1, G1-2; G1-1, G1-2 are the strain gauges on the left and right sides of three concrete specimens. Similar to the previous experimental results, the incorporation of hollow bodies caused a tendency to decrease the strength and Young’s modulus of the concrete. However, the concrete of Type-B is slightly better than Type-A in terms of strength and Young’s modulus.
The modes of concrete failure are shown in Figure 32. When the concrete is subjected to load, cracks appear inside the concrete. The steel sphere peels off from the concrete, which causes the surrounding concrete stress to increase, and the concrete breaks prematurely. In addition, the smooth sphere surface and the lack of adhesion with the concrete cause the concrete to be easily damaged after being stressed. However, none of the steel spheres used in the experiments was damaged.

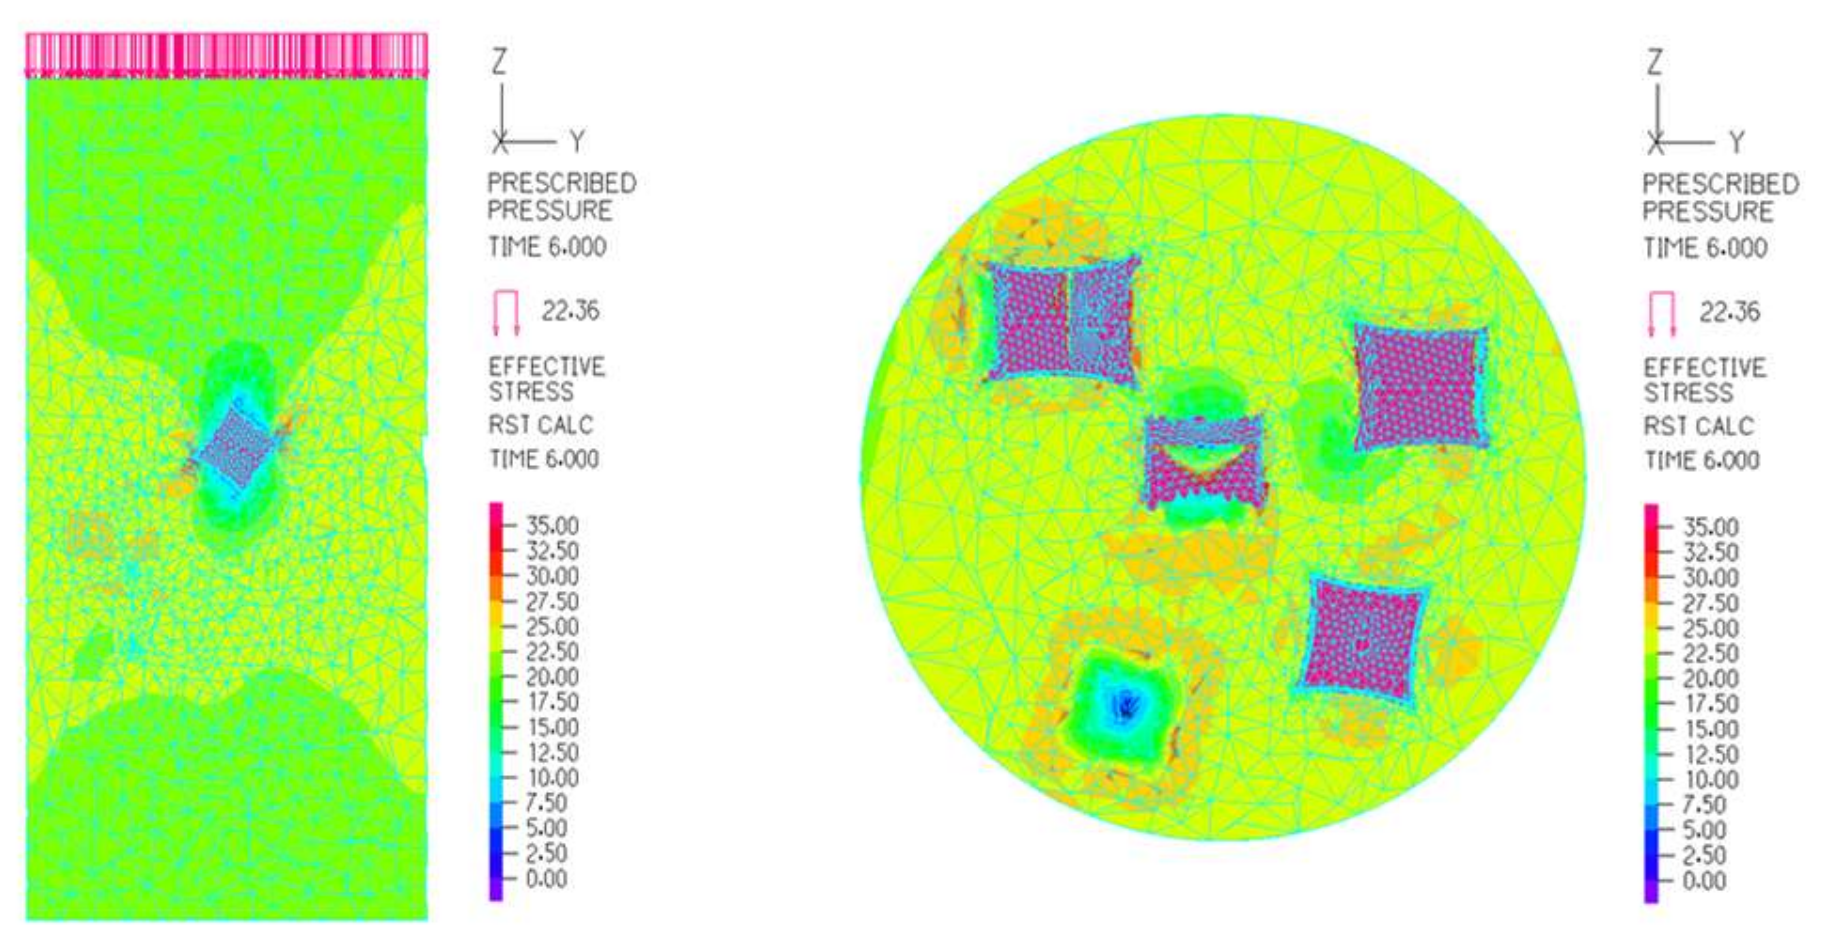
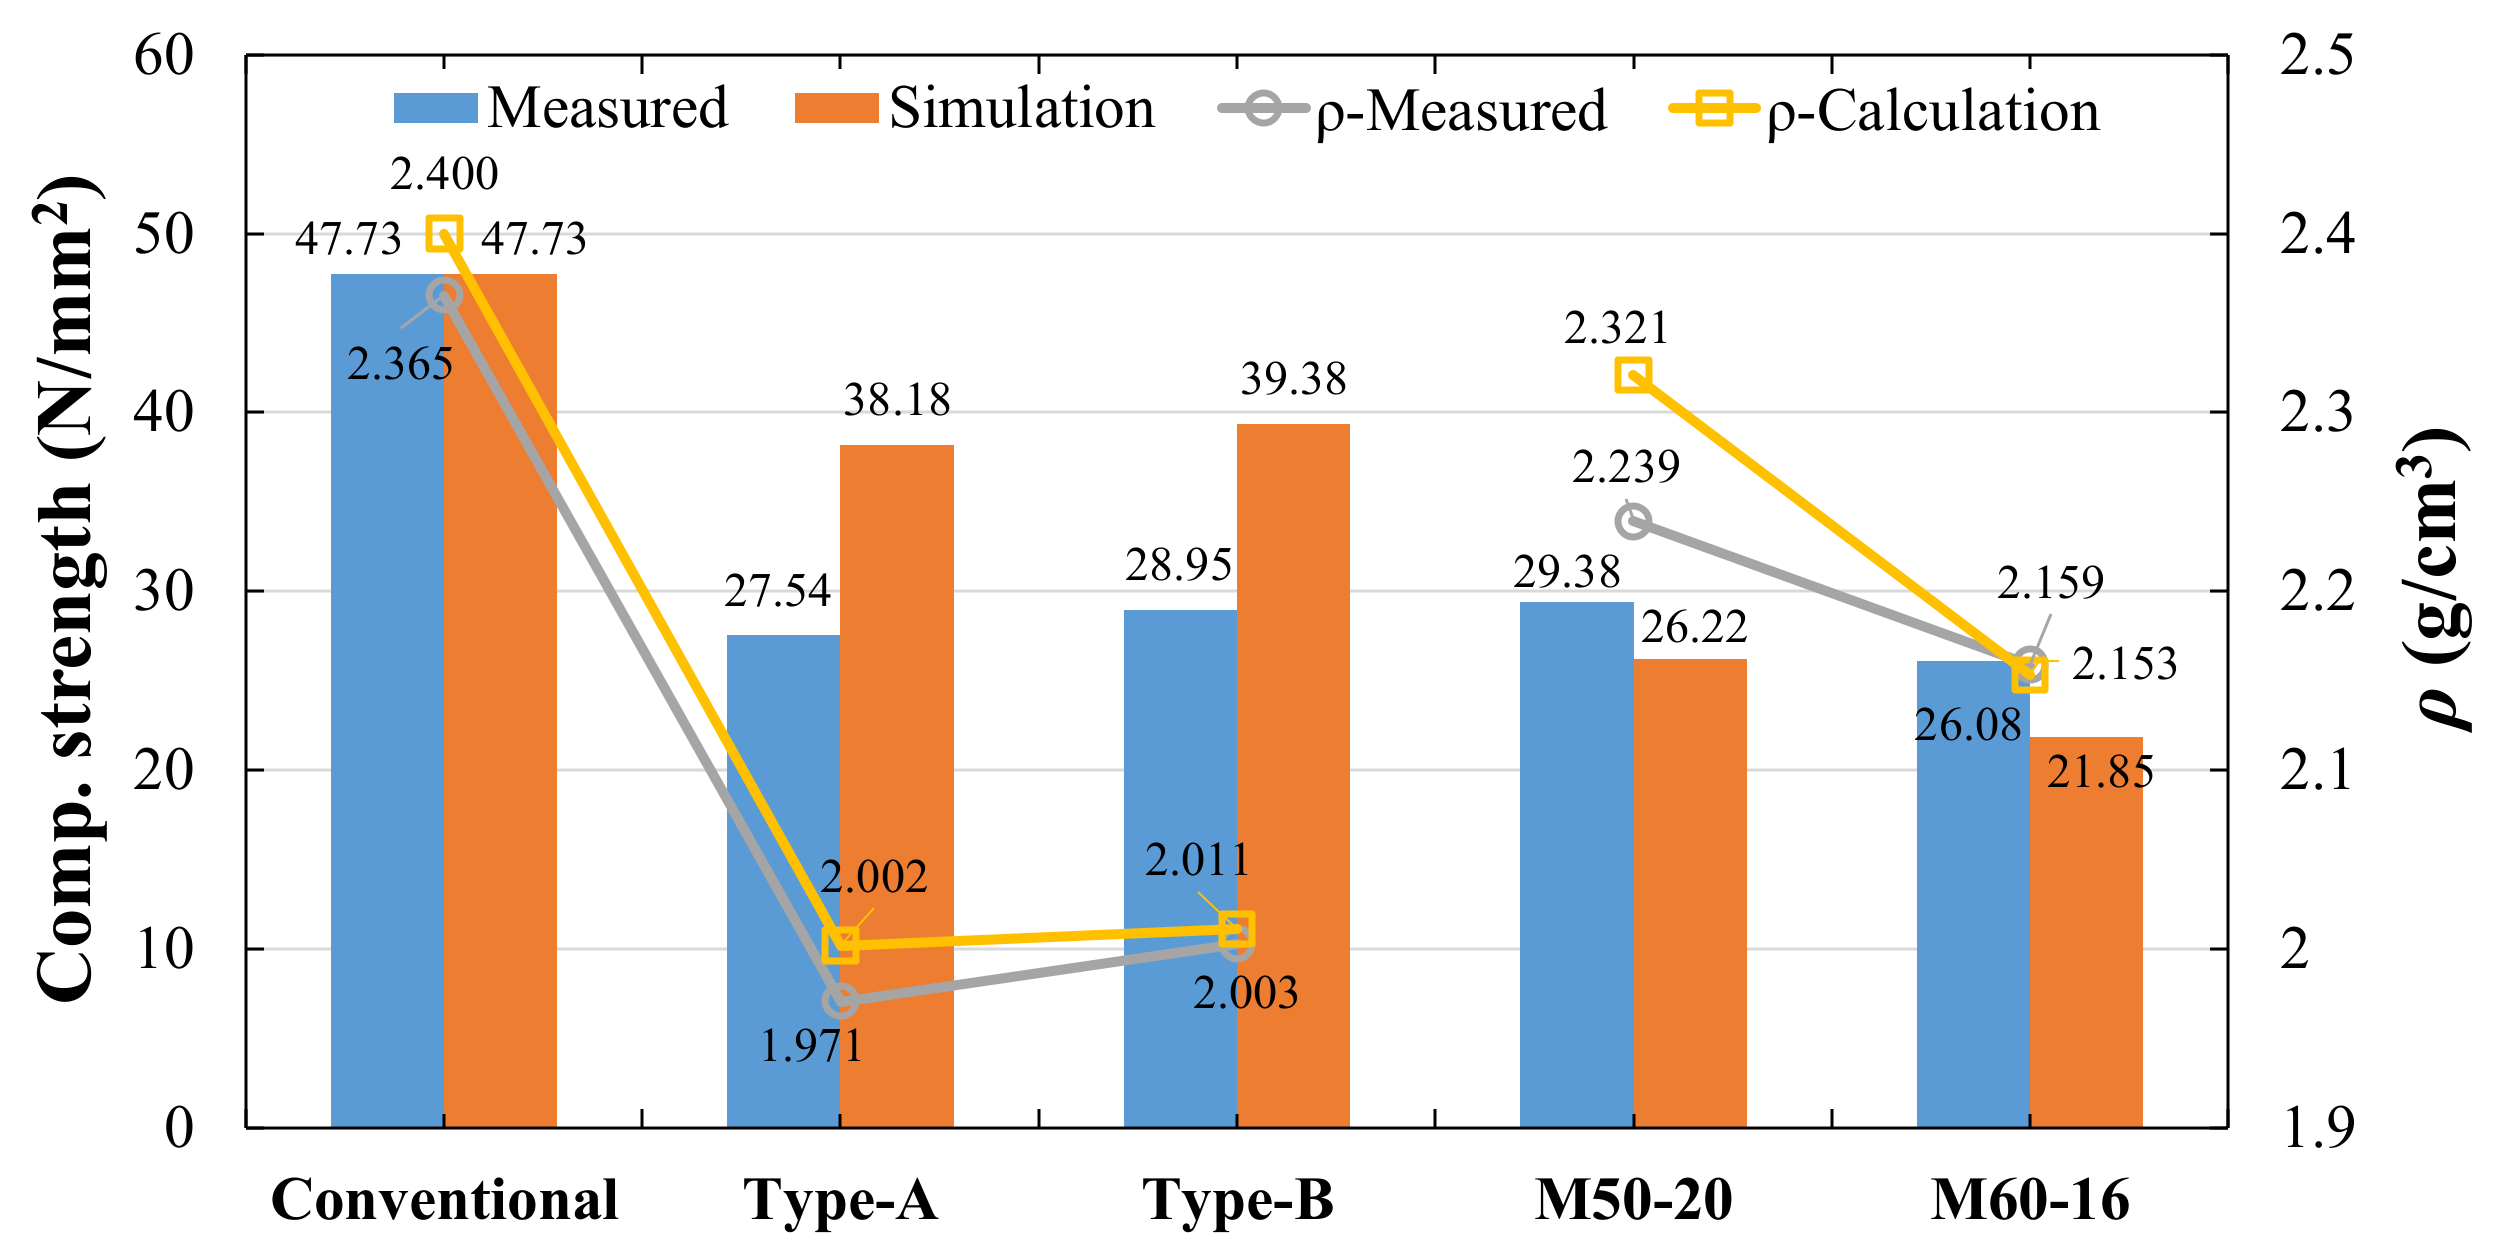
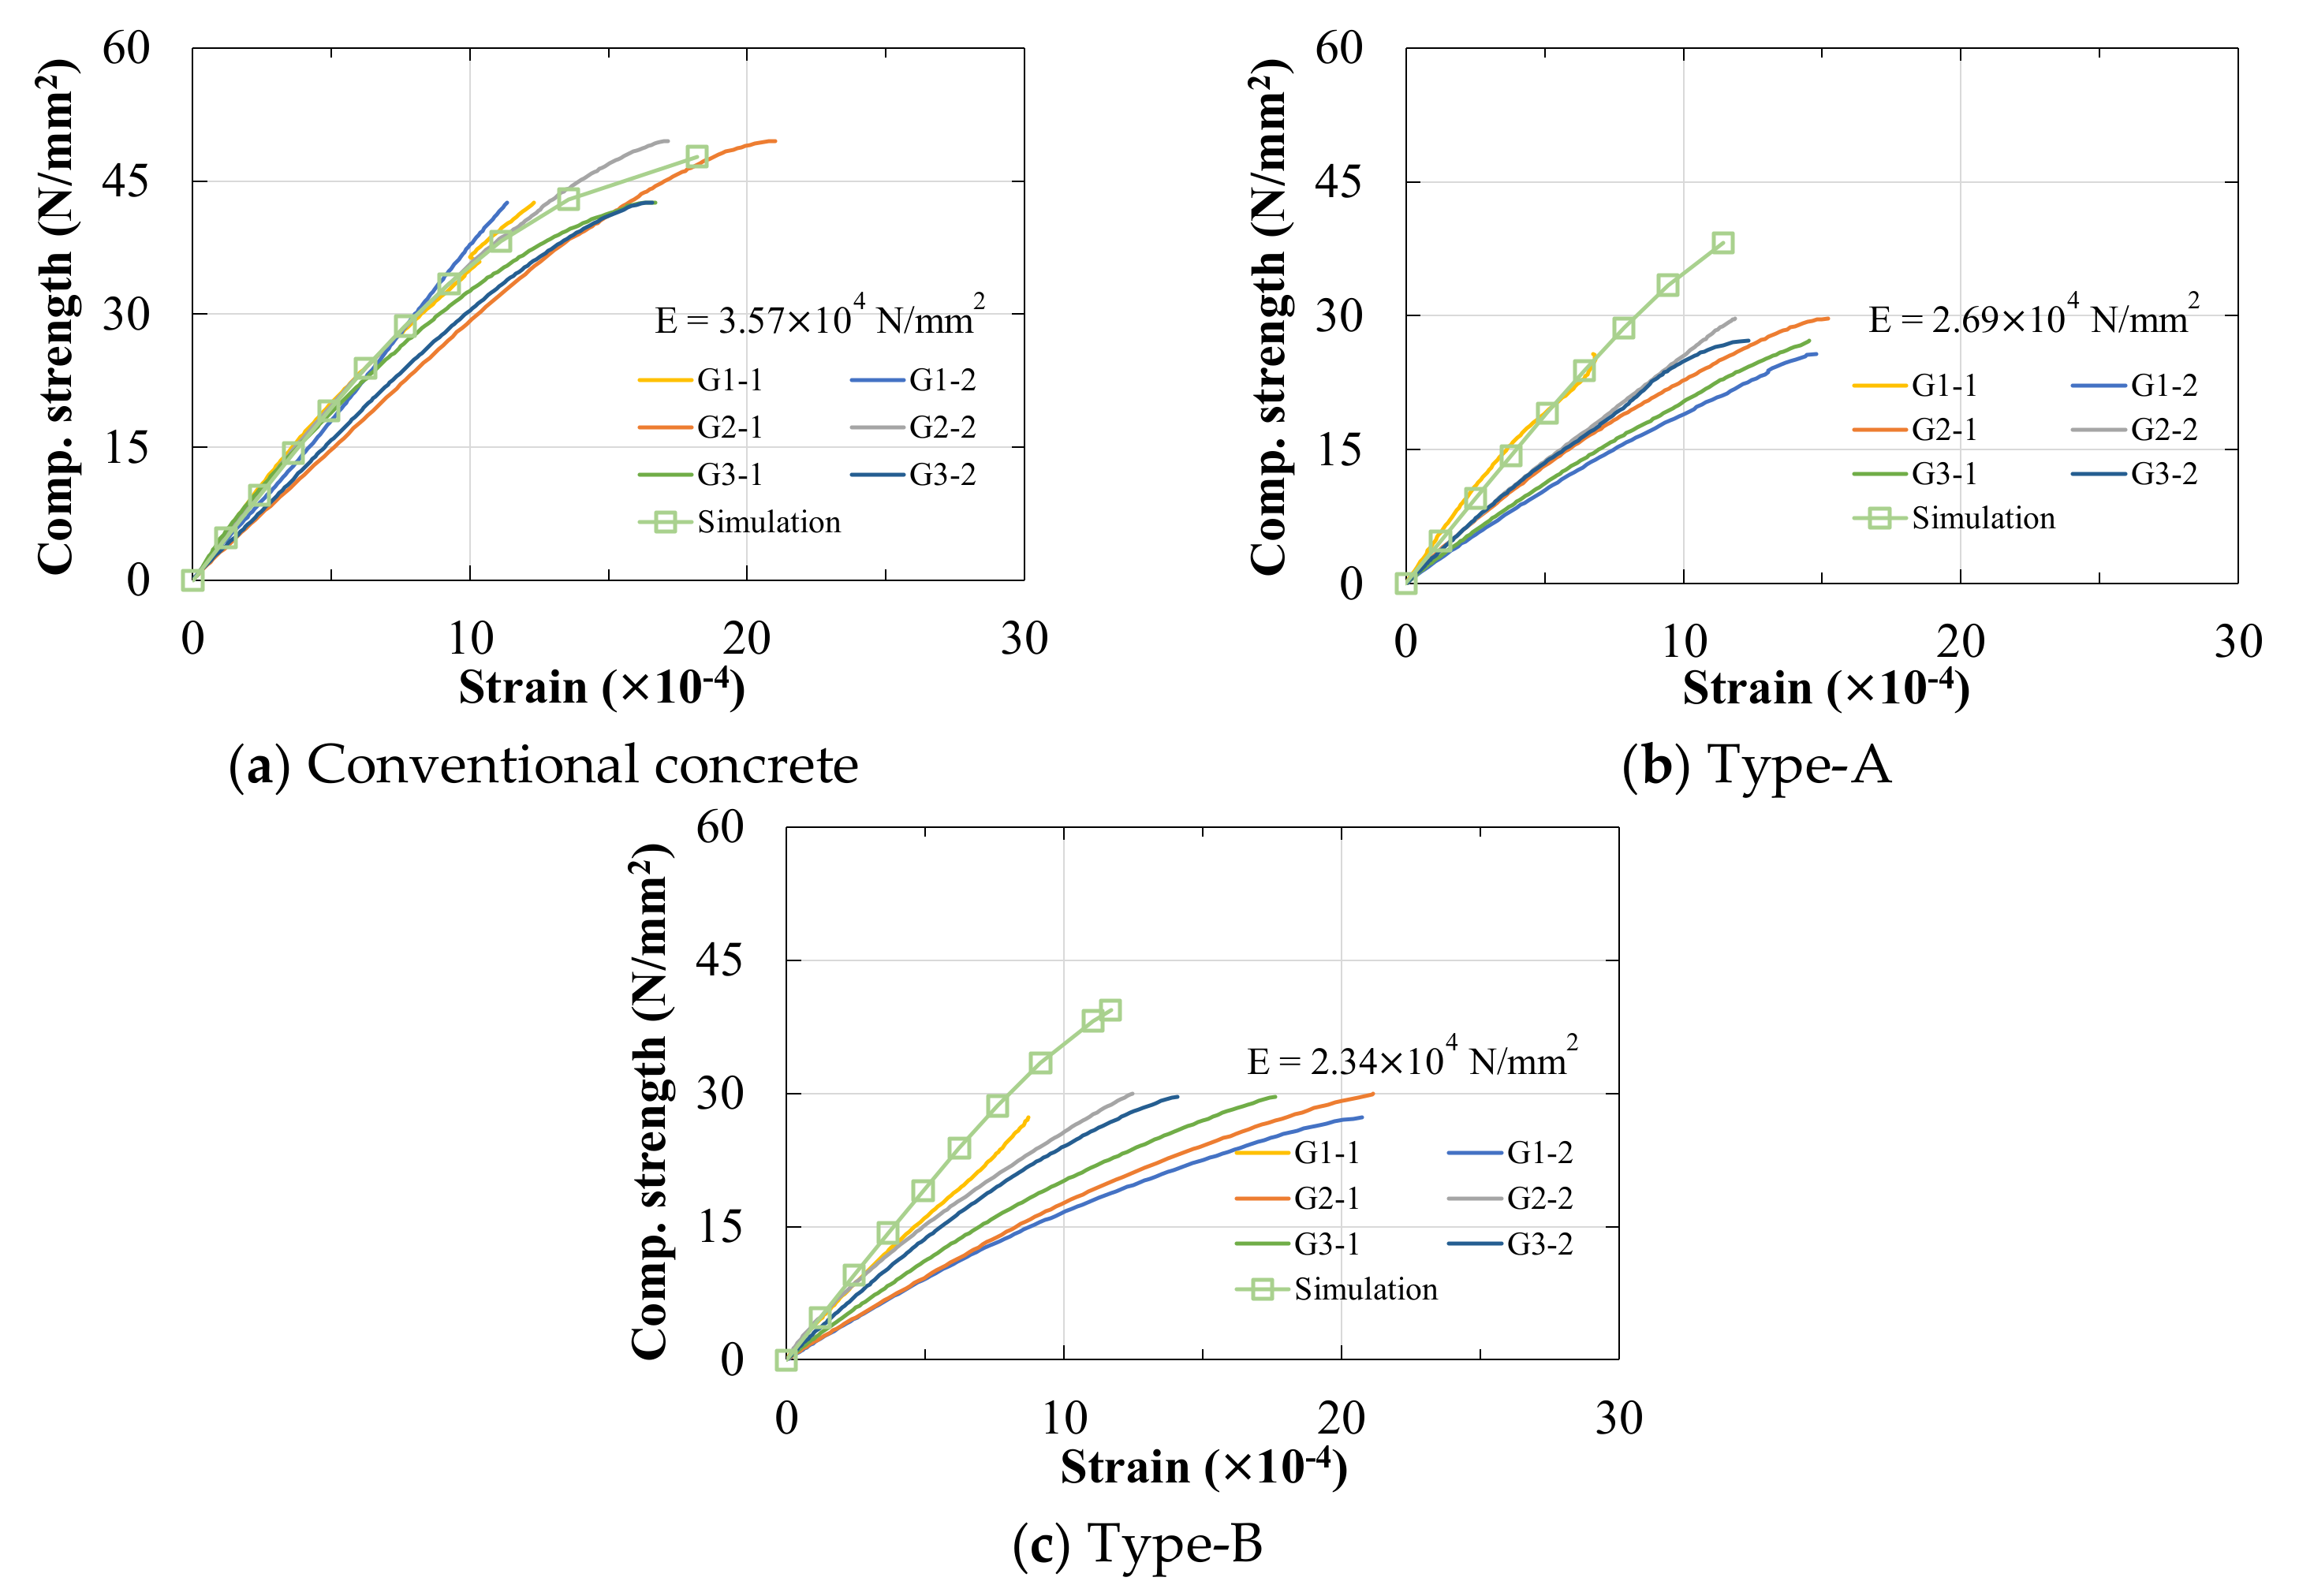
5.2. Nonlinear Finite Element Simulation of Hollow Bodies with Fixed Positions

The analytical models for concrete models of Type-A and Type-B are shown in Figure 33. Since the wire was used only to fix the steel spheres, it was neglected in the analysis. The stress diagram inside the concrete is shown in Figure 34. Similar to the previous results, both modes produced compression in the vertical direction and expansion in the oblique direction. However, for Type-B, the concrete stress around spheres is less than that of Type-A due to its different position distribution. For both types of modes, the spheres are too close to the outer side, which caused the outer concrete to be prone to spall.
Fixing the position of the steel spheres with steel wire can make the stress inside the concrete regularly distributed and improve the workability of the concrete. However, the regular arrangement may cause stress concentration between steel spheres. When a sphere is close to the concrete edge, the deformation of the sphere squeezes the outside concrete, causing it to peel off. In addition, the insufficient adhesions between the steel sphere and the concrete also make it impossible to provide sufficient cohesion stress for the concrete.

6. Conclusions

Bubble concrete was developed by mixing high-strength hollow bodies into concrete. Different from foamed concrete and biaxial voided slabs, the hollow bodies mixed into the concrete are used to create pores and transfer stresses. The effects of hollow body shape, diameter, thickness, and mixing number on the strength and Young’s modulus of the bubble concrete were investigated by compression experiments and elastoplastic simulations. In addition, this study investigated the effects of the position and arrangement of hollow bodies on the strength of bubble concrete.
According to the experiments and analytical results of the bubble concrete of a single hollow body, it can be clearly seen that stress concentration is generated on the surface of the hollow body, which causes the hollow body to deform in the vertical and oblique directions. Consequently, the deformation of the hollow body causes it to peel off from the concrete and it cannot continue to bear the stress. There are many cracks along the surface of the hollow body, which reduces the effective cross-sectional area of the concrete to transfer stresses. Compared with steel spheres, the concave surface can restrain its expansion in the lateral direction, but it is more prone to deformation. The orienting direction of the concave body may change the direction of its deformation, thus affecting the strength of the concrete.
For bubble concrete with multiple hollow bodies, the hollow bodies are compressed vertically and expand in the oblique direction. However, due to the random position of the hollow bodies, the stress distribution may change with the hollow body number. In an area with a large number of hollow bodies, the stress is superimposed, while in an area with a small number of hollow bodies, the stress is close to the loading value. In addition, all the hollow body materials used in the experiment are steel, and the body surfaces are milled surfaces, which results in poor adhesion between the hollow bodies and concrete. The concrete cannot provide enough internal tension to prevent the external concrete from peeling off.
The position of the hollow bodies may affect the distribution of internal stress in the concrete. When the hollow bodies are close to the edge of the concrete, it causes premature destruction of the concrete. The regular distribution of hollow bodies may increase the average strength of the concrete. However, it is easy to cause the superposition of internal stress of the concrete and cause cracks.
The density and strength of the bubble concrete using steel spheres, concave surfaces, and fixed spheres are shown in Table 3. The steel spheres perform better than the concave bodies, but the density reduction is not apparent due to high thickness and density of the steel spheres. Although the concave body can suppress its expansion in the lateral direction when it is subjected to compression acting normally on its upper and lower surfaces, lower strengths were measured during the experiments due to the random arrangement direction and poor adhesive performance of the concave bodies. Therefore, the strength of bubble concrete with cubic concave bodies is lower than that using steel spheres.
Based on the research results of this paper, subjects for further research are the following:
  • Searching for suitable material for the hollow bodies to increase the adhesion between the hollow bodies and concrete.
  • Adjusting the mix ratio of concrete and finding the appropriate number of hollow bodies to be mixed into the concrete.
  • Researching the suitable arrangement position and size of the hollow bodies.
In addition, the research on the optimum shape of the hollow body is still in progress, and will be reported in the future. The present research did not consider the shear performance of bubble concrete, which will be an important subject for further research.

Author Contributions

Conceptualization, P.-S.C.; methodology, P.-S.C. and X.Y.; data curation, P.-S.C. and X.Y.; writing, P.-S.C., X.Y., A.A.-F., B.L. and J.J.; supervision, P.-S.C. and B.S.M.; project administration, P.-S.C., X.Y. and A.A.-F. All authors have read and agreed to the published version of the manuscript.

Funding

This research received no external funding.

Institutional Review Board Statement

Not applicable.

Informed Consent Statement

Not applicable.

Data Availability Statement

Data are available in a publicly accessible repository.

Acknowledgments

The authors would like to thank the students of Hachinohe Institute of Technology for their kind support in this research.

Conflicts of Interest

The authors declare no conflict of interest.

References

  1. Haque, M.N.; Al-Khaiat, H.; Kayali, O. Strength and durability of lightweight concrete. Cem. Concr. Compos. 2004, 26, 307–314. [Google Scholar] [CrossRef]
  2. Min, H.Z.; Odd, E.G. Mechanical Properties of High-Strength Lightweight Concrete. Mater. J. 1991, 88, 240–247. [Google Scholar]
  3. Kan, A.; Demirboğa, R. A novel material for lightweight concrete production. Cem. Concr. Compos. 2009, 31, 489–495. [Google Scholar] [CrossRef]
  4. Lo, T.Y.; Tang, W.C.; Cui, H.Z. The effects of aggregate properties on lightweight concrete. Build. Environ. 2007, 42, 3025–3029. [Google Scholar] [CrossRef]
  5. Palle, N.-C.; Tommy, P.H.N. Modal determination of the effect of bond between coarse aggregate and mortar on the compressive strength of concrete. J. Proc. 1969, 66, 66–67. [Google Scholar]
  6. Abdullah, M.M.A.B.; Hussin, K.; Bnhussain, M.; Ismail, K.N.; Yahya, Z.; Abdul Razak, R. Fly Ash-based Geopolymer Lightweight Concrete Using Foaming Agent. Int. J. Mol. Sci. 2012, 13, 7186–7198. [Google Scholar] [CrossRef] [PubMed]
  7. Fahrizal, Z.; Mahyuddin, R. Performance and characteristic foamed concrete mix design with silica fume for housing development. Int. J. Acad. Res. 2011, 3, 1198–1206. [Google Scholar]
  8. Ducman, V.; Mirtič, B. The applicability of different waste materials for the production of lightweight aggregates. Waste Manag. 2009, 29, 2361–2368. [Google Scholar] [CrossRef] [PubMed]
  9. Chen, P.-S. A study report on light weight concrete mixed with high strength hollow bubbles. In Proceeding of AIJ Tohoku Chapter Architectural Research Meeting (Kouzoukei); Architectural Institute of Japan: Tokyo, Japan, 2008; No.71; pp. 57–62. [Google Scholar]
  10. Chen, P.-S. Bubble Concrete. Japan Patent Office JP2008308395, 25 December 2008. Available online: https://patentfield.com/patents/JP2007181500A (accessed on 25 December 2008).
  11. Galilei, G. Dialogues Concerning Two New Sciences; Crew, H., de Salvio, A., Eds.; Macmillan Company: London, UK, 1638. [Google Scholar]
  12. Evans, H.E.; Heiser, J.B. What’s inside: Anatomy and physiology. In The Cornell Lab of Ornithology’s Handbook of Bird Biology; Podulka, S., Rohrbaugh, R.W., Bonney, R., Eds.; Wiley-Blackwell: Hoboken, NJ, USA, 2004. [Google Scholar]
  13. Andersen, O.; Waag, U.; Schneider, L.; Stephani, G.; Kieback, B. Novel Metallic Hollow Sphere Structures. Adv. Eng. Mater. 2000, 4, 192–195. [Google Scholar] [CrossRef]
  14. Lim, T.-J.; Smith, B.; McDowell, D.L. Behavior of a random hollow sphere metal foam. Acta Mater. 2002, 50, 2867–2879. [Google Scholar] [CrossRef]
  15. Sanders, W.S.; Gibson, L.J. Mechanics of hollow sphere foams. Mater. Sci. Eng. A 2003, 347, 70–85. [Google Scholar] [CrossRef]
  16. Schnellenbach-Held, M.; Pfeffer, K. Punching Behavior of Biaxial Hollow Slabs. Cem. Concr. Compos. 2002, 24, 551–556. [Google Scholar] [CrossRef]
  17. Schnellenbach-Held, M.; Pfeffer, K. Punching shear capacity of biaxial hollow slabs. In Proceedings of the International Workshop on Punching Shear Capacity of RC Slabs; Royal Institute of Technology: Stockholm, Sweden, 2000; Volume 9, pp. 423–430. [Google Scholar]
  18. Chen, P.-S.; Tsukinaga, Y. Basic Research on the Development of Light Weight Concrete Mixed With Hollow Spheres. J. Soc. Mater. Sci. Jpn. 2015, 64, 711–717. [Google Scholar] [CrossRef] [Green Version]
  19. Yoshiji, N.; Wataru, K.; Koji, N. Failure Processes of Concrete under Triaxial Compressive Stress. Proc. Jpn. Soc. Civ. Eng. 1971, 185, 31–41. Available online: https://www.jstage.jst.go.jp/article/jscej1969/1971/185/1971_185_31/_pdf (accessed on 28 June 2021).
  20. Yoshio, K.; Yasuo, T.; Fukuo, O. Compressive Strength of Concrete with Cubic Aggregate of Cement Mortar. In Summaries of Technical Papers of Annual Meeting Architectural Institute of Japan; Architectural Institute of Japan: Tokyo, Japan, 1971; pp. 41–46. [Google Scholar] [CrossRef]
  21. Zhang, X.; Zhang, H.; Gao, H.; He, Y.; Jiang, M. Effect of bubble feature parameters on rheological properties of fresh concrete. Constr. Build. Mater. 2019, 196, 245–255. [Google Scholar] [CrossRef]
  22. Dils, J.; Boel, V.; De Schutter, G. Influence of cement type and mixing pressure on air content, rheology and mechanical properties of U.H.P.C. Constr. Build. Mater. 2013, 41, 455–463. [Google Scholar] [CrossRef]
  23. Kwan, A.K.H.; Li, L.G. Combined effects of water film, paste film and mortar film thicknesses on fresh properties of concrete. Constr. Build. Mater. 2014, 50, 598–608. [Google Scholar] [CrossRef]
  24. Japanese Industrial Standard (JIS). 2018; JIS A 1108. Available online: https://webdesk.jsa.or.jp/preview/pre_jis_a_01108_000_000_2018_j_ed10_ch.pdf (accessed on 28 June 2021).
Figure 1. Conventional concrete mixed with high-strength hollow bodies (bubble concrete).
Crystals 11 00858 g001
Figure 2. Hollow bodies with different shapes and mechanisms.
Crystals 11 00858 g002
Figure 3. The model of concrete and steel spheres.
Crystals 11 00858 g003
Figure 4. The gauge position and direction.
Crystals 11 00858 g004
Figure 5. The compressive strength of concrete specimens with a single sphere.
Crystals 11 00858 g005
Figure 6. The stress–strain curves of concrete with a single sphere. Notes: Subcaption of each figure (ae) denotes: single sphere, diameter, and thickness. The average Young’s modulus (E) is calculated based on 1/3 strength of the specimen.
Crystals 11 00858 g006aCrystals 11 00858 g006b
Figure 7. The stress–strain curves of the steel sphere. Notes: Name of each figure (ah) denotes: single sphere, diameter, thickness, and specimen number.
Crystals 11 00858 g007aCrystals 11 00858 g007b
Figure 8. The failure mode of concrete specimens mixed with a single sphere.
Crystals 11 00858 g008
Figure 9. Analytical model for bubble concrete with a single sphere (S40-2).
Crystals 11 00858 g009
Figure 10. The internal stress diagram of bubble concrete (S40-2).
Crystals 11 00858 g010
Figure 11. The section of cubic concave body.
Crystals 11 00858 g011
Figure 12. The assembly of cubic concave body.
Crystals 11 00858 g012
Figure 13. The three types of orienting direction of cubic concave body.
Crystals 11 00858 g013
Figure 14. The compressive strength of concrete specimens with single cubic concave body.
Crystals 11 00858 g014
Figure 15. The stress–strain curves of concrete with a single cubic concave body. Notes: Subcaption of each figure (am) denotes: type, depression (mm), and specimen number. The average Young’s modulus (E) is calculated based on 1/3 strength of the specimen.
Crystals 11 00858 g015
Figure 16. The failure mode of concrete specimens mixed with a single concave body.
Crystals 11 00858 g016
Figure 17. Analytical model for bubble concrete with a single cubic concave body (A2-1).
Crystals 11 00858 g017
Figure 18. The internal stress diagram of three types of specimens.
Crystals 11 00858 g018
Figure 19. The density and compressive strength of concrete specimens with multiple spheres.
Crystals 11 00858 g019
Figure 20. The stress–strain curve of concrete with multiple spheres. Notes: Subcaption of each figure (af) denotes: multiple spheres, diameter, and specimen number. The average Young’s modulus (E) is calculated based on 1/3 strength of the specimen.
Crystals 11 00858 g020aCrystals 11 00858 g020b
Figure 21. The failure mode of concrete specimens mixed with multiple spheres.
Crystals 11 00858 g021
Figure 22. Analytical model for bubble concrete with multiple steel spheres (M50-20).
Crystals 11 00858 g022
Figure 23. The internal stress diagram of bubble concrete (M50-20).
Crystals 11 00858 g023
Figure 24. The density and compressive strength of concrete specimen with multiple concave bodies.
Crystals 11 00858 g024
Figure 25. The stress–strain curves of three types of specimens. Notes: Subcaption of each figure (ac) denotes: multiple bodies, diameter, and specimen number. The average Young’s modulus (E) is calculated based on 1/3 strength of the specimen.
Crystals 11 00858 g025aCrystals 11 00858 g025b
Figure 26. The failure mode of concrete specimens mixed with multiple concave bodies.
Crystals 11 00858 g026
Figure 27. Analytical model for bubble concrete with multiple concave bodies (M30-25).
Crystals 11 00858 g027
Figure 28. The internal stress diagram of concrete (M30-25).
Crystals 11 00858 g028
Figure 29. Bubble concrete with fixed sphere positions.
Crystals 11 00858 g029
Figure 30. The density and compressive strength of concrete specimens with fixed sphere positions.
Crystals 11 00858 g030
Figure 31. The stress–strain curve of three type specimens. Notes: The average Young’s modulus (E) is calculated based on 1/3 strength of the specimen.
Crystals 11 00858 g031
Figure 32. The failure mode of concrete specimens mixed with fixed sphere positions.
Crystals 11 00858 g032
Figure 33. Analytical model for bubble concrete with fixed sphere positions.
Crystals 11 00858 g033
Figure 34. The internal stress diagram of Type-A, Type-B specimen.
Crystals 11 00858 g034
Table 1. Concrete specimens and orienting direction types.
TypeType-AType-BType-CType-D
(Conventional Concrete)
Depression2mmA2-1B2-1C2-1D-1
D-2
D-3
A2-2B2-2C2-2
3mmA3.5-1B3.5-1C3.5-1
A3.5-2B3.5-2C3.5-2
Number of specimens4443
Table 2. The sphere diameters and the number of spheres mixed in.
TypeDiameter (mm)Thickness (mm)Sphere NumberSpecimen Number
M50-2048.62.3183
M50-4048.62.3273
M60-860.52.383
M60-1260.52.3123
M60-1660.52.3153
Table 3. The density and strength of bubble concrete.
TypeDensity (g/cm3)Average Strength (N/mm2)Simulation Strength (N/mm2)
Steel sphere2.138–2.239 (91.0–95.3%)20.372–29.382 (46.6–67.2%)21.850–36.053 (50.0–82.5%)
Cubic concave body2.019–2.221 (88.9–97.7%)13.317–22.805 (35.7–61.2%)14.904–26.082 (40.0–70.0%)
Fixed position1.971–2.003 (83.3–84.7%)27.536–28.954 (57.7–60.7%)38.184–39.377 (80.0–82.5%)
Note: The percentages in parentheses are ratios based on the control concrete.
Publisher’s Note: MDPI stays neutral with regard to jurisdictional claims in published maps and institutional affiliations.

