Article

Temperature-Modulated Pyroelectricity Measurements of a Thin Ferroelectric Crystal with In-Plane Polarization and the Thermal Analysis Based on One-Dimensional Layer Models

1
Department of Applied Physics, Okayama University of Science, Okayama 700-0005, Japan
2
Research & Development Institute, The Furukawa Battery Co. Ltd., Iwaki, Fukushima 972-8501, Japan
*
Author to whom correspondence should be addressed.
Submission received: 6 June 2021 / Revised: 25 July 2021 / Accepted: 26 July 2021 / Published: 28 July 2021
(This article belongs to the Special Issue Organic Conductors)

Abstract

:
A temperature-modulated pyroelectricity measurement system for a small single crystal is developed and applied to standard sample measurements performed on a thin single crystal of lithium niobate. The modulation measurement is based on the AC technique, in which the temperature of the sample is periodically oscillated, and the synchronized pyroelectric signal is extracted using a lock-in amplifier. Temperature modulation is applied by irradiating periodic light on the sample placed in the heat exchange gas. To apply this technique to the transparent reference sample, a commercially available black resin is coated on the sample’s surface to absorb the light energy and transmits it to the specimen. The experimental results are analyzed using a two-layer heat transfer model to verify the effect of the light-absorbing layer as well as the radiative temperature modulation system.

1. Introduction

Ferroelectrics and pyroelectrics are advanced materials with a variety of functional physical properties. While the dielectric matters have already established an industrial position in thermal sensors and transducers applications, the scope of material surveys goes beyond the traditional realm to include substances that have not been treated in this field, such as magnetic compounds [1,2,3], electric conductors [4,5], and unconventional synthesized solids [6,7]. To understand the potential applications, the electrical polarization of these new ferroelectrics properties needs to be investigated. However, most of these crystals, particularly molecular crystals, are so small and fragile that they cannot be formed into a shape suitable for applying strong electric fields. Therefore, the direct observation technique such as the polarization reversal is uneasy to carry out. Moreover, a class of charge-transfer molecular complexes, which has recently attracted attention as a new type of ferroelectric, is highly conductive in nature; thus, it cannot be loaded with sufficient fields for polarization conversions [4,8,9].
For these materials, pyroelectricity measurement can be an effective alternative. Pyroelectricity stems from the temperature dependence of the polarization, and its observation does not require strong electric fields, except for the poling treatment of the sample. The classical heat-to-electricity conversion phenomenon has long been utilized as an important function of ferroelectrics [10]. Lately, it has attracted new attention from the perspective of energy harvesting technology [11,12,13]. Therefore, measuring pyroelectricity would offer multiple benefits to material researchers who are developing new ferroelectrics.
Nevertheless, the signals of pyroelectricity generating under realistic conditions are very weak; thus, the measurements are usually performed for a sufficiently large sample, such as a polled film or a piece of a crystal wafer. For molecular crystals, such a large specimen can hardly be obtained. Moreover, their single crystals tend to have highly anisotropic shapes, such as thin plates, and if the polarization is oriented in-plane direction of the thin crystal, only tiny electrodes can be attached. To deal with small molecular crystals, we developed a high sensitivity measuring system based on a temperature modulation technique [14] in the present study. In the AC measurements performed here, a periodic light was irradiated to modulate the temperature of the sample in a helium-gas chamber. The radiative temperature control, coupled with the use of a removable sample holder, provides stable and reproducible heat transfer, even for as-grown single crystals with irregularities in the crystal shape.
To evaluate the performance of this system, we carried out standard sample measurements for a typical ferroelectric material, lithium niobate (LiNbO3). In the standard sample measurements, we employed a small piece of a thin wafer of LiNbO3 in which the electric polarization resides along the crystal plane, assuming that the system would be applied to such tiny crystals with in-plane polarization. Since LiNbO3 is transparent, we covered the specimen with synthetic black paint to transfer the light energy into heat at the sample’s surface. A major difficulty with modulation schemes lies in the complexity of quantifying the experimental results. In the present study, we simulated the experimental data using a two-layer model that took into account the presence of an absorbing layer and achieved a reasonable agreement with the observed results.

2. Materials and Methods

Figure 1 shows the schematic drawing of the temperature-modulated pyroelectricity measurement system developed in the present study. The system comprises a diode laser, a heat-exchanging gas chamber of an optical cryostat (Oxford Instruments plc, OptistatCF), microscope components, and electric current detection instruments. The irradiation light was generated using a diode laser (Thorlabs, L520P090, λ = 520 nm). A crystal wafer of X-cut LiNbO3 ( 10 × 10   mm 2 ,   t = 100   μ m ) was purchased from MTI Co. As a light-absorbing layer, commercial black lacquer (Asahipen, Aspen Creative Color, Gross Black) was diluted with diethyl ether and coated on the surface of the crystal using a spin coater. The thickness of the light-absorbing layer was confirmed to be ca. 11   μ m with a homemade surface step measurement apparatus using a high precision micrometer (Mitutoyo, MHF2-13). To mark the crystal orientation, another surface was lightly scratched with diamond sandpaper and smashed into small pieces ca. 0.5 × 0.5 mm2 wide to adjust its size for the diameter of the laser beam. The crystal edges perpendicular to the Z-axis were coated with silver paste, and gold wires ( d = 30   μ m ) were attached. The specimen was suspended on the IC socket with the two lead wires, and the socket was plugged into a socket receptor fixed on the sample rod, then loaded into the gas chamber in the optical cryostat. The sample was heated by the laser irradiation: sinusoidal waves modulated using a diode controller (Thorlabs, ITC4005, f = 0.01 ~ 30   Hz ) or rectangular waves by the optical chopper ( f = 20 ~ 1000   Hz ). Since square waves contain 1.273 sin ( ω t ) in its Fourier series, the generated pyroelectricity is overestimated by the factor of the sine function compared to the signal induced with the sine waves of the same amplitude. The thermally induced current generated by the temperature modulation was led out via a triaxial cable from the cryostat and converted into voltage with a current preamplifier (Stanford Research Systems, SR570). This preamplifier has a built-in line filter with a selectable frequency range. Before amplifying the raw signal, various noises far away from the temperature modulation frequency were removed to preserve the dynamic reserve of the lock-in amplifier. The voltage-converted signal was detected using a two-phase digital lock-in amplifier (Signal Recovery, Model 7265).

3. Results and Discussions

3.1. The AC Measurement of Pyroelectricity

Pyroelectricity is a variation in electric polarization P or that in the surface charge density of a polar material due to temperature variation and is extracted from electrodes attached on the surfaces of the sample. For a specimen of a capacitor form with an electrode area of S , the pyroelectricity I pyr is defined as follows:
I pyr = S d P d t = S d P d T d T d t = α S d T d t   ,
where α denotes the pyroelectric coefficient. Since this formula includes the time derivative of temperature, pyroelectric measurement requires a temperature change, which is conventionally performed by sweeping the temperature of the sample at a constant rate. In the DC measurement, it is necessary to increase the speed to achieve an enhanced signal. However, the rate of temperature change is experimentally limited because the non-uniformity of the temperature distribution due to rapid temperature change causes mechanical stress, leading to sample damage.
As an alternative option to measure pyroelectricity, there is an AC technique in which the sample temperature is periodically modulated instead of the DC sweep [15]. Suppose that the temperature of the sample is modulated with an angular frequency of ω and an amplitude T ( ω ) around an equilibrium temperature T 0 , i.e.,
T ( t ) = T ( ω ) sin ( ω t ) + T 0 .
From Equation (1), the pyroelectric current induced by the temperature modulation is given as a cosine wave
I pyr ( t ) = α S ω T ( ω ) cos ( ω t ) ,
and the Fourier coefficient α S ω T ( ω ) is detected by a lock-in amplifier.
The phase-sensitive detection allows the signal synchronized with the temperature modulation to be separated from various background noises. In addition, whereas the sweep rate of temperature determines the acquisition time in the DC method, the modulation method allows us to freely control the acquisition time at each data point, allowing fine temperature control. Furthermore, the AC method is advantageous in distinguishing true pyroelectricity from non-essential signals such as the trap-charge current; whereas the extrinsic signals are emitted from trap sites only at the early heating cycles of the modulation, intrinsic signal permanently generates along with temperature changes to dominate the averaged signal intensity [16].

3.2. Radiative Temperature Modulation Using Periodic Light

Molecular crystals have larger thermal expansion coefficients compared with inorganic metals. Therefore, when temperature modulation is performed by attaching a metal block to a sample and heating it, crystal distortions will occur. These distortions will be particularly severe for variable temperature measurements. To minimize such mechanical stress in the present measurement, the temperature of the sample was modulated by periodic light irradiation in a heat-exchange gas using an optical cryostat. The sample was suspended in the gas chamber with thin gold threads attached to the sample as the lead wires. The radiative heating of a freely suspended sample in the heat-exchange gas eliminates thermally induced strain that can occur in the case of heater heating, and, thus, the measurement system can be immediately applied to temperature variation measurements. In this experiment, the consistency of the thermal environment surrounding the sample is highly important. To facilitate sample exchange while maintaining the temperature environment, an IC socket was used as a removable sample holder that can be inserted and removed from the receptor installed in the gas chamber.
When measuring transparent materials or semiconductor samples that exhibit photoconductivity, it is necessary to cover the sample with a light-absorbing layer. The use of such an absorber has been widely studied to improve the performance of pyroelectric infrared sensors [17,18]. The most commonly used material would be gold black [17]. However, its deposition requires high-temperature heating of gold in gas and can damage the heat-sensitive molecular crystals. Therefore, in this study, we applied a synthetic resin paint to the transparent standard sample, as described in the Materials and Experiments section.

3.3. Pyroelectricity Measurements on LiNbO3

To verify the performance of the radiative temperature modulation system, we conducted standard sample experiments by employing LiNbO3. The widely used ferroelectric compound belongs to the trigonal crystal system, in which the spontaneous polarization points along the Z-axis. The measurements were performed for a thin plate crystal in which the polar axis points along the plane at room temperature. The modulated light was irradiated onto the absorber coating on the sample surface, and the pyroelectricity generated along the polarization axis was extracted from the electrodes attached to the edge of the crystal.
Figure 2 shows the frequency dependence of the thus observed pyroelectricity. According to Equation ( 3 ), the signal intensity measured using the AC method is expected to be proportional to the frequency of temperature modulation. However, the results obtained are very complex, and the frequency dependence can be divided into the following three regions: a low-frequency region where the data increases with frequency, an intermediate region where the data plateaus, and a high-frequency region where the data decreases.
Since pyroelectricity is a temperature variation of the electric polarization, the deviation from the linear frequency dependence indicates a discrepancy in the temperature of the sample expected by Equation ( 3 ). To correctly estimate the temperature of the sample, we performed the following thermal diffusion analysis.

3.4. Dynamical Temperature Distribution Calculated by One-Dimensional Layer Models

Suppose the surface of the sample is wide enough with respect to the thickness. In that case, the heat uniformly supplied by the irradiation light will propagate toward the back surface as a one-dimensional flow. The resultant temperature distribution in the sample should be expressed as a function of a depth from the front surface x , i.e., T ( x ) . Using the derivative of T ( x ) , heat flow j ( x ) is written via Fourier’s law as follows:
j ( x ) = K x T ( x ) ,
where K denotes the thermal conductivity of the sample. If the applied heat is time-modulated, the heat flux flowing into a unit volume is given by the following continuity equation:
c ρ t T ( x , t ) = x j ( x , t ) ,
where c and ρ are the specific heat and density of the substance, respectively. Equations ( 4 ) and ( 5 ) give the following thermal diffusion equation:
t T ( x , t ) = κ 2 x 2 T ( x , t ) ,
where κ denotes the thermal diffusion constant ( κ = K / c ρ ) . Pyroelectricity I pyr generating in a thin layer with a thickness of δ x at a depth of x is written as follows:
δ I pyr ( x , t ) = α T ( x , t ) t L δ x ,
where L is the length of the electrodes. Although α is temperature dependent, it is assumed to be uniform within the sample because of the small temperature distribution in a thin sample.
In the present study, the sample is heated with the periodic light. Thereby, its temperature should be modulated in accordance with the oscillation of the light, i.e., T ( x , t ) = Δ T ( x , ω ) sin ( ω t ) + T 0 ( x , ω ) . The total pyroelectricity collected by the electrodes is thus given by the following:
I pyr ( ω ) = α L 0 d T ( x , t ) t d x = α L ω 0 d Δ T ( x , ω ) d x = α ω S Δ T m ( ω ) ,
where Δ T m ( ω ) is the temperature modulation averaged over the crystal thickness, as follows:
Δ T m ( ω ) = 1 d 0 d T ( x , ω ) d x .
Equation ( 8 ) denotes that if Δ T m ( ω ) has been known, α can be calculated from the experimentally observed pyroelectric current, I pyr ( ω ) . Since it is practically impossible to measure the dynamically varying temperature distribution, we estimated the distribution by the following thermodynamic analyses. The analytical expression of pyroelectricity has been systematically discussed by Holeman [14]. Following the formalism, we first treat a bare thin-plate crystal sample and then a system with a light-absorbing layer coated on the sample surface.

3.4.1. Single-Layer Model

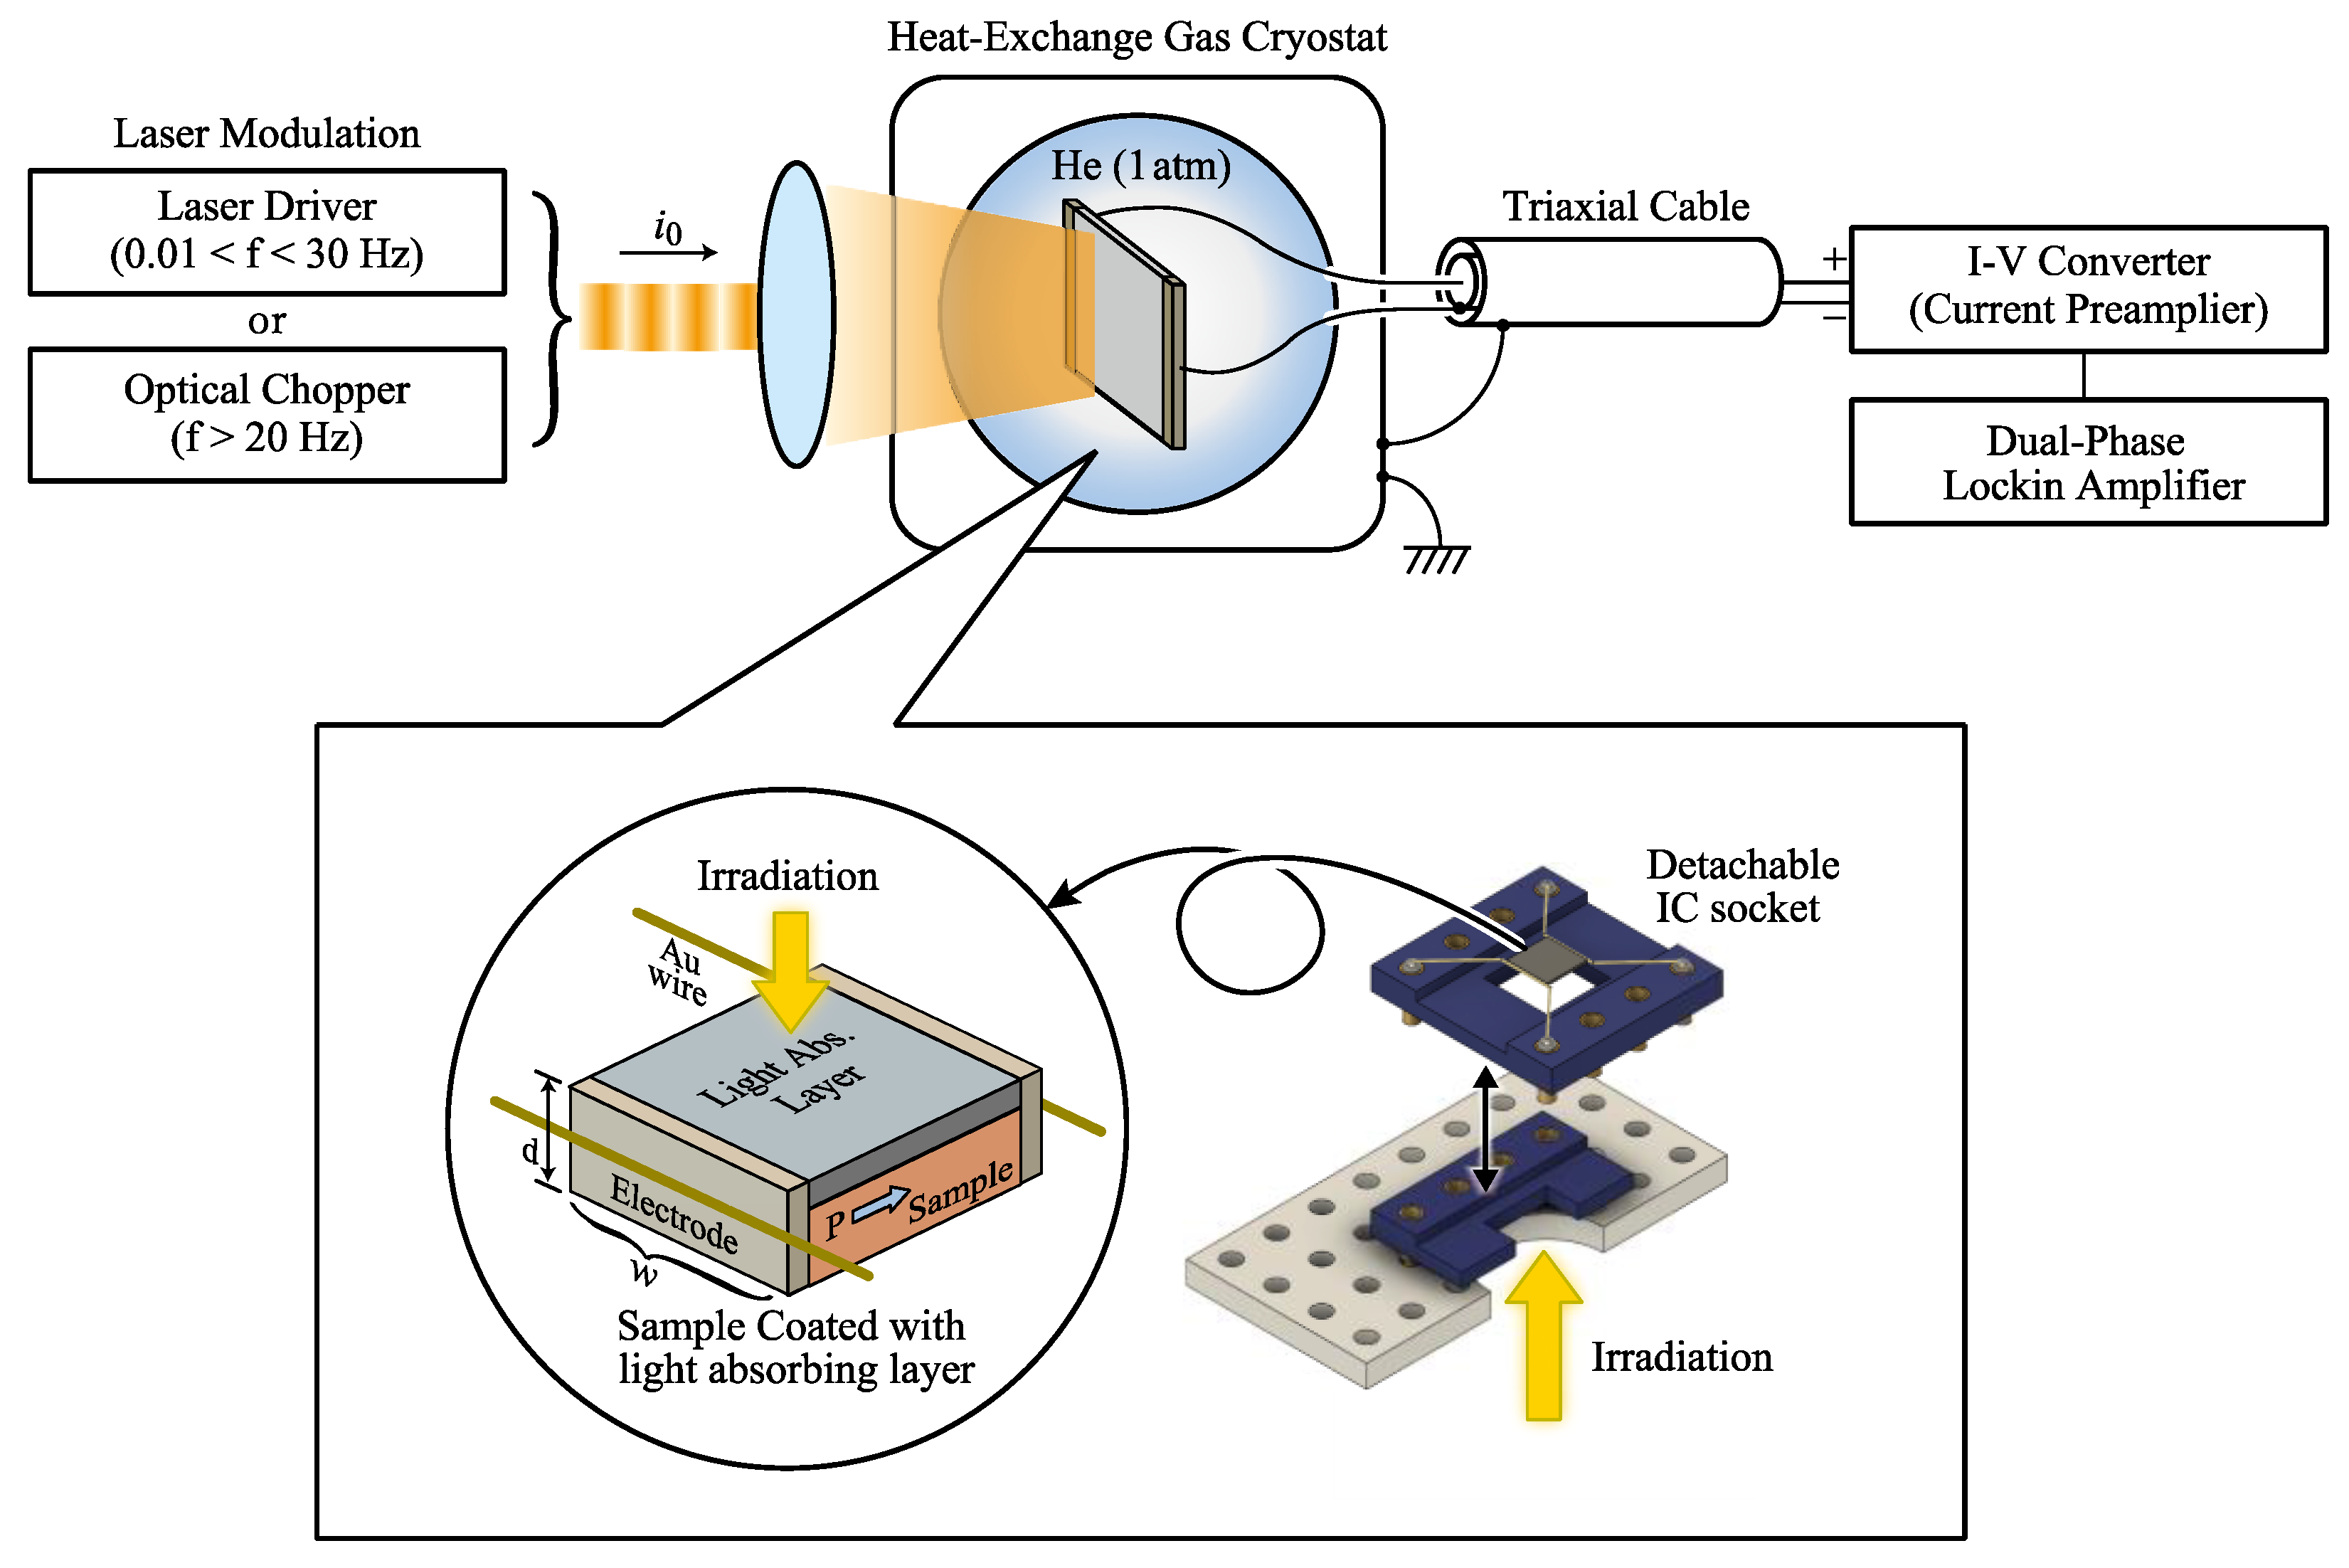
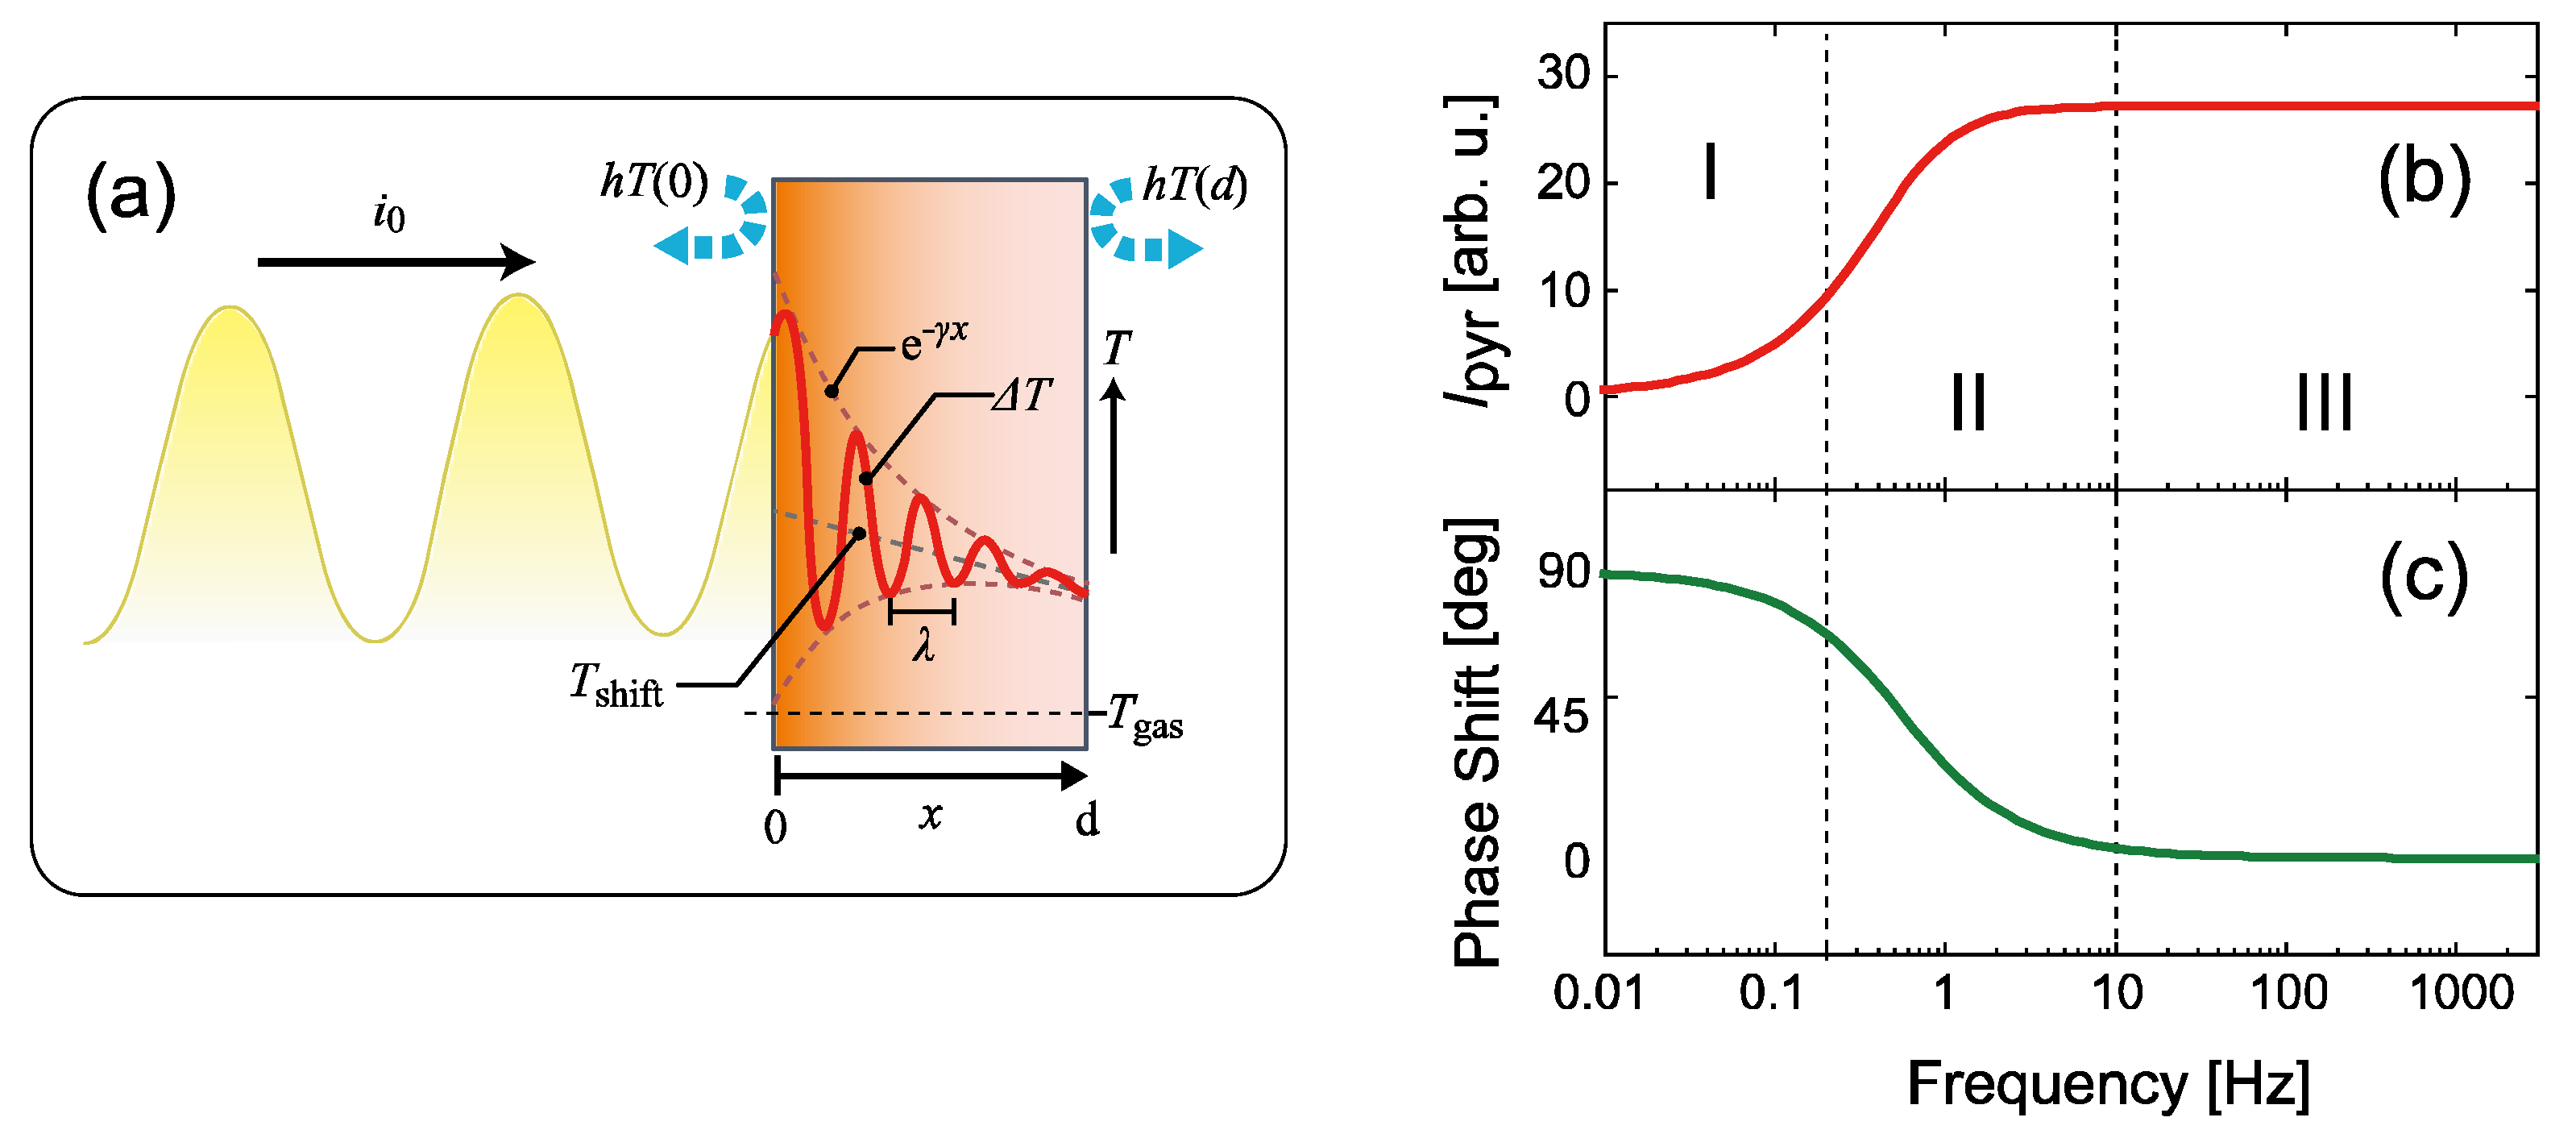
Consider the pyroelectric current in a thin plate sample irradiated with periodic light in a heat exchange gas, as shown in Figure 3. The temperature distribution is spatially distributed according to the flow of heat from the surface to the back, thus T ( x , ω , t ) can be written as follows:
T ( x , ω , t ) = Δ T ( x , ω ) exp ( i ω t ) + T shift ( x ) + T gas ,
where the first term indicates the damping wave of temperature with the amplitude of Δ T . T shift ( x ) and T gas represent the steady-state temperature shift and the temperature of the heat-exchange gas, respectively. Although the heat is only given from the front surface, the reflected wave from the backside is superposed to the forward wave to form a steady heat flow in equilibrium. Thus, Δ T is written as follows:
Δ T ( x , ω ) = C ( ω ) e ( i 2 π λ γ ) x + D ( ω ) e ( i 2 π λ γ ) x ,
where C and D are the complex coefficients representing the intensity and phase shift from the irradiation light for the forward and the reflected waves, respectively. The parameters λ and γ in the exponents denote the wavelength and the damping coefficient of the heatwave, respectively, and determine the envelope of the damped waveform. The coefficient of x in the exponential functions can be rewritten as follows:
k ( ω ) = i 2 π λ γ = ( 1 + i ) ω 2 κ   .  
This indicates the presence of the following relationship between λ and γ :
λ 2 π = γ 1 = 2 κ ω   .
The coefficients C and D in Equation ( 11 ) are determined from the boundary conditions. In the steady state during measurement, the heat of irradiation is applied to the first boundary, i.e., the front surface of the sample. Some of it is lost by heat transfer to the gas, while the remaining heat passes through the sample and is finally transferred to the gas at the second boundary (the backside). Rigorously, the contribution of thermal radiation, which is approximately given as 4 σ T 3 [19] ( σ is the Stephan Boltzmann coefficient), needs to be taken into account. However, its effect at room temperature is estimated as 6.1   W / m 2 K , which is much smaller than the impact of the heat-exchange gas calculated in the following discussion. Thus, its effects are ignored in the following discussion. If we denote the heat flow at x as j ( x ) , the amplitude and angular frequency of the irradiation as i 0 and ω 0 , the temperature of the heat exchange gas as T gas , the heat-transfer coefficient between the sample and the gas as h , and the thickness of the crystal as d , the continuity of the heat flow on the front and back surfaces can be expressed as follows:
{ i 0 ( 1 + sin ( ω t ) ) h ( T ( 0 , t ) T gas ) = K x T ( 0 , t ) K x T ( d , t ) = h ( T ( d , t ) T gas ) .
By substituting the general solution Equation ( 11 ) into these boundary conditions, we obtain the coefficients C and D and T shift .
T shift ( x ) = i 0 2 c κ ρ + d h x + c κ ρ + d h 2 c κ ρ + d h i 0 h
Since the time-independent term T shift does not affect the pyroelectricity, the effect is ignored in most of the literature. However, when experiments are performed close to a transition point, this term significantly affects the physical properties. In the present experiments, for example, T shift is estimated as 2.0 K at the surface ( x = 0 ) by substituting the experimental and calculated values for i 0 and h in Equation ( 15 ), respectively. If a higher temperature resolution than this value is required, the experimental conditions need to be adjusted.
The pyroelectricity is obtained from the time-dependent term in Equation ( 10 ). By substituting C and D into Equation ( 11 ), the solution of Equation ( 9 ) is given as follows:
Δ T m = i 0 ( K k sinh ( k d ) + h ( cosh ( k d ) 1 ) ) d k ( ( K 2 k 2 + h 2 ) sinh ( k d ) + 2 K h k ( cosh ( k d ) 1 ) + 2 K h k ) .
The pyroelectricity can be obtained by substituting Δ T m into Equation (8). 
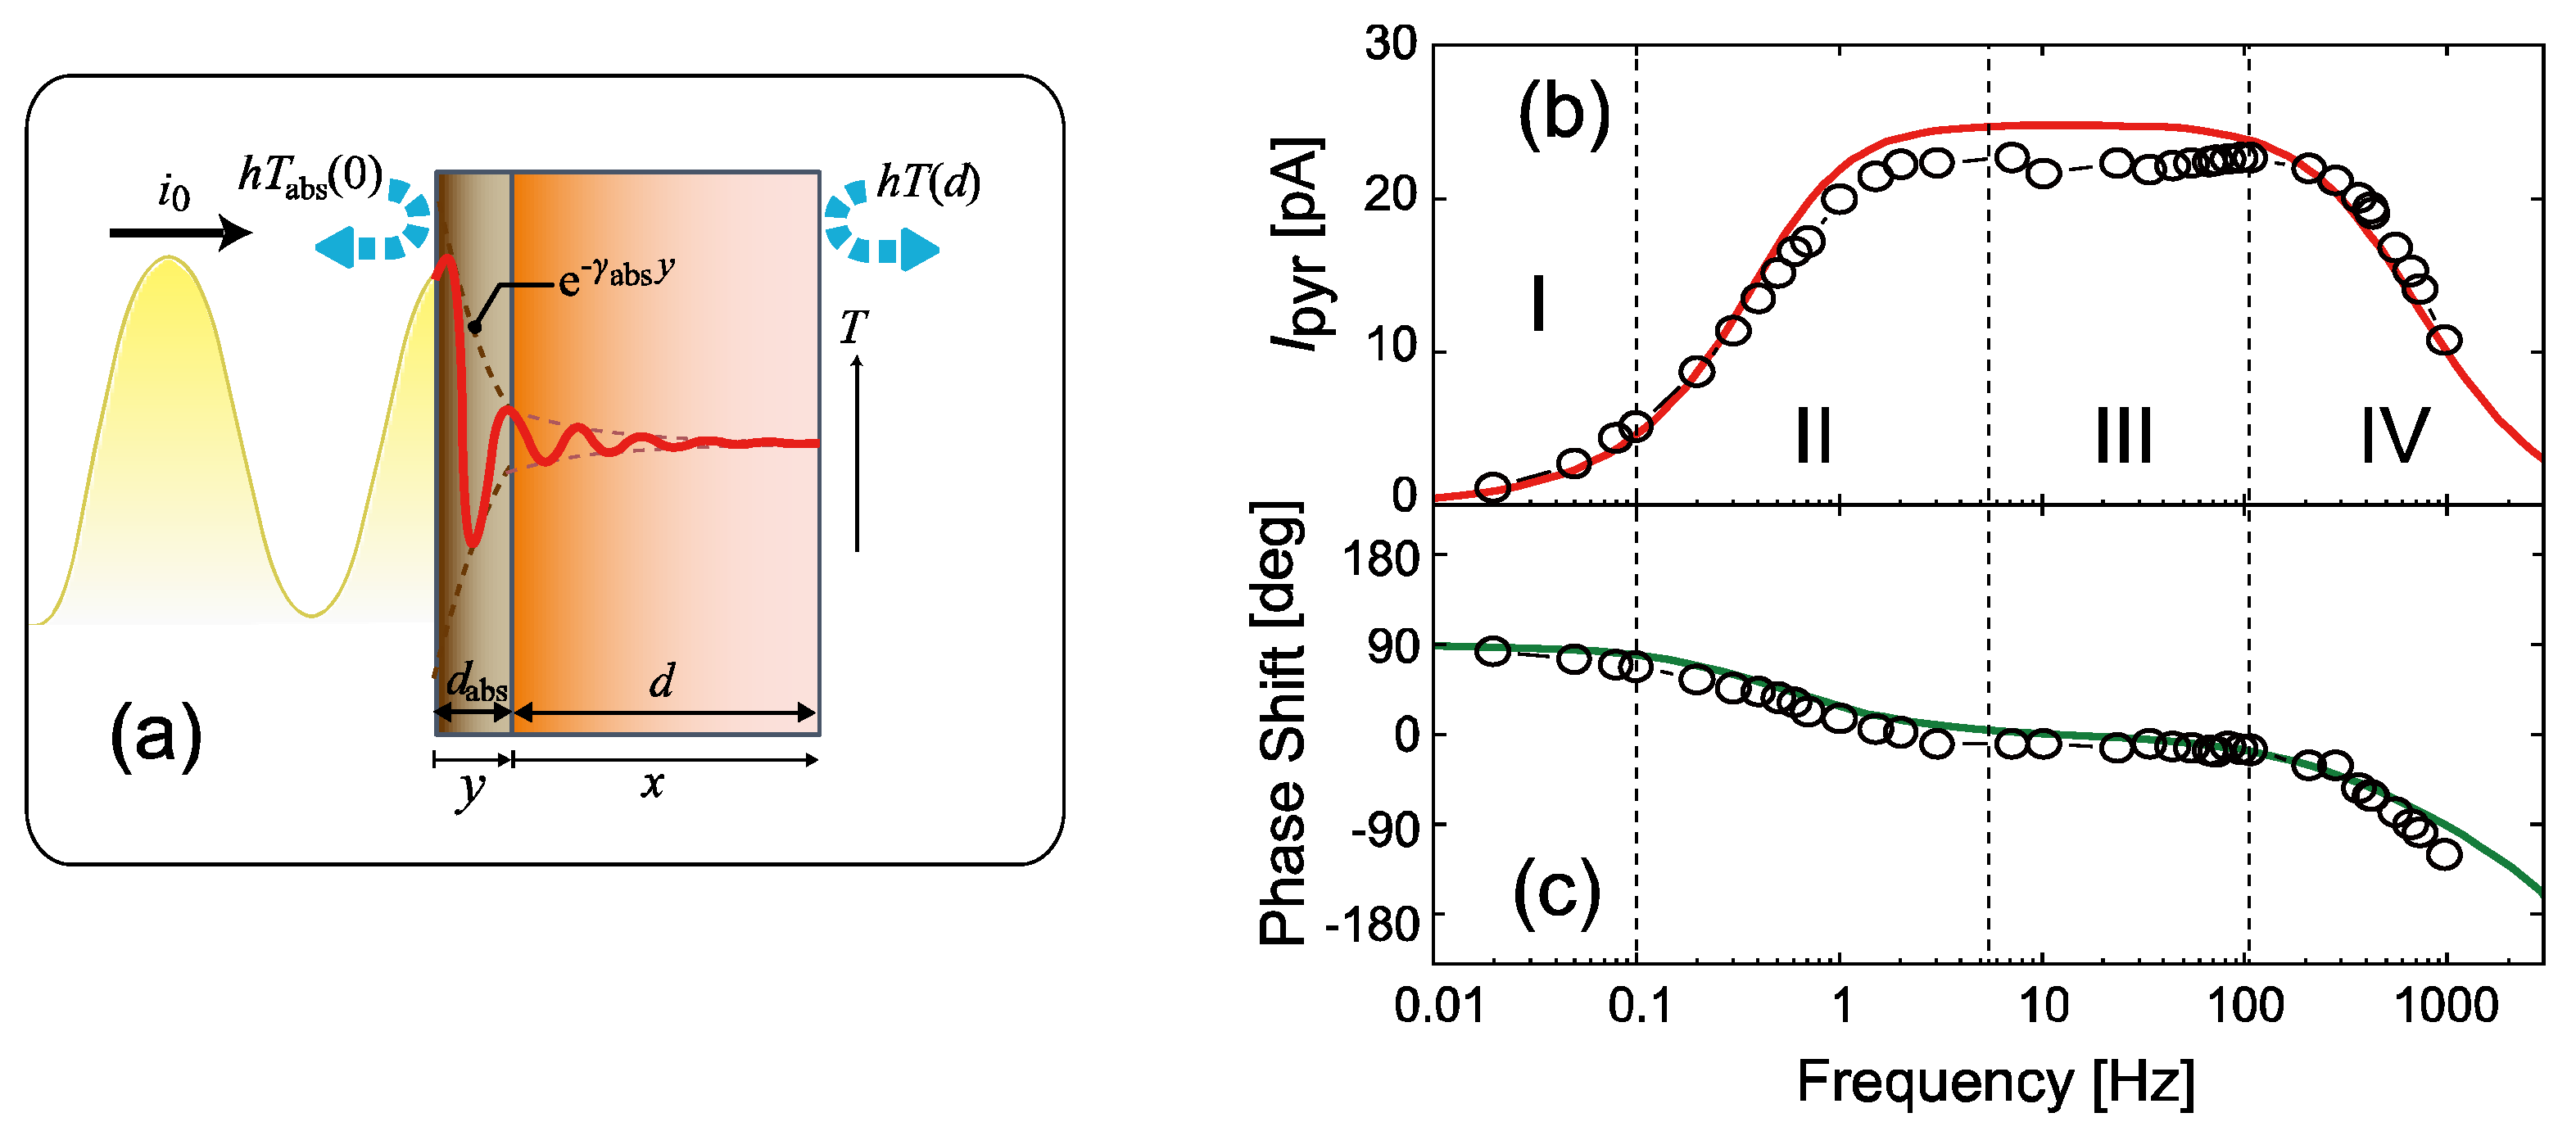
Figure 3b,c show the frequency plot of the intensity of the pyroelectricity I pyr ( ω ) and the phase difference from the irradiated light wave, respectively. Since Δ T m varies with the modulation frequency f = ω / 2 π via the argument of the hyperbolic functions, i.e., k ( ω ) d , the characteristics of Δ T m depend largely on the magnitude of the argument. Assuming that the threshold frequency f th is as follows:
f th = 1 π κ d 2   ,  
the value of I pyr ( ω ) is approximated as follows [11,14]:
( f < f th ) I pyr ( ω ) ~ α S ( i 0 2 h ) ω ,  
( f > f th ) I pyr ( ω ) ~ α S c ρ d i 0 .
We divided the frequency domain of the experimental data into three regions according to the conditions given by Equations ( 17 ) and ( 18 ) and tried four different fitting methods to examine the agreement of the experimental results with the physical parameters of the standard material. In the following, the physical quantities other than the fitting parameters for each process were assumed to be the experimentally determined or reported values shown in Table 1.
  • Region I:
Equation ( 18 
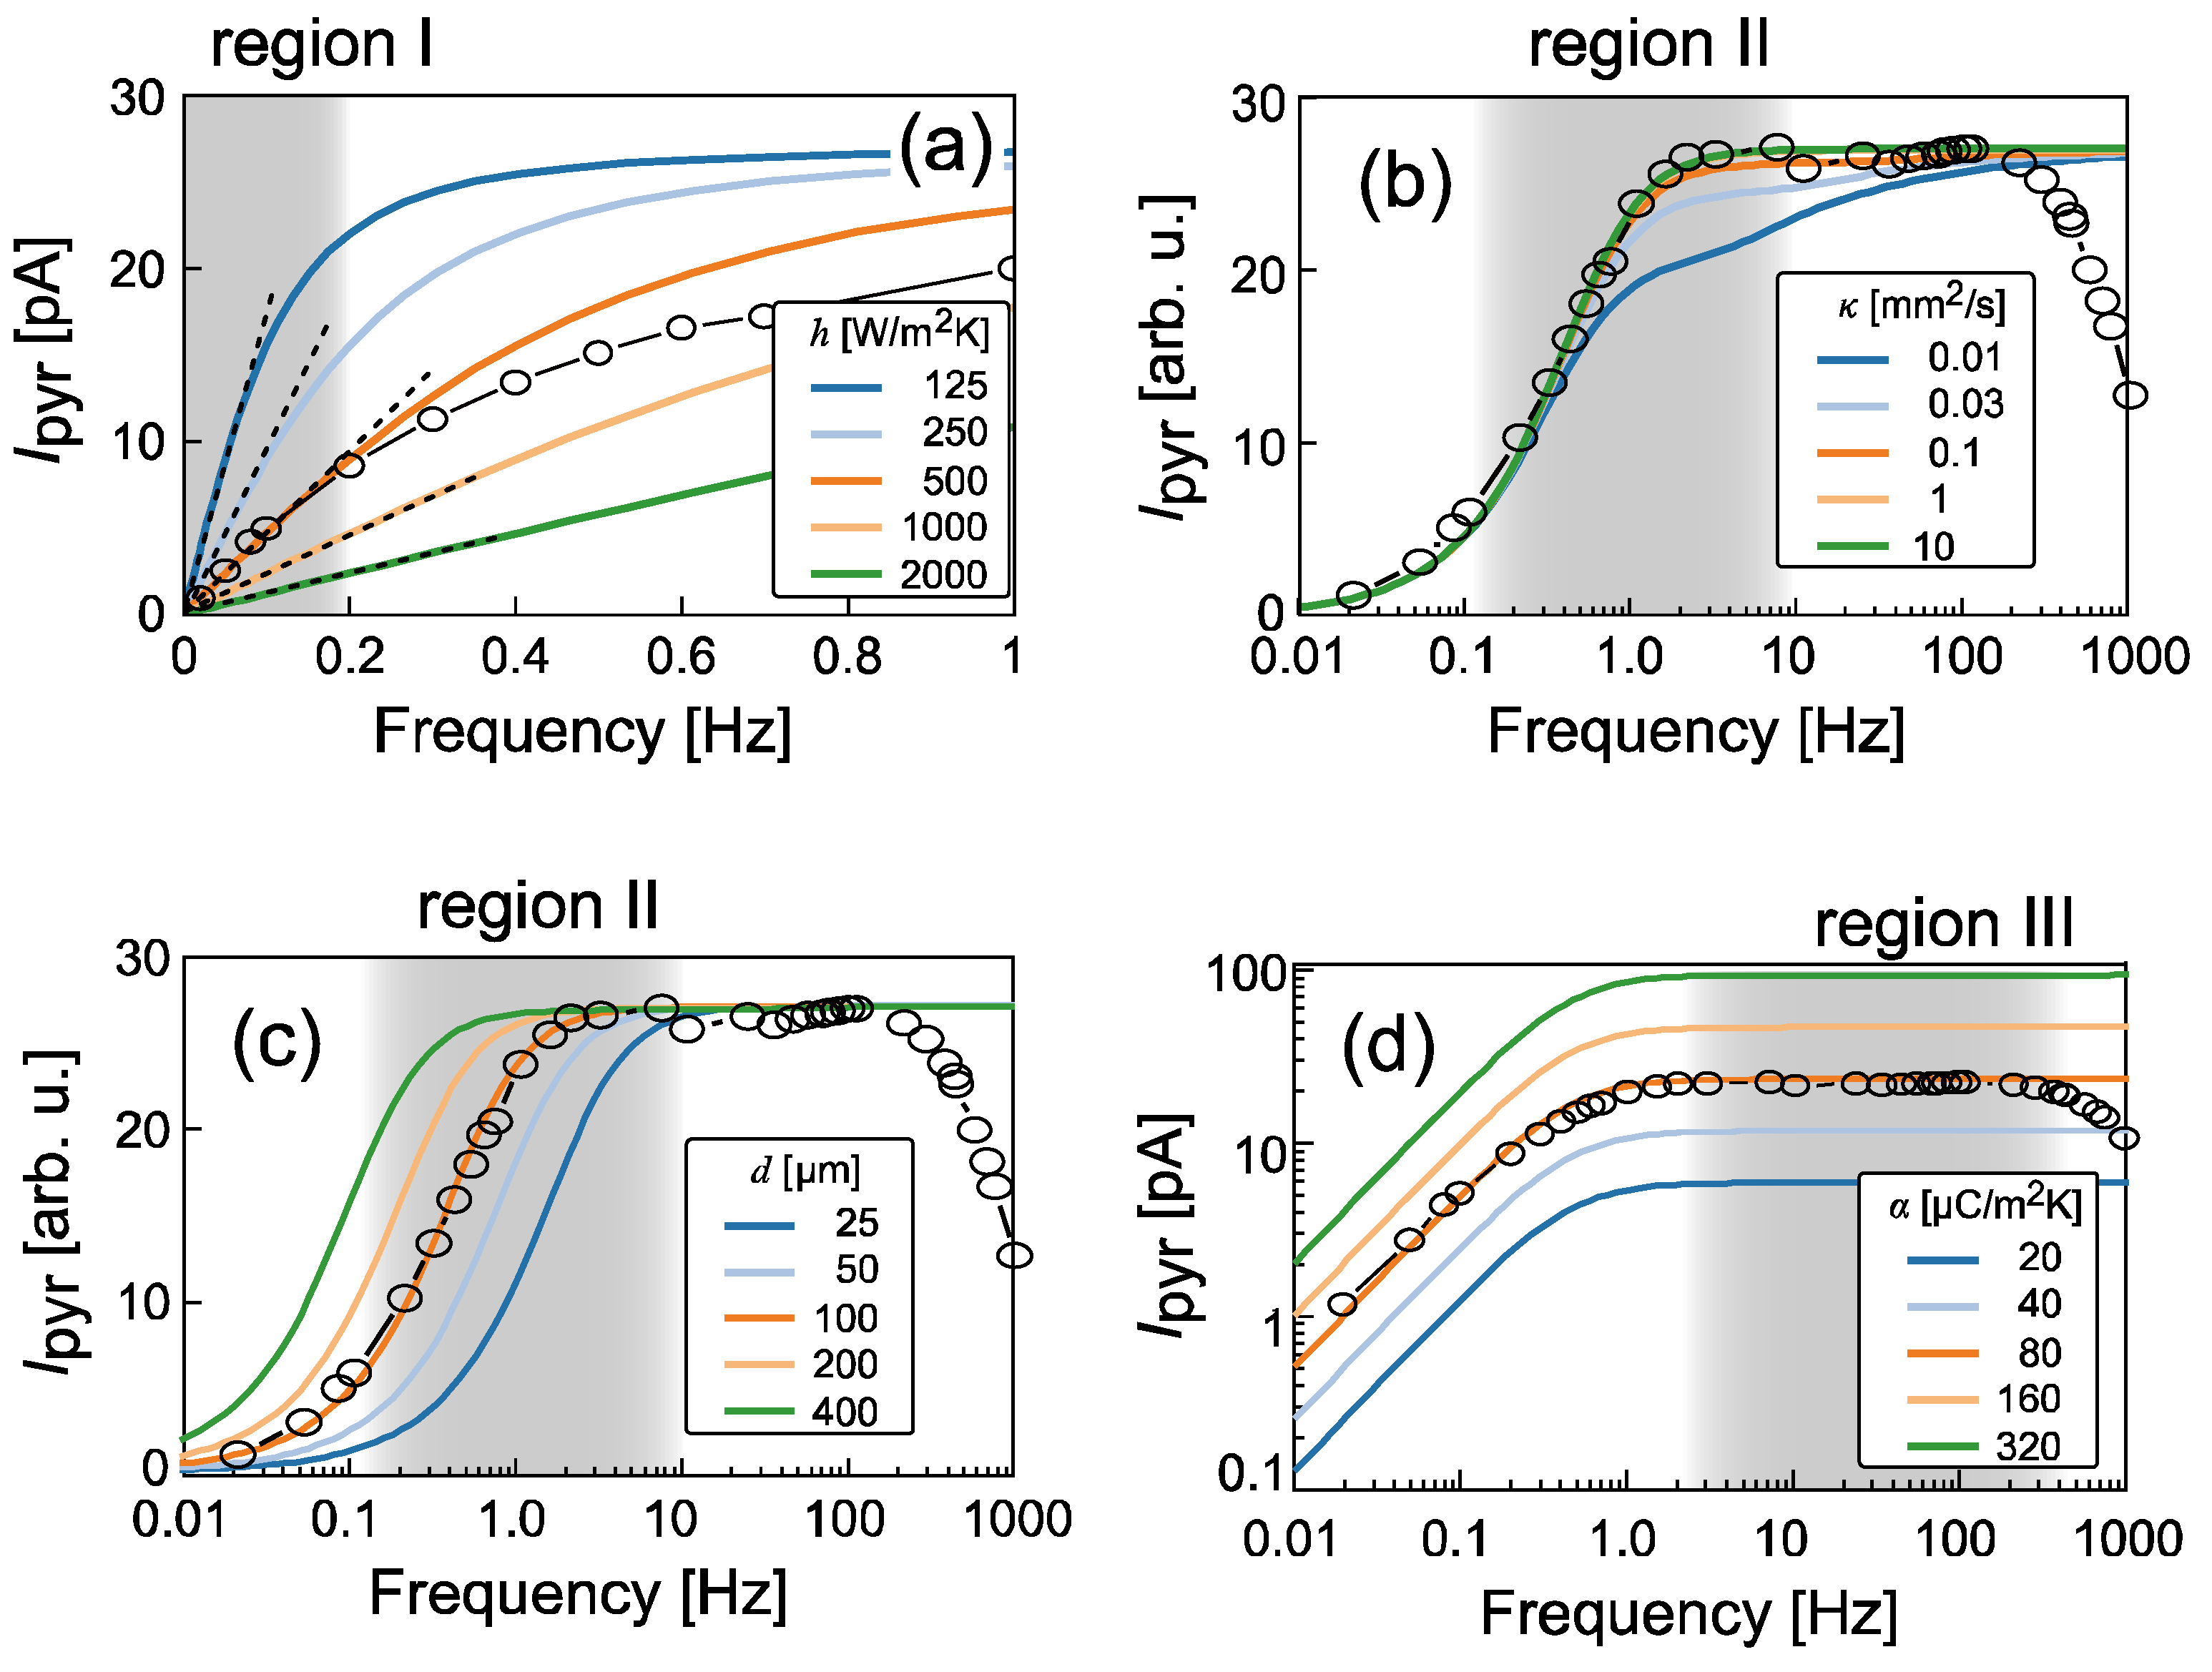
) implies that the signal strength increases in proportion to the frequency in the low-frequency region. Figure 4a shows the signal intensity in the low-frequency region. The two parameters S and i 0 are given by the experimental conditions. As we will see later, α is determined by the analysis of Region III; thus, we can determine the value of h from the gradient for the low-frequency data. As is shown in Figure 4a, we found that the calculated curve for h = 500   W / m 2 K gives the best result among the several trials. A heat transfer coefficient is a parameter governed by the convection of the heat exchange gas. Therefore, this value obtained here can be applied as a device-specific parameter if samples with similar shape and surface conditions are used.
2.
Region II:
Next, we examine the region between Region I and III, where the modulation frequency f approaches f th . In this region, the hyperbolic functions cannot be simplified by the limit approximations as performed in Equations ( 18 ) and ( 19 ). Since f th is defined by Equation ( 17 ), the frequency dependence of the signal in this region is suggested to be deeply related to the values of κ and d . If d is experimentally determined, fitting with κ as a parameter is possible, as shown in Figure 4b. On the other hand, if κ has been obtained by other studies, it is possible to fit the experimental value with d as a parameter, as shown in Figure 4c. In the case of the present study, κ of the standard sample is known, and the curve calculated by adopting the literature value agrees well with the experiment data, as shown in Figure 4b. Similarly, the simulation results for a sample thickness of 100 μm also agree well with the experimental values, as shown in Figure 4c.
3.
Region III:
Finally, we discuss the frequency region where f > f th . Equation (19) clearly shows no frequency dependence of the signal strength in this frequency region. Therefore, the signal indicates a simple plateau, and its value is proportional to α ; hence α can be estimated from the plateau level if the specific heat and density of the sample are known. The value of α in LiNbO3 has been investigated in several studies [22,23,24,25,26,27], and the values at room temperature vary widely from 18 [23] to 95 [27] μ C / m 2 K . Figure 4d shows the comparison of the calculation with the experimental data and indicates that the curve calculated for α = 80   μ C / m 2 K shows good agreement with the experiment. Thus, we adopted the literature value 83   μ C / m 2 K reported in [27] for other calculations.

3.4.2. Two-Layer Model

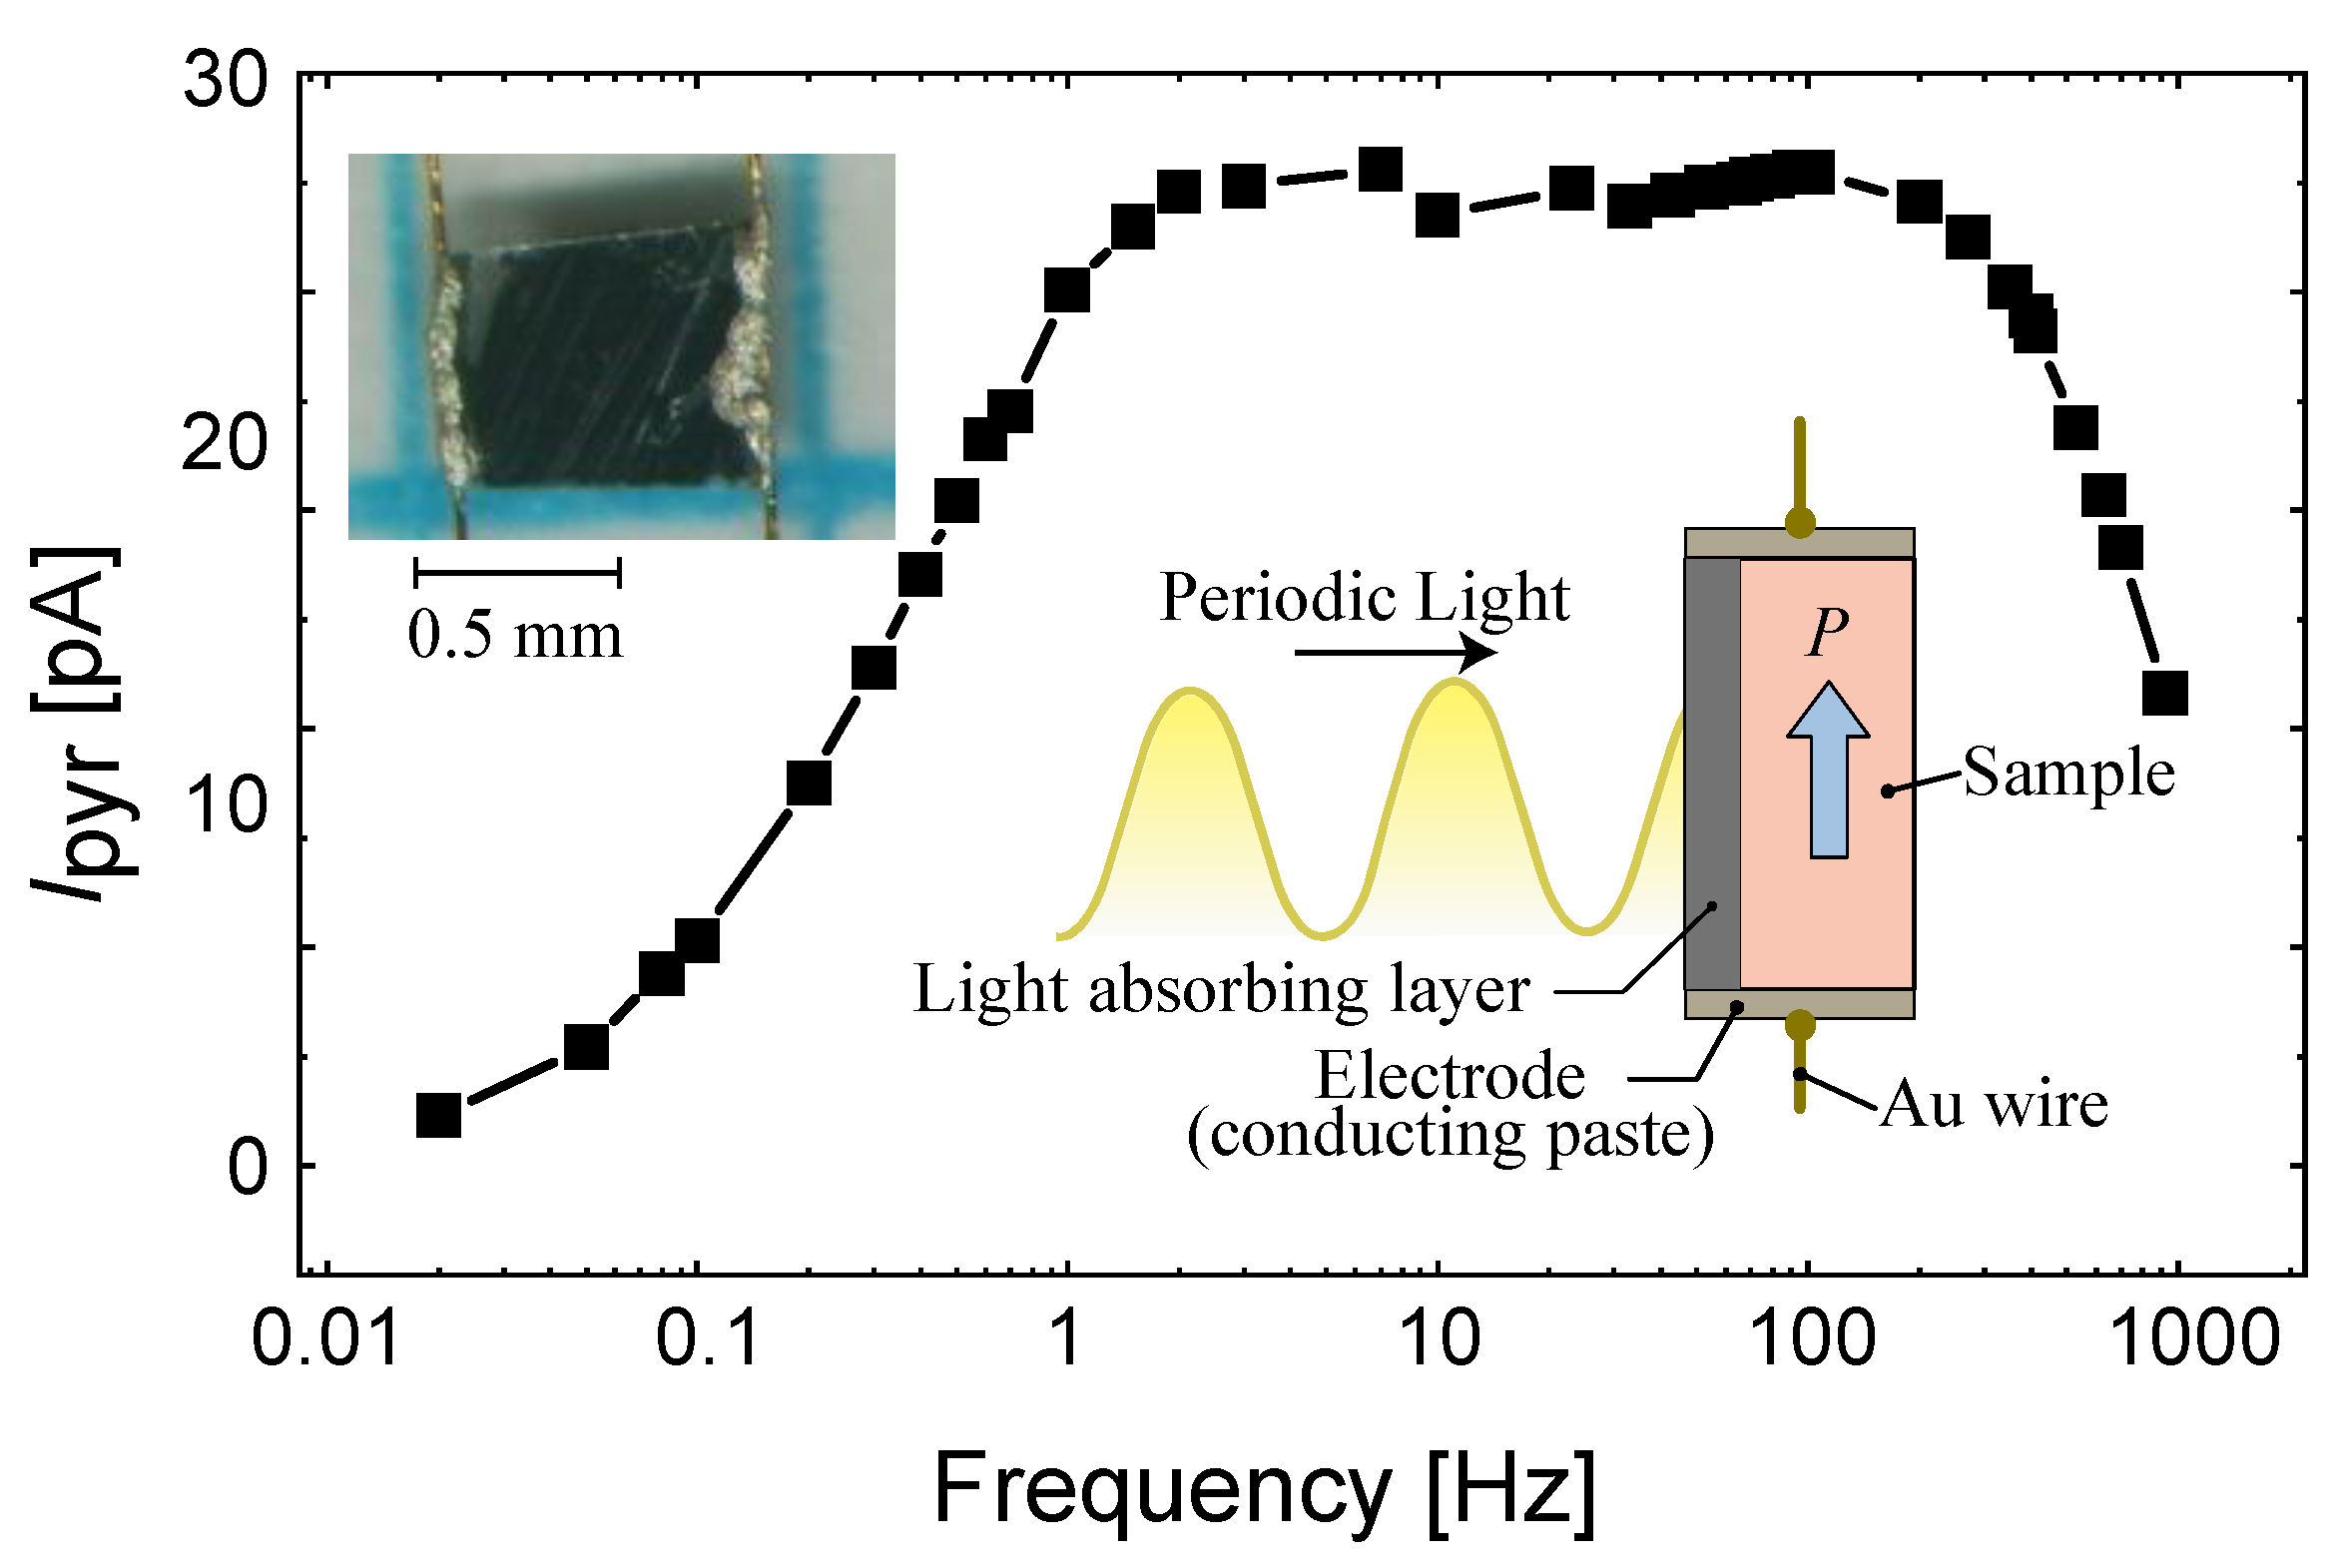
From the above discussion, it seems that the single-layer model can reproduce the observed pyroelectricity. However, as shown in Figure 4d, the decay profile appearing above 300 Hz in the experiment is not reproduced in the calculation, which raises questions about the validity of the simulation. A candidate for this problem is the presence of a light-absorbing layer, which has not been considered in previous models. Therefore, we consider a two-layer model that includes the presence of the light-absorbing layer, as shown in Figure 5a. Such multilayer models have been investigated in detail by Peterson et al. for vertically poled pyroelectric polymer films [19]. The application has also been reported for a system in which the sample is bonded to a thermal bath [11].
The two-layer model consists of an infinite absorbent layer of thickness d abs on the front surface of the previous one-layer model. Fourier’s law of Equation ( 4 ) and the heat conduction equation of Equation ( 6 ) has yielded the complex wavenumber k that defines the heat flow in the pyroelectric material, as shown in Equation ( 12 ). By replacing the physical parameters in these formulas with the values of the light-absorbing layer, the complex wavenumber for the light-absorbing layer k abs is obtained. By imposing the boundary condition of light irradiation on the surface of the light-absorbing layer and matching the temperature and heat flow at the interface of the two layers, the coupled differential equations for the two-layer model are obtained as follows:
{ i 0 ( 1 + sin ( ω t ) ) h ( T abs ( 0 , t ) T gas ) = K abs x T abs ( 0 , t ) K abs x T abs ( d abs , t ) = K x T ( 0 , t )   T abs ( d abs , t ) = T ( 0 , t ) K x T ( d , t ) = h ( T ( d , t ) T gas )  
In the above equations, the temperature distribution of the coating layer is denoted as T abs ( y ) , where y indicates the depth from the surface of the layer, and the other physical parameters of the absorbing layer are represented as c abs ,   ρ abs ,   K abs , and d abs . The solutions of Δ T and Δ T abs satisfying the boundary conditions are obtained using the same procedure described in the discussion of the single-layer model. By substituting the obtained Δ T into Equation (8), we obtained I pyr of the two-layer model and performed the following calculations.
We should note that the frequency dependence of I pyr of the one-layer model was governed by the magnitude of d k , the argument of the hyperbolic function. In addition to these hyperbolic functions, additional hyperbolic functions with d abs k abs as an argument appear in I pyr for the two-layer model. Thereby, we can infer that there should be a new threshold f th , abs that classifies the frequency dependence of I pyr for the two-layer model, i.e.,
f th , abs = 1 π κ abs d abs 2 .
In fact, Figure 5b, the simulation result of I pyr discussed below, shows a decaying region for f > f th , abs in addition to the three regions described in the one-layer model.
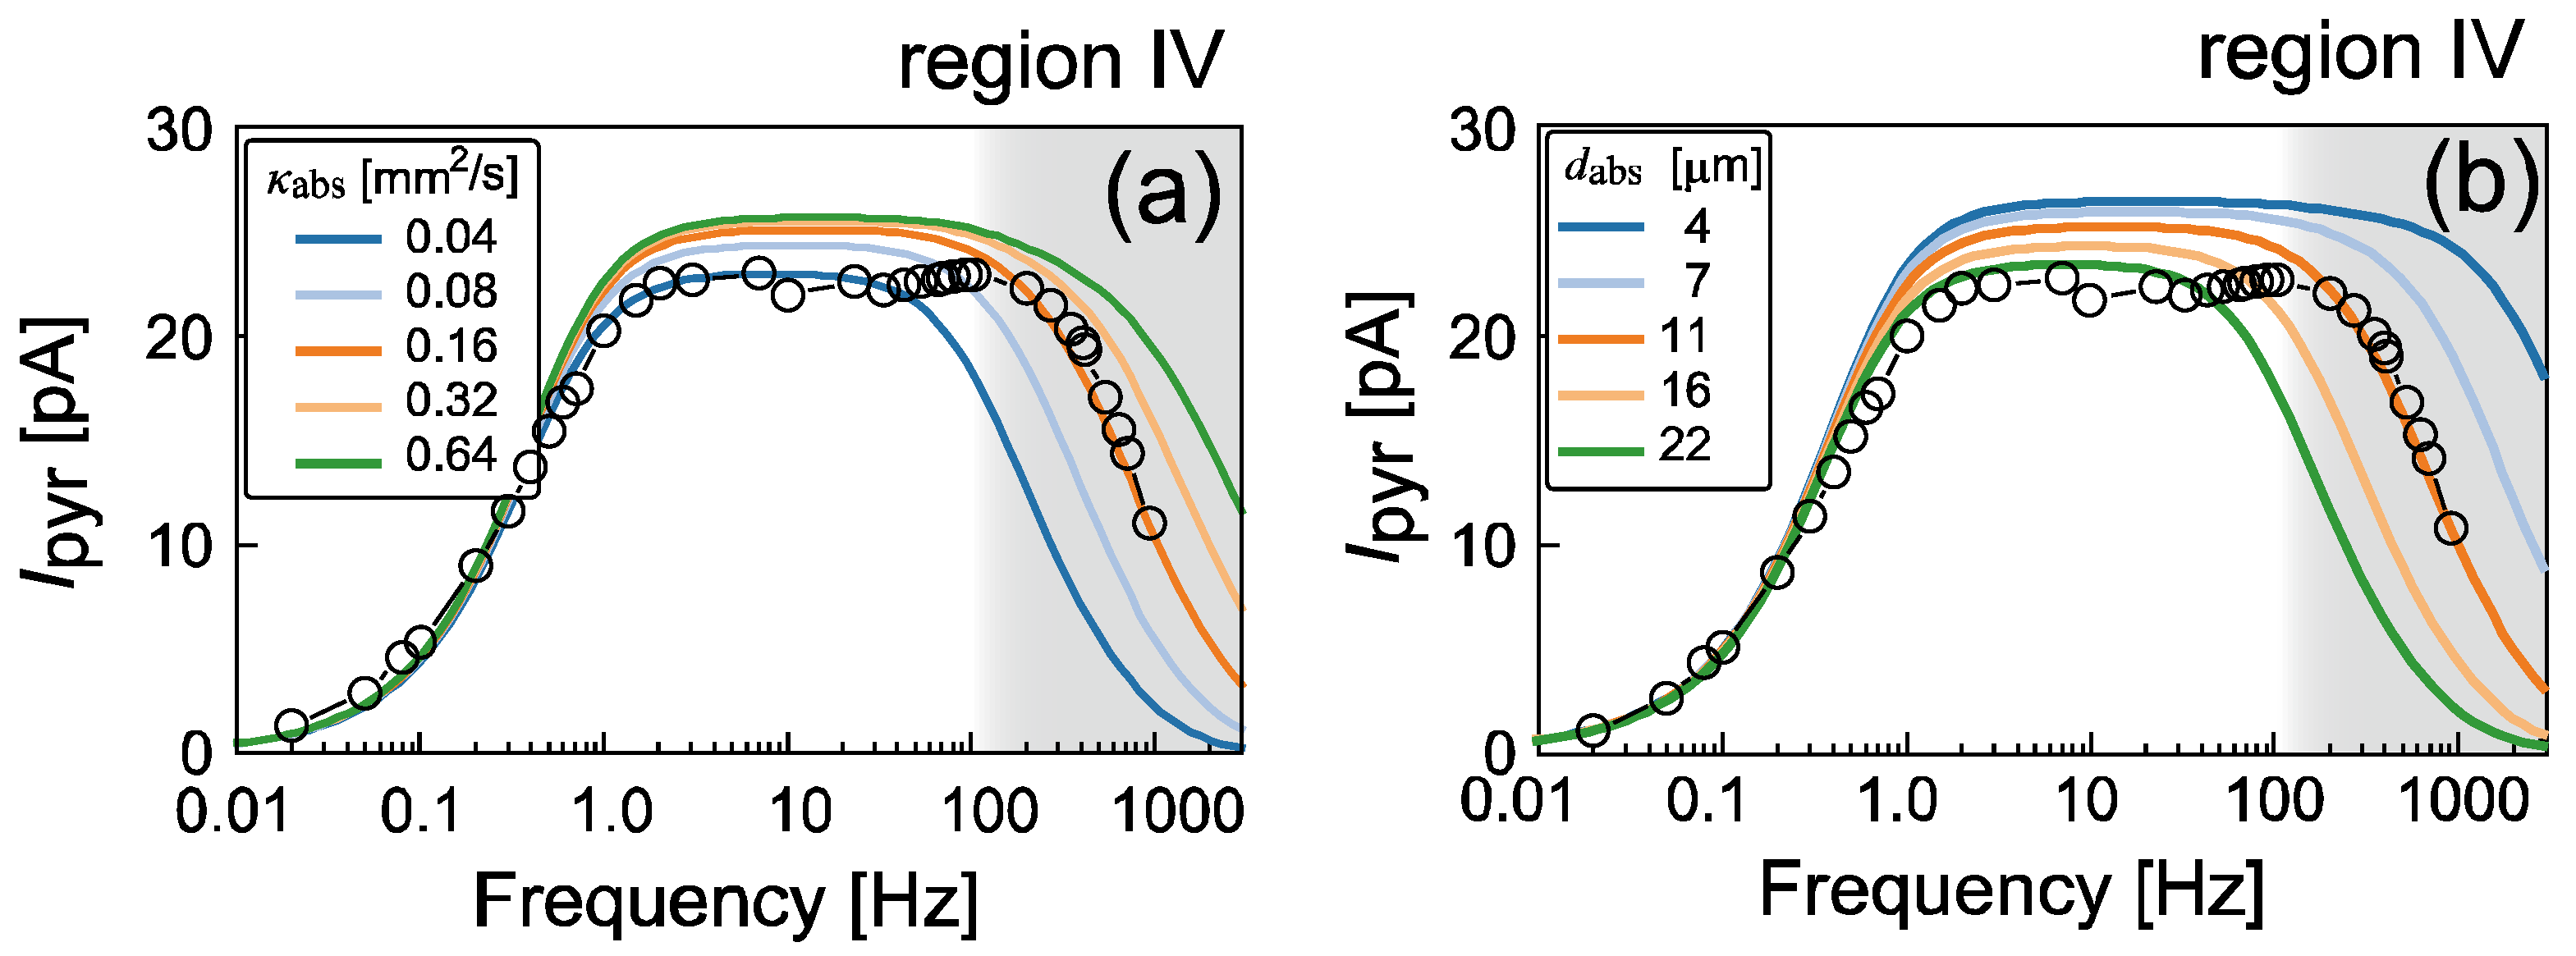
Since this threshold is a function of κ abs and d abs , the width of Region IV changes when either parameter is changed. As shown in Figure 6a,b, we calculated the κ abs and d abs dependence based on the two-layer model. These two plots show that the optical absorption layer not only caused Region IV, but also affected the signal intensity in Regions I–III. However, in the present case, the effects were limited because the layer was sufficiently thin; thereby, the parameters obtained from the one-layer model could be directly applied to the fitting of the two-layer model. Aside from these parameters adopted in the single-layer calculations, we assumed the following physical parameters for the absorbing layer: 1.4   J / gK , which is a typical value for polymers, for c abs , and 0.76   g / cm 3 for ρ abs , which is the disclosed density value of the commercial paint. If one of κ abs and d abs is known, the other can be obtained by fitting the experimental values. In this case, d abs had been determined to be 11 μm using the surface step measurement, and we determined κ abs to be 0.16   mm 2 / s using the fitting in Figure 6a. This κ abs value is consistent with typical data for the thermal diffusivity of polymer resins [28]. Although it may vary slightly depending on the surface condition of the sample and the coating method, it can be used as a reference value when the light-absorbing layer is prepared under similar conditions.
As seen in Figure 4d, the pyroelectric coefficient α of the sample is estimated from the height of the plateau in Region III. However, this plateau structure will be squeezed out as Region IV widens and approaches Region II. Moreover, since the amplitude of the temperature wave decreases according to the decay function exp ( γ abs d abs ) , as shown in Figure 5a, the pyroelectricity signal is also weakened by this decay. Therefore, to estimate α correctly, f th , abs needs to be sufficiently larger than f th to protect the plateau structure; because κ abs is a material-specific parameter that cannot be adjusted, the light-absorbing layer must be deposited as thinly as possible.
The parameters h ,   κ , and κ abs determined using the above procedure, together with the literature values of LiNbO3, were substituted into the equation of I pyr . The resulting pyroelectricity and the phase shift are shown in Figure 5b,c, respectively. The calculation results show excellent agreement in both signal intensity and phase, confirming the reliability of the experimental data collected by the system and the validity of the two-layer model calculations.
Since the main source of uncertainty in quantitative analysis in the present modulation measurements depends on the estimation error of the sample temperature, the validity of the heat conduction model is of crucial importance. The successful reproduction of the experimental data strongly suggests the correctness of the one-dimensional thermal model. When we use naturally grown single crystals, the shape of the sample cannot be freely specified. If the size of the light-irradiated area of the sample is not sufficiently large compared to its thickness, heat diffusion in the transverse direction parallel to the light-irradiated plane cannot be neglected, and pure one-dimensionality is lost. In such cases, the heat transfer from the gold wire attached to the crystal edges cannot be neglected; thus, thinner gold wires or resistive wires should be used. When a one-dimensional model is applied to a system where lateral thermal diffusion cannot be neglected, the amplitude of the thermal wave is overestimated compared to its true value. Since thermal diffusion is caused by thermal gradients, this overestimation will be more pronounced in the high-frequency region where deviations from a uniform temperature distribution in the sample are more pronounced. If the simulation results show such behavior, the sample should be replaced with a more suitable geometry.
Finally, we would like to mention the sensitivity limit of this measurement system. If the purpose of this temperature modulation measurement is to find only the pyroelectric coefficient of a sample, there is no need to measure a wide range of modulation frequency dependence as we performed in the present study. Instead, one needs only to collect data for a single point at a frequency in the plateau region. To calculate the electric polarization from the pyroelectric coefficient, one should perform that experiment over a wide temperature range, including the transition point. In modulation measurements in the acoustic frequency domain such as the present study, the dominant noise is the 1/f noise generated by electronic components such as operational amplifiers. Therefore, experiments should be performed at as high a modulation frequency as possible in the plateau region to suppress the noise. However, in the case of using an optical absorption layer, as in this study, the plateau region is limited by Region IV, which imposes an upper limit on the frequency that can be selected. Even without the optical absorption layer, the amplifiers that can operate at high frequencies have a high input impedance; therefore, they cannot be used for semiconductor samples with low impedance. The researchers need to ensure these conditions for their sample and then conduct the experiment at the appropriate frequency. In this study, the modulation frequency was fixed at 103 Hz, which is close to the upper limit of Region III, and the dependence of the signal intensity on the light intensity was investigated. As a result, we confirmed that the signal could be measured, even down to 3% of the experimental condition. This indicates that the experimental method can be applied to samples with widths in the order of μm for samples with a pyroelectric coefficient comparable to that of LiNbO3. As for the thickness, as discussed in Figure 4c, the signal strength does not depend on the thickness of the sample, and, therefore, one can use as thin a sample as is experimentally possible.

4. Conclusions

In this study, a temperature-modulated measurement system was developed to measure the pyroelectricity of a small sample with high sensitivity. The experimental results of the standard sample were analyzed using a one-dimensional heat transfer model. In the developed system, the temperature of the sample can be modulated by periodic light irradiation in the heat exchange gas. Since the measurement is performed almost in a non-contact manner, there is no mechanical stress on the sample during the experiment, which is helpful for fragile single crystals such as molecular crystals. If the temperature of the heat-exchange gas is controlled using a refrigerator or heater, this system can be directly applied to the variable temperature measurements. Unlike the DC method, which requires sweeping the temperature at a constant rate, this modulation method allows the rate of temperature change to be controlled freely. This makes it possible to investigate critical phenomena such as phase transitions with high-temperature resolution. False signals caused by the discharge of trapped charges, which is a problem in pyroelectric measurement, can be eliminated by periodic temperature changes. Therefore, the measurement is effective for basic research that requires an accurate understanding of physical properties. Although LiNbO3 used as a standard sample is a typical ferroelectric material, there is a significant variation in the values of α reported thus far. Therefore, the results of this study are also important as information for examining the validity of these reported values.

Author Contributions

Project administration and writing, K.Y.; experiments and investigation, A.K.; development of measuring system, K.R. and T.C.; illustrations, T.C. All authors have read and agreed to the published version of the manuscript.

Funding

This research was supported by JSPS KAKENHI Grant Numbers JP 23550170 and JP18H01144, and by Wesco Scientific Promotion Foundation.

Acknowledgments

The authors thank Science Dream Laboratory of OUS for their cooperation.

Conflicts of Interest

The authors declare no conflict of interest.

References

  1. Manfred, F.; Lottermoser, T.; Meier, D.; Trassin, M. The evolution of multiferroics. Nat. Rev. Mater. 2016, 1, 16046. [Google Scholar]
  2. Kimura, T.; Goto, T.; Shintani, H.; Ishizaka, K.; Arima, T.; Tokura, Y. Magnetic control of ferroelectric polarization. Nature 2003, 426, 55–58. [Google Scholar] [CrossRef]
  3. Sato, O. Dynamic molecular crystals with switchable physical properties. Nat. Chem. 2016, 8, 644–656. [Google Scholar] [CrossRef] [PubMed]
  4. Ishihara, S. Novel States of Matter Induced by Frustration Electronic Ferroelectricity and Frustration. J. Phys. Soc. Jpn. 2010, 79, 11010. [Google Scholar] [CrossRef] [Green Version]
  5. Kagawa, F.; Horiuchi, S.; Tokunaga, M.; Fujioka, J.; Tokura, Y. Ferroelectricity in a one-dimensional organic quantum magnet. Nat. Phys. 2010, 6, 169–172. [Google Scholar] [CrossRef] [Green Version]
  6. Zhang, W.; Xiong, R.G. Ferroelectric Metal–Organic Frameworks. Chem. Rev. 2012, 112, 1163–1195. [Google Scholar]
  7. Tayi, A.S.; Kaeser, A.; Matsumoto, M.; Aida, T.; Stupp, S.I. Supramolecular ferroelectrics. Nat. Chem. 2015, 7, 281–294. [Google Scholar] [CrossRef]
  8. Yamamoto, K.; Iwai, S.; Boyko, S.; Kashiwazaki, A.; Hiramatsu, F.; Okabe, C.; Nishi, N.; Yakushi, K. Strong Optical Nonlinearity and its Ultrafast Response Associated with Electron Ferroelectricity in an Organic Conductor. J. Phys. Soc. Jpn. 2008, 77, 74709. [Google Scholar] [CrossRef] [Green Version]
  9. Yamamoto, K.; Kowalska, A.A.; Nakano, C.; Yakushi, K. Inhomogeneous ferroelectric polarization in α’-(BEDT-TTF)2IBr2 revealed by second-harmonic generation microscopy. Phys. B Cond. Mat. 2010, 405, S363–S364. [Google Scholar] [CrossRef]
  10. Hamilton, A.C.; Day, G.W.; Phelan, R.J. An Electrically Calibrated Pyroelectric Radiometer System; Technical Note no. 678; National Bureau of Standards: Boulder, CO, USA, 1976; p. 50. [Google Scholar]
  11. Lubomirsky, I. Stafsudd, O. Practical guide for pyroelectric measurements. Rev. Sci. Instrum. 2012, 83, 51101. [Google Scholar] [CrossRef]
  12. Jachalke, S.; Mehner, E.; Stöcker, H.; Hanzig, J.; Sonntag, M.; Weigel, T.; Leisegang, T.; Meyer, D.C. How to measure the pyroelectric coefficient? Appl. Phys. Rev. 2017, 4, 21303. [Google Scholar] [CrossRef]
  13. Huang, H.; Scott, J.F. Ferroelectric Materials for Energy Applications; Wiley: Hoboken, NJ, USA, 2018. [Google Scholar]
  14. Holeman, B.R. Sinusoidally modulated heat flow and the pyroelectric effect. Infrared Phys. 1972, 12, 125–135. [Google Scholar] [CrossRef]
  15. Chynoweth, A.G. Dynamic Method for Measuring the Pyroelectric Effect with Special Reference to Barium Titanate. J. Appl. Phys. 1956, 27, 78–84. [Google Scholar] [CrossRef]
  16. Garn, L.E.; Sharp, E.J. Use of low-frequency sinusoidal temperature waves to separate pyroelectric currents from nonpyroelectric currents. Part I. Theory. J. Appl. Phys. 1982, 53, 8974–8979. [Google Scholar] [CrossRef]
  17. Blevin, W.R.; Brown, W.J. Black Coatings for Absolute Radiometers. Metrologia 1966, 2, 139–143. [Google Scholar] [CrossRef]
  18. Lehman, J.; Sanders, A.; Hanssen, L.; Wilthan, B.; Zeng, J.; Jensen, C. Very Black Infrared Detector from Vertically Aligned Carbon Nanotubes and Electric-Field Poling of Lithium Tantalate. Nano Lett. 2010, 10, 3261–3266. [Google Scholar] [CrossRef] [PubMed]
  19. Peterson, R.L.; Day, G.W.; Gruzensky, P.M.; Phelan, R.J., Jr. Analysis of response of pyroelectric optical detectors. J. Appl. Phys. 1974, 45, 3296. [Google Scholar] [CrossRef]
  20. Yao, S.; Wang, J.; Liu, H.; Hu, X.; Zhang, H.; Cheng, X.; Ling, Z. Growth, optical and thermal properties of near-stoichiometric LiNbO3 single crystal. J. Alloys Compd. 2008, 455, 501–505. [Google Scholar] [CrossRef]
  21. Lang, S.B.; Das-Gupta, D.K. Handbook of Advanced Electronic and Photonic Materials and Devices; Nalwa, H.S., Ed.; Academic Press: San Diego, CA, USA, 2001; Volume 4, p. 1. [Google Scholar]
  22. Savage, A. Pyroelectricity and Spontaneous Polarization in LiNbO3. J. Appl. Phys. 1966, 37, 3071–3072. [Google Scholar] [CrossRef]
  23. Glass, A.M.; Lines, M.E. Low-temperature behavior of spontaneous polarization in LiNbO3 and LiTaO3. Phys. Rev. B 1976, 13, 180–191. [Google Scholar] [CrossRef]
  24. Barbosa, P.C.; de Paiva, J.A.C.; Filho, J.M.; Hernandes, A.C.; Andreeta, J.P.; Sombra, A.S.B. Dielectric Relaxation Process and Pyroelectric Currents in LiNbO3: Fe Single Crystals. Phys. Stat. Sol. 1991, 125, 723–729. [Google Scholar] [CrossRef]
  25. Bartholomäus, T.; Buse, K.; Deuper, C.; Krätzig, E. Pyroelectric coefficients of LiNbO3 crystals of different compositions. Phys. Stat. Sol. 1994, 142, K55–K57. [Google Scholar] [CrossRef]
  26. Newnham, R.E. Properties of Materials: Anisotropy, Symmetry, Structure; Oxford University Press: New York, NY, USA, 2005. [Google Scholar]
  27. Popescu, S.T.; Petris, A.; Vlad, V.I. Interferometric measurement of the pyroelectric coefficient in lithium niobate. J. Appl. Phys. 2013, 113, 43101. [Google Scholar] [CrossRef] [Green Version]
  28. Blumm, J.; Lindemann, A. Characterization of the thermophysical properties of molten polymers and liquids using the flash technique. High Temp. High Press 2003, 35, 627. [Google Scholar] [CrossRef] [Green Version]
Figure 1. The setup of the temperature-modulated measurement of pyroelectricity. The standard sample with in-plane electric polarization is coated with a light-absorbing layer on the front surface. A pair of conductive-paste electrodes are attached to the crystal edges to collect the pyroelectric signal. The sample suspended upside down in the IC socket by the gold leads is irradiated through the hole in the sample holder and the base plate.
Crystals 11 00880 g001
Figure 2. Frequency dependence of the pyroelectricity of LiNbO3 measured using the temperature modulation method. The upper left inset is the photograph of the front surface of the sample coated with the light-absorbing layer. The inset in the center sketches the experimental layout.
Crystals 11 00880 g002
Figure 3. (a) Schematic drawing of temperature distribution in the single-layer model heated with a modulated light in heat exchange gas. The distribution is assumed to be a single damped wave with a time-independent temperature shift by omitting the presence of a reverse wave. (b,c) The magnitude of pyroelectricity and the phase shift from the oscillation of the irradiated light calculated using the single-layer model. The physical parameters of LiNbO3 used in the calculation are listed in Table 1.
Crystals 11 00880 g003
Figure 4. Comparisons between the observed pyroelectricity of the LiNbO3 sample and the results of the single-layer model calculation plotted as a function of the temperature-modulation frequency. Four panels (ad) show the dependence on h , κ , d , and α , respectively. Light intensity irradiated to the sample i 0 was 1.6 mW/mm2, estimated from the difference of light entering and exiting the cryostat. Physical quantities for LiNbO3 other than the parameter selected as the variable in each plot are listed in Table 1.
Crystals 11 00880 g004
Figure 5. (a) Schematic diagram of the temperature distribution of a two-layer model heated by modulated light in a heat exchange gas. The distribution is represented as a two-step decaying wave, in which the presence of the inverse wave and time-independent terms are omitted. (b,c) Comparison between the experimental data and the simulated pyroelectricity and the phase shift calculated using the two-layer model.
Crystals 11 00880 g005
Figure 6. Comparisons between the observed pyroelectricity of LiNbO3 and the results of the two-layer model calculation plotted as a function of the temperature-modulation frequency. Panels (a) and (b) show the dependence on κ abs and d abs , respectively. In the calculations, c abs and ρ abs are supposed as 1.4   J / gK and 0.76   g / cm 3 , respectively. In (b), κ abs is assumed as 0.16   mm 2 / s .
Crystals 11 00880 g006
Table 1. Physical quantities for LiNbO3 and heat transfer coefficient between He gas and the sample used in the simulations.
LiNbO3Heat Transfer
c   ( J / g K ) ρ   ( g / c m 3 ) κ   ( m m 2 / s ) α   ( μ C / m 2 K ) d   ( μ m ) w   ( m m ) h   ( W / m 2 K )
0.601 14.659 11.264 183 21000.57500 3
1 [20]; 2 [21]; 3 present work.
Publisher’s Note: MDPI stays neutral with regard to jurisdictional claims in published maps and institutional affiliations.

