
The Effects of Li+ Doping on Structure and Upconversion Luminescent Properties for Bi3.46Ho0.04Yb0.5Ti3O12: xLi Phosphors


Abstract
:1. Introduction
2. Experiment
3. Results and Discussion
4. Conclusions
Author Contributions
Funding
Data Availability Statement
Acknowledgments
Conflicts of Interest
Appendix A


References
- Meng, Z.; Zhang, S.; Wu, S. Power density dependent upconversion properties of NaYbF4: Er3+@NaYbF4: Tm3+@NaYF4 nanoparticles and their application in white–light emission LED. J. Lumin. 2020, 227, 117566. [Google Scholar] [CrossRef]
- Shin, J.; Kyhm, J.H.; Hong, A.R.; Song, J.D.; Lee, K.; Ko, H.; Jang, H.S. Multicolor tunable upconversion luminescence from sensitized seed–mediated grown LiGdF4: Yb, Tm–based core/triple–shell nanophosphors for transparent displays. Chem. Mater. 2018, 30, 8457–8464. [Google Scholar] [CrossRef]
- Lim, C.; Aleksandrovsky, A.; Atuchin, V.; Molokeev, M.; Oreshonkov, A. Microwave–employed sol–gel synthesis of scheelite–type microcrystalline AgGd(MoO4)2:Yb3+/Ho3+ upconversion yellow phosphors and their spectroscopic properties. Crystals 2020, 10, 1000. [Google Scholar]
- Tang, Z.; Han, W.; Huang, Z.; Qi, J.; Zhang, Y.; Yi, J.; Yuan, J.; Lu, T. Near–infrared luminescent properties of Ln: LaGdZr2O7 (Ln = Nd, Yb) transparent ceramics for solid–state laser applications. Ceram. Int. 2020, 46, 22270–22275. [Google Scholar] [CrossRef]
- Oppo, C.I.; Corpino, R.; Ricci, P.C.; Paul, M.C.; Das, S.; Pal, M.; Bhadra, S.K.; Yoo, S.; Kalita, M.P.; Boyland, A.J.; et al. Incorporation of Yb3+ ions in multicomponent phase–separated fibre glass preforms. Opt. Mater. 2011, 34, 660–664. [Google Scholar] [CrossRef]
- Badge, S.K.; Deshpande, A.V. Study of dielectric and ferroelectric properties of bismuth titanate (Bi4Ti3O12) ceramic prepared by sol–gel synthesis and solid state reaction method with varying sintering temperature. Solid. State. Ion. 2019, 334, 21–28. [Google Scholar] [CrossRef]
- Xie, X.; Wang, T.; Zhou, Z.; Cheng, G.; Liang, R.; Dong, X. Enhanced piezoelectric properties and temperature stability of Bi4Ti3O12–based Aurivillius ceramics via W./Nb substitution. J. Eur. Ceram. Soc. 2019, 39, 957–962. [Google Scholar] [CrossRef]
- Yang, Z.; Yan, L.; Yan, D.; Song, Z.; Zhou, D.; Yin, Z.; Qiu, J.; Chen, G. Color tunable upconversion emission in Yb, Er co–doped bismuth titanate inverse opal. J. Am. Ceram. Soc. 2011, 94, 2308–2310. [Google Scholar] [CrossRef]
- Gao, F.; Liu, H.F.; Ren, F.; Wang, K.T.; Li, X.S.; Wang, Y.B.; He, C.; Wei, Y.Z. Tunable structure and intensive upconversion photoluminescence for Ho3+–Yb3+ codoped bismuth titanate composite synthesized by sol–gel–combustion (SGC) method. Ceram. Int. 2019, 46, 3015–3022. [Google Scholar] [CrossRef]
- Gao, F.; Zhou, H.; Wu, G.H.; Qin, N.; Bao, D.H. Combination of strong blue up–conversion photoluminescence and greatly enhanced ferroelectric polarization in Tm3+–Yb3+–W6+– doped Bi4Ti3O12 thin films. J. Electrochem. Soc. 2011, 158, G128–G131. [Google Scholar] [CrossRef]
- Huang, H.; Liang, X.; Wang, Z.; Wang, P.; Zheng, Z.; Liu, Y.; Zhang, X.; Qin, X.; Dai, Y.; Huang, B. Bi20TiO32 nanoparticles doped with Yb3+ and Er3+ as UV, visible, and near–infrared responsive photocatalysts. ACS Appl. Nano Mater. 2019, 2, 5381–5388. [Google Scholar] [CrossRef]
- Bokolia, R.; Mondal, M.; Rai, V.K.; Sreenivas, K. Enhanced infrared–to–visible up–conversion emission and temperature sensitivity in (Er3+, Yb3+, and W6+) tri–doped Bi4Ti3O12 ferroelectric oxide. J. Appl. Phys. 2017, 121, 084101. [Google Scholar] [CrossRef]
- Xiang, G.; Liu, X.; Xia, Q.; Liu, X.; Xu, S.; Jiang, S.; Zhou, X.; Li, L.; Wu, D.; Ma, L.; et al. Design of a bi–functional NaScF4: Yb3+/Er3+ nanoparticles for deep–tissue bioimaging and optical thermometry through Mn2+ doping. Talanta 2021, 224, 121832. [Google Scholar] [CrossRef]
- Chung, J.H.; Ryu, J.H.; Eun, J.W.; Lee, J.H.; Lee, S.Y.; Heo, T.H.; Shim, K.B. High enhancement of green upconversion luminescence of Li+/Er3+/Yb3+ tri–doped CaMoO4. Mater. Chem. Phys. 2012, 134, 695–699. [Google Scholar] [CrossRef]
- Jia, Y.; Song, Y.; Bai, Y.; Wang, Y. Upconverted photoluminescence in Ho3+ and Yb3+ codoped Gd2O3 nanocrystals with and without Li+ ions. Luminescence 2011, 26, 259–263. [Google Scholar] [CrossRef] [PubMed]
- Yi, S.S.; Shim, K.S.; Yang, H.K.; Moon, B.K.; Choi, B.C.; Jeong, J.H.; Kim, J.H.; Bae, J.S. Improved cathodoluminescent characteristics of Y2O3: Eu3+ thin films by Li–doping. Appl. Phys. A 2007, 87, 667–671. [Google Scholar] [CrossRef]
- Jung, G.W.; Park, K. Effect of monovalent charge compensators on the photoluminescence properties of Ca3(PO4)2: Tb3+, A+ (A = Li, Na, K) phosphors. J. Mater. Sci. Technol. 2021, 82, 187–196. [Google Scholar] [CrossRef]
- Mao, C.; Yang, X.; Zhao, L. Simultaneous morphology control and upconversion fluorescence enhancement of NaYF4: Yb, Er crystals through alkali ions doping. Chem. Eng. J. 2013, 229, 429–435. [Google Scholar] [CrossRef]
- Jin, D.; Yang, J.; Miao, X.; Wang, L.; Guo, S.; Wang, N.; Wang, L. Highly enhanced photoluminescence of YBO3:Eu3+ micro–spheres by co–adding Li ion and alkaline−earth metal ions. Mater. Lett. 2012, 79, 225–228. [Google Scholar] [CrossRef]
- Gao, F.; Zhang, Q.; Ding, G.; Qin, N.; Bao, D. Strong upconversion photoluminescence and large ferroelectric polarization in Er3+−Yb3+−W6+ triply substituted bismuth titanate thin films prepared by chemical solution deposition. J. Am. Ceram. Soc. 2011, 94, 3867–3870. [Google Scholar] [CrossRef]
- Dong, M.; Li, X.; Chi, F.; Wei, X.; Yin, M.; Chen, Y. Trivalent Yb/Ho/Ce tri–doped core/shell NaYF4 nanoparticles for tunable upconversion luminescence from green to red. J. Rare. Earth 2017, 35, 629–636. [Google Scholar] [CrossRef]
- Bordj, S.; Satha, H.; Barros, A.; Zambon, D.; Jouart, J.P.; Diaf, M.; Mahiou, R. Spectroscopic characterization by up conversion of Ho3+/Yb3+ codoped CdF2 single crystal. Opt. Mater. 2021, 118, 111249. [Google Scholar] [CrossRef]
- Ramana, E.V.; Prasad, N.V.; Tobaldi, D.M.; Zavašnik, J.; Singh, M.K.; Hortigüela, M.J.; Seabra, M.P.; Prasad, G.; Valente, M.A. Effect of samarium and vanadium co–doping on structure, ferroelectric and photocatalytic properties of bismuth titanate. RSC. Adv. 2017, 7, 9680–9692. [Google Scholar] [CrossRef] [Green Version]
- Lu, B.X.; Chen, K.; Wang, W.L.; Jiang, B.B. Effects of Li2O and Na2O on the crystallization behavior of lime–alumina–based mold flux for casting high–Al steels. Metall. Mater. Trans. B 2014, 4, 1496–1509. [Google Scholar] [CrossRef]
- Oberžan, M.; Holc, J.; Buh, M.; Kuščer, D.; Lavrač, I.; Kosec, M. High–alumina porcelain with the addition of a Li2O–bearing fluxing agent. J. Eur. Ceram. Soc. 2009, 29, 2143–2152. [Google Scholar] [CrossRef]
- Hedden, D.B.; Torardi, C.C.; Zegarski, W. M’– RTaO4 Synthesis: Activation of the precursor oxides by the reaction flux. J. Solid. State. Chem. 1995, 118, 419–421. [Google Scholar] [CrossRef]
- Zhang, Y.; Chen, Z.; Lu, Z. A facile method for the preparation of colored Bi4Ti3O12–x nanosheets with enhanced visible–light photocatalytic hydrogen evolution activity. Nanomaterials 2018, 8, 261. [Google Scholar] [CrossRef] [Green Version]
- Chen, Y.; Yang, B.; Zhou, Y.; Wu, Y.; Zhu, H. Evaluation of pitting corrosion in duplex stainless steel Fe20Cr9Ni for nuclear power application. Acta. Mater. 2020, 197, 172–183. [Google Scholar] [CrossRef]
- Liang, J.; Zhu, G.; Liu, P.; Luo, X.; Tan, C.; Jin, L.; Zhou, J. Synthesis and characterization of Fe−doped β−Bi2O3 porous microspheres with enhanced visible light photocatalytic activity. Acta Mater. 2014, 72, 272–282. [Google Scholar] [CrossRef]
- Chang, M.J.; Cui, W.N.; Liu, J.; Wang, K.; Du, H.L.; Qiu, L.; Fan, S.M.; Luo, Z.M. Construction of novel TiO2/Bi4Ti3O12/MoS2 core/shell nanofibers for enhanced visible light photocatalysis. J. Mater. Sci. Technol. 2020, 36, 97–105. [Google Scholar] [CrossRef]
- Zhao, X.; Yang, H.; Cui, Z.; Wang, X.; Yi, Z. Growth process and CQDs−modified Bi4Ti3O12 square plates with enhanced photocatalytic performance. Micromachines 2019, 10, 66. [Google Scholar] [CrossRef] [Green Version]
- Ragin, T.; Baranowska, A.; Kochanowicz, M.; Zmojda, J.; Miluski, P.; Dorosz, D. Study of mid–infrared emission and structural properties of heavy metal oxide glass and optical fibre co–doped with Ho3+/Yb3+ Ions. Materials 2019, 12, 1238. [Google Scholar] [CrossRef] [Green Version]
- Pang, T.; Jian, R.H.; Xie, J.P.; Lu, W.H. Up–conversion luminescence and photo–thermal effect of KY3F10: Yb3+, Ho3+ nanocrystals. J. Phys. D Appl. Phys. 2018, 51, 355301. [Google Scholar] [CrossRef]
- Liu, F.; Deng, D.; Wu, M.; Chen, B.; Zhou, L.; Xu, S. Luminescent and thermometric properties of dual emitting Eu2+/Sm3+ co–doped Sr4La(PO4)3O phosphor based on energy transfer. J. Rare. Earth 2021, 39, 261–268. [Google Scholar] [CrossRef]
- Jiao, M.; Xu, Q.; Zhao, Y.; Wang, D.; Liu, L.; Yang, C. Photoluminescence properties and energy transfer of high thermal stable Na2GdPO4F2: RE (RE = Sm3+, Ce3+, Tb3+) phosphor for solid−state lighting. J. Lumin. 2020, 226, 117388. [Google Scholar] [CrossRef]
- Park, K.; Hakeem, D.A.; Pi, J.W.; Kim, S.W. Improvement of photoluminescence properties of Ce3+—doped CaSrAl2SiO7 phosphors by charge compensation with Li+ and Na+. Ceram. Int. 2018, 44, 1929–1934. [Google Scholar] [CrossRef]
- Park, K.; Hakeem, D.A.; Pi, J.W.; Jung, G.W. Emission enhancement of Eu3+–doped ZnO by adding charge compensators. J. Alloys Compd. 2019, 772, 1040–1051. [Google Scholar] [CrossRef]
- Guo, L.; Wang, Y.; Wang, Y.; Zhang, J.; Dong, P.; Zeng, W. Structure, enhancement and white luminescence of multifunctional Lu6O5F8: 20% Yb3+, 1% Er3+(Tm3+) nanoparticles via further doping with Li+ under different excitation sources. Nanoscale 2013, 5, 2491–2504. [Google Scholar] [CrossRef] [PubMed]
- Halubek, G.K.; Szymanski, D.; Tran, T.; Ferrari, M.; Lukowiak, A. Upconversion luminescence of silica–calcia nanoparticles co–doped with Tm3+ and Yb3+ Ions. Materials 2021, 14, 937. [Google Scholar] [CrossRef]
- Bai, Z.H.; Lin, H.; Imakita, K.; Montazami, R.; Fujii, M.; Hashemi, N. Synthesis of Er3+/Yb3+ codoped NaMnF3 nanocubes with single–band red upconversion luminescence. Rsc. Advances 2014, 4, 61891. [Google Scholar] [CrossRef] [Green Version]
- Pollnau, M.; Gamelin, D.R.; Lüthi, S.R.; Güdel, H.U.; Hehlen, M.P. Power dependence of upconversion luminescence in lanthanide and transition–metal–ion systems. Phys. Rev. B 2000, 61, 3337–3346. [Google Scholar] [CrossRef]
- Manoj, K.M.; Tristan, K.; Tanusree, M.; Christoph, B.; Kaushal., K.; Vineet, K.R.; Hans, H.; Ulrich, V. Incorporation of Zn2+ ions into BaTiO3: Er3+/Yb3+ nanophosphor: An effective way to enhance upconversion, defect luminescence and temperature sensing. Phys. Chem. Chem. Phys. 2015, 17, 20741. [Google Scholar]
- Zhang, J.; Jin, C. Electronic structure, upconversion luminescence and optical temperature sensing behavior of Yb3+–Er3+/Ho3+ doped NaLaMgWO6. J. Alloys Compd. 2018, 783, 84–94. [Google Scholar] [CrossRef]
- Zhang, T.; Yu, L.; Wang, J.; Wu, J. Microstructure and upconversion luminescence of Yb3+ and Ho3+ co−doped BST thick films. J. Mater. Sci. 2010, 45, 6819–6823. [Google Scholar] [CrossRef]
- Vishwakarma, P.K.; Rai, S.B.; Bahadur, A. Intense red and green emissions from Ho3+/Yb3+ co–doped sodium gadolinium molybdate nano–phosphor: Effect of calcination temperature and Intrinsic optical bistability. Mater. Res. Bull. 2021, 133, 111041. [Google Scholar] [CrossRef]


| Sample No. | Sample Names | CN (mol%) | CP (mol%) | CD (mol%) | ηD (%) |
|---|---|---|---|---|---|
| 1 | BHYTO: 0.02Li | 2 | 2.2 | 1.70 | 77.27 |
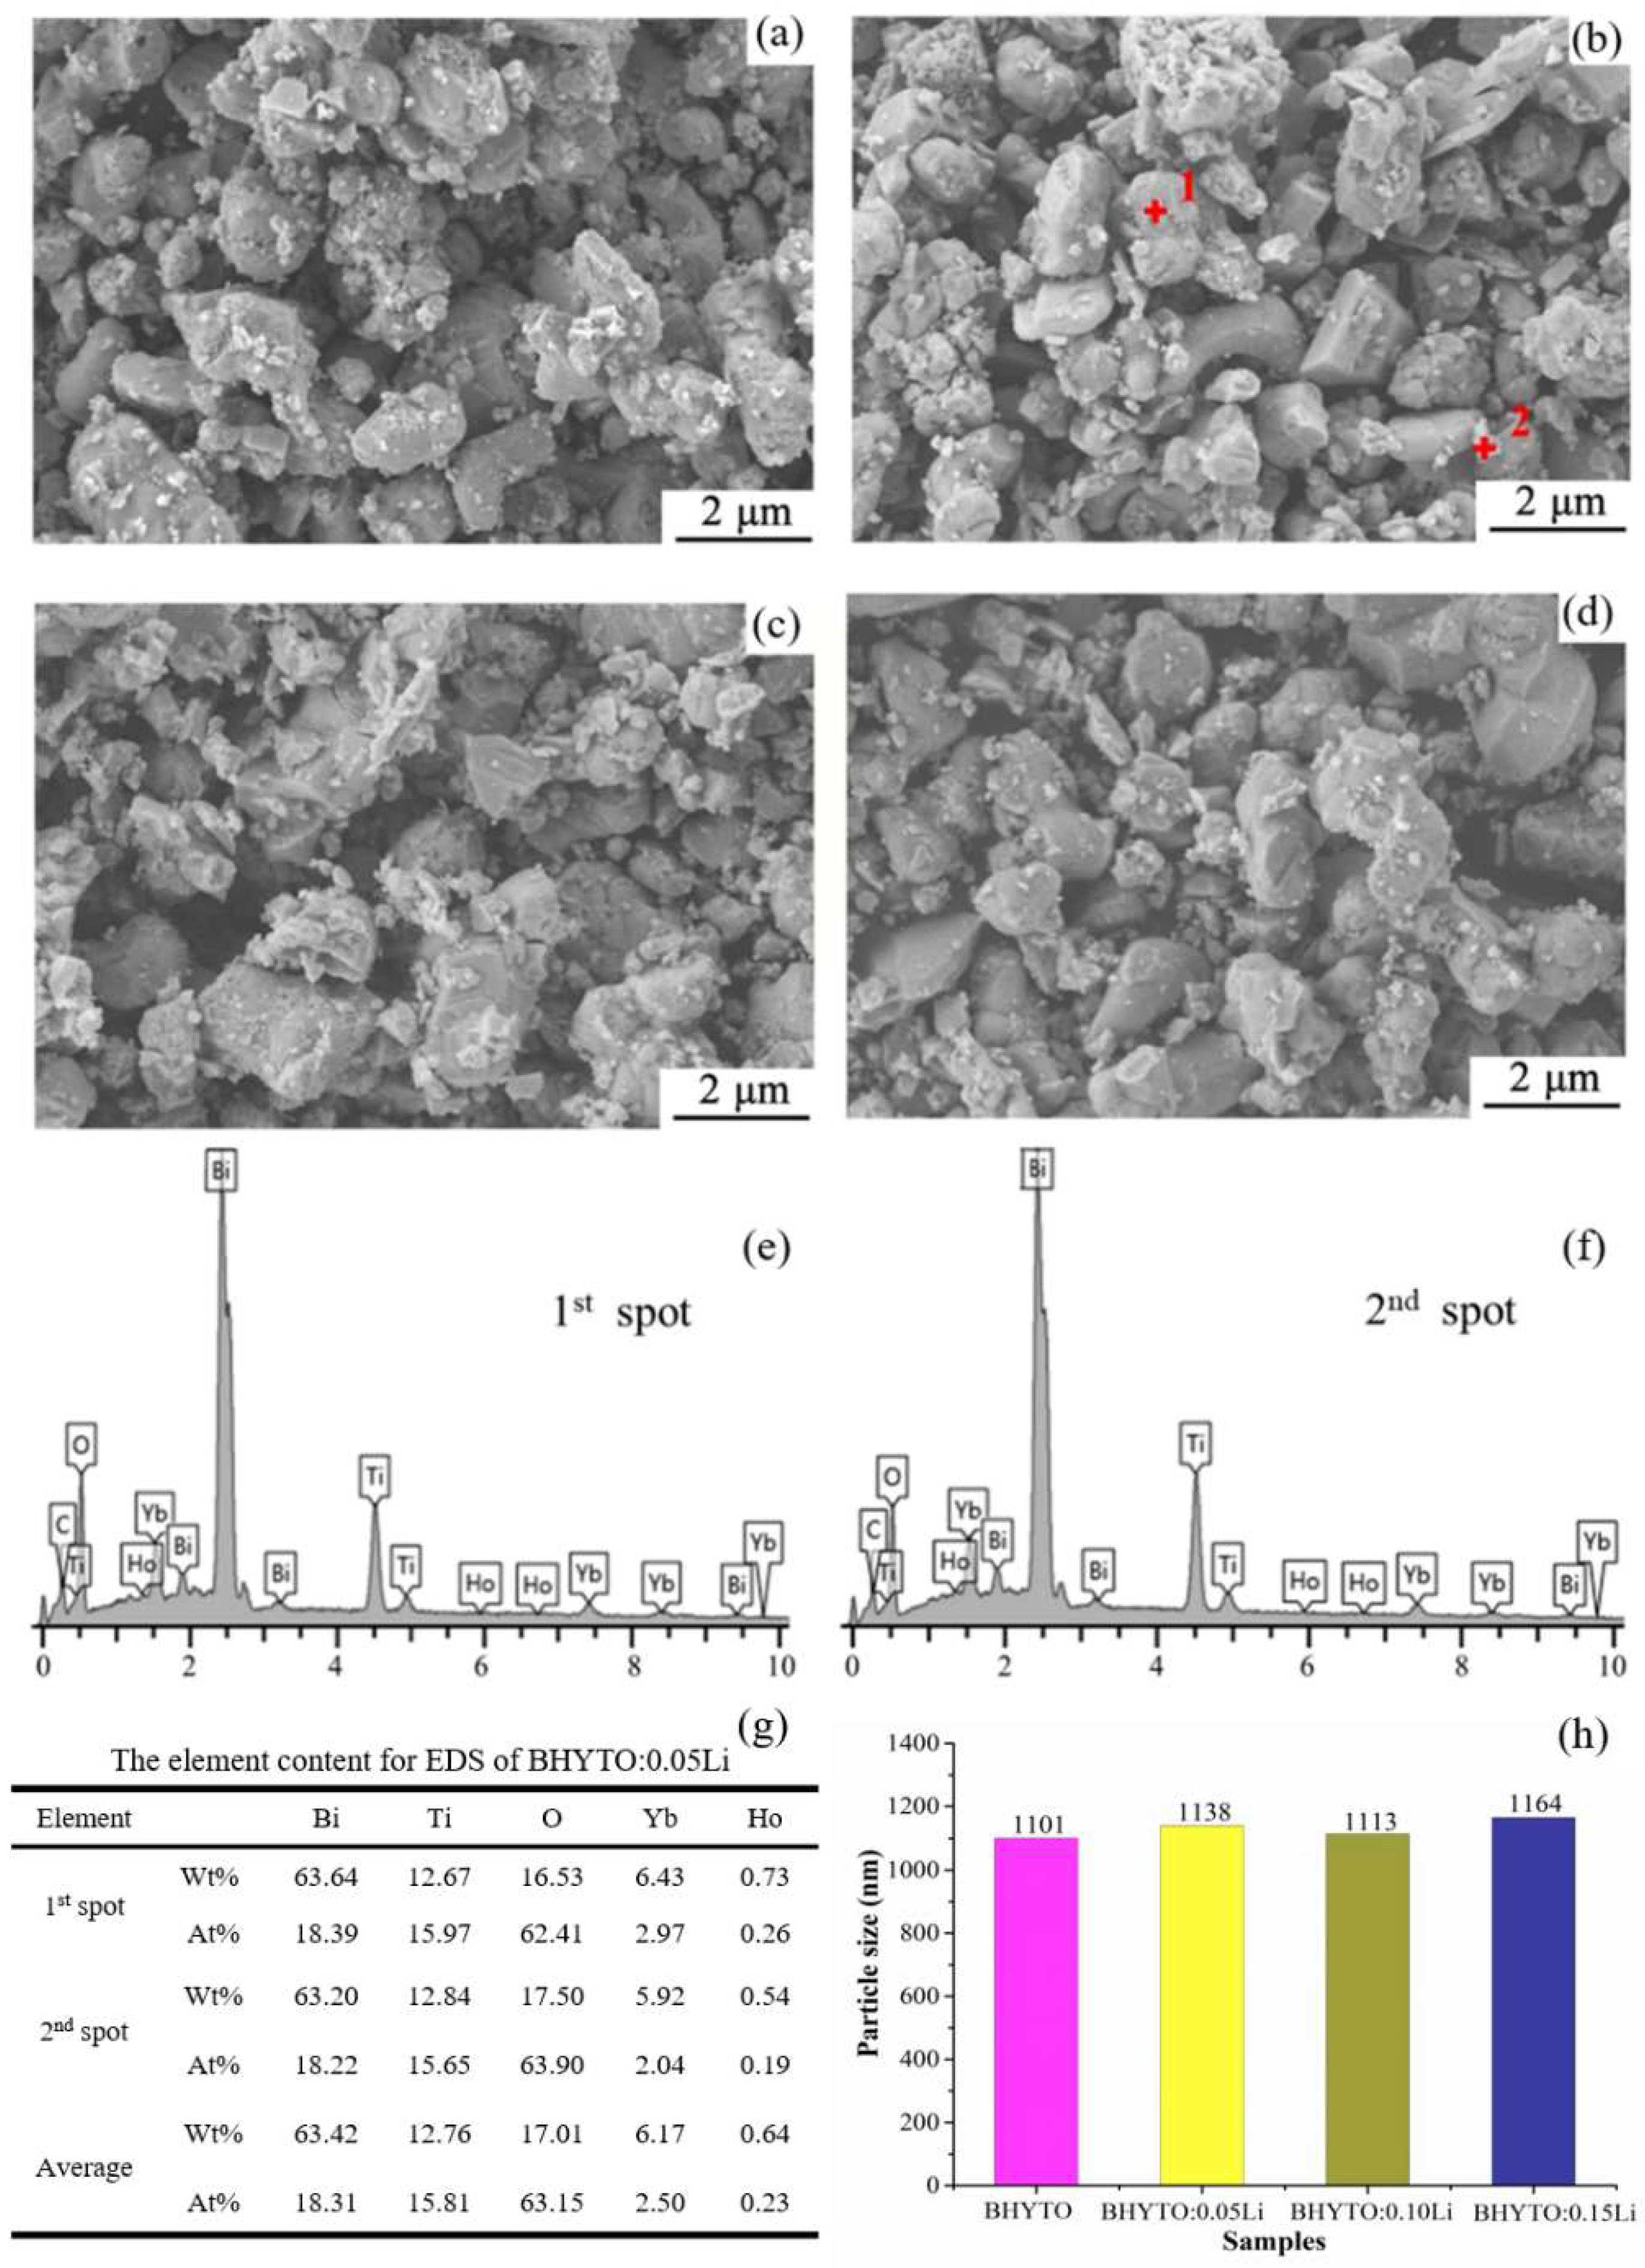
| 2 | BHYTO: 0.05Li | 5 | 5.5 | 4.88 | 88.73 |
| 3 | BHYTO: 0.10Li | 10 | 11 | 9.92 | 90.18 |
| 4 | BHYTO: 0.15Li | 15 | 16.5 | 14.93 | 90.48 |
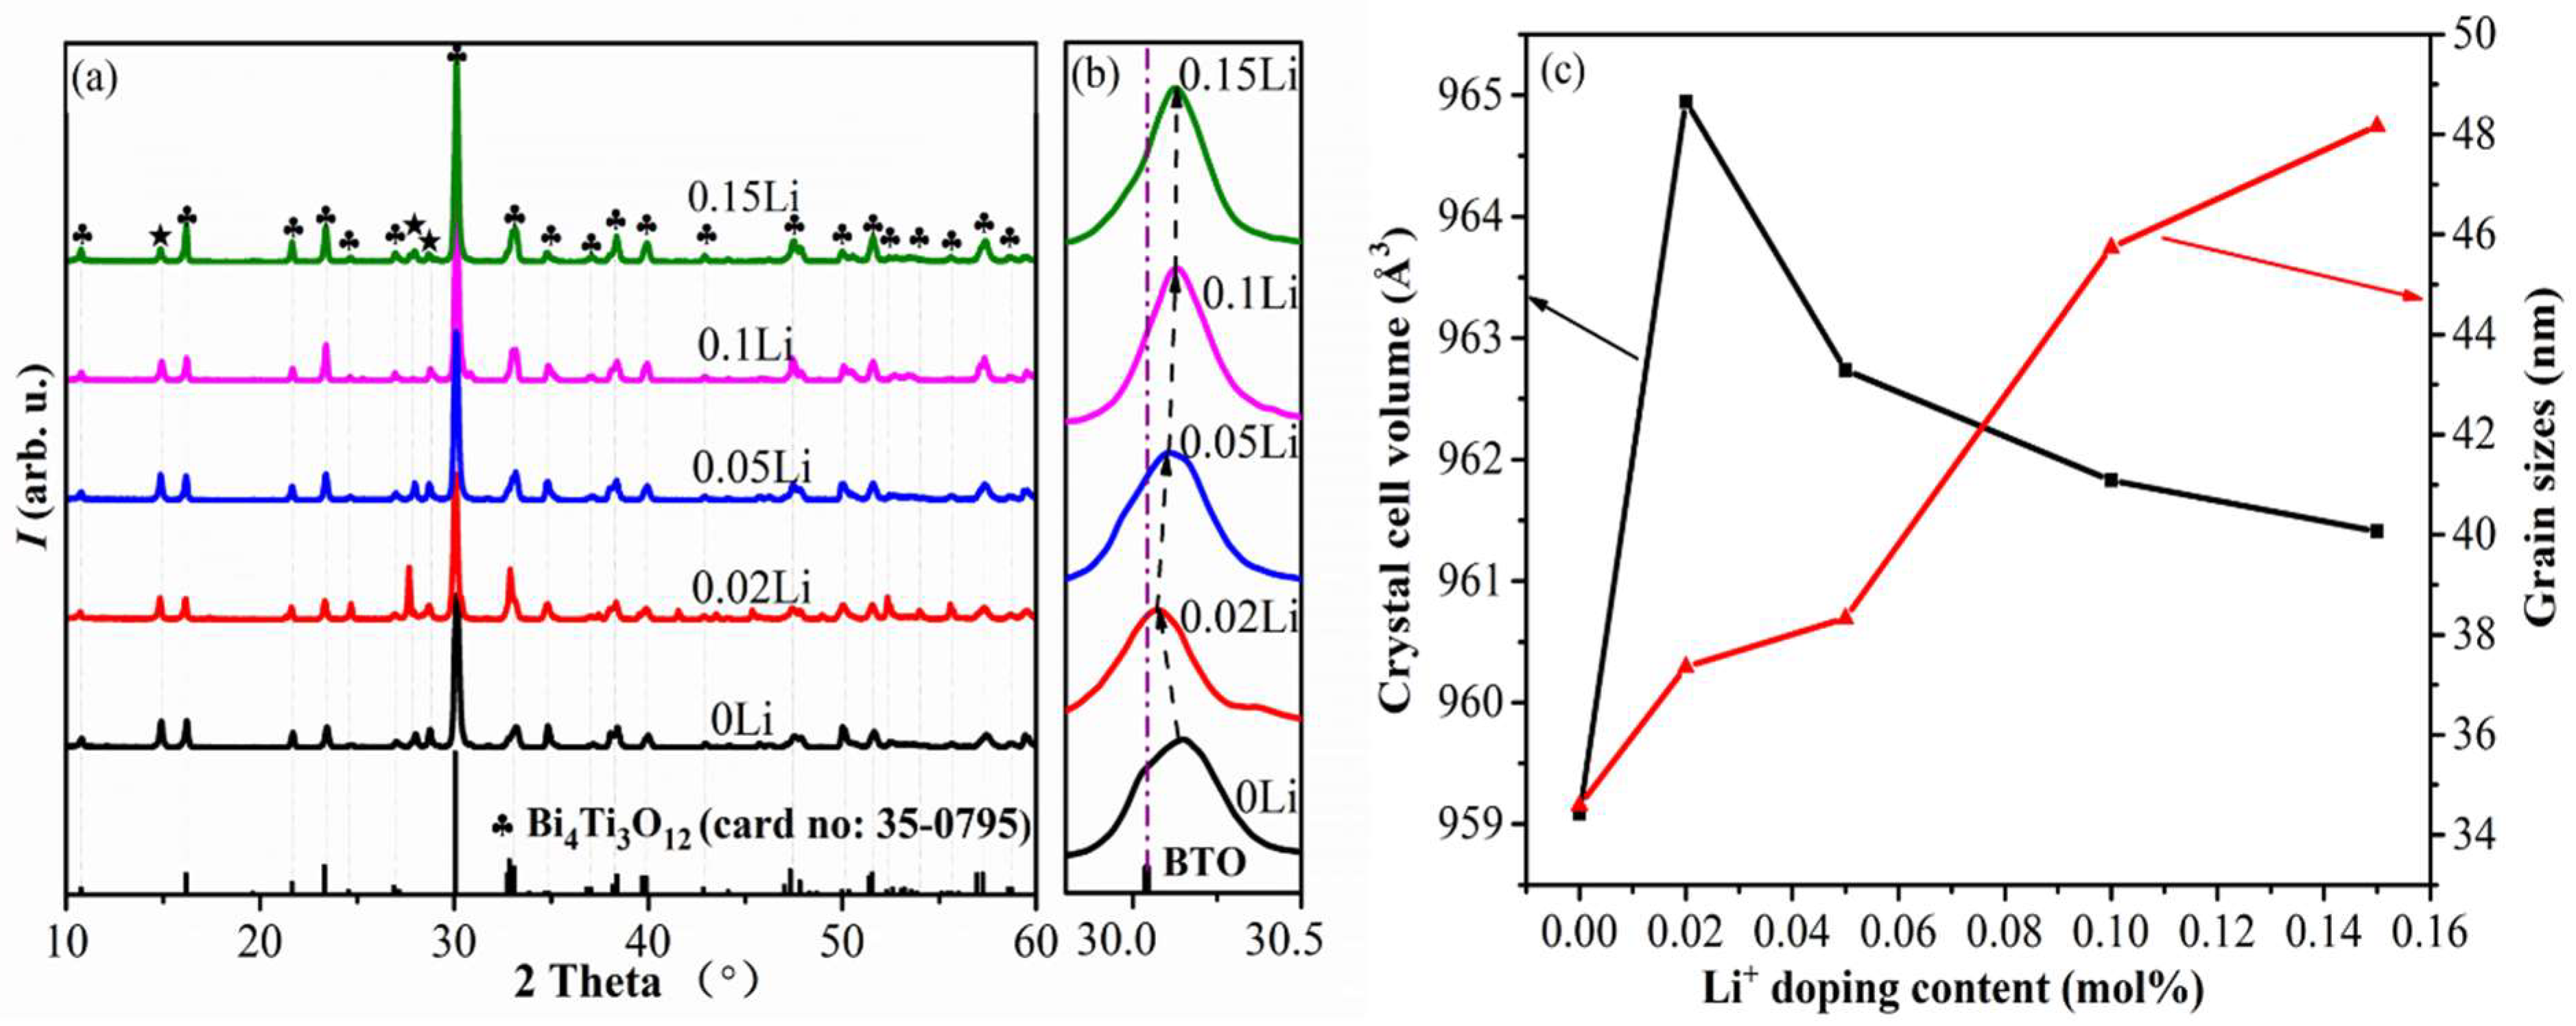
| Sample Names | a (Å) | b (Å) | c (Å) | FWHM (°/rad) |
|---|---|---|---|---|
| BHYTO:0Li | 5.3930 | 5.4229 | 32.7941 | 0.263/0.00459 |
| BHYTO:0.02Li | 5.4081 | 5.4367 | 32.8188 | 0.243/0.00424 |
| BHYTO:0.05Li | 5.4011 | 5.4298 | 32.8278 | 0.237/0.00414 |
| BHYTO:0.1Li | 5.4035 | 5.4266 | 32.8016 | 0.199/0.00347 |
| BHYTO:0.15Li | 5.3993 | 5.4251 | 32.8219 | 0.189/0.00330 |
Publisher’s Note: MDPI stays neutral with regard to jurisdictional claims in published maps and institutional affiliations. |
© 2021 by the authors. Licensee MDPI, Basel, Switzerland. This article is an open access article distributed under the terms and conditions of the Creative Commons Attribution (CC BY) license (https://creativecommons.org/licenses/by/4.0/).
Share and Cite
Ren, F.; Zhou, J.; Wang, D.; Wang, X.; Gao, F. The Effects of Li+ Doping on Structure and Upconversion Luminescent Properties for Bi3.46Ho0.04Yb0.5Ti3O12: xLi Phosphors. Crystals 2021, 11, 1220. https://0-doi-org.brum.beds.ac.uk/10.3390/cryst11101220
Ren F, Zhou J, Wang D, Wang X, Gao F. The Effects of Li+ Doping on Structure and Upconversion Luminescent Properties for Bi3.46Ho0.04Yb0.5Ti3O12: xLi Phosphors. Crystals. 2021; 11(10):1220. https://0-doi-org.brum.beds.ac.uk/10.3390/cryst11101220
Chicago/Turabian StyleRen, Feng, Jinlei Zhou, Dengpeng Wang, Xianran Wang, and Feng Gao. 2021. "The Effects of Li+ Doping on Structure and Upconversion Luminescent Properties for Bi3.46Ho0.04Yb0.5Ti3O12: xLi Phosphors" Crystals 11, no. 10: 1220. https://0-doi-org.brum.beds.ac.uk/10.3390/cryst11101220