1. Introduction
Trimanganese tetraoxide is the chemical compound with the formula Mn
3O
4. It is also known as hausmannite [
1]. Hausmannite belongs to a group of the Mn
2+Mn
23+O
4 oxides. These oxides include Mn(II) and Mn(III) in a tetragonal crystal. Hausmannite is a stable mineral due to its crystal structure [
2].
Hausmannite has a lot of applications in the industry. The application of hausmannite depends on the purity and granulometric fraction of the sample. As an example, a high disperse hausmannite can be used in steel production as an alloying additive [
3]. This alloying additive is used to slow down the corrosion processes in metals. Anticorrosive compounds containing Mn
3O
4 form a thin layer on the metal surface and improve its resistance to different agents such as water, air and other chemical compounds. Hausmannite also can be used as a colorant, a nonmetallic paint or varnish [
4].This treatment is highly effective especially on the metals initial damage stage [
5].
The wide range of hausmannite applications can be seen in various scientific publications. For instance Mn
3O
4 was used as a catalytic agent [
6], as an active component of filters [
7], as a component for electrodes [
8,
9,
10,
11], and as a water purification material [
12]. At the same time this chemical element shows antibacterial [
13], photocatalytic [
13,
14], electrochemical [
15,
16] and magnetic [
17,
18] properties.
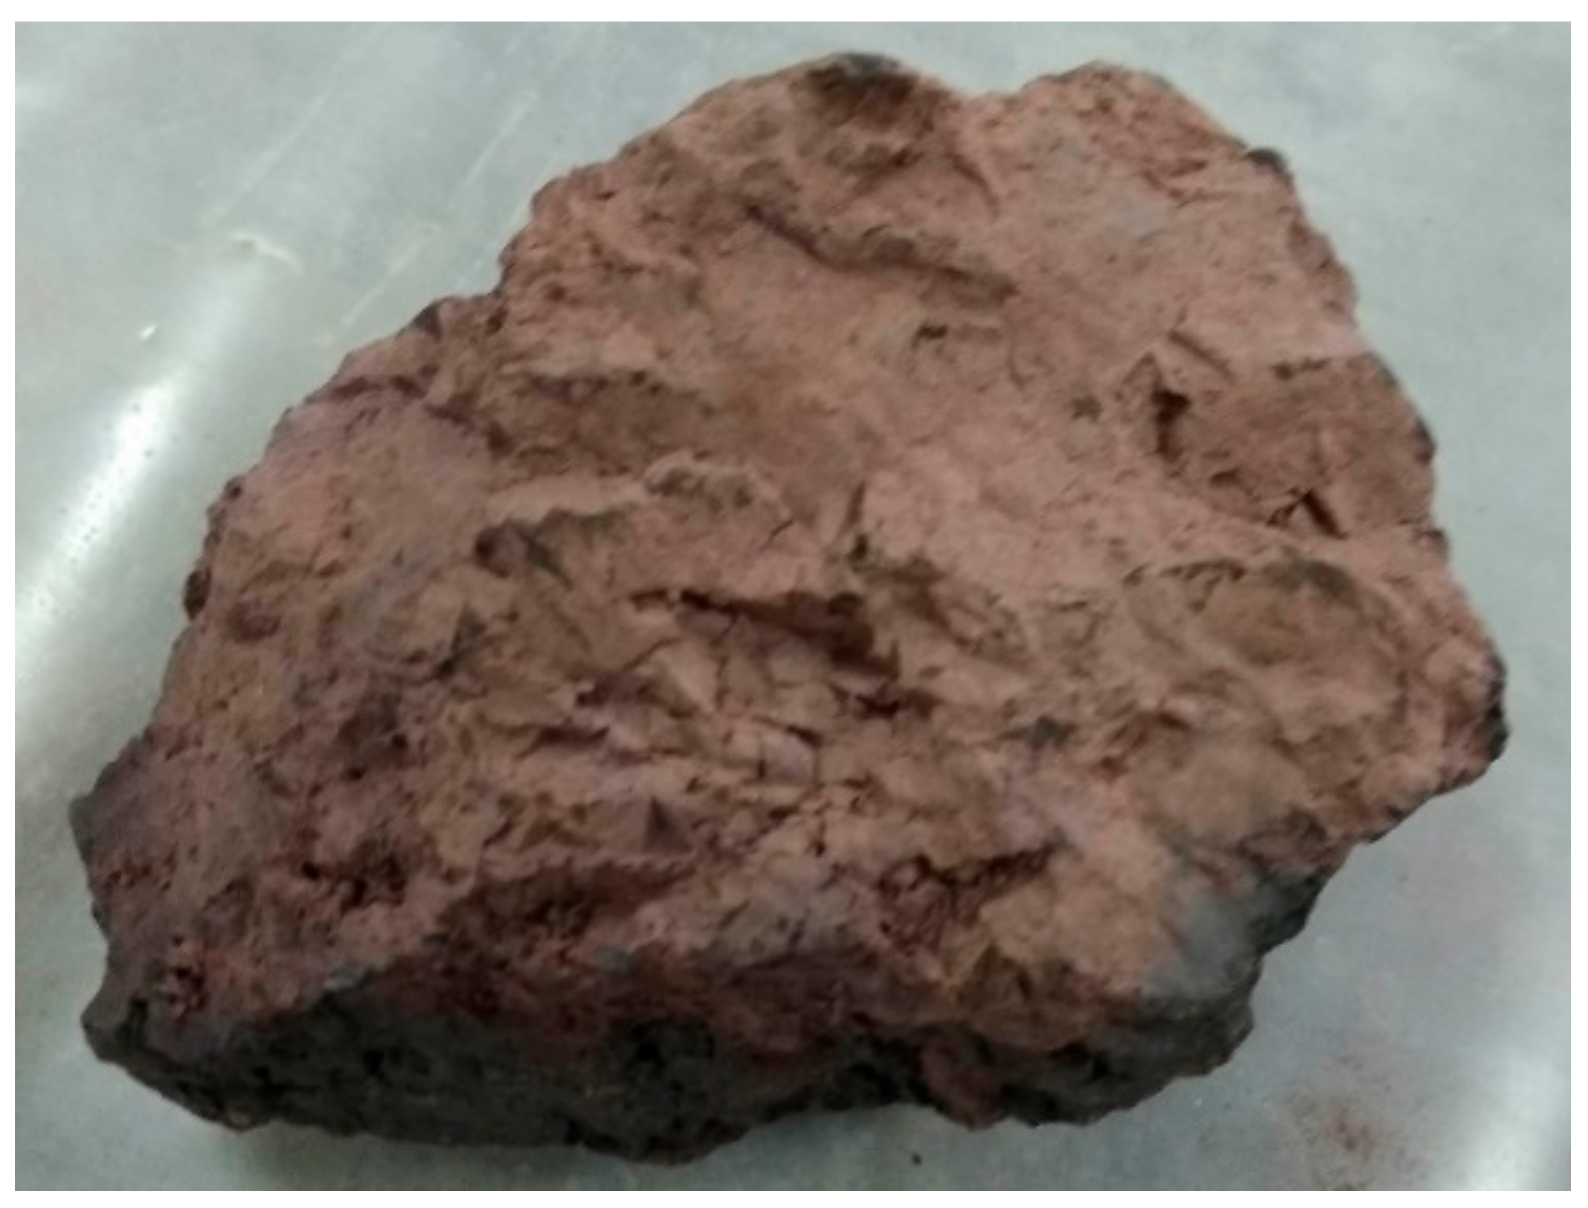
Hausmannite is widely used for staining of ceramic products from red or white calcined clay, which can be used at high temperatures of 800–1200 °C. It is also used as a colorant to produce light brown, brown, as well dark brown ceramic products such as tiles and bricks. A distinctive feature of Mn colorants of high quality is high content of Mn, homogeneity, low dust formation, and high level of quality.
Different ways of laboratory hausmannite production are described in scientific articles. The nano-sized Mn
3O
4 can be prepared by applying two main methods: “bottom-up” and “top-down”. The bottom-up method is applied when nanostructures are assembled into an ordered structure as a result of chemical reactions. This method produces a hausmannite of a high purity, therefore it can be used in the fields that require a high precision (electrochemical processes, electrode materials, accumulators, capacitors, conductive materials, etc.). On the other hand Wang [
6] recently presented a bottom-top method for hausmannite synthesis in mild conditions from aqueous solutions. Trimanganese tetraoxide nanoribbon was obtained from the manganese(II) acetate and the potassium hydroxide with the melamine-ethanol-distilled water by reflux and solvothermal methods [
14]. The hausmannite nanoparticles were synthesized by mixing the egg white and the tetrahydrous Mn nitrate with intense stirring [
19]. The Mn
3O
4 particles of nanograin forms, as well coin-like nanospheres, and nanoleaf structures were obtained, using co-precipitation, sol-gel, and hydrothermal processes [
20]. The nanosized hausmannite particles were produced using an easy and steady process with ethylene deep eutectic solvent [
21]. The nanosized particles of trimanganese tetraoxide were synthesized using ultrasound in various environment under mild conditions with no additional components [
22]. The above-mentioned research aimed to synthesize manganese oxide nanoparticles of hausmannite under normal conditions in different media with ultrasonic waves. The process was conducted by applying ultrasound on the manganese(II) acetate in water media. Nanosized particles of high crystallinity with size no more than 4 nm were obtained on the 3rd minute of ultrasonic use [
22]. However, Dhaouadi [
23] invented synthesis of the Mn
3O
4 nanoparticles with novel morphology (lozange) under hydrothermal treatment, using surfactant cetyltetramethylammonium bromide (CTAB) as a templating agent. The obtained material was studied by X-ray diffraction (XRD), transmission electron microscopy (TEM), and impedance spectroscopy. The XRD analysis confirmed the formation of a single-phase in the tetragonal structure without any other impurities. From the results of XRD and TEM, the Mn
3O
4 nanoparticles show good morphology corresponding to nanosize between 40–70 nm [
23]. The ultrafine Mn
3O
4 was obtained from the aqueous MnSO
4 and ammonia under microwave irradiation [
24]. In this research effects of the reaction temperature, pH value and the microwave irradiation time on the manganese content were investigated. Results showed that microwave heating could shorten the reaction time of conversion from the Mn(OH)
2 to the Mn
3O
4 to 30 min at 80 °C and pH value of 10, and the manganese content of trimanganese tetraoxide was 71.53%. Specific surface area was 187 m
2·g
−1 by the Brunauer–Emmett–Teller method (BET). Particle size was in the range of 3–4 μm by scanning electron microscopy (SEM). The magnetic behavior of the sample was determined by Gouy magnetic balance. The calculated unpaired electrons of 4.41 was consistent with the theoretical value of 4.33 [
24].
Above-mentioned methods are expensive and not simple technology-wise. Thus, the raw materials for above mentioned hausmannite synthesis methods are expensive chemical substances. However, the high pureness is not always necessary when using trimanganese tetraoxide as a colorant in the industry of building materials. Moreover, feedstock must be inexpensive and easily accessible. For that case, it is beneficial to develop methods of production the hausmannite from manganese ores. This production goes through the “top-down” method. The formation of nanostructures by the “top-down” route includes processing of macro-objects or structures for a successive decrease in their sizes, up to formation particles with nanometer sizes. This route of the Mn
3O
4 preparation is not common. Only a few research works presenting this way of preparation were published so far. For instance, Lu [
25] used a “top-down” method to prepare the spongy Mn
3O
4. The above-mentioned research work aimed to produce the Mn
3O
4 with high surface area. During this research work effect of the different parameters, such as the heat-treatment temperature, the concentration of formic acid, and the solvothermal time on the morphology and crystallinity of the sample were investigated. The surface area of the samples was also investigated. The XRD was used to characterize the phase and crystallinity of the samples. The morphologies of the samples were investigated using a Hitachi S-4800 field-emission scanning electron microscope (FE-SEM) with a cold field emitter. Energy-dispersive X-ray analysis (EDX) was carried out on a Hitachi S-4800. The TEM was used to observe the morphology and to investigate the crystallographic characteristics of the samples. The BET surface area was measured by a gas adsorption apparatus (AUTOSORB-1-C). The sponge-like Mn
3O
4 structures were prepared by decomposition of manganese formate at 200 °C via a facile “top-down” method. The sponge-like Mn
3O
4 structures were produced with a moderate concentration of formic acid with composed Mn
3O
4 nanocrystals about 20–30 nm and many pores. The morphology of the sponge-like Mn
3O
4 structures was mostly retained from the morphology of manganese formate precursors. The morphology of the sponge-like Mn
3O
4 structures was dependent on the solvothermal process before heat treatment. However, the sponge-like structures’ internal microstructures depended on the heat treatment process [
25]. In 1983 Koga [
26] presented another “top-down” way of obtaining trimanganese tetraoxide. That study aimed to produce the battery-grade active manganese(IV) oxide by thermal decomposition of the manganese(IV) sulfate. The anhydrous manganese(II) sulfate was first decomposed at 1000 °C in the air to form trimanganese tetraoxide and then heated again at 700~800 °C in the air to obtain the manganese(III) oxide. The interfacial reaction was concluded to be the rate-determining step of the overall oxidation process. The remnant particles after extraction of the manganese(IV) sulfate from the manganese(IV) oxide with hot sulfuric acid was the γ-type manganese(IV) oxide. This oxide showed a high discharge activity equal to or superior to the electrolytic manganese(IV) oxide activity [
26].
The most successful research work to produce hausmannite from manganese ore was conducted by Ratnawulan et al. [
27]. In this scientific work researchers presented the method of preparation of the hausmannite from the manganese ore from the West Sumatra. Authors have obtained hausmannite by the high-energy milling method. The X-ray fluorescence (XRF) analysis results showed that the manganese content was 84.139%. The hausmannite was produced when the sample was sintered at 700 °C. The crystal structure of the hausmannite phase was tetragonal. The obtained hausmannite nanoparticles with homogeneous size distribution have been synthesized after 8 h of grinding time. The size of the nanoparticles produced was 90.50 nm.
Recently Cheraghi [
28] investigated the characterization and calcination behavior of low-grade manganese ore as a part of Mn ferroalloys production. Calcination experiments were carried out at up to 900 °C in the air and argon atmospheres. The samples were in particles and powder forms. Thermal decomposition and reactive diffusion were found to be the dominant mechanisms in the calcination process. The results demonstrated that some phases were forming and vanishing during the calcination process in the air, such as calcium ferrites, calcium oxide, and bixbyite. While the Fe-containing bixbyite was thermally decomposed to hausmannite at low temperatures, magnetite was produced at higher temperatures. However, magnetite was also formed through the diffusion between hematite and hausmannite phases [
28]. Therefore, one of the effective ways to obtain trimanganese tetraoxide as hausmannite phase is a thermal treatment of the manganese-containing ores.
The Republic of Kazakhstan has manganese-containing minerals suitable for trimanganese tetraoxide production such as deposits Bogach and Zhaksy. The Bogach deposit is placed in the Karaganda region (the Nura district), 180 km northeast of the Zhezkazgan city. It was discovered during regional geological works in 1983–1986 [
29]. The Bogach deposit belongs to the Aidagarly syncline of the Sarysu-Teniz uplift. The length of the ore field is 2000 m, width equals 1000 m, and area is 2 km
2. The upper horizon is ore-bearing composed of red-colored limestone, highly silicified in some places. Primary ores have a layered texture with frequent hematite, braunite, limestone, and jasper alternation in layers. Oxidized ores are featured by powdery-lumpy and earthy texture. Primary manganese ores usually contain braunite, hematite, ankerite, friedelite, jacobsite; among nonmetallic minerals calcite, quartz, chlorite, gypsum can be detected. The oxidized Mn ore includes minerals such as psilomelane, pyrolusite, hematite, vernadite, less often goethite, hollandite, jacobsite, braunite; quartz, kaolinite, mica, calcite, as well feldspars are included as nonmetallic mineral components. Elements such as Rb (0.002–0.004%), Cs (0.002%), Tl (2.56 g/t), Ge (<3 g/t), As (0.005–0.007%) can be detected in both types of ore as impurities. Impurities such as Co, Sr, and Mo are mentioned in other mineral catalogues [
30]. Over the 10-year period, it was processed about 430,200 tons of commercial ore.
The Zhaksy deposit of Mn ore is placed in the Akmola region of Kazakhstan (Zhaksy district). The Zhaksy deposit belongs to the southwestern segment of the Kalmakkul synclinorium. The Lower Ordovician red clayed-siliceous shales include multiple layers of thin ore. The deposit includes different Mn-containing minerals: psilomelane, braunite, hausmannite, and pyrolusite. Among nonmetallic minerals calcite, quartz, chlorite, chalcedony, as well sericite is detected. Pyrite and chalcopyrite are sometimes detected as impurities. The degree of mineralization of inclusions to complete replacement of rock with ore minerals [
30].
These deposits were not widely described in scientific literature before. There is no information about phase, elemental content, and there is no microphotograph of the ores from deposits Zhaksy and Bogach. However, that information is necessary to study the possibility of application of “top-down” method for trimanganese tetraoxide production from manganese ores of Zhaksy and Bogach deposits.
The purpose of the research is to study the structure and content of manganese ores from Bogach and Zhaksy deposits using state-of-the-art SEM, EDA, XRD, IR-Fourier spectral analysis methods. Based on the results of the proposed study, an assumption of possible application of these ores as a raw material for commercial production of trimanganese tetraoxide in the hausmannite phase will be given. Thus, the object of the research is manganese ores from Bogach and Zhaksy deposits placed in Kazakhstan.
3. Results and Discussions
3.1. Electron Microscopy with EDA
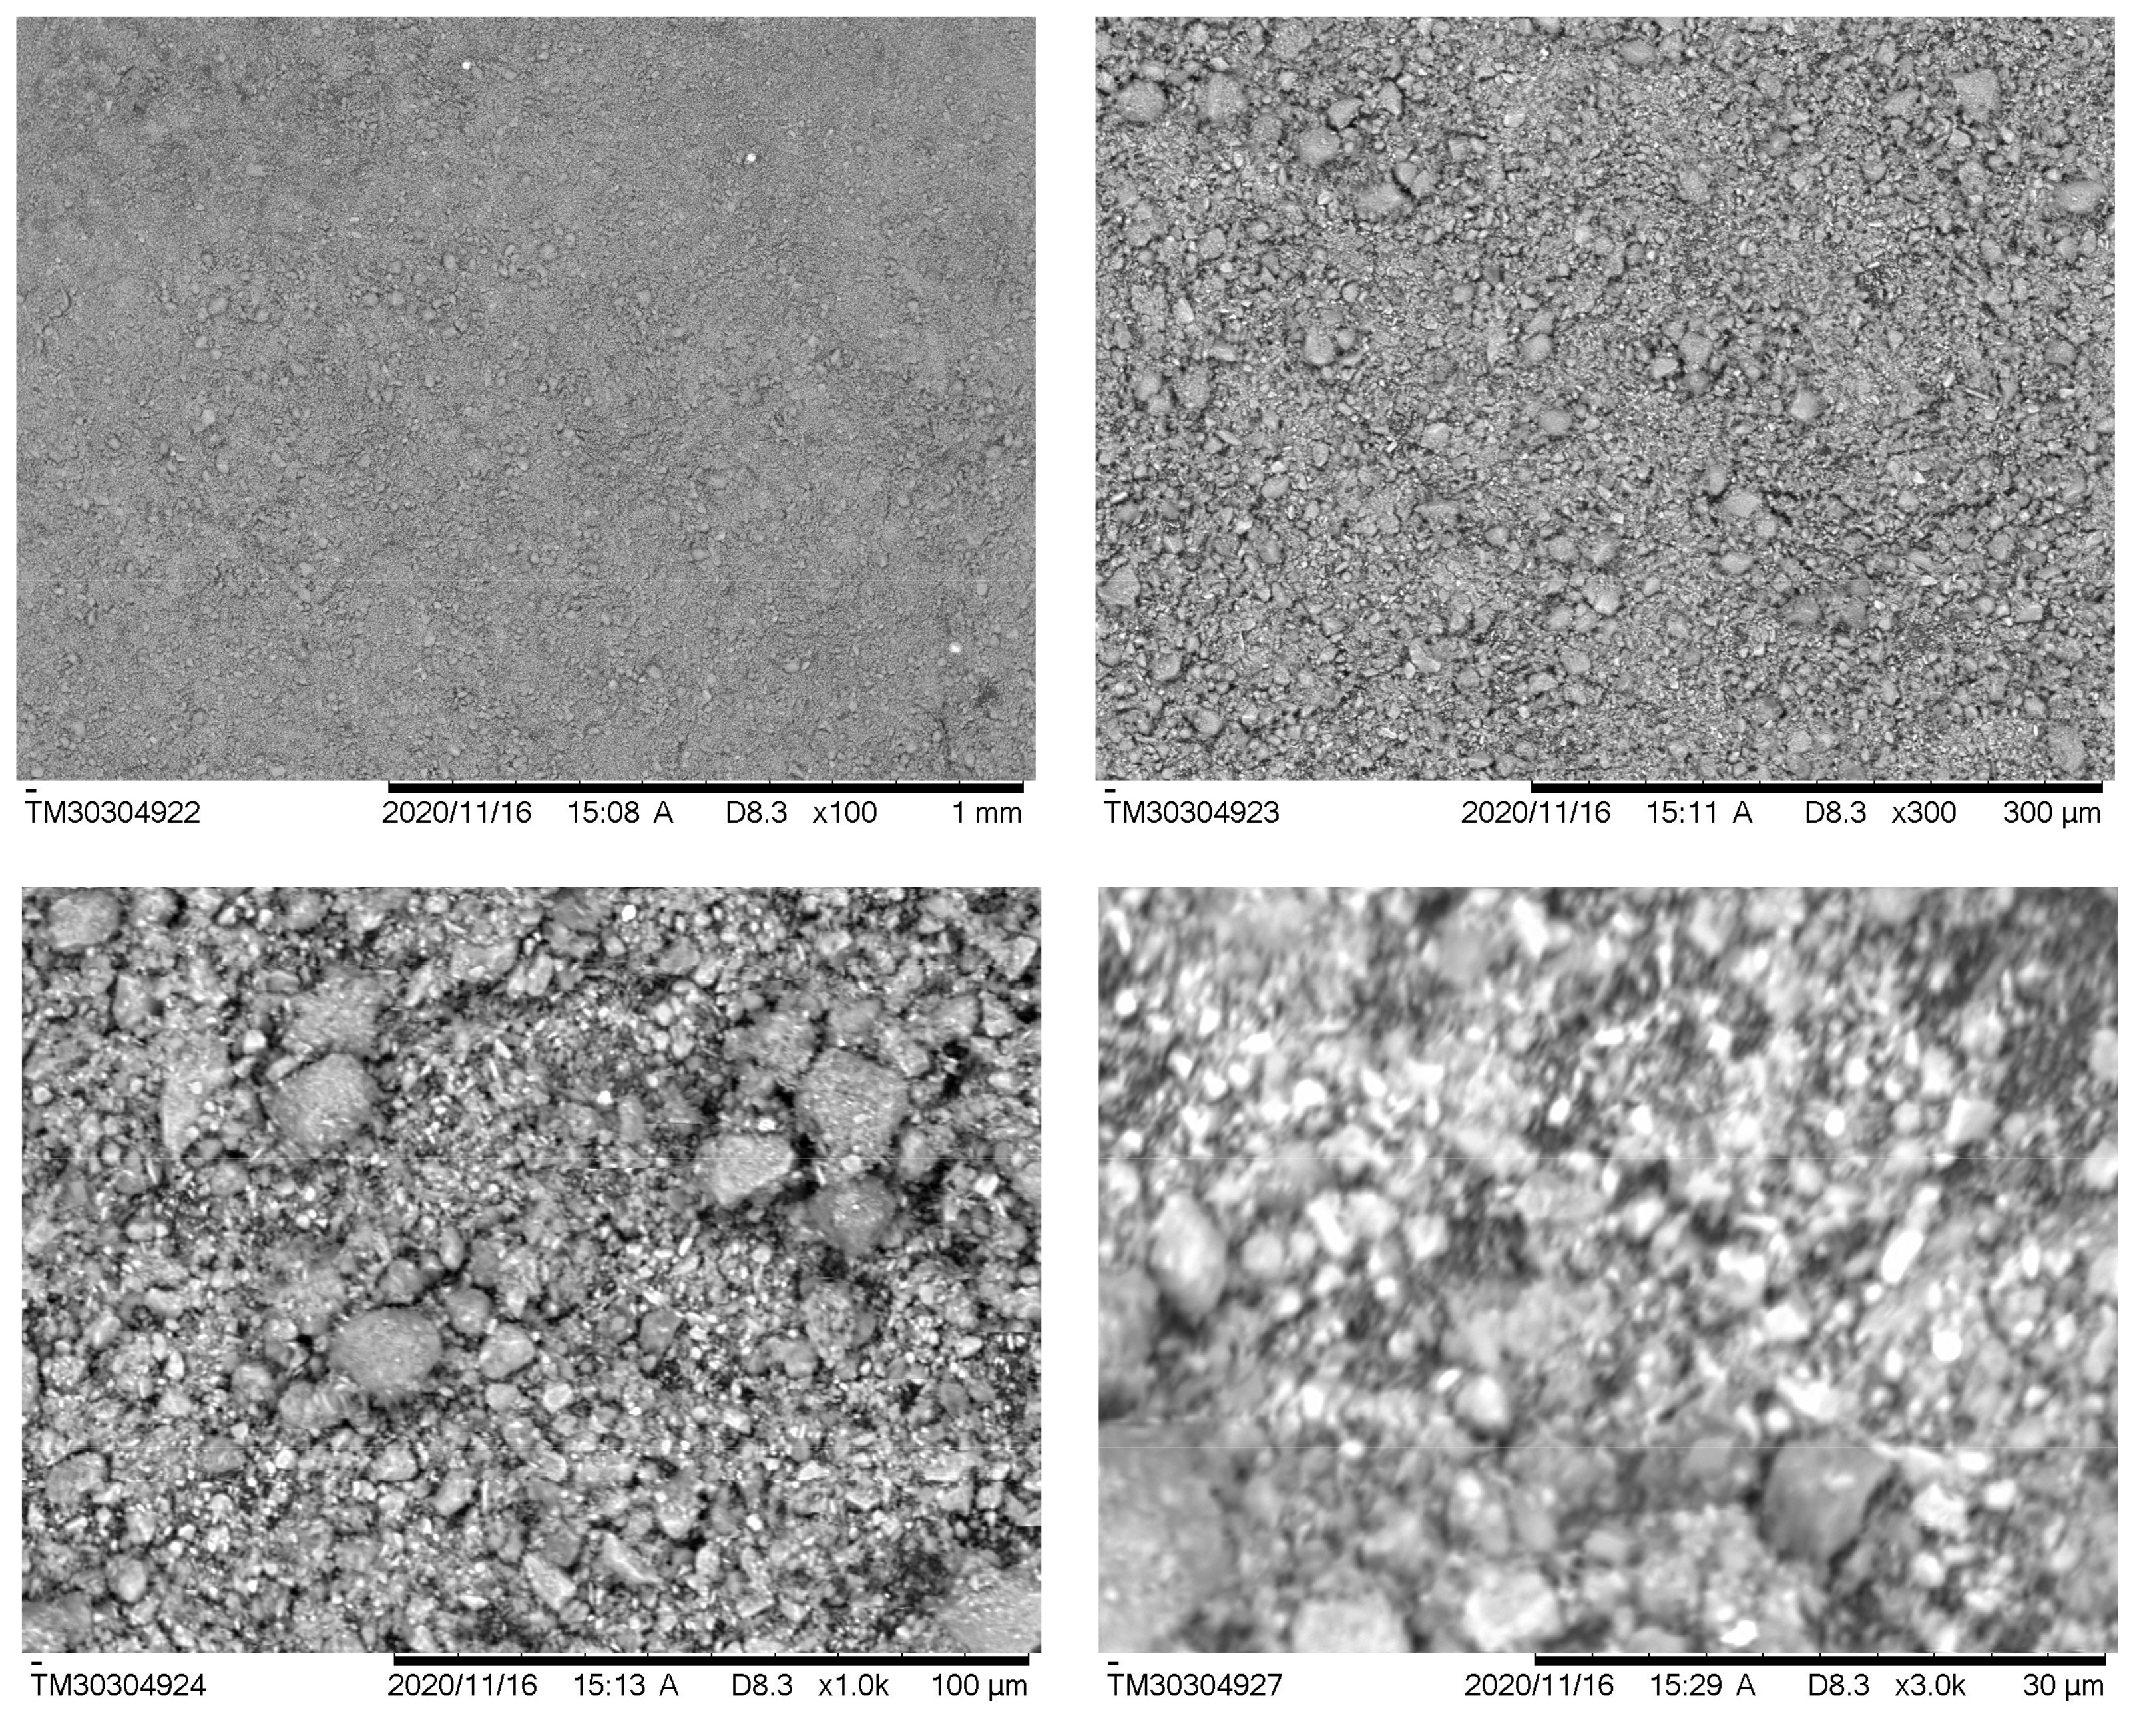
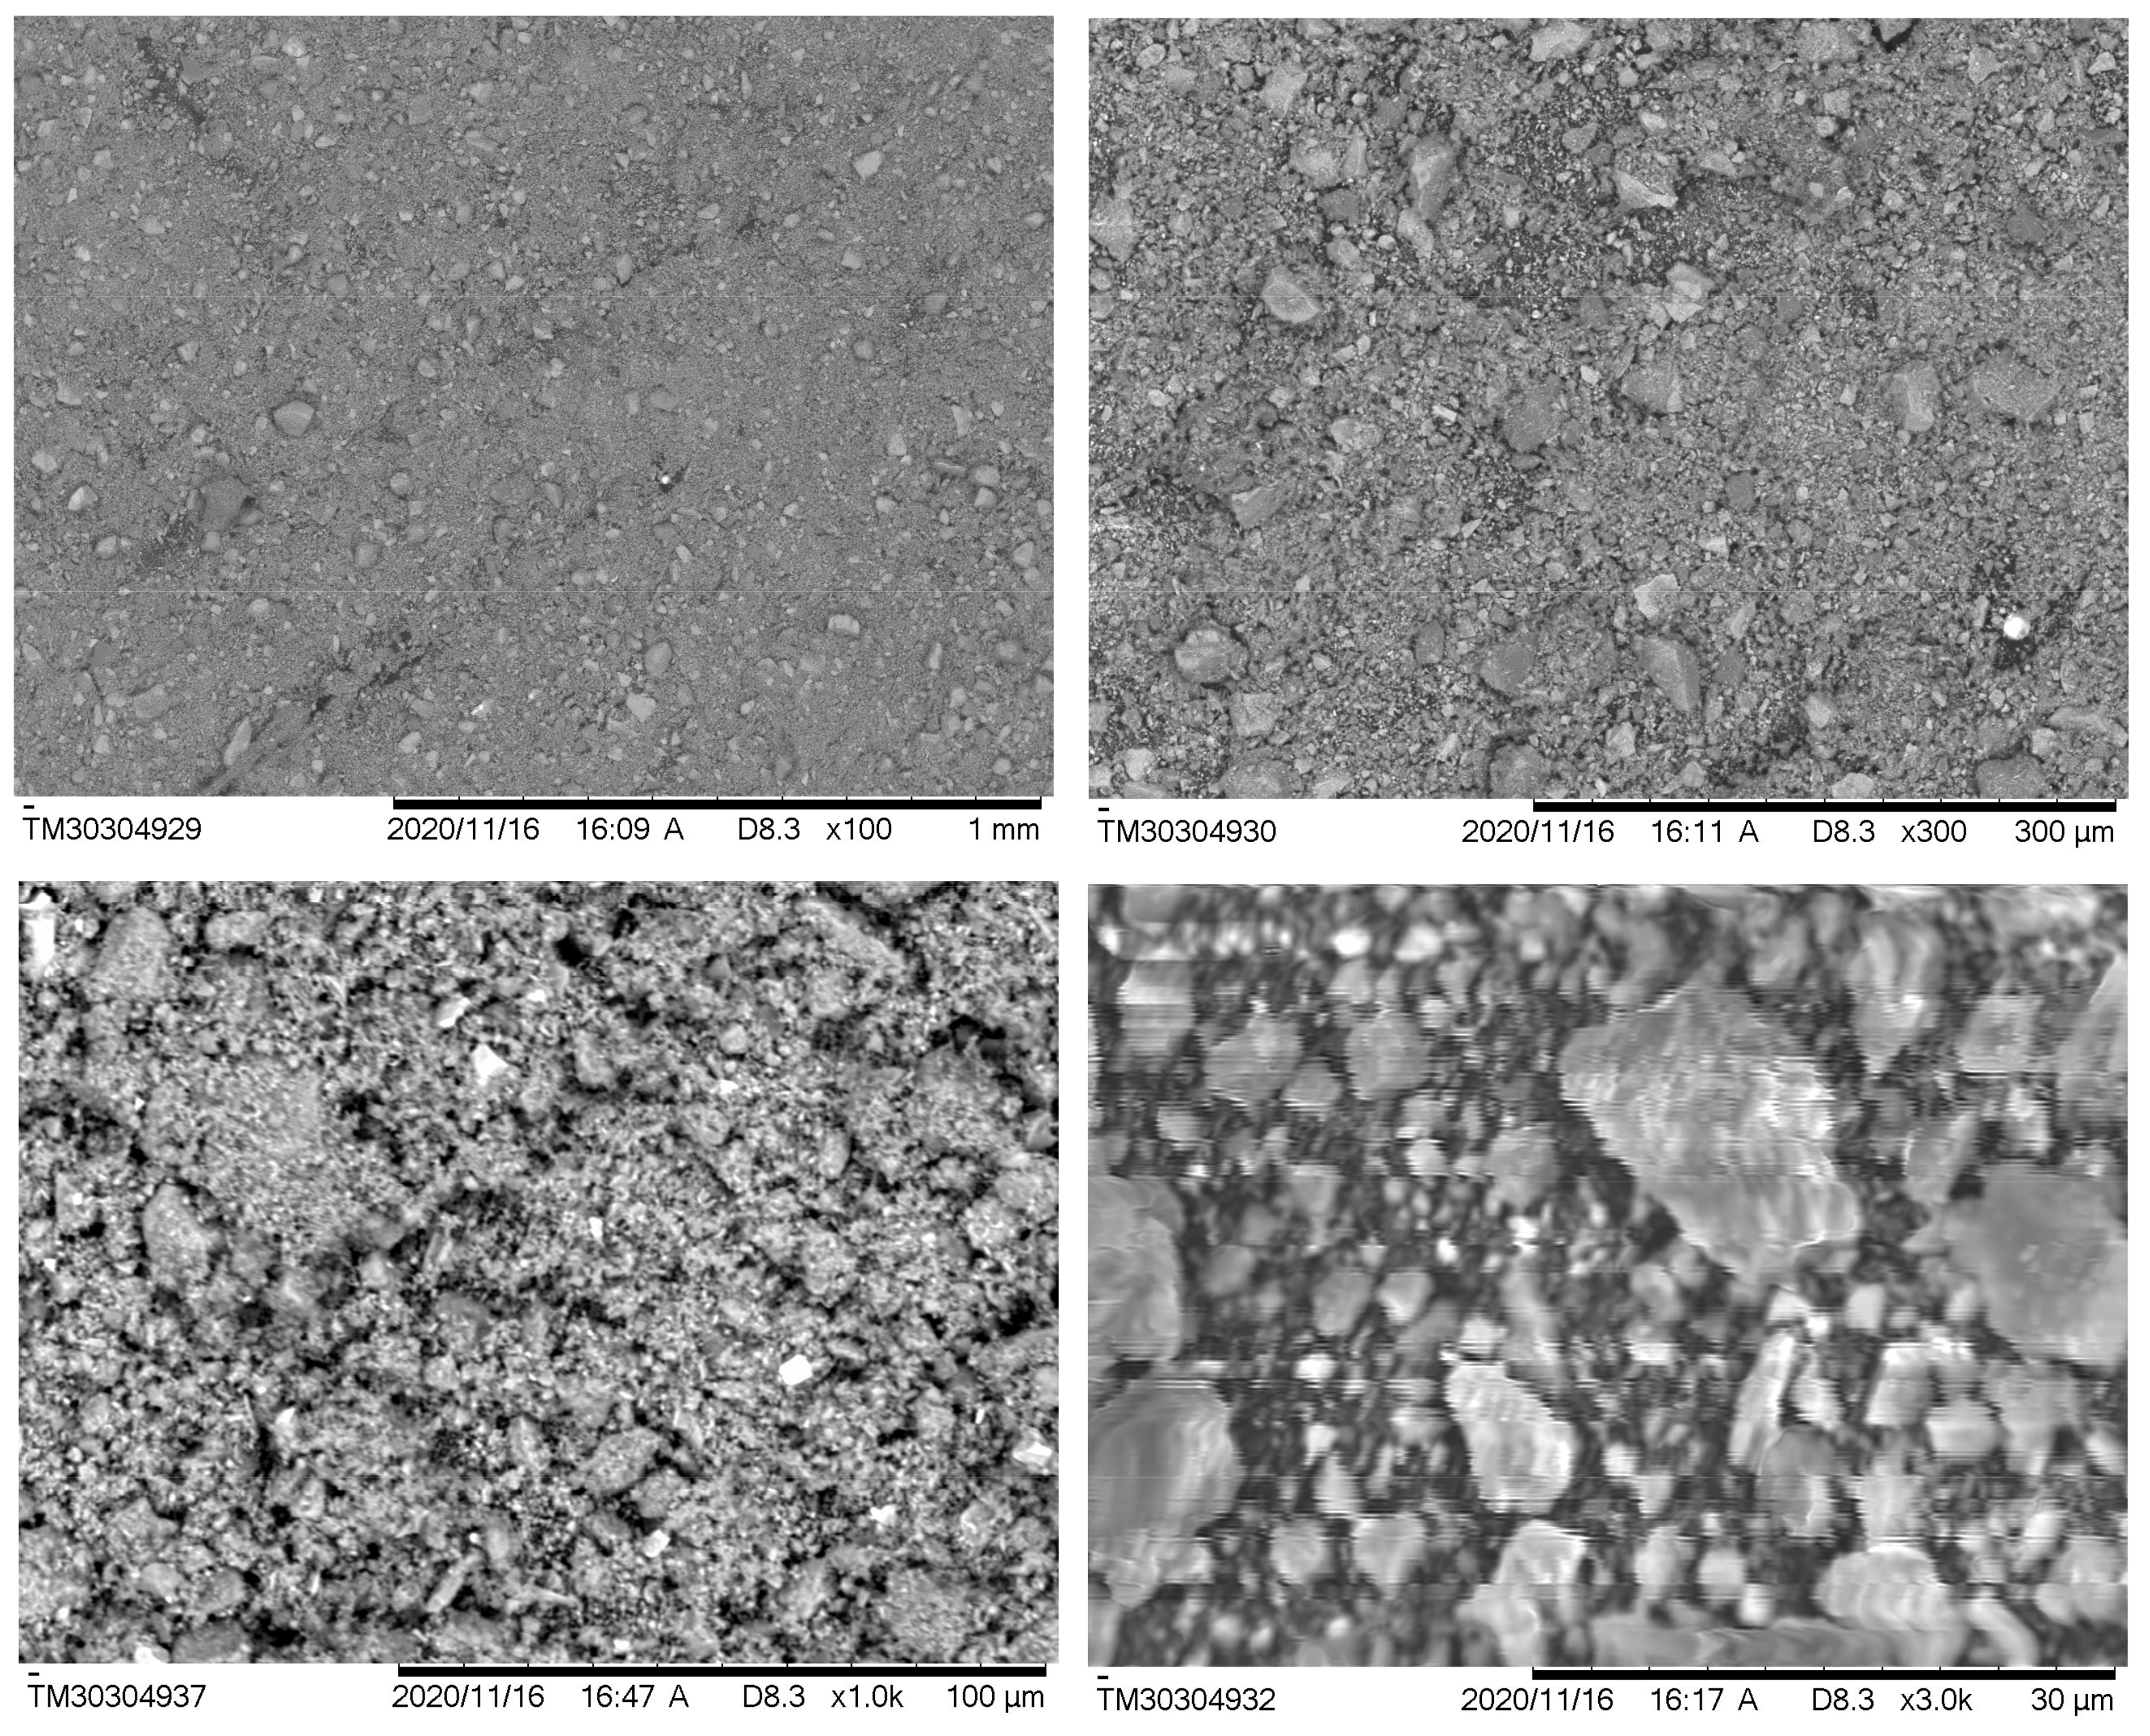
Figure 3 and
Figure 4 show micrographs of the investigated samples at resolutions ×100, ×300, ×1000, ×3000.
The analysis of micrographs reveals that the dispersive capacity of samples No. 1 and 2 are similar to each other and ranges from one to several tens of microns.
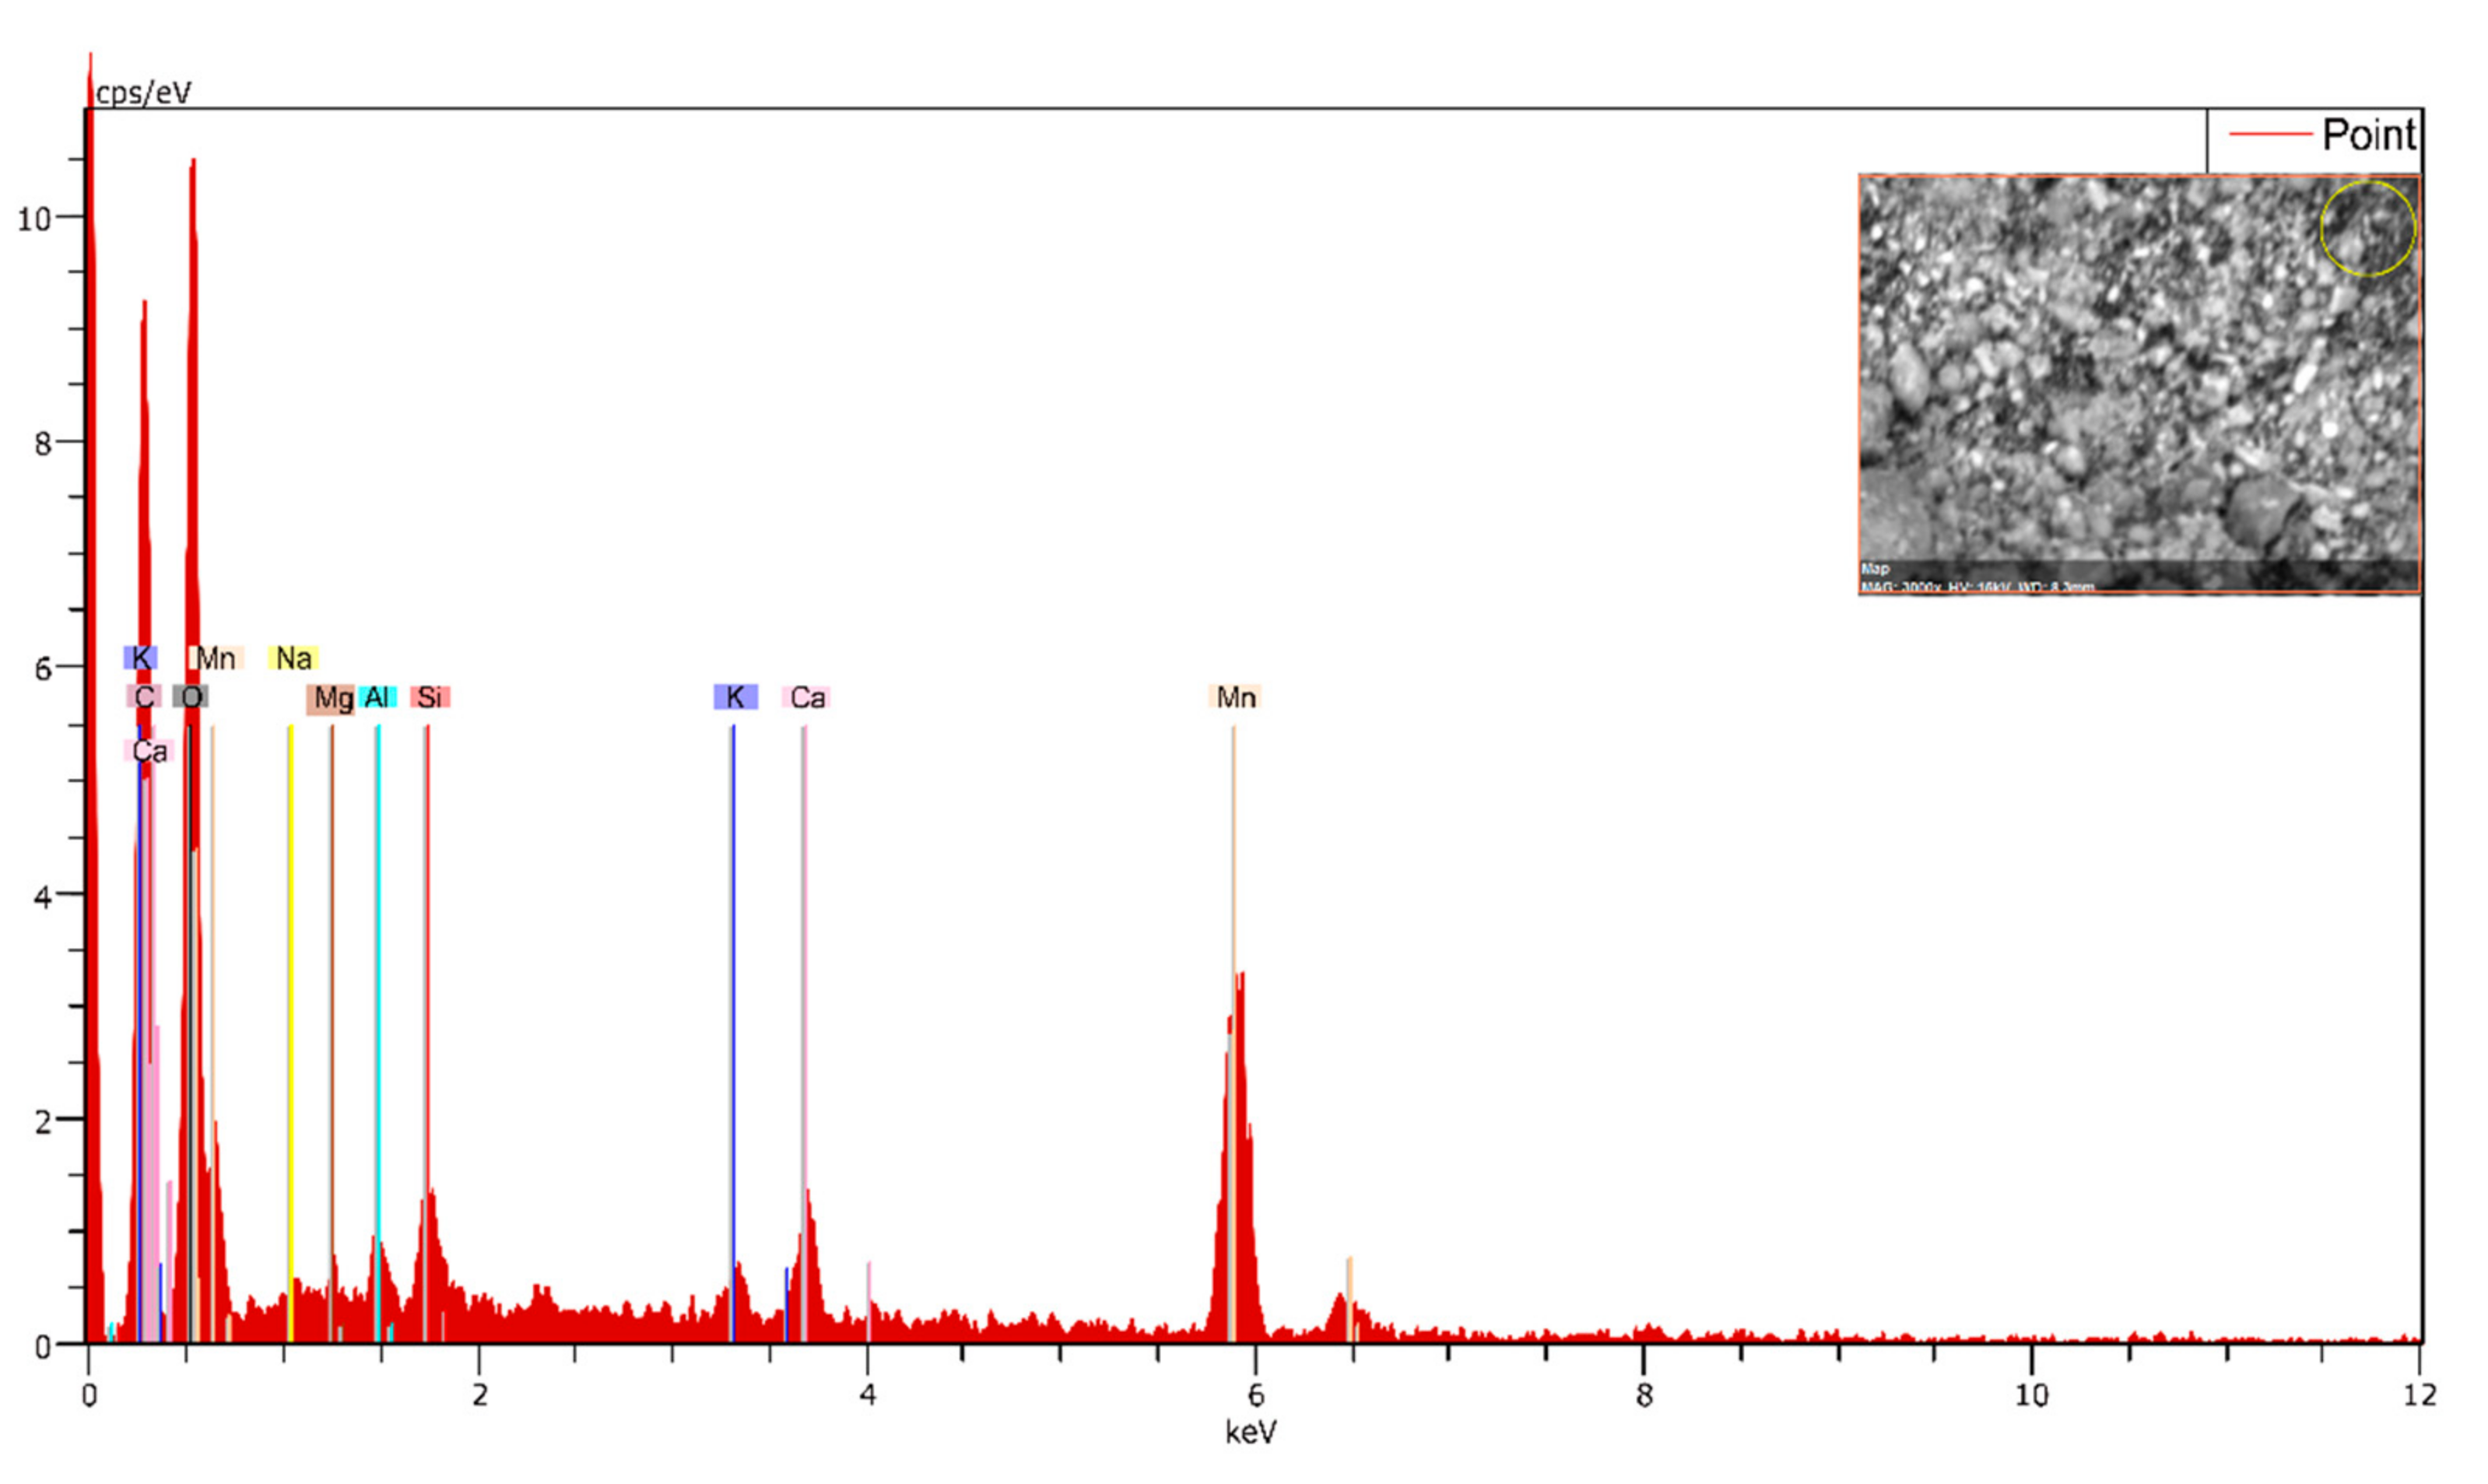
The microanalysis system made it possible to analyze the elemental composition of the samples by the energy-dispersive analysis method.
Figure 5 shows a typical spectrogram of the sample.
Table 1 and
Table 2 present the findings of the elemental analysis of the investigated samples.
According to the elemental analysis data, it is seen that the ore of the Bogach deposit contains two times more manganese than the Zhaksy deposit, with a content of 43.26% on average. At the same, the iron is absent in the Bogach ore. Content of Fe in Zhaksy ore is not significant, about 5% on average.
Table 3 presents normalized distributions of the atomic composition (at.%) in the investigated samples.
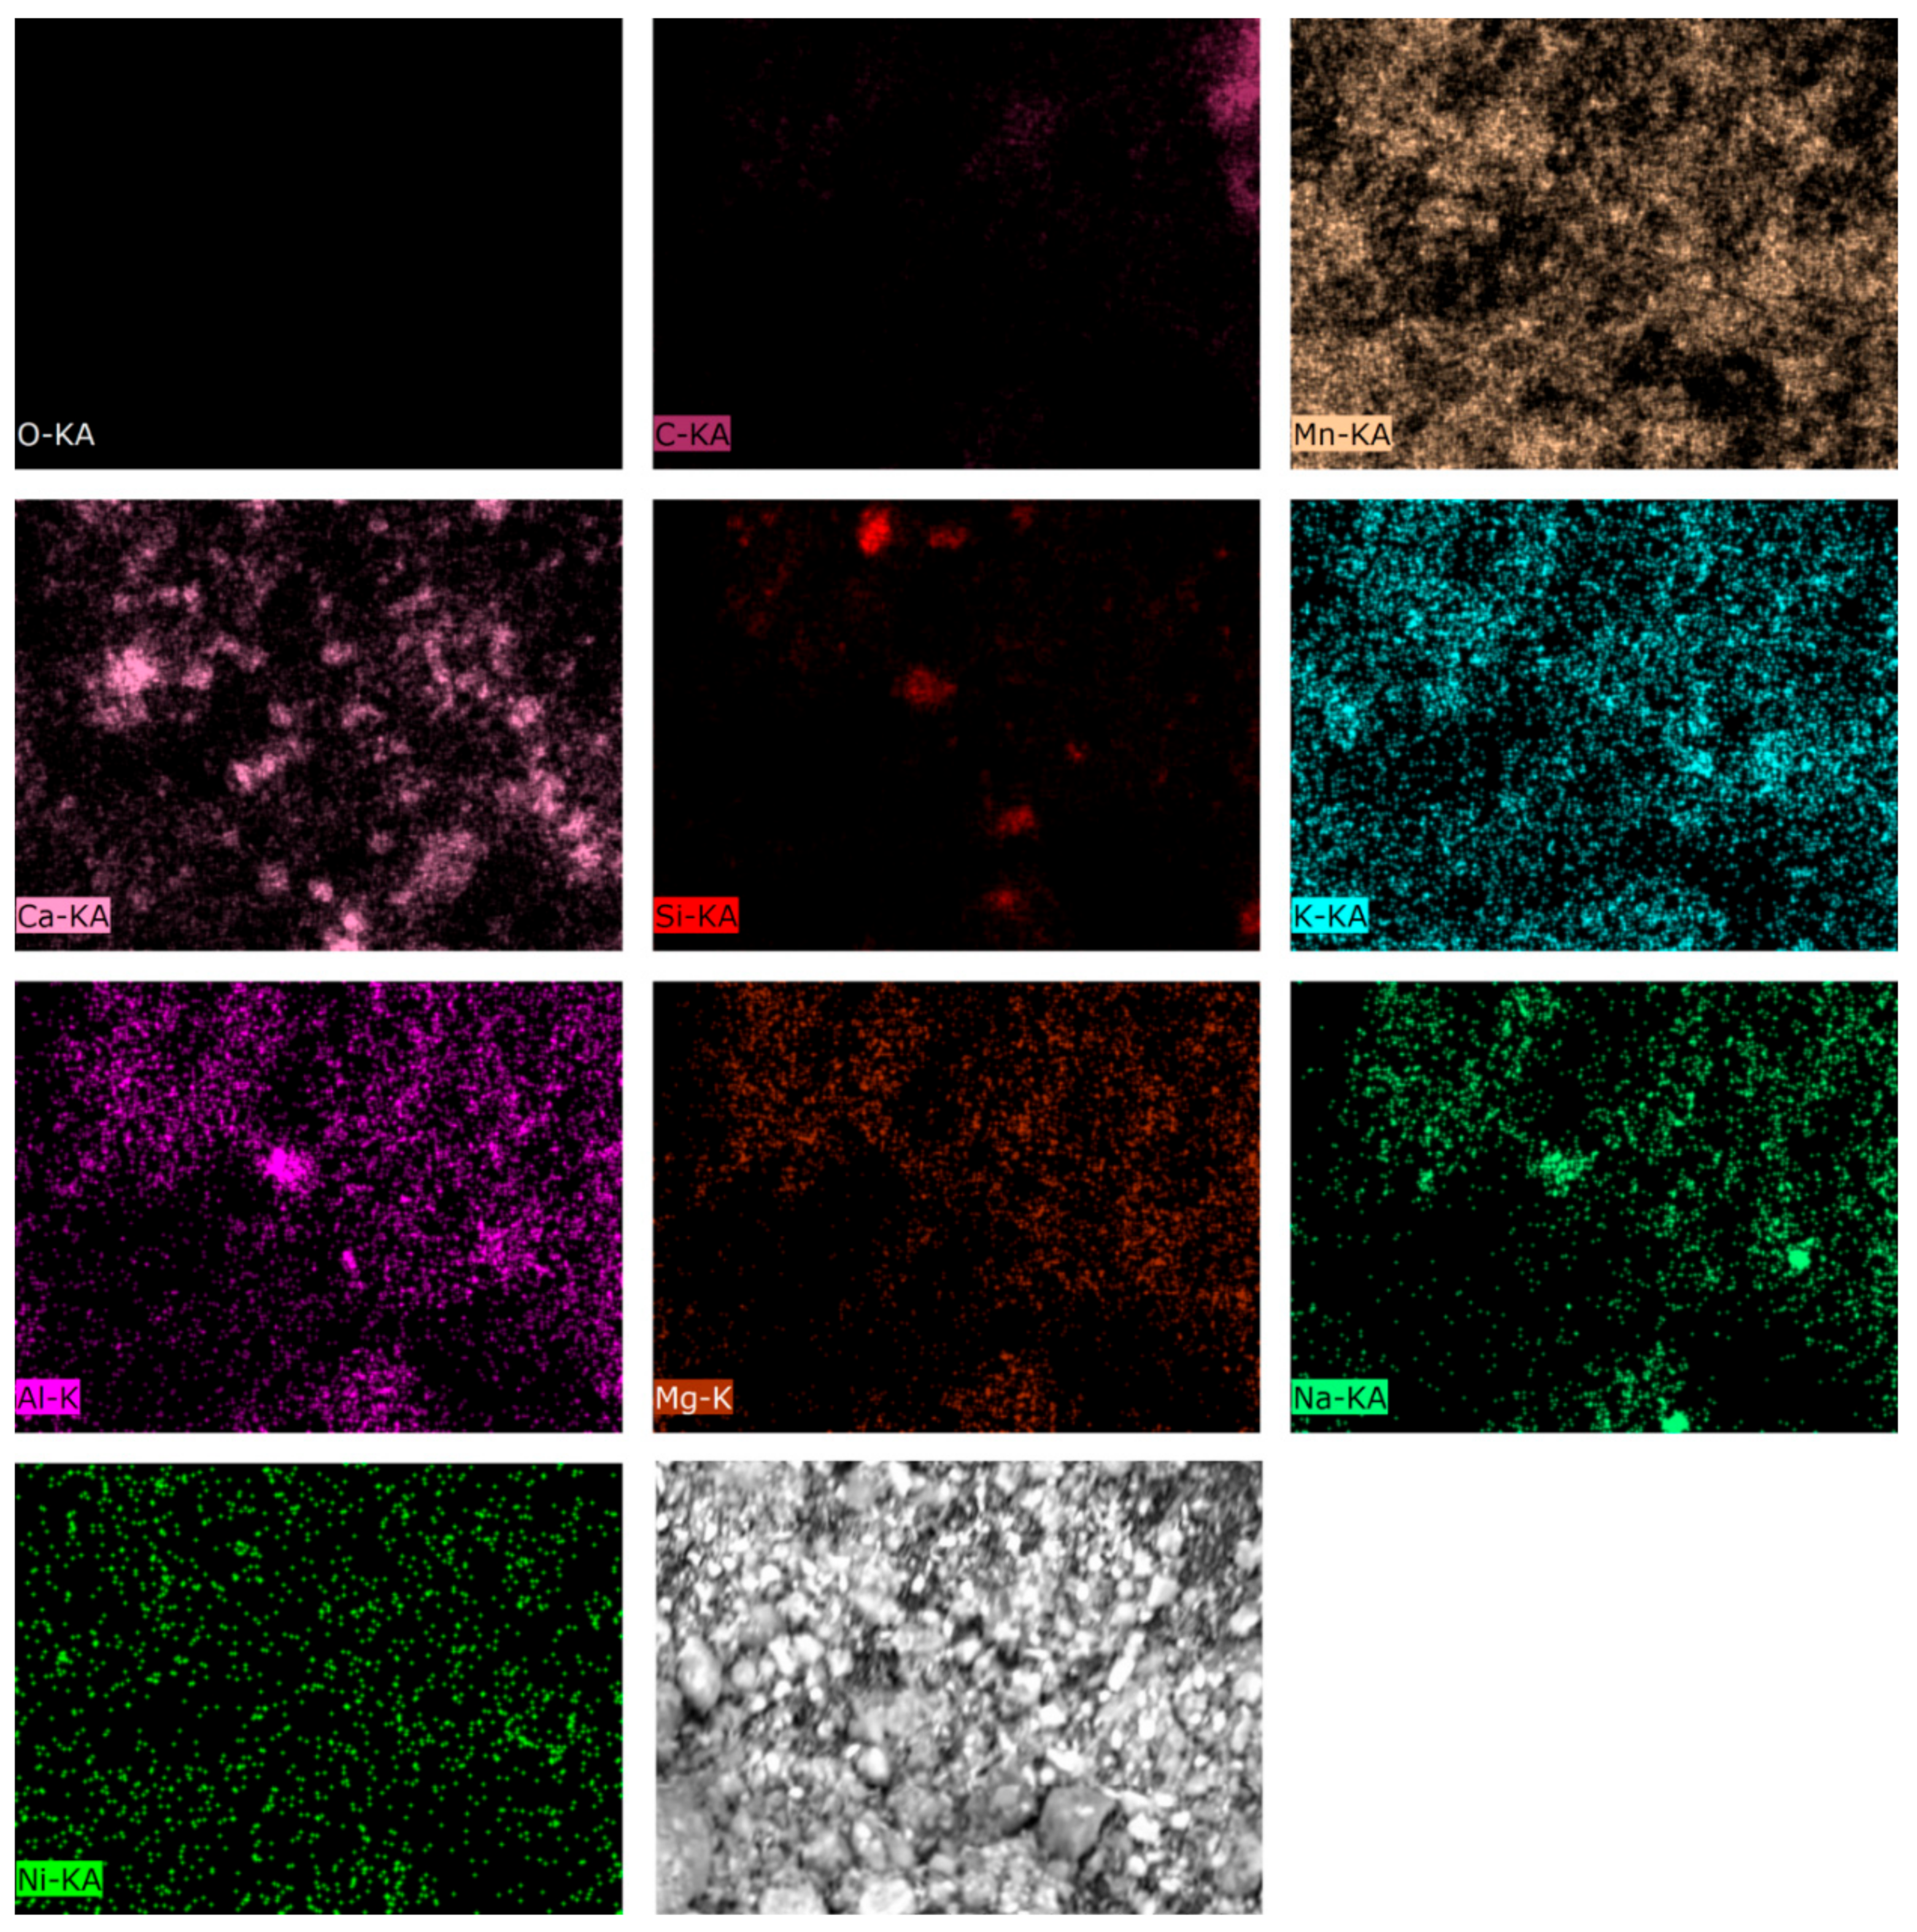
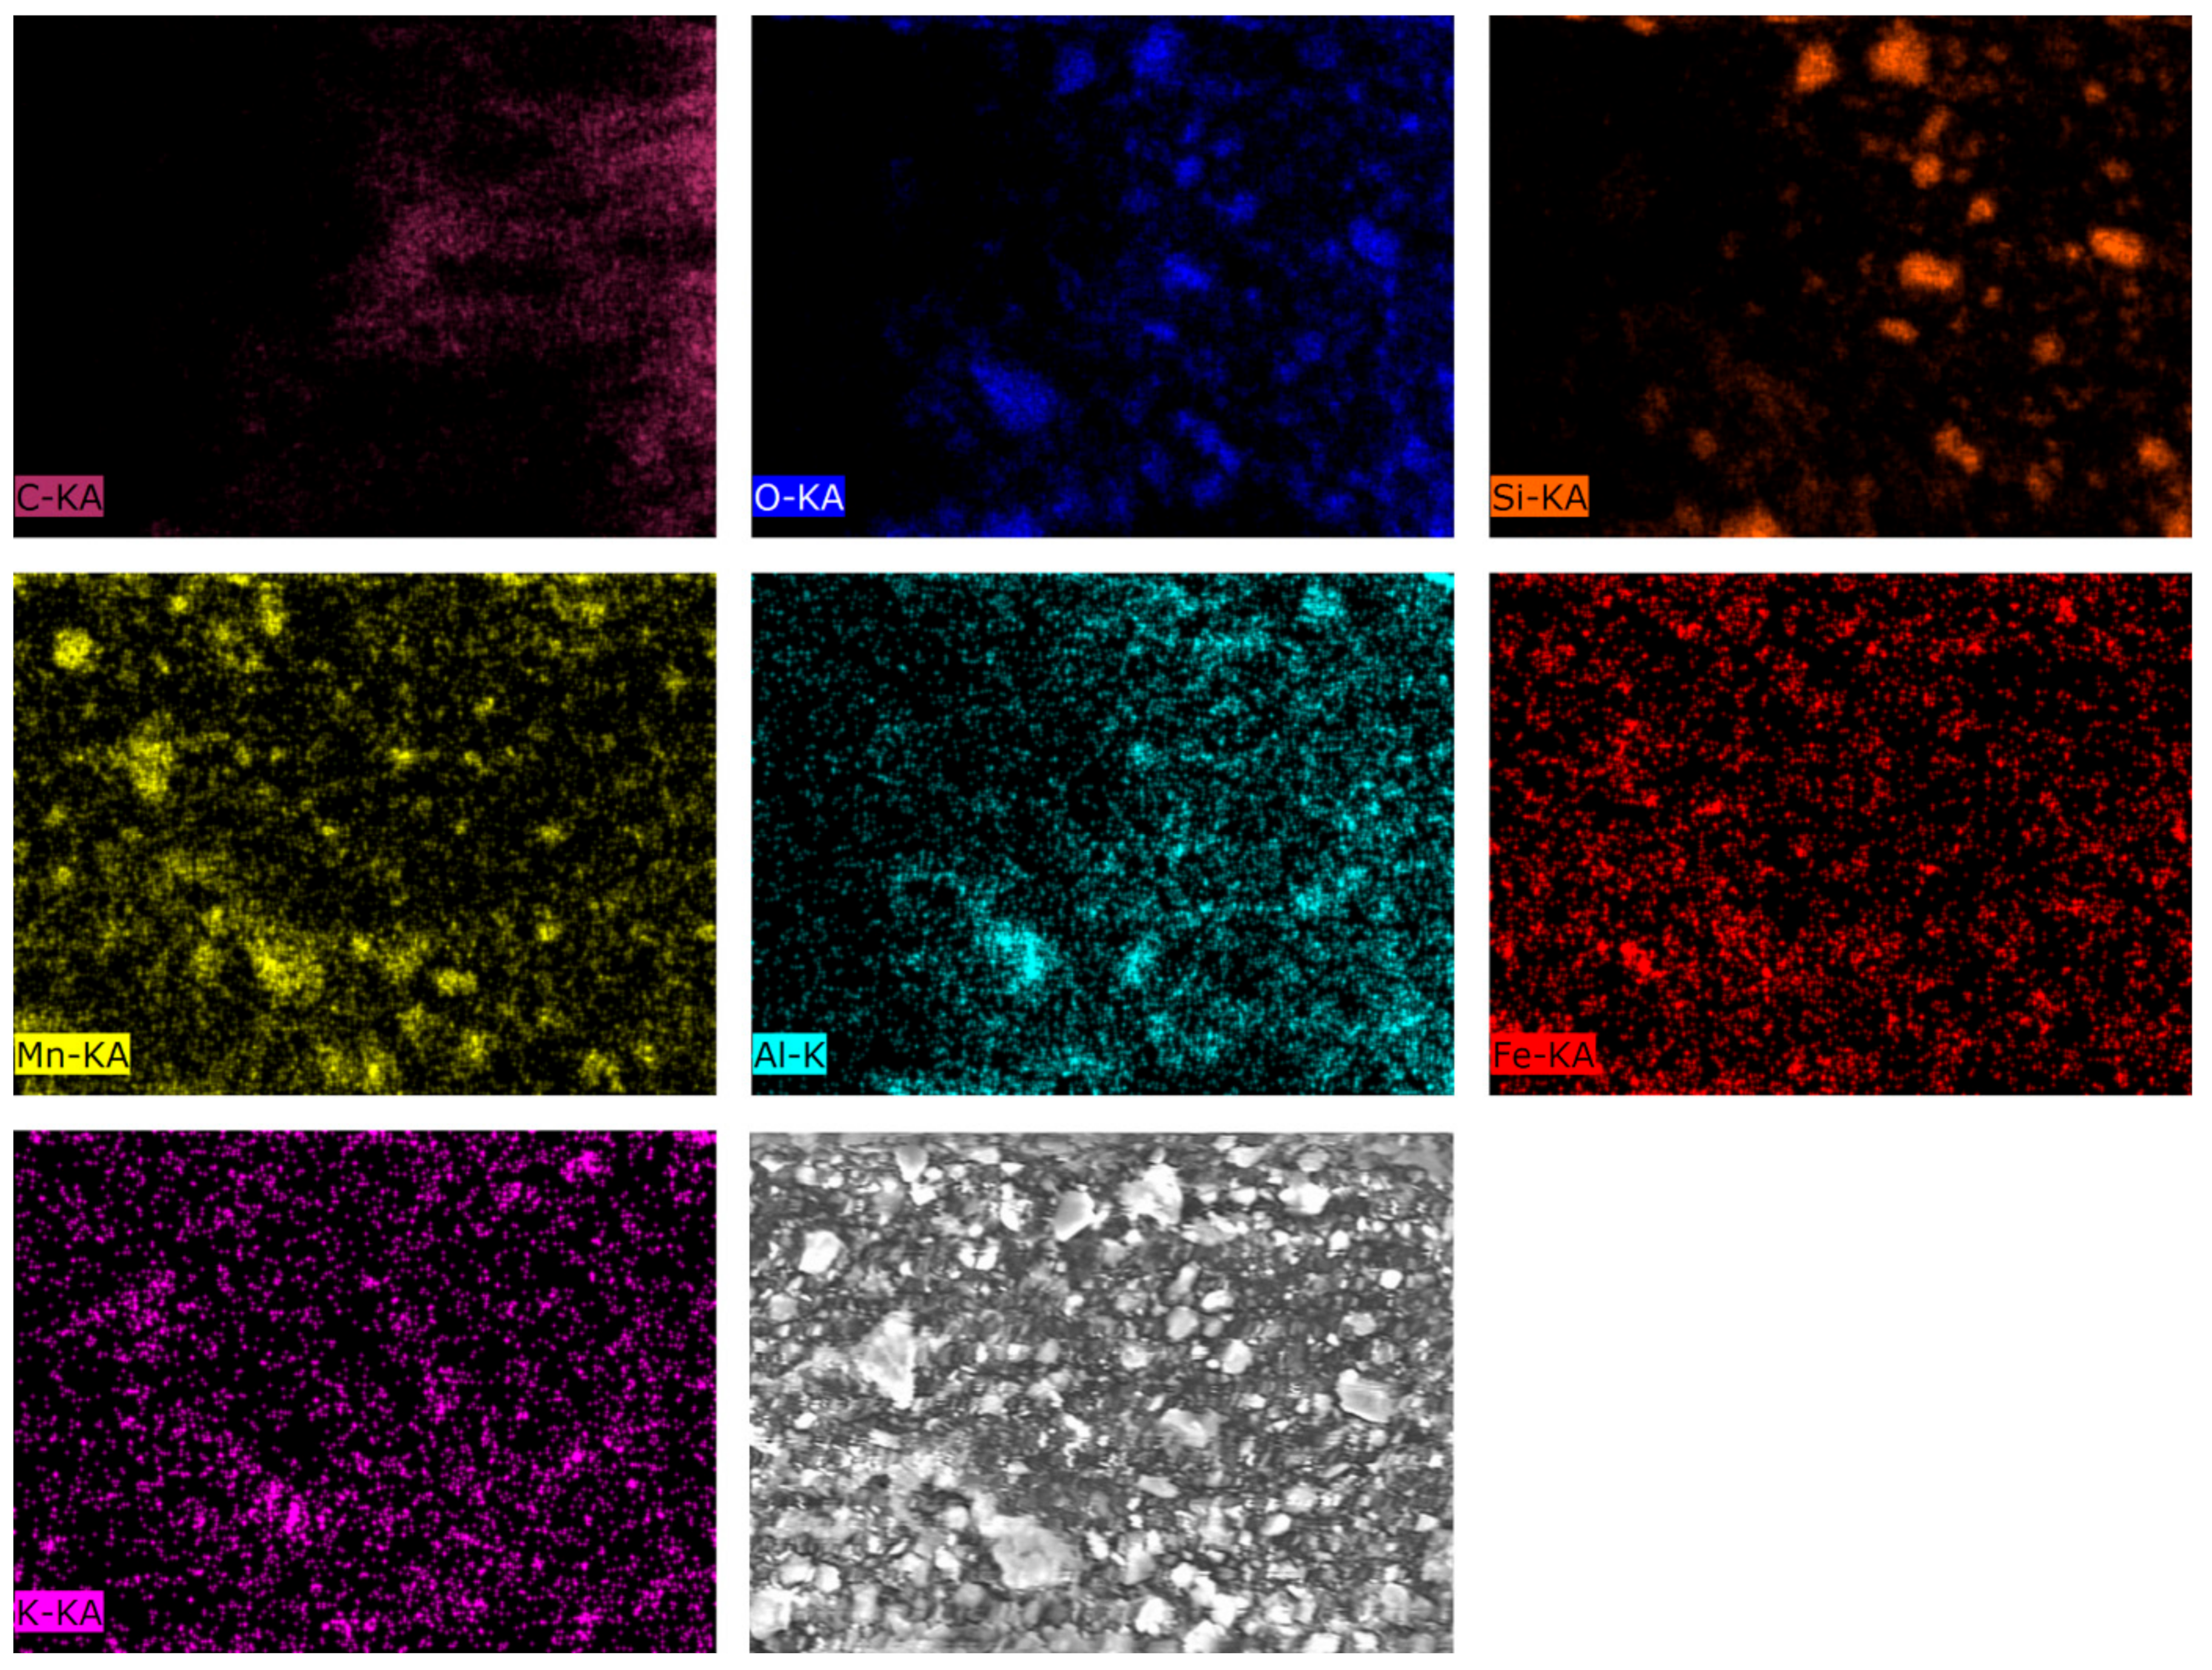
Figure 6 and
Figure 7 present the micrographs with mapping of the distribution of elements on the focused surface of the sample. In all samples, there are inclusions of dense crystallites containing silicon. These formations may belong to waste rock particles.
In all micrographs, these formations look similar to dense monolithic particles with a size of 20–30 microns. In all samples, manganese gives a quite dense background, which indicates a sufficiently high or average content of it in the composition of the raw ore.
The analysis of the obtained micrographs of the samples under study revealed that the dispersive capacity of ore samples from the Bogach deposit (sample 1) and Zhaksy deposit (sample 2) is similar to each other and ranges from one to several tens of microns.
Micrographs with mapping of the distribution of elements on the focused surface of the sample provide the opportunity to study highly-relief surfaces and obtain information about the state of the surface layer and adjust the image of sub-layers.
Thus, in both investigated samples, there are inclusions of dense crystallites containing silicon as the main rock-forming component representing dense monolithic conglomerates with a size of 20–30 microns. It should be highlighted that manganese in all samples gives a quite dense background that corresponds to a high or average Mn content in the raw ore composition. In particular cases, it depends on the source of origin, sample preparation, degree of grinding, moisture content, etc.
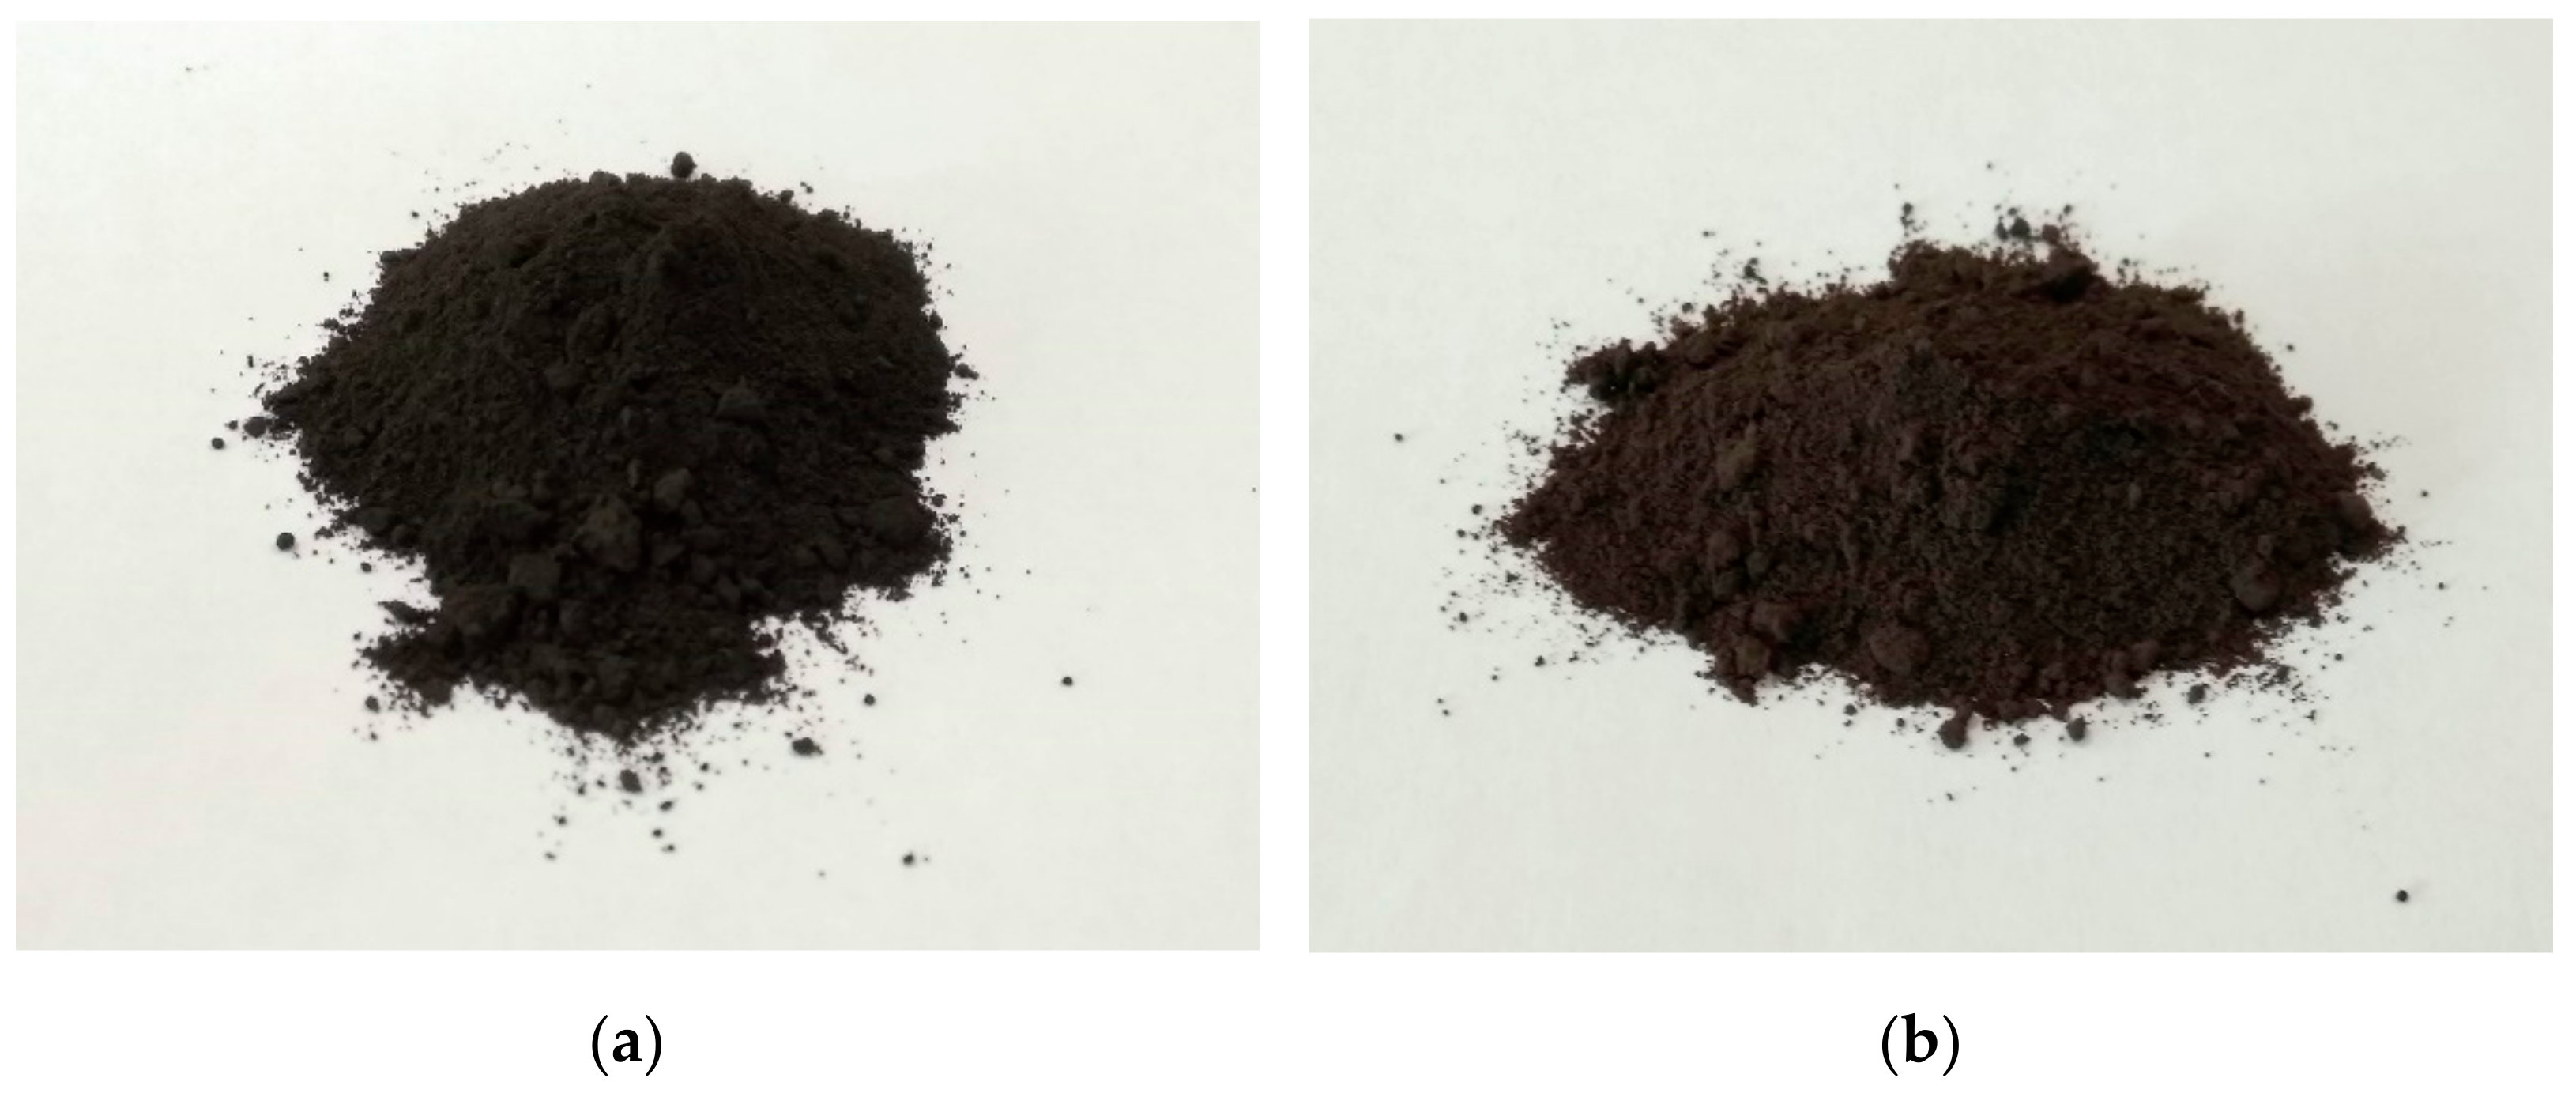
Based on the obtained elemental analysis data, it was found that in terms of manganese content, the ore of the Bogach deposit contains about 43.06 wt.% while the iron content in the same ore is reduced to zero. The lower content of manganese mineral is found in the poor oxidized ore of Zhaksy deposit, which comprises about 22.00 wt. % due to the presence and influence of silicates, alumina, lime, and magnesia, and its mineralogical features, it is represented by oxide forms of manganese and iron (5.47 wt.%) and, as a result, has a dark brown color.
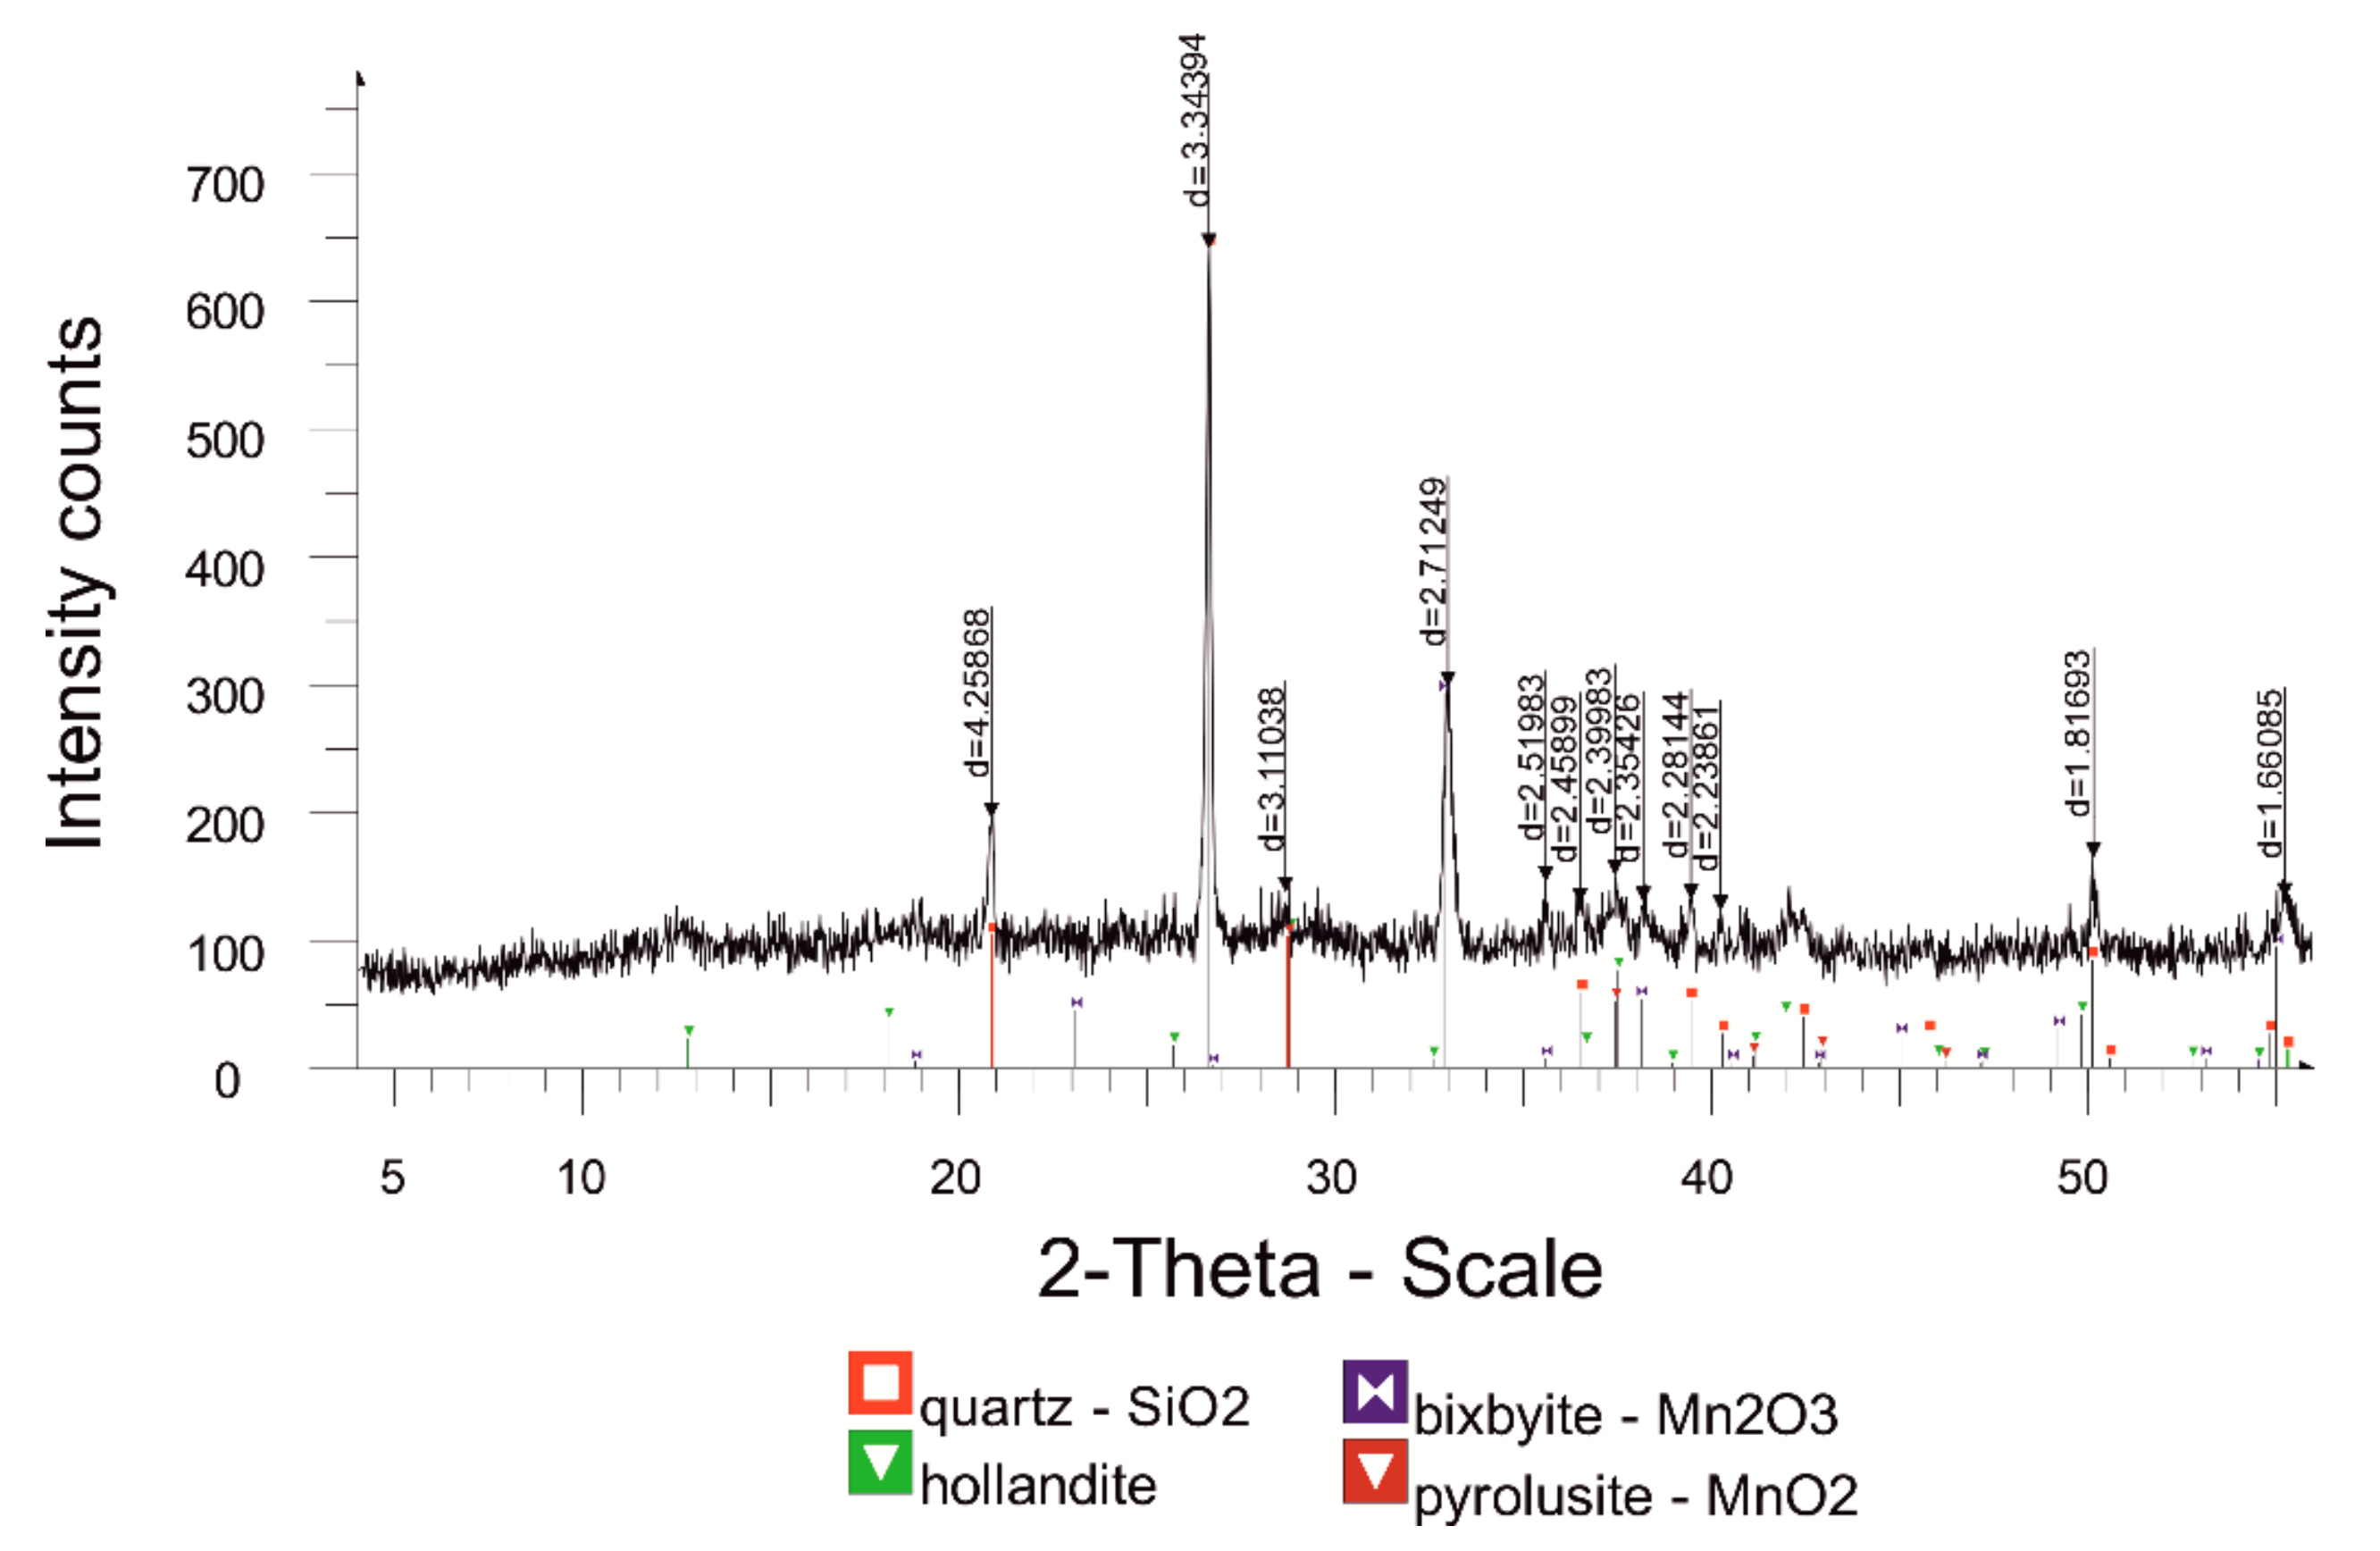
3.2. X-ray Diffractometry Analysis
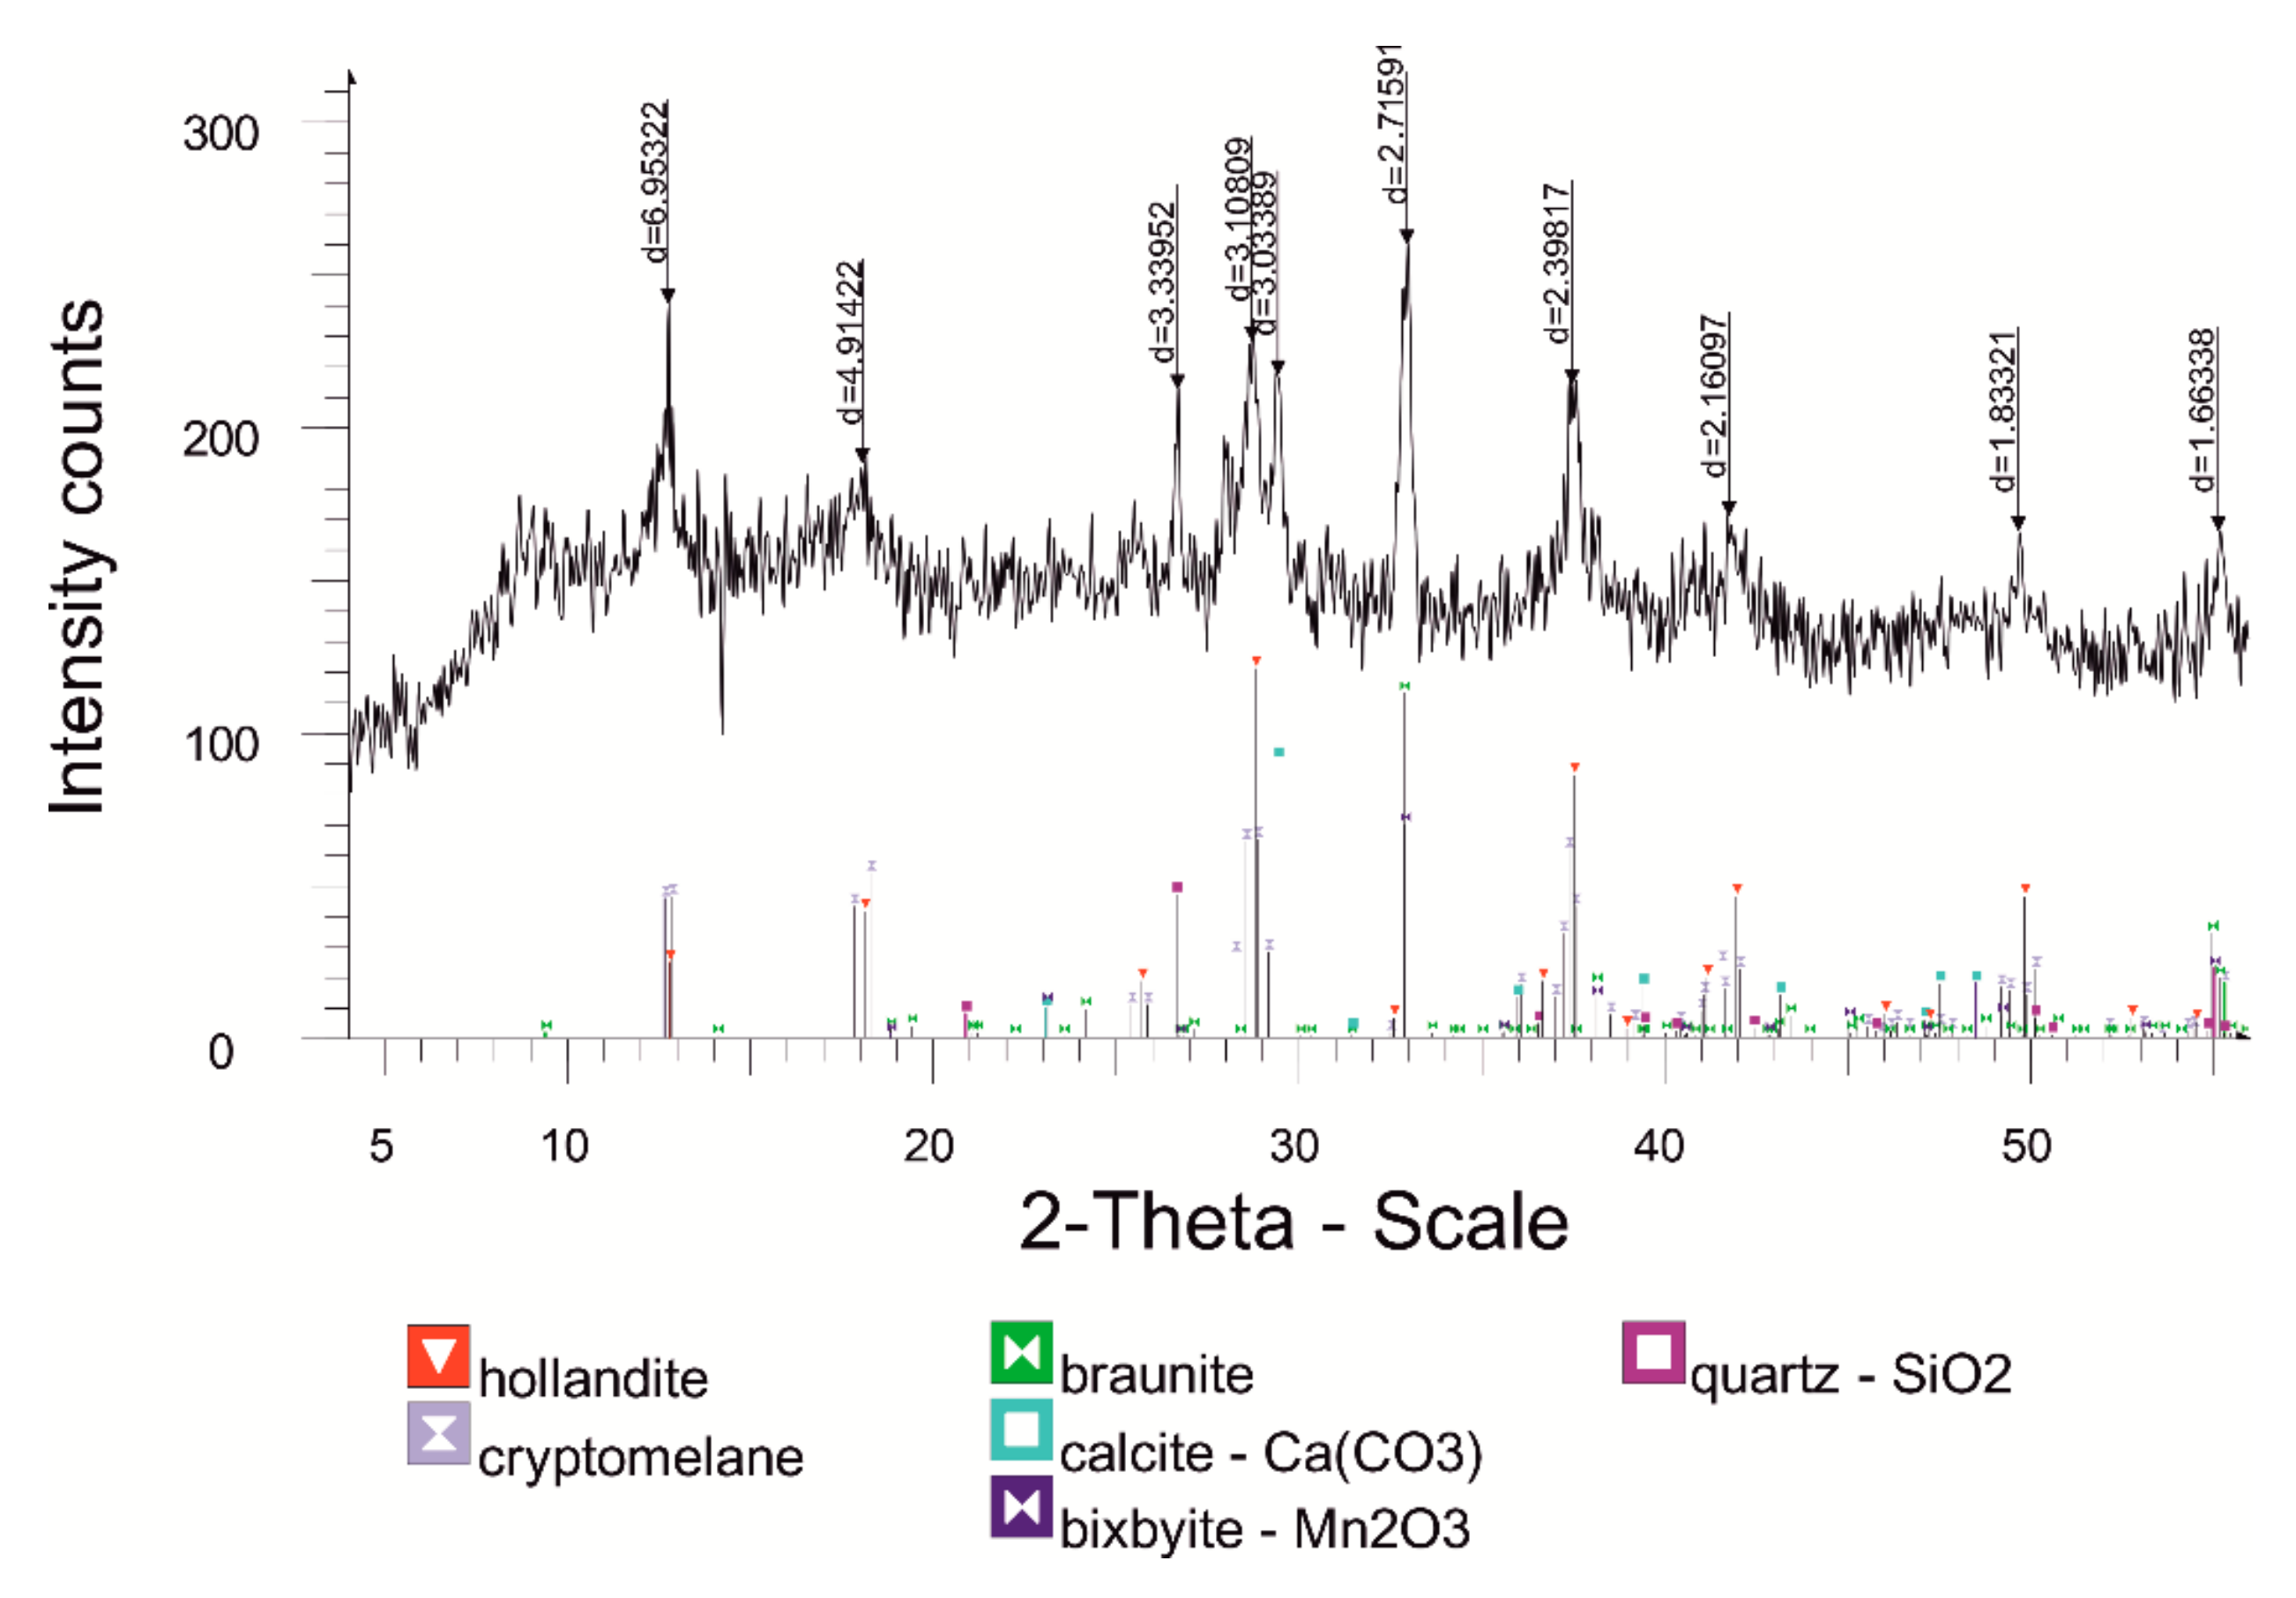
XRD analysis was used for the investigation phase content of the studied samples. Values of interplanar distances, relative intensities of reflexes, and semi-quantitative content of crystal phases were obtained. The results of mineralogical analyses of the studied samples are shown in
Table 4 and
Table 5. It was observed that all listed diffraction peaks belong to phases specified in the tables. Characteristic diffraction reflexes allowing identification of present phases are registered in all samples.
Table 6 and
Table 7 show the concentration distribution of different mineral phases present in studied samples. Mn-containing phases are mainly hollandite, cryptomelane, braunite, bixbyite, pyrolusite.
By total content of Mn-containing phases, the samples are placed in the following row: sample 1 (Bogach)—87.4%, sample 2 (Zhaksy)—54.5%. However, the content of Mn must be taken into account as an element in the structure of the Mn-containing phase. Manganese ore from Zhaksy contains the maximal percentage of empty rock as quartz.
Figure 8 and
Figure 9 show diffractograms of the samples. It can be seen from the figures that the sample of Bogach ore is more amorphous in comparison with the Zhaksy sample. In these samples, the diffusivity of the reflexes indicates a not high degree of crystallinity of the mineral structure. All samples, excluding Zhaksy, background points on Mn’s significant content, confirmed with elemental analysis.
3.3. IR-Spectrometry Analysis
IRS methods allow obtaining information about the presence of minerals in ores by wavenumbers. Thus, pyrolusite is characterized by wave numbers 610 and 830 cm
−1, manganite—550, 610 and 1100 cm
−1, psilomelane—550, 830 and 1050 cm
−1 (
Table 8) [
31].
The IR spectra of samples of manganese ores differ not only in the presence of ore minerals of manganese but also in the peaks corresponding to the phosphate group PO
43−. That is confirmed by correspondence of calcium triphosphate wave numbers to wave numbers of phosphate group in manganese ore spectra or fluctuations of the phosphorus-oxygen group 1090–1050 cm
−1 [
31].
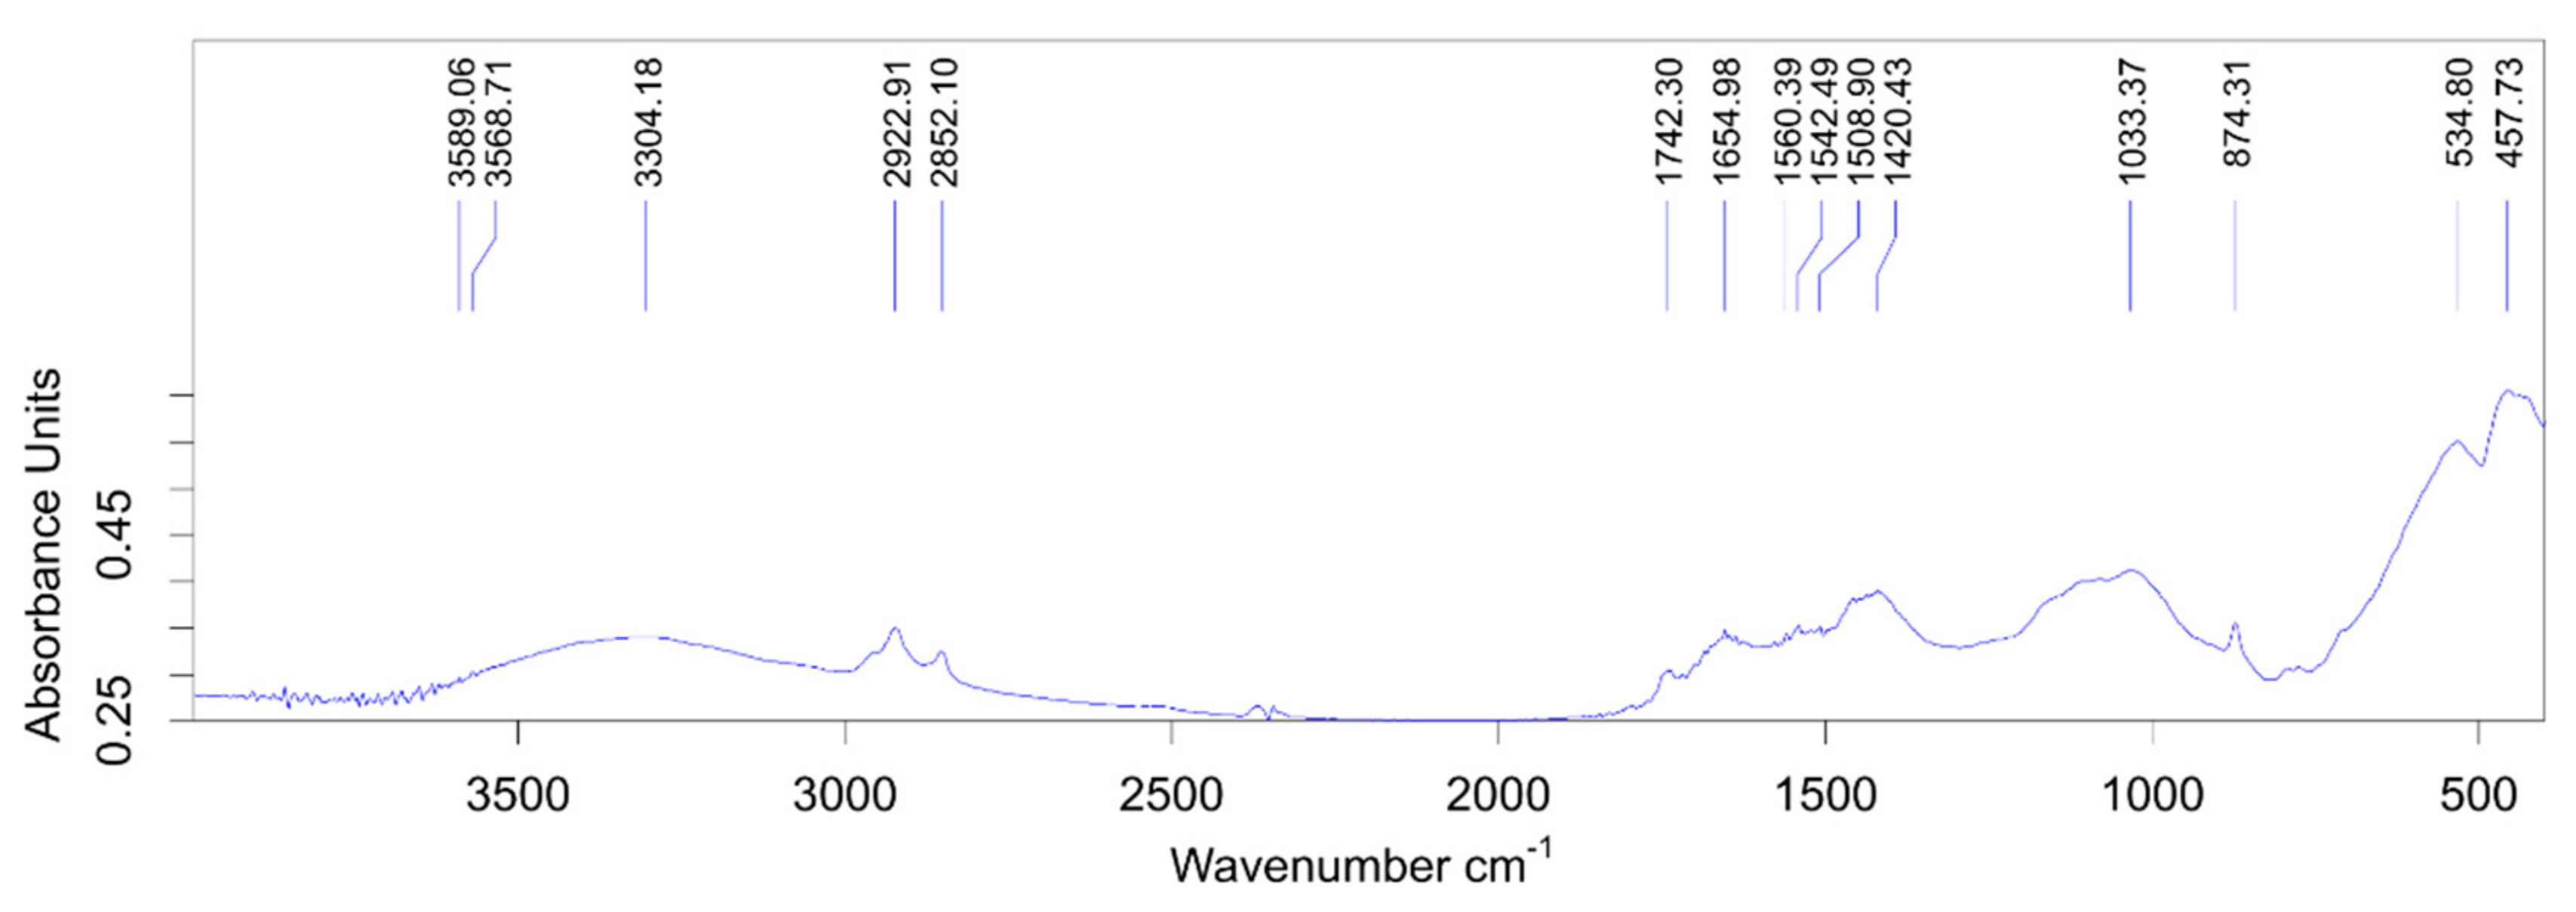
Due to the different intensity of the obtained characteristic absorption bands (
Figure 10 and
Figure 11) in the mid-IR range, two sub-wavelength ranges are conditionally distinguished: high-frequency range No.1—4000–1700 cm
−1 and low-frequency range No.2—1700–400 cm
−1. The obtained data are presented in a graphical dependence of the absorbance units (%) on the wavenumber (cm
−1).
The IR spectra of manganese hydroxides, depending on their degree of crystallinity, are represented either by single broadband or by clear bands in the range from 425 to 530 cm
−1 due to the Mn–O bonds in the octahedron [Mn
4+O
6], as well as in the region from 3100 to 3500 cm
−1 by the valence vibrations of OH bonds [
32,
33]. The spectra of the studied samples are represented by complex broad bands that are practically not split into separate maxima. It is quite difficult to quantify the ratio of various manganese minerals according to infrared spectroscopy data. Diffractograms record the most well-crystallized phases, IR spectra characterize the sample in the near-order region and register both crystalline and amorphous components.
In the high-frequency IR range No.1, there are characteristic bands of sorbed and crystallized water molecules: 3431–2900 cm
−1, 2360–2350 cm
−1—intra- and intermolecular valence vibrations, and 1660–1640 cm
−1—deformation vibrations of hydroxyl –OH groups [
34]. The shift of the valence band –OH to 3400 cm
−1 is associated with the predominance of a weaker degree of hydrogen bonding in the water structure [
35]. The appearance of low-intensity bands in the region of 2800 cm
−1 is also caused by oxidation processes [
36].
The samples of Kazakhstan origin are well moisture-saturated. The greater presence of oxide compounds was recorded in samples since they belong to oxidized manganese ores.
Identification of the low-frequency range No.2 is difficult due to a significant number of characteristic bands of manganate, phosphate, carbonate, silicate, and sulfate groups (less often, wolframite groups). Their superposition and abnormal displacement are due, firstly, to their mutual influence and, secondly, to the presence of manganese minerals, which are directly proportional to the quantitative content.
In oxidized ores, as a rule, the carbonate groups have a fairly clear range of characteristic absorption bands in the range of 1470–1420 cm
−1 [
31]. A fairly clear picture of the IR spectrum is observed for the sample of the Bogach deposit (
Figure 10), wherein the region of 1508–1420 cm
−1, there is a band of medium intensity corresponding to manganocalcite and rhodochrosite.
An equally intense band of orthophosphoric and phosphate groups is identified in the middle region of range No.2 and corresponds to the value of 1033 cm−1. The revealed patterns are in good agreement with the results of the X-ray phase analysis.
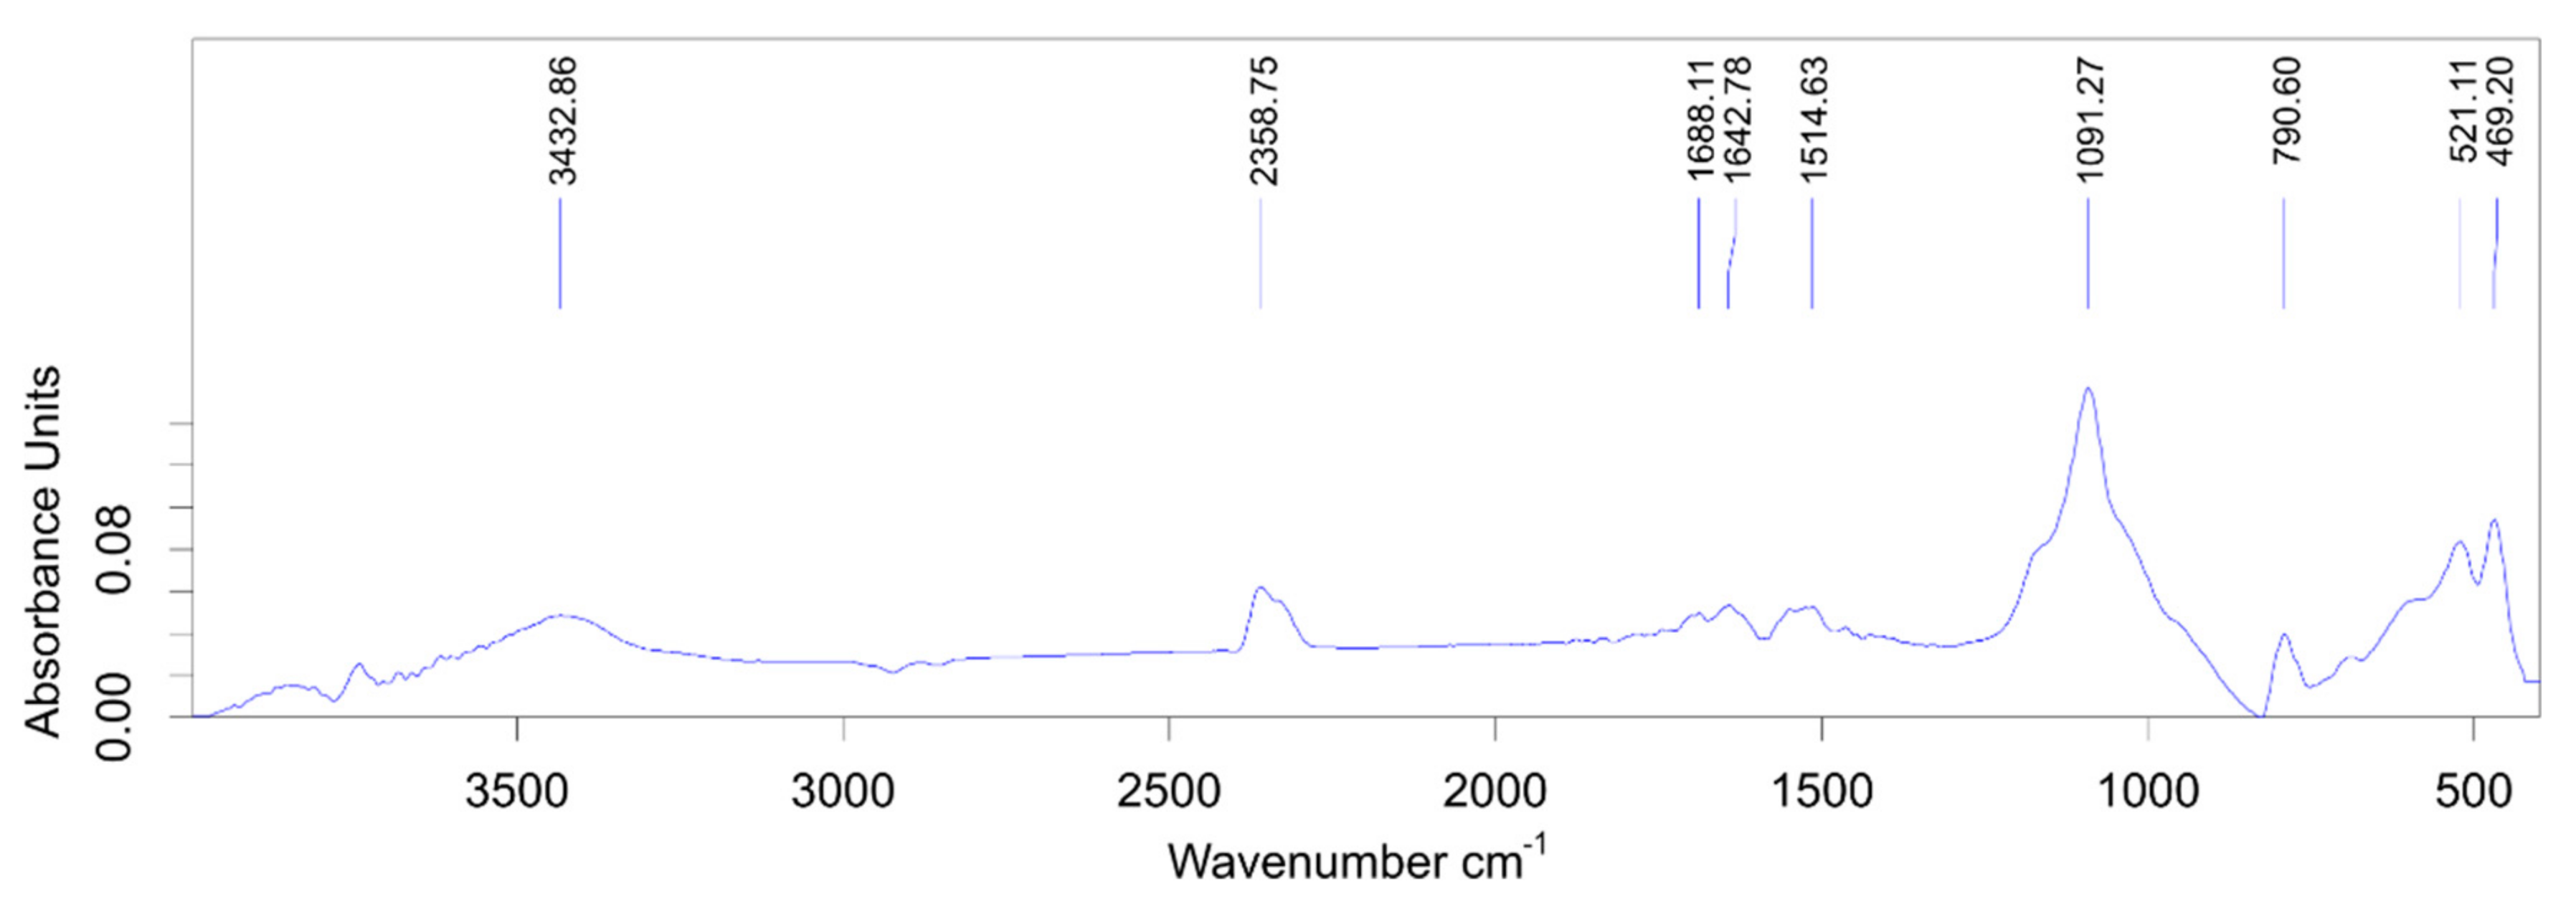
A detailed study of the sample from the Zhaksy deposit shows a slightly different picture.
Figure 11 shows the areas of deformation vibrations of carbonate groups, but their content is negligible. The presence of a pronounced peak with high intensity at a wavelength of 1090 cm
−1 is also identified as valence vibrations of the carbonate groups of the manganese mineral—pyrolusite.
This pattern is also due to the presence of a large amount of quartz and manganese silicates: braunites, rhodonites, and manganese-containing garnets. It is necessary to consider that the content of iron, its oxide, and silicate forms is maximum for Zhaksy manganese ore.
The first half of the low-frequency range No. 2 (800–400 cm
−1) is most characteristic of the deformation vibrations of the same salts and the metal-oxygen valence vibrations in the crystal basis of oxides, including Mn
xO
y [
37].
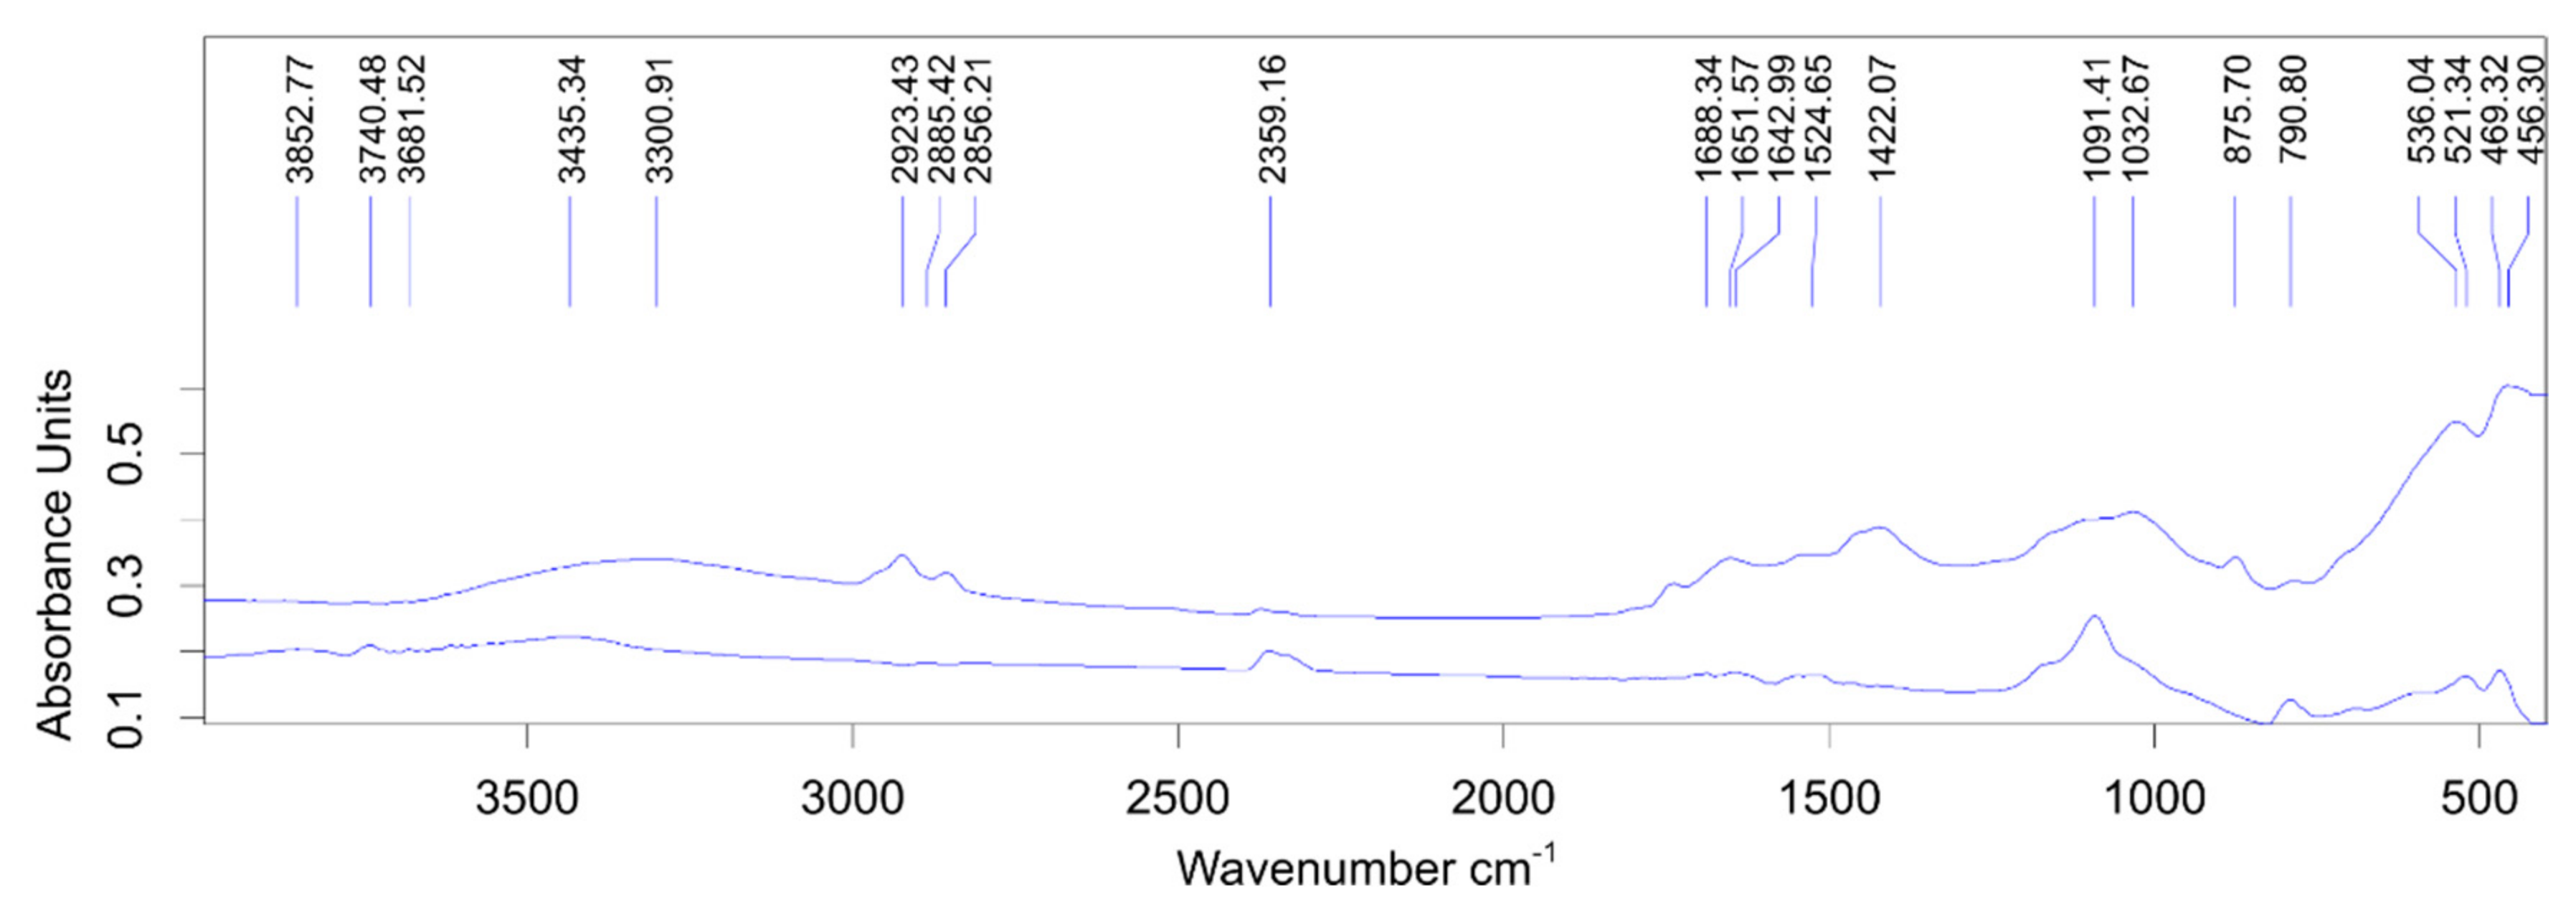
The most common manganese dioxide (+4) corresponds to a peak in the region of 560 cm
−1 [
38]. In studied manganese ores, it is also present in its less oxidized form (oxidation state +2 and +3)—hausmannite (536–521 cm
−1), psilomelane, and manganite (
Figure 12).
When overlay the IRS of ore samples, a difference in the quantitative content of manganese minerals was found: pyrolusite, manganite and psilomelane fractions, which is expressed in different intensity of the absorption bands, but according to the specific presence, combination, and position of the characteristic absorption bands, it is necessary to conclude that they are present in the composition of the samples under study.
4. Conclusions
The findings obtained do not contradict and are in good agreement with the literature data regarding that Kazakhstan raw materials are classified as medium and low in terms of the manganese mineral content. The mineral matter in the Bogach deposit ore mainly consists of hollandite, cryptomelane, braunite, calcite, bixbyite, quartz. The Zhaksy deposit ore includes quartz, hollandite, bixbyite, pyrolusite. In this sample content of Mn-containing minerals is lower than in the Bogach deposit, only 54.5%. That is reflected in the elemental content of studied ores. Therefore, Bogach ore includes (wt.%) C(10.68), O(32.00), Mn(43.26), Ca(6.36), Si(3.51), Na(0.52), Al(1.13), Mg(0.69), K(1.85). The elemental content of Mn in Zhaksy ore is two times lower. Zhaksy ore includes (wt.%) C(23.77), O(32.1), Mn(21.81), Si(10.52), Al(5.13), K(1.21), Fe(5.47). The obtained data of the conducted spectral analysis indicate that both samples represent a polymineral heterogeneous structure.
The identity and homogeneity of the morphology of the surface and sub-layers of the samples, their nanoscale characteristics during electronic scanning provide a basis for differentiating the samples according to their component composition, depending on the source of origin. Thus, by the content of Fe, the Bogach ore is related to manganese ores with a significant predominance of Mn over Fe. So, the coefficient Mn/Fe for these ores is usually varied from 30 to 15. At the same time, the Zhaksy ore belongs to the group of ferromanganese ores, where Fe is included in comparable or even equal amounts to manganese. Mn/Fe in this ore sample is approximately 4.
Iron in manganese ores is a useful impurity in smelting relatively poor Mn alloys, but for alloys with high manganese content, its amount in ores is limited; the richer it is manganese alloy, the lower the iron content in the ore should be. So, the presence of Fe in Zhaksy ore as a poor one is not an issue, but a significant amount of quartz can be a slag-forming component. With a high level of slag formation, the loss of manganese increases since it tends to partially pass into the slag in the form of a silicate phase. A feature of Mn ores of the Zhaksy deposit is the minimal content of harmful impurities such as P, S, and non-ferrous metals.
The Bogach ore as an oxide ore can be used without preliminary concentration for industrial use. As usual, manganese ores with Mn-Fe total content of 40–50% are massive ores from ore bodies, characterized by high capacity and well endurance of ore. The Zhaksy ore can be used in metallurgy only with concentration and is related to the class of easily beneficiated ores, which can easily be beneficiated without ragging through trommelling or washing with jigging.
Thus, the Bogach ore is related to second grade and can be used for smelting of silica manganese of II and III grades. The Zhaksy ore belongs to the fourth grade of ore and can be used for smelting of silicospiegel because it is a poor of Mn and more silica ore in comparison to manganese ore grades used for production of ferromanganese or spiegel.
Conducted research allows to conclude, that by phase-elemental content the Bogach ore can be used for obtaining trimanganese tetraoxide (hausmannite) pigment. Thus, manganese ores from West Sumatera deposit (Indonesia) are known as a raw material for trimanganese tetraoxide production by top-down method using grinding with a milling tool and high-temperature sintering (1000 °C) [
27]. At room temperature the West Sumatera ore sample included 3 types of manganese oxide phase—pyrolusite, braunite, and coesite, which is similar to content of Bogach ore. Though the elemental content of Mn is higher—till 84%. Overall, the process of obtaining the required mineral phase can be controlled with variation of sintering mode.


 ,
, 


