
Surface Acoustic Wave-Based Flexible Piezocomposite Strain Sensor


1
Department of Aerospace Engineering, Embry-Riddle Aeronautical University, Daytona Beach, FL 32114, USA
2
Department of Electrical Engineering and Computer Science, Embry-Riddle Aeronautical University, Daytona Beach, FL 32114, USA
*
Author to whom correspondence should be addressed.
Crystals 2021, 11(12), 1576; https://0-doi-org.brum.beds.ac.uk/10.3390/cryst11121576
Submission received: 23 November 2021
/
Revised: 13 December 2021
/
Accepted: 14 December 2021
/
Published: 17 December 2021
(This article belongs to the Special Issue Piezoelectric Sensors Application)
Abstract
:A surface acoustic wave (SAW), device composed of polymer and ceramic fillers, exhibiting high piezoelectricity and flexibility, has a wide range of sensing applications in the aerospace field. The demand for flexible SAW sensors has been gradually increasing due to their small size, wireless capability, low fabrication cost, and fast response time. This paper discusses the structural, thermal, and electrical properties of the developed sensor, based on different micro- and nano-fillers, such as lead zirconate titanate (PZT), calcium copper titanate (CCTO), and carbon nanotubes (CNTs), along with polyvinylidene fluoride (PVDF) as a polymer matrix. The piezocomposite substrate of the SAW sensor is fabricated using a hot press, while interdigital transducers (IDTs) are deposited through 3D printing. The piezoelectric properties are also enhanced using a non-contact corona poling technique under a high electric field to align the dipoles. Results show that the developed passive strain sensor can measure mechanical strains by examining the frequency shifts of the detected wave signals.
1. Introduction
Surface acoustic wave (SAW) sensors belong to a class of microelectromechanical systems (MEMS) that have been growing rapidly to sense and detect physical phenomena, such as strain, pressure, temperature, and chemical sensing [1,2,3,4,5,6,7], in various scientific and engineering fields, including the aerospace and bio-medical fields, etc. [8,9]. The exceptional ability of SAW sensors is based on the capability of the piezoelectric materials used to convert electrical energy into mechanical deformation and vice versa, which plays a vital role in, for instance, aerospace structural health monitoring (SHM) applications [10]. Mechanical strains for SHM applications can commonly be measured using strain gauges or piezoresistive sensors; however, they may not be suitable for high-frequency large strain applications and harsh environments due to their low sensitivity and drift errors over time [11]. To overcome these challenges, a flexible thin nanocomposite SAW sensor is developed in this paper to measure large mechanical strains. The basic coupled constitutive piezoelectric equation for the measurement of strain or electric displacement in the material is given by the following:
where S, T, E, and D are the strain, stress, electric field, and electric charge density displacement components, respectively. The piezoelectric strain coefficient d, the elastic compliance s, and the relative permittivity ε, measured at a constant electric field, are associated with strain measurements [12].
A two-port SAW sensor is an integrated device consisting of the input interdigital transducer (IDTs) that generates the Rayleigh waves, the delay line or the sensing layer piezoelectric substrate where the waves propagate, and the output IDTs that detects the changes of wave phenomenon. IDTs have raised the development of microsensors by enabling the mechanical wave formation in a piezoelectric substrate when an electric field is applied. The selection of an appropriate piezoelectric substrate material plays a vital role, which depends on its compatibility, durability, molecular structure, and electrical properties during sensor development. Polyvinylidene fluoride (PVDF), an inorganic, semi-crystalline, thermoplastic fluoropolymer, being flexible, exhibits excellent electromechanical coupling with five distinct crystalline forms of different chain arrangements [13]. However, polymer-based piezoelectric materials have low dielectric constants and piezoelectric charge coefficients, which limits their wave generation efficiency. These properties can be increased by adding piezoelectric ceramic materials, such as lead zirconate titanate (PZT) [14], barium titanate (BaTiO3) [15], and calcium copper titanate (CCTO) [16], that are well known for their excellent dielectric constants and piezoelectric coefficients. Additionally, carbon nanotubes (CNTs) are considered as an ideal candidate as nano-fillers because of their exceptional mechanical, electrical, and thermal properties [17]; although, excessive addition of CNT fillers could reduce the breakdown strength and reach a percolation threshold [18] with more than 2 wt. % influencing the piezoelectric field. Even though these fillers exhibit higher dielectric properties, they may not be suitable for flexible structures, owing to their brittleness and rigid fabrication process. This challenge can be circumvented by integrating the polymer with inorganic micro- and nano-scale fillers resulting in a polymer-based composites, which is a new class of materials, exhibiting both flexibility and piezoelectric properties, that can expand the range of applications.
The filler-added polymer composite has the simplest form of 0–3 polymer–ceramic connectivity, where the fillers are uniformly dispersed in a three-dimensional continuous polymer matrix. In addition, this composite can be tailored as per specific requirements with ease of fabrication [19,20] through various manufacturing processes, such as compression molding, tape casting, spin coating, and hot-pressing. In this paper, the substrate is fabricated using hot-press, chosen among others as it combines both melting and stretching, and IDTs are printed using direct digital manufacturing technique, a production paradigm of Industry 4.0 [21]. The polar crystalline phase transformation can be obtained through mechanical stretching and polarization at a given electric field [22,23].
The design of IDTs plays a vital role in strain measurement since the coupling between the transducer and piezoelectric substrate determines the effectiveness of wave propagation, and it dictates all frequency responses and characteristics of signals. In this paper, a comprehensive study on the effects of different micro- and nano-fillers, added to the PVDF polymer to improve piezoelectric properties, is described. This paper first describes the development of thin piezo-composite, the design of IDTs with analytical response, and deposition, through additive manufacturing. Then, the fabricated SAW sensor with its structural, morphological, and thermal study, along with piezoelectric property measurements, are discussed. The mechanical strain measurement is carried out by investigating the output signal characteristics, such as frequency shifts, due to changes caused in the piezoelectric substrate.
2. Fabrication Process and Experimental Setup
The fabrication process of the piezocomposite sensor, including the solution preparation and enhancement of dipole arrangement through the corona poling technique, are discussed.
2.1. Materials and Phase Information
To fabricate a thin piezo-composite substrate, selected PVDF powder (Sigma Aldrich, St. Louis, MO, USA, #24937-79-9), having average particle size of 3-10 µm, average molecular weight Mw ~534,000 g/mol, and density of 1.74 g/mL is used to make a polymer matrix. The fillers used were PZT powder (American Elements, Los Angeles, CA, USA, # 12626-81-2) with APS ≤ 5 µm, molecular weight Mw ~426.29 g/mol, and density of 7.5–8 g/mL; SWCNT (US research Nanomaterials, Houston, TX, USA), with an average diameter of 1.1 nm and lengths of 5–30 µm; and CCTO (Bonding chemicals, Katy, TX, USA, #535616), with a particle size of 1~5 µm, Mw ~614.18 g/mol, and density of 4.7 g/mL—selected due to their high dielectric constant nature and unique characteristics. The solvent used to disperse the micro- and nano-fillers and to dissolve PVDF was dimethyl sulfoxide (DMSO) (Sigma-Aldrich, St. Louis, MO, USA, #67-68-5) as PVDF was insoluble in water. DMSO, a polar solvent, was selected among other counterparts, such as dimethylformamide (DMF) and triethylphospate (TEP), due to its high boiling point and distinct dielectric constant value with an optimal set of 0–3 composite encapsulated with solvent that contributes to overall electrical response [24,25].
A semi-crystalline PVDF is a linear non-centrosymmetric polymer with four major possible polymorph phases, i.e., α (trans–gauche-trans-gauche’, TGTG’, nonpolar), β (all trans, TTTT, polar), δ (TGTG’, polar), and γ (T3GT3G’, polar) phases, where α and β phases are most common. Among them, the essential thermodynamically stable form, regarding the piezo-, pyro-, and ferro-electric properties, is the β phase (zigzag configuration), such that the crystalline region is composed of carbon backbones with fluorine on one side and hydrogen on the other side. The β phase can induce a significant dipole moment, whereas the α phase has semi-helical antiparallel dipole conformation, which is aligned in such a way that all dipole moment cancels each other. Materials spectrum measurements using Fourier transform infrared spectroscopy (FTIR) and differential scanning calorimetry (DSC) are used to study the contribution of PVDF crystalline phases. The addition of micro- and nano-fillers, such as CCTO and CNTs [26,27,28,29], can increase the crystallization of PVDF, which improves the piezoelectric response of the sensor.
2.2. Preparation of Piezocomposite with Hot Press Method
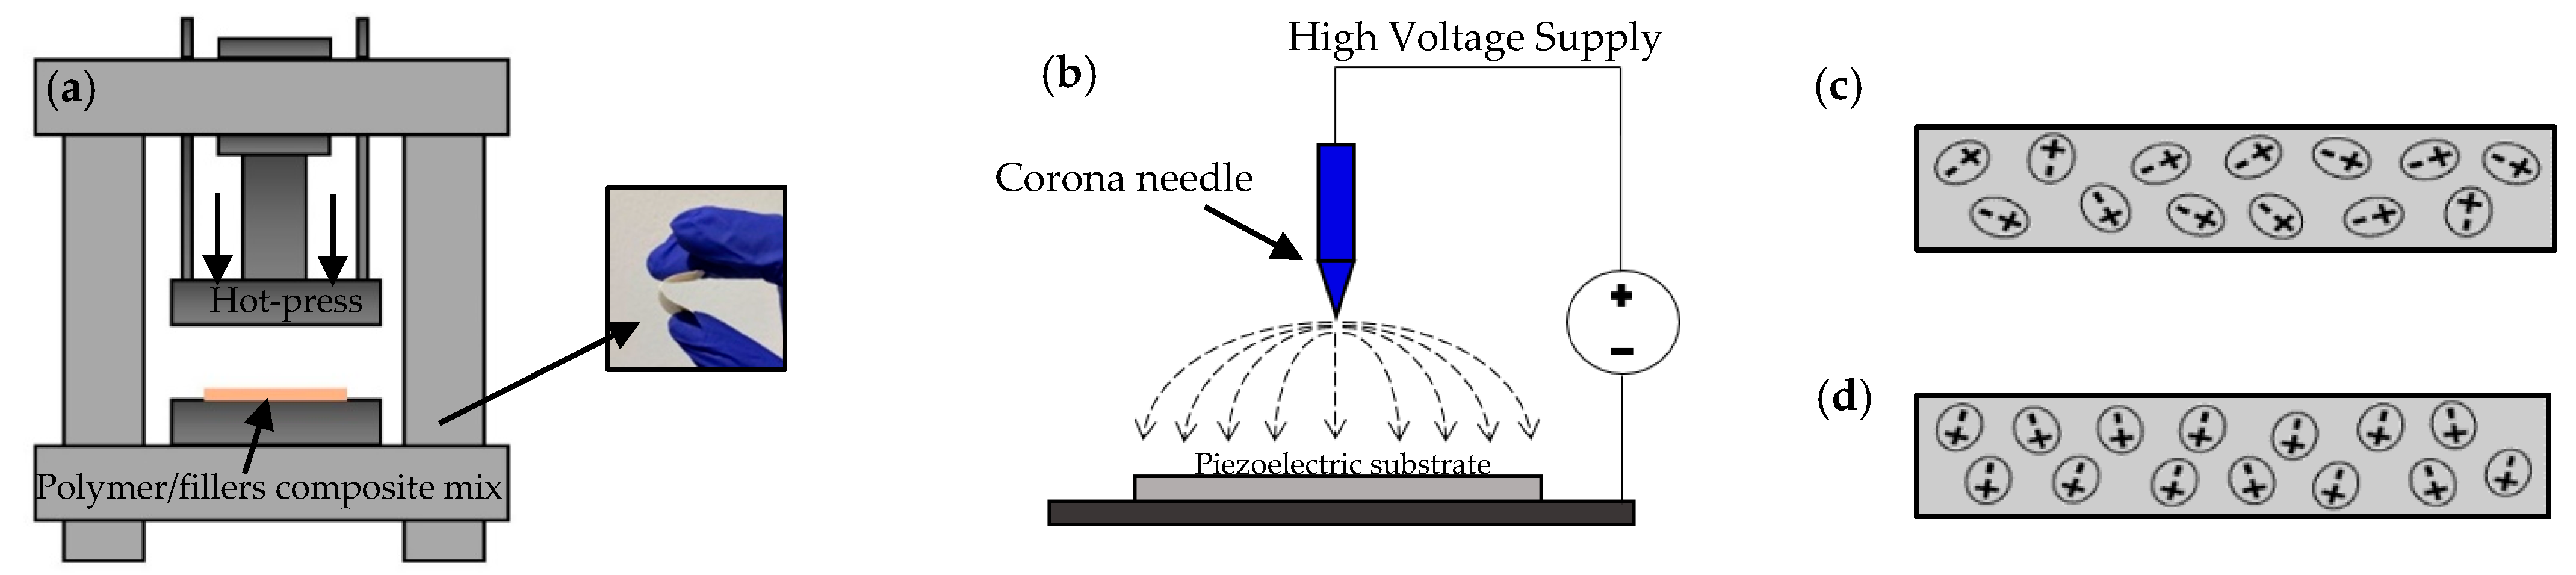
To fabricate the substrate, PVDF polymer with different ceramic and nano-fillers, such as PZT, CCTO, and CNTs, with respective wt. % proportions, were mixed using a centrifugal planetary THINKY mixer (ARM-310) at 2000 rpm for 2 min. The weighed powder mix was then dissolved in 30 wt. % of DMSO solvent, based on the formation of a coagulated blend after mixing to get uniform dispersion. Furthermore, it was subjected to a vacuum to get rid of air bubbles causing a surface defect. As mentioned earlier, the hot press technique was used owing to its ease of fabrication with its capability of optimized temperature control and pressure, resulting in a denser composite with less porosity [30,31]. The glutinous slurry was subjected to hot pressing at the temperature of 355 °F maintained for 20 min curing, attaining a flat 2 cm × 1.5 cm × 0.6 mm substrate that was further dried to remove the solvent, as indicated in Figure 1a. To control and modify the sample thickness less than 1 mm, an aluminum foil ring was implemented while curing, instead of varying the applied pressure. The curing temperature can be selected based on the melting temperature of PVDF with fillers through DSC thermogram, which is discussed in Section 4.1. The concentration of polymer and fillers can be determined based on the composition through scanning electron microscope (SEM), dielectric property enhancement, and other criteria, such as the waviness and rigidness of the fabricated substrate. A small amount of CNTs were included, based on their percolation threshold and agglomerating nature, because of a strong van der Waals force leading to poor dispersion [28,32]. PVDF polymer with different filler wt. % were prepared following the process indicated in Table 1.
2.3. Substrate Poling
Electrical polarization was required to align the dipoles in a piezo-composite substrate that becomes piezoelectrically active. Fundamentally, there are two major poling methods, namely contact and non-contact techniques. Corona poling, a non-contact technique, presents significant advantages as it eliminates surface damage through electrode contact with the sample, where the occurrence of arcing at very high voltages is less likely and uniform voltage distribution is attainable. In this technique, the electric charge was applied to the corona needle that acted as a field intensifier to ionize the gas molecules around the sample’s top surface (un-electroded surface) to create an electric field [33,34]. Variables influencing the poling efficiencies were the amount of voltage supply, poling time, and distance between the corona tip as well as sample surface [35]. A high voltage of 12 kV–15 kV was applied to the sample that was placed 2~3 cm distance from the needle tip for 30 min. Piezoelectric property measurement was compared before and after poling of the different combinations selected. The schematic of corona poling is shown in Figure 1b.
3. Interdigital Transducers Deposition through DDM
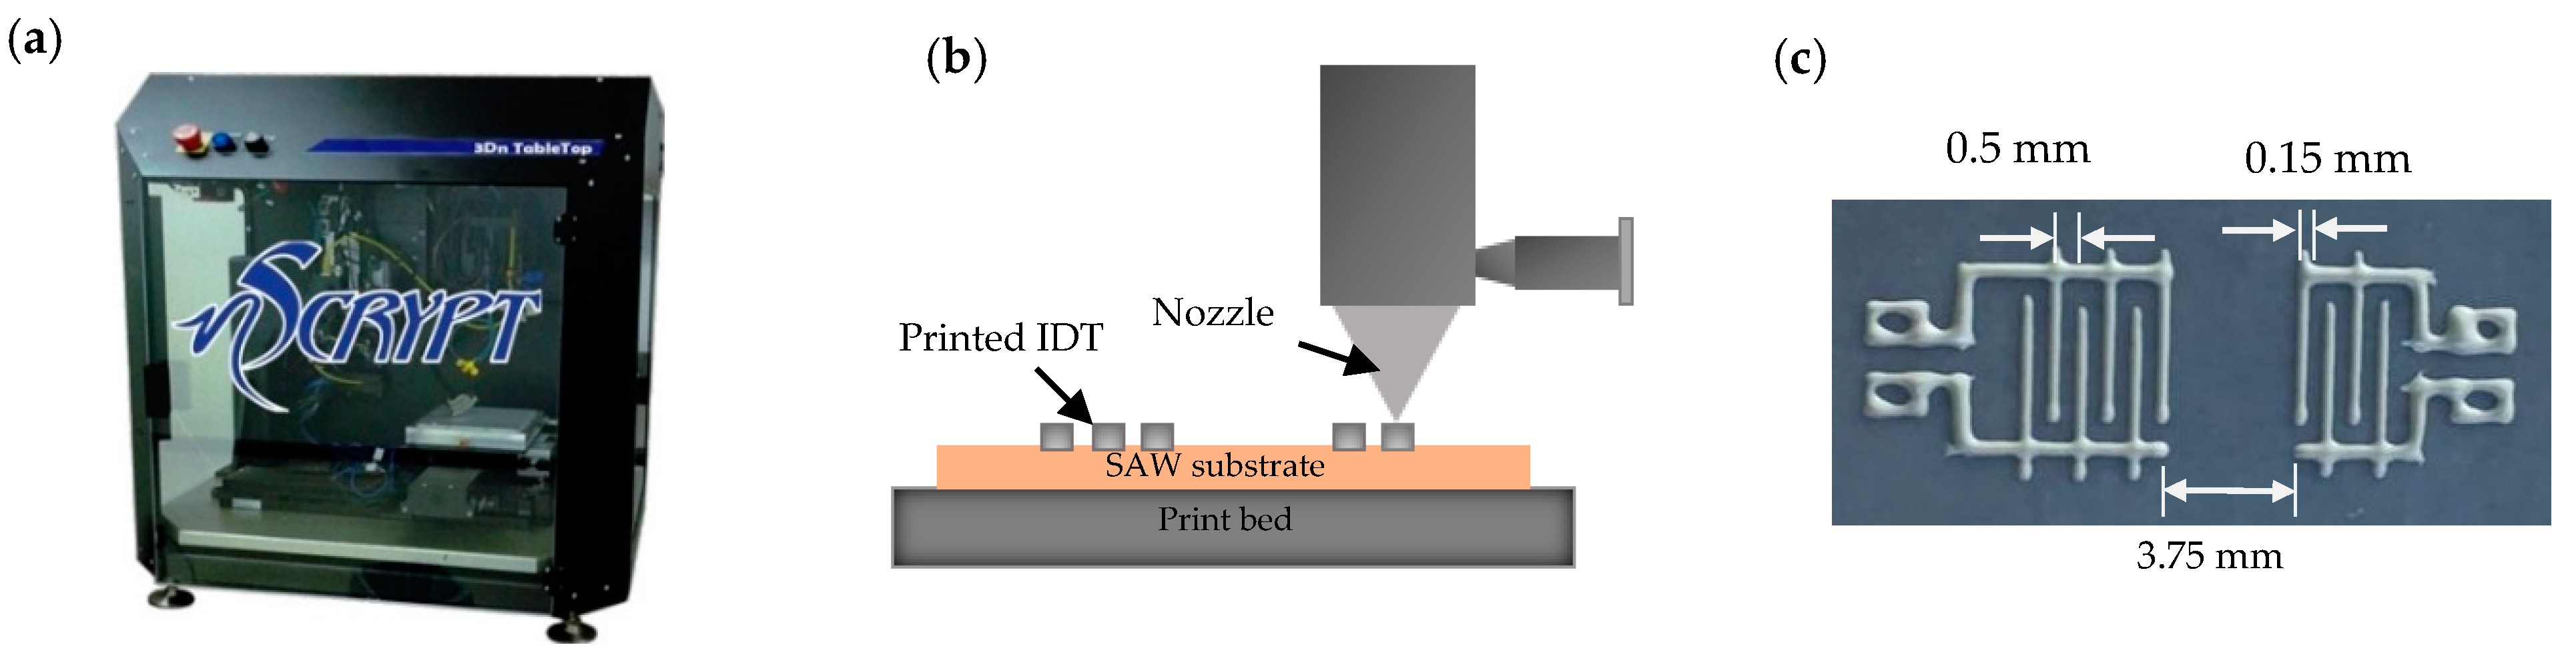
Direct digital manufacturing (DDM) is the process of printing the product directly from the designed CAD model. The design model can be modified on demand by minimizing waste with quick prototyping in cost-effective means with good adhesion of conductive ink and higher sustainability over other traditional cleanroom fabrication process [21]. A 3Dn series tabletop printer, shown in Figure 2a, combining the capabilities of FDM and micro-dispensing with high precision motion, was used to print the designed IDT nScrypt file. An IDT design with 3 input pairs and 2 output pairs had the finger width of 0.15 mm and 0.5 mm spacing between the adjacent fingers placed 3.75 mm apart with 3.5 mm acoustic aperture. A DuPont CB028 conductive silver paste was printed, as shown in Figure 2b, using a nozzle of 125 µm inner diameter, 20 mm/s deposition speed, and ejection pressure of 8 psi, maintained at a printing height of 100 µm from the substrate top surface. Figure 2c shows the conductive IDT pastes printed without discontinuity and coupled appropriately with the piezoelectric substrate.
4. Results and Discussions
4.1. Chemical and Thermal Characterization
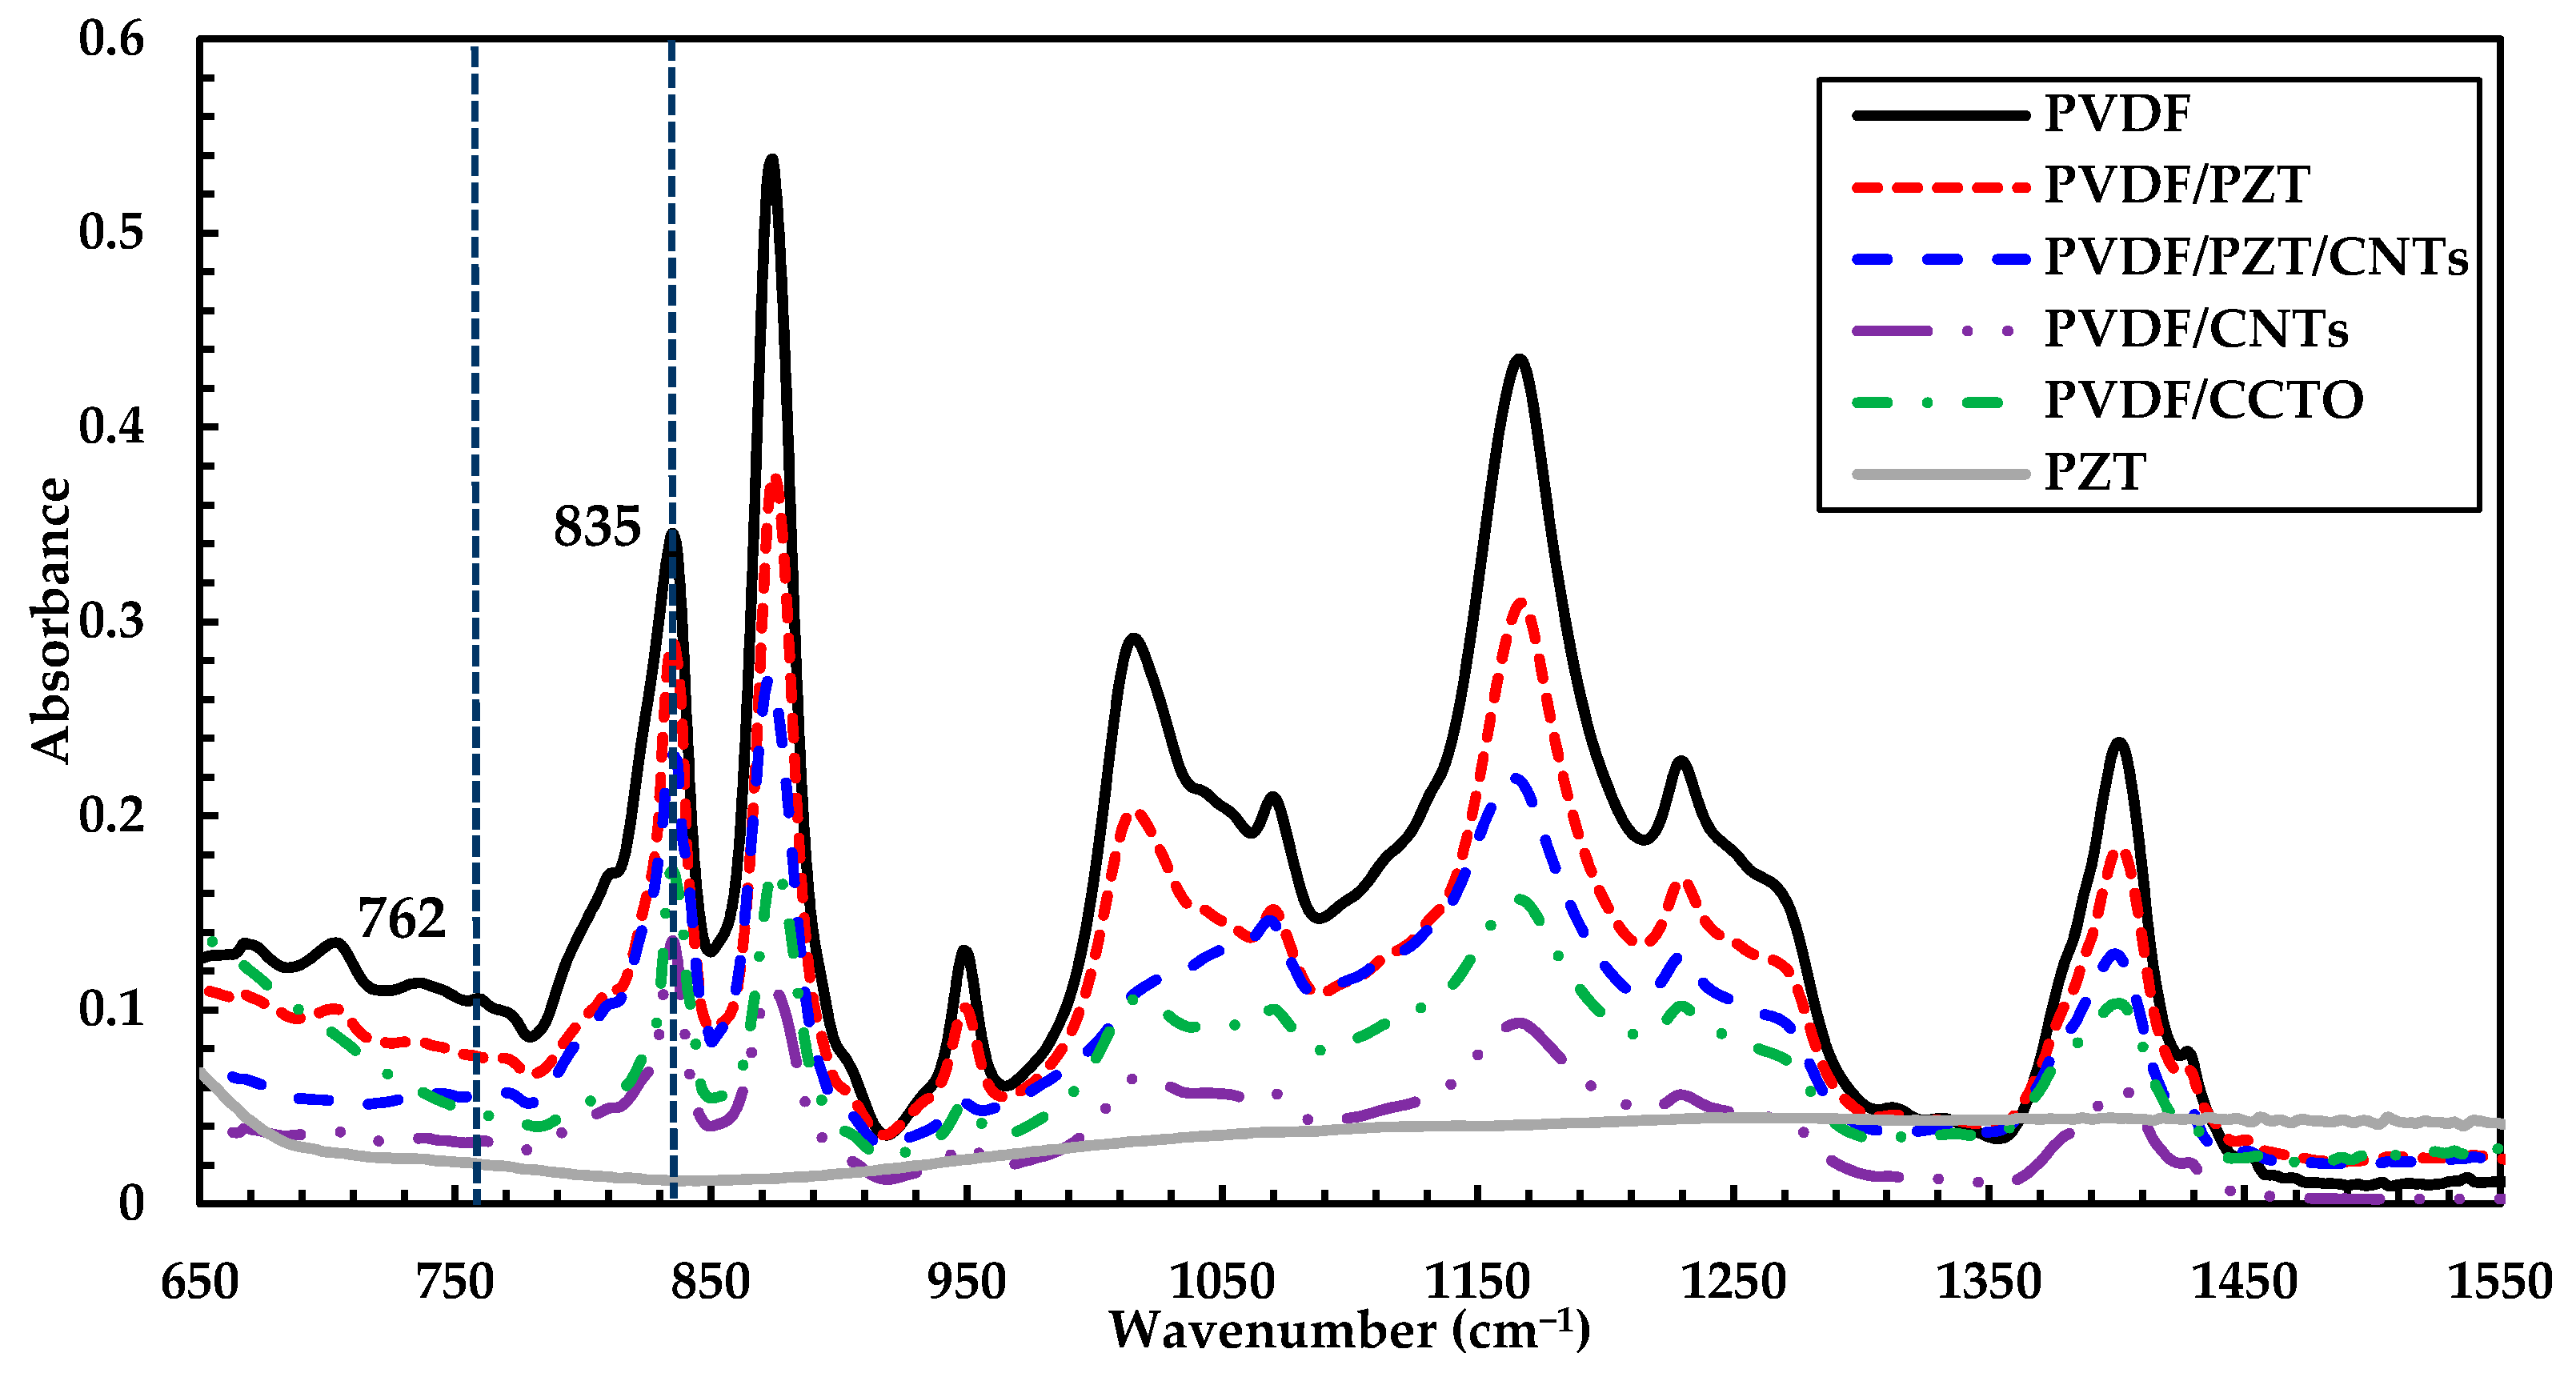
The FTIR spectra of PVDF polymer with added fillers provides information about its crystalline structure, allowing us to distinguish between the different phases. It is already known that the various peaks of phases are classified into three categories, i.e., (1) common peaks that appear in all phases; (2) peaks exclusive for one of the phases; and (3) dual peaks combining different phases. In order to analyze the effect of adding different fillers in PVDF polymer, FTIR spectra are compared for the tested samples, as shown in Figure 3. An Agilent Cary 630 FTIR spectrometer with diamond crystal was operated in the wavenumber of 650–1550 cm−1 with a resolution of 4 cm−1, and 16 scans followed with automatic background correction.
The corresponding bands confirmed the presence of α phase in the sample at 762 cm−1 (CF2 bending and rocking, 873 cm−1 (C-F stretching), and 1069 cm−1 (C-C-C bonding), whereas the characteristics bands of β phase were at 835 cm−1 (trans chain sequence CF2 stretching and CH2 rocking), 1168 cm−1 (C-C bonding), 1230 cm−1 (F-C-F bonding), 1401 cm−1 (CH2 wagging vibration), and 1427 cm−1 (CH2 bending). The experimental spectra show a close resemblance of majority peaks and a slight variation in some specific peaks due to the fact that the PVDF was formed utilizing a different technique [36,37,38,39,40].
In order to determine the fraction of β (active-polar) phase in each type of filler added to the PVDF polymer, IR absorption corresponding to bands at 762 cm−1 and 835 cm−1 was taken into account. Based on Beer–Lambert law [41,42], the relative fraction of the β phase was quantified as mentioned in Equation (3), as follows:
where Aα and Aβ are the absorbance peak intensities at the 762 cm−1 (α phase) and 835 cm−1 (β phase), respectively; kα and kβ are the absorption coefficient, the values of which are 7.7 × 104 cm2 mol−1 and 6.1 × 104 cm2 mol−1, respectively.
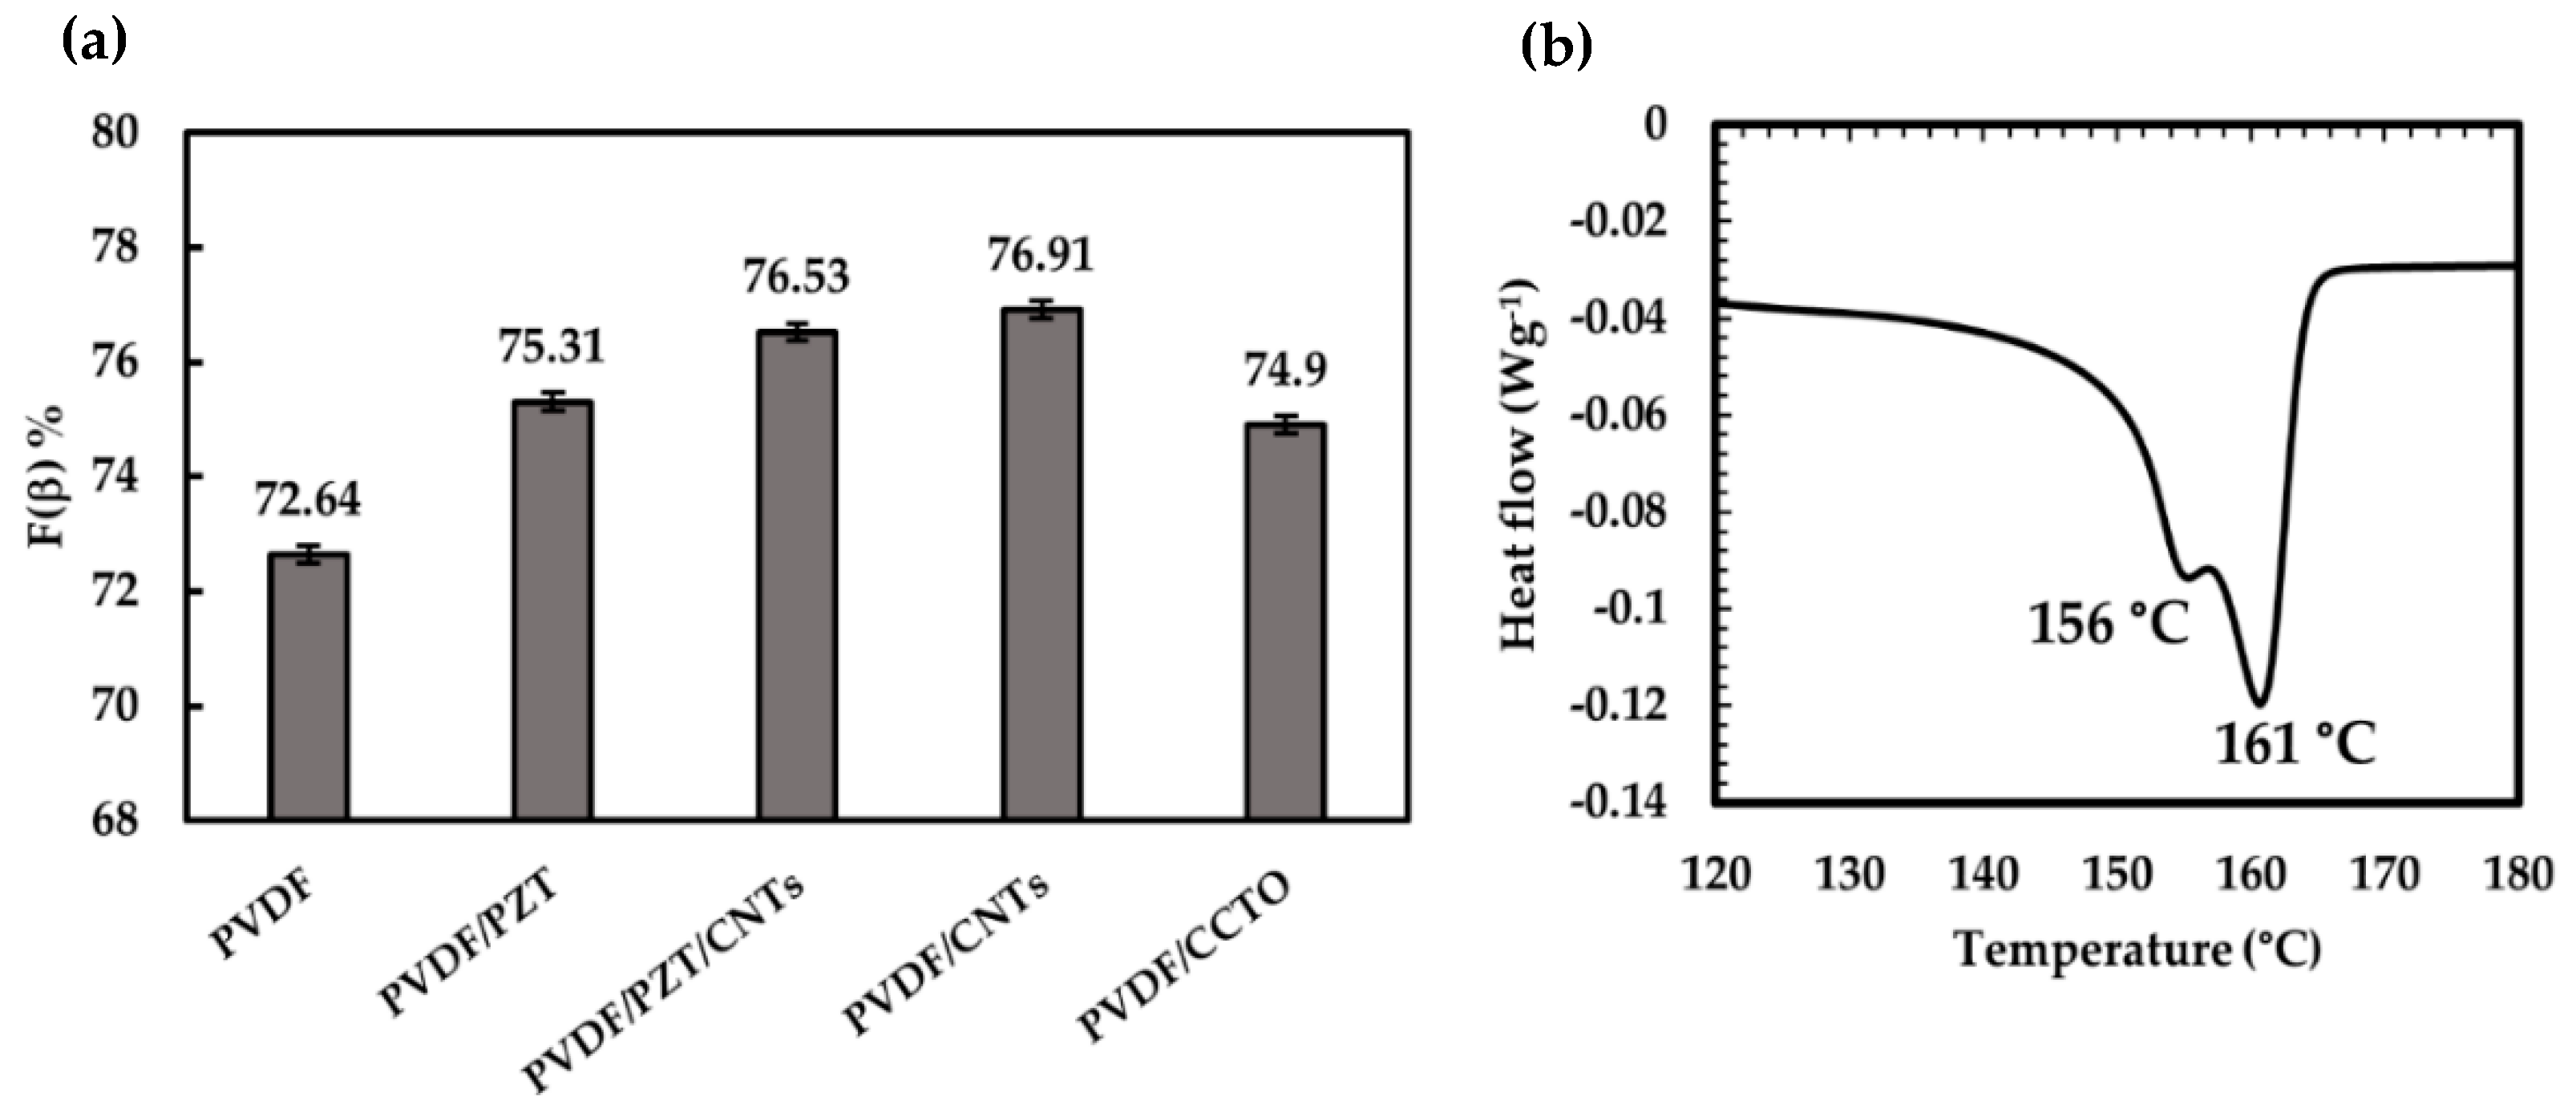
The polar phase fraction for the different composite type is listed in Figure 4a, it is evident that adding fillers to the PVDF polymer contributes in β phase enhancement. Among them, the sample with CNTs as filler had the maximum polar phase of about 76.91% after stretching through hot-press.
To evaluate the thermal properties of PVDF polymer, DSC was carried out using a Mettler Toledo calorimeter in the temperature range from 0 °C to 180 °C at a heating rate of 1 °C/min. Figure 4b thermogram shows PVDF was strongly influenced by the temperature during the melting process from 145 °C to 170 °C. It is noticed that double endothermic fusion peak occurred with 5 °C difference at 156 °C and 161 °C due to the melt recrystallization, whereas the peak belongs to α and β phases [39,43].
4.2. SEM Analysis
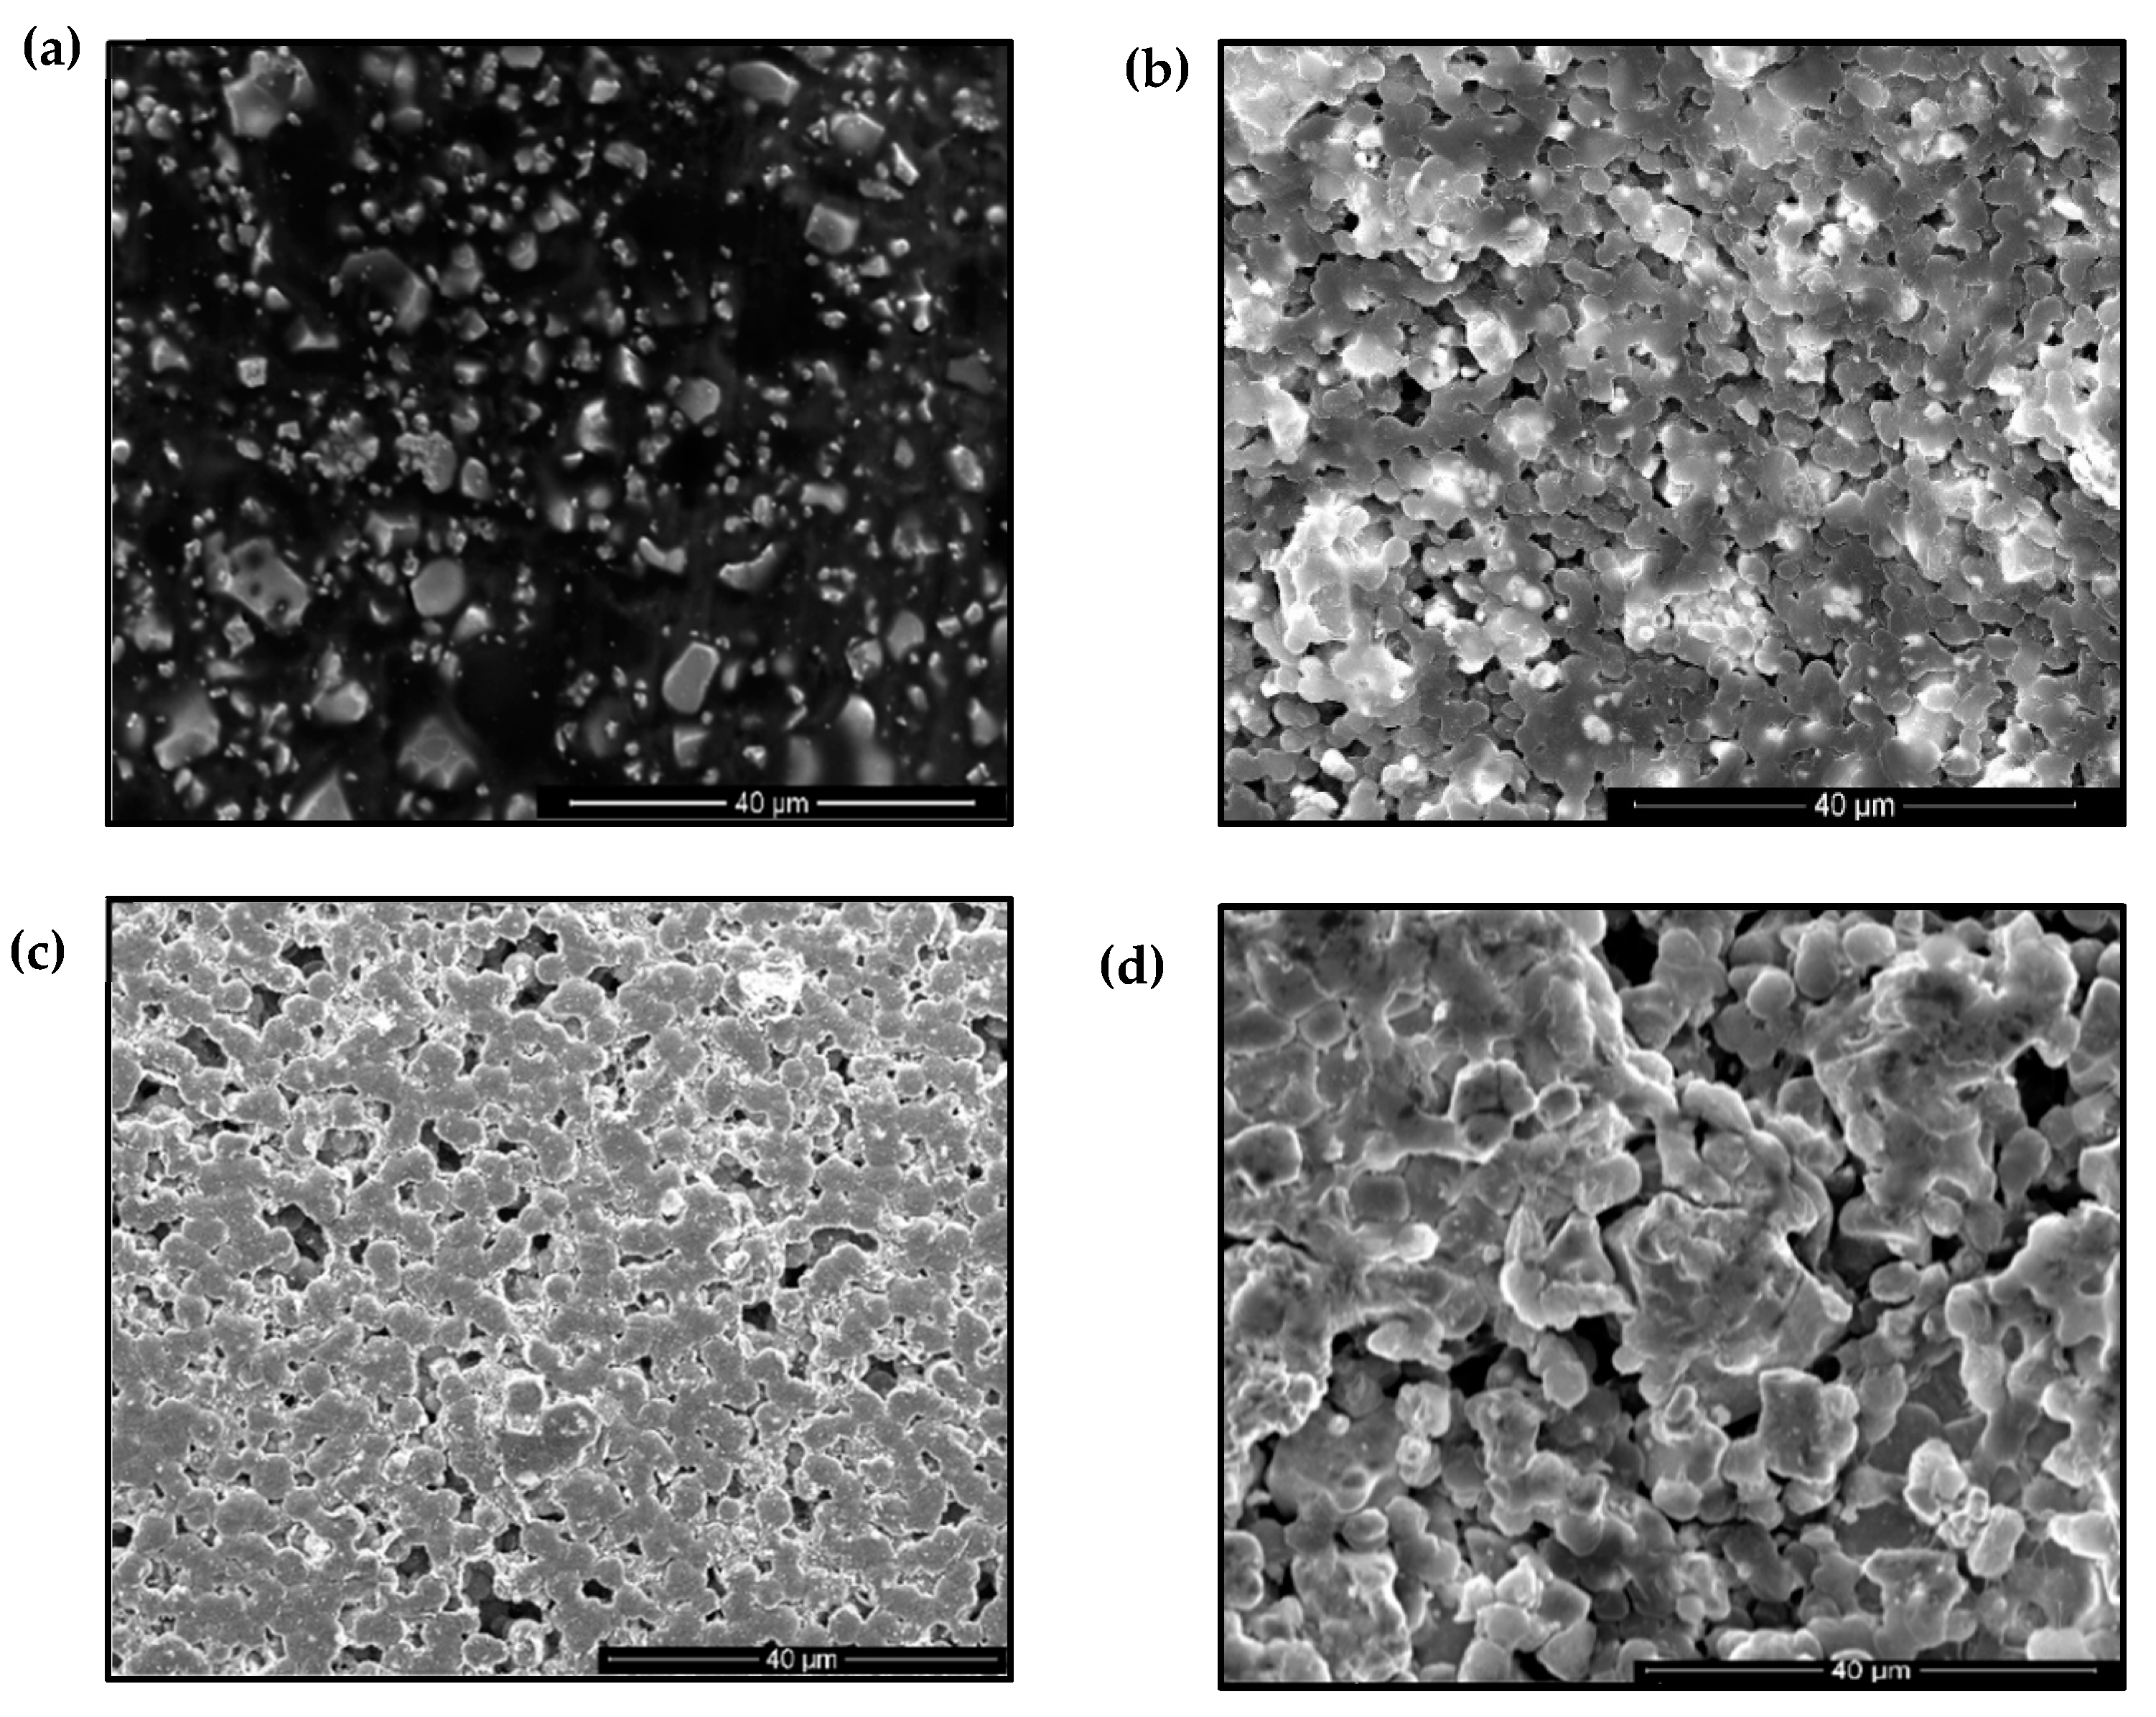
To investigate the surface morphology and homogeneity of the fillers mixed with polymer matrix, the composite was analyzed using a FEI Quanta 650 scanning electron microscope (SEM). Gold sputtering was performed on the sample’s surface for better conduction, where the micro graphical images were obtained at 25 kV. As shown in Figure 5, different wt. % of PVDF/PZT were analyzed, where the microparticles were well dispersed in the 40–60 wt. % combination, with less agglomeration, well adhered with no pores, uniform distribution, and PVDF particle with an average particle size of 3~7 µm were observed. Combinations of 80–20 wt. % and 60–40 wt. % exhibit flexibility with less stiffness, high agglomeration with reunion phenomenon, shrinking nature, and waviness not suitable for transducer deposition. Composites with less polymer matrix were fragile because of ceramic’s brittle nature. It was noticed that when the PVDF content increased, the agglomeration developed, affecting structural integrity.
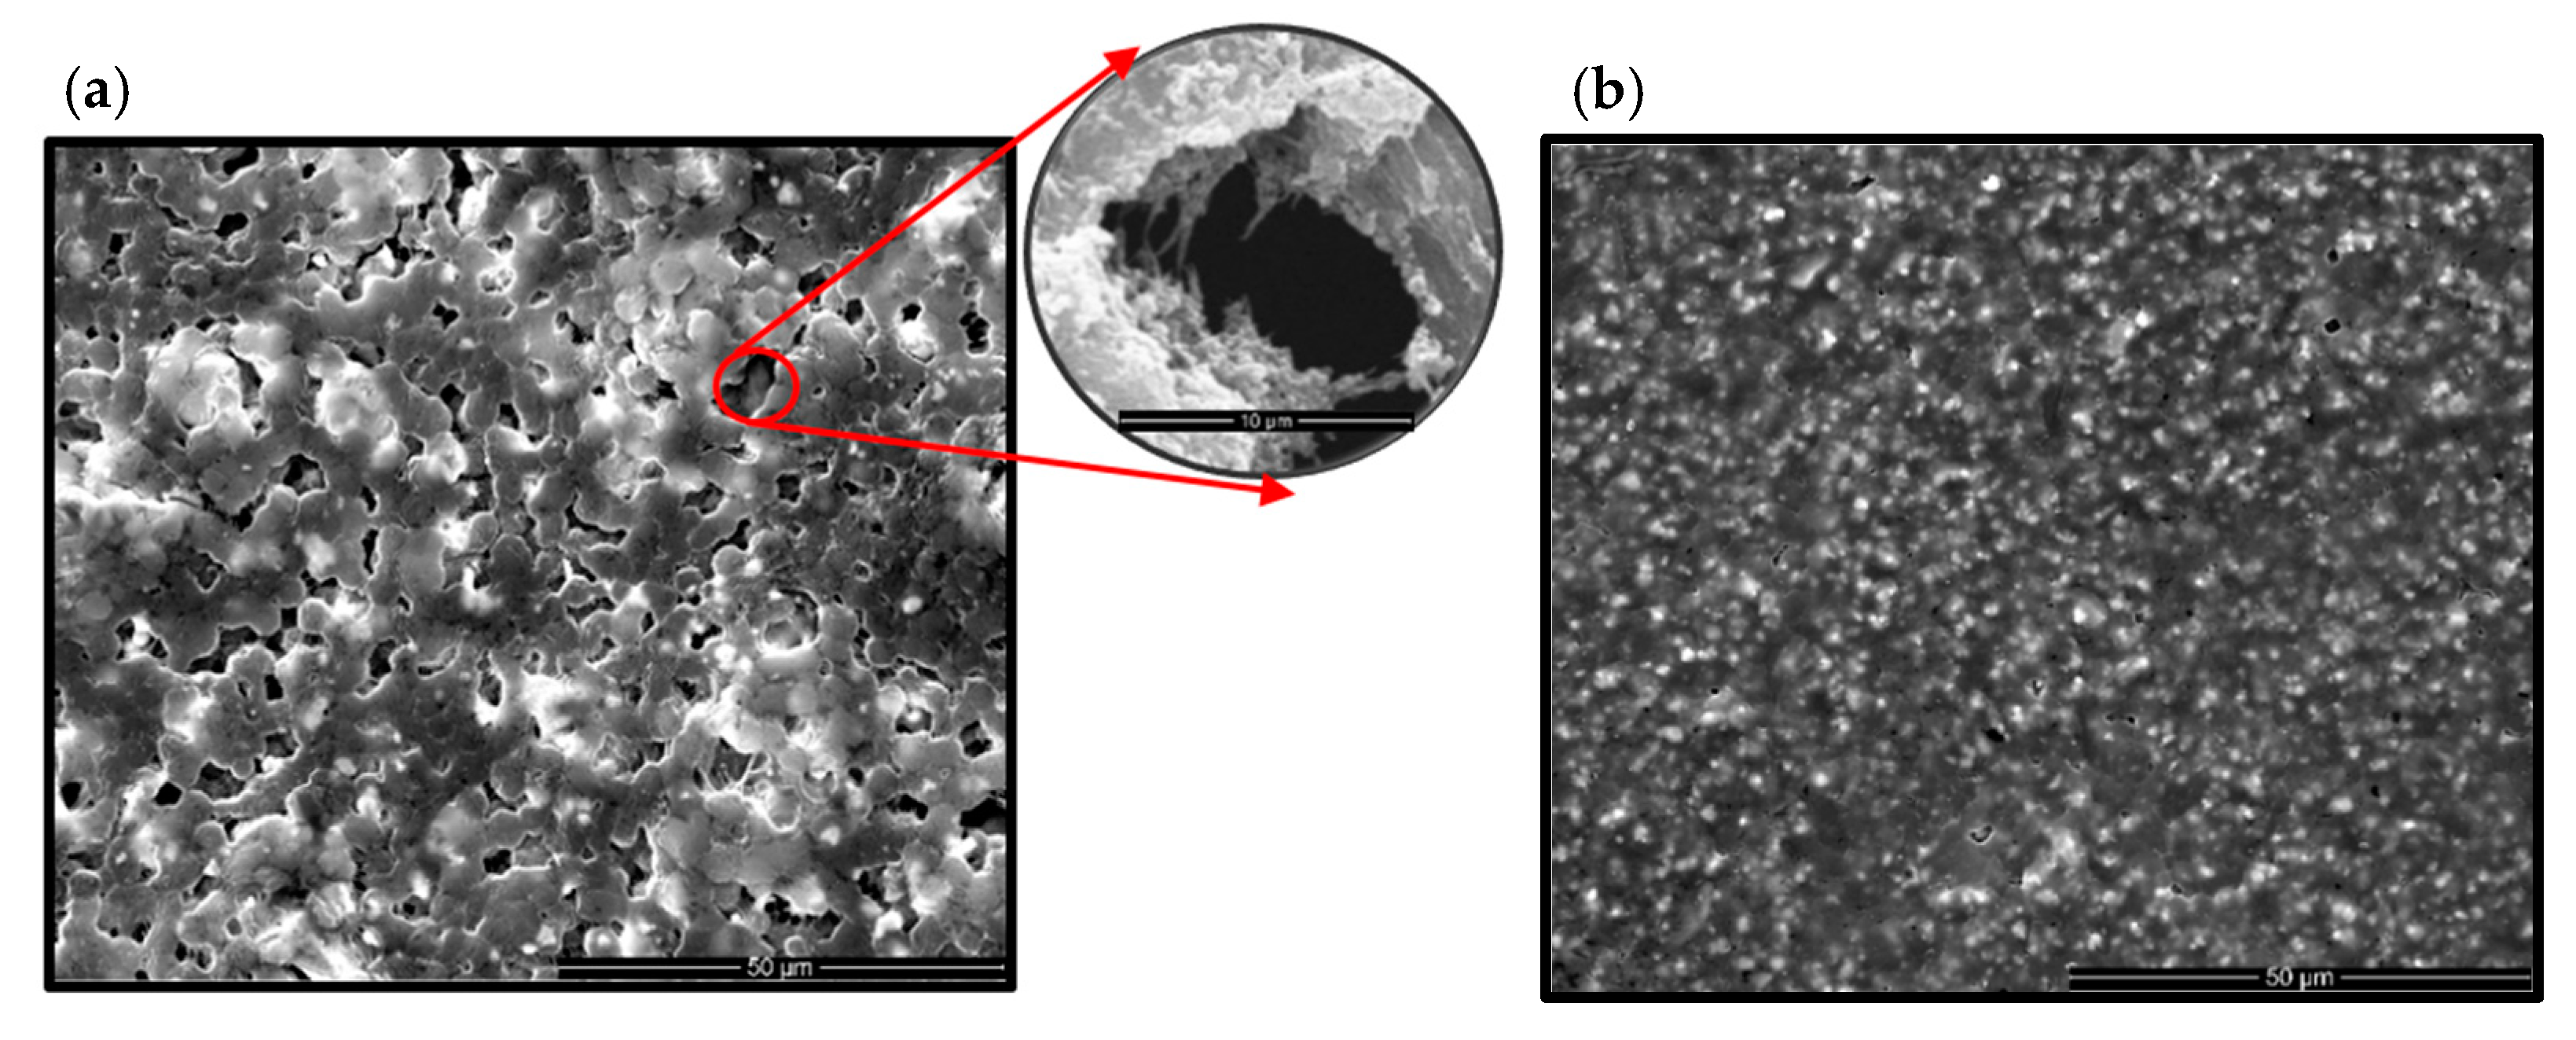
Other fillers’ micrographs, such as CCTO and CNT, were also examined, as shown in Figure 6. CNTs adhered well to the polymer matrix, exhibiting flexibility, and were stiffer than other samples. Favorable structural integrity was obtained from all the samples after hot pressing with the minimalized possibility of pores.
4.3. Effect of Micro- and Nano-Fillers in Piezo and Dielectric Properties of PVDF Polymer
A few material properties, such as piezoelectric strain coefficient (), dielectric constant (), and piezoelectric voltage constant (), that are involved in the constitutive equation for measuring the strain, govern the effectiveness of electrical energy conversion into mechanical waves and vice versa. The was measured through electric charge generated in response to the 0.25 N force applied in the thickness direction using a YE2730A piezometer. Additionally, is an essential property that enables the substrate to hold a charge for an extended period of time and was calculated using the standard relation, as follows:
where C is the capacitance (farad), measured in different frequencies using the impedance analyzer; is the dielectric constant value of free space (8.854 × 10⁻¹² F/m); A is the area of the capacitor electrode (m2); and d is the thickness of the individual piezoelectric substrate. In addition, the electric field generated by piezoelectric material per unit mechanical stress applied is given by the ratio in Equation (5), as follows:
From the measured and calculated piezoelectric properties, as listed in Table 2, it can be noticed that when fillers were added to the PVDF polymer dissolved in DMSO solvent, there was an overall increase in piezoelectric property and the maximum value was obtained in PVDF with CNTs as filler. Increase in after polarization can be seen in Table 3, where the effect of corona poling aligned the dipoles properly along the thickness direction with the electric field applied.
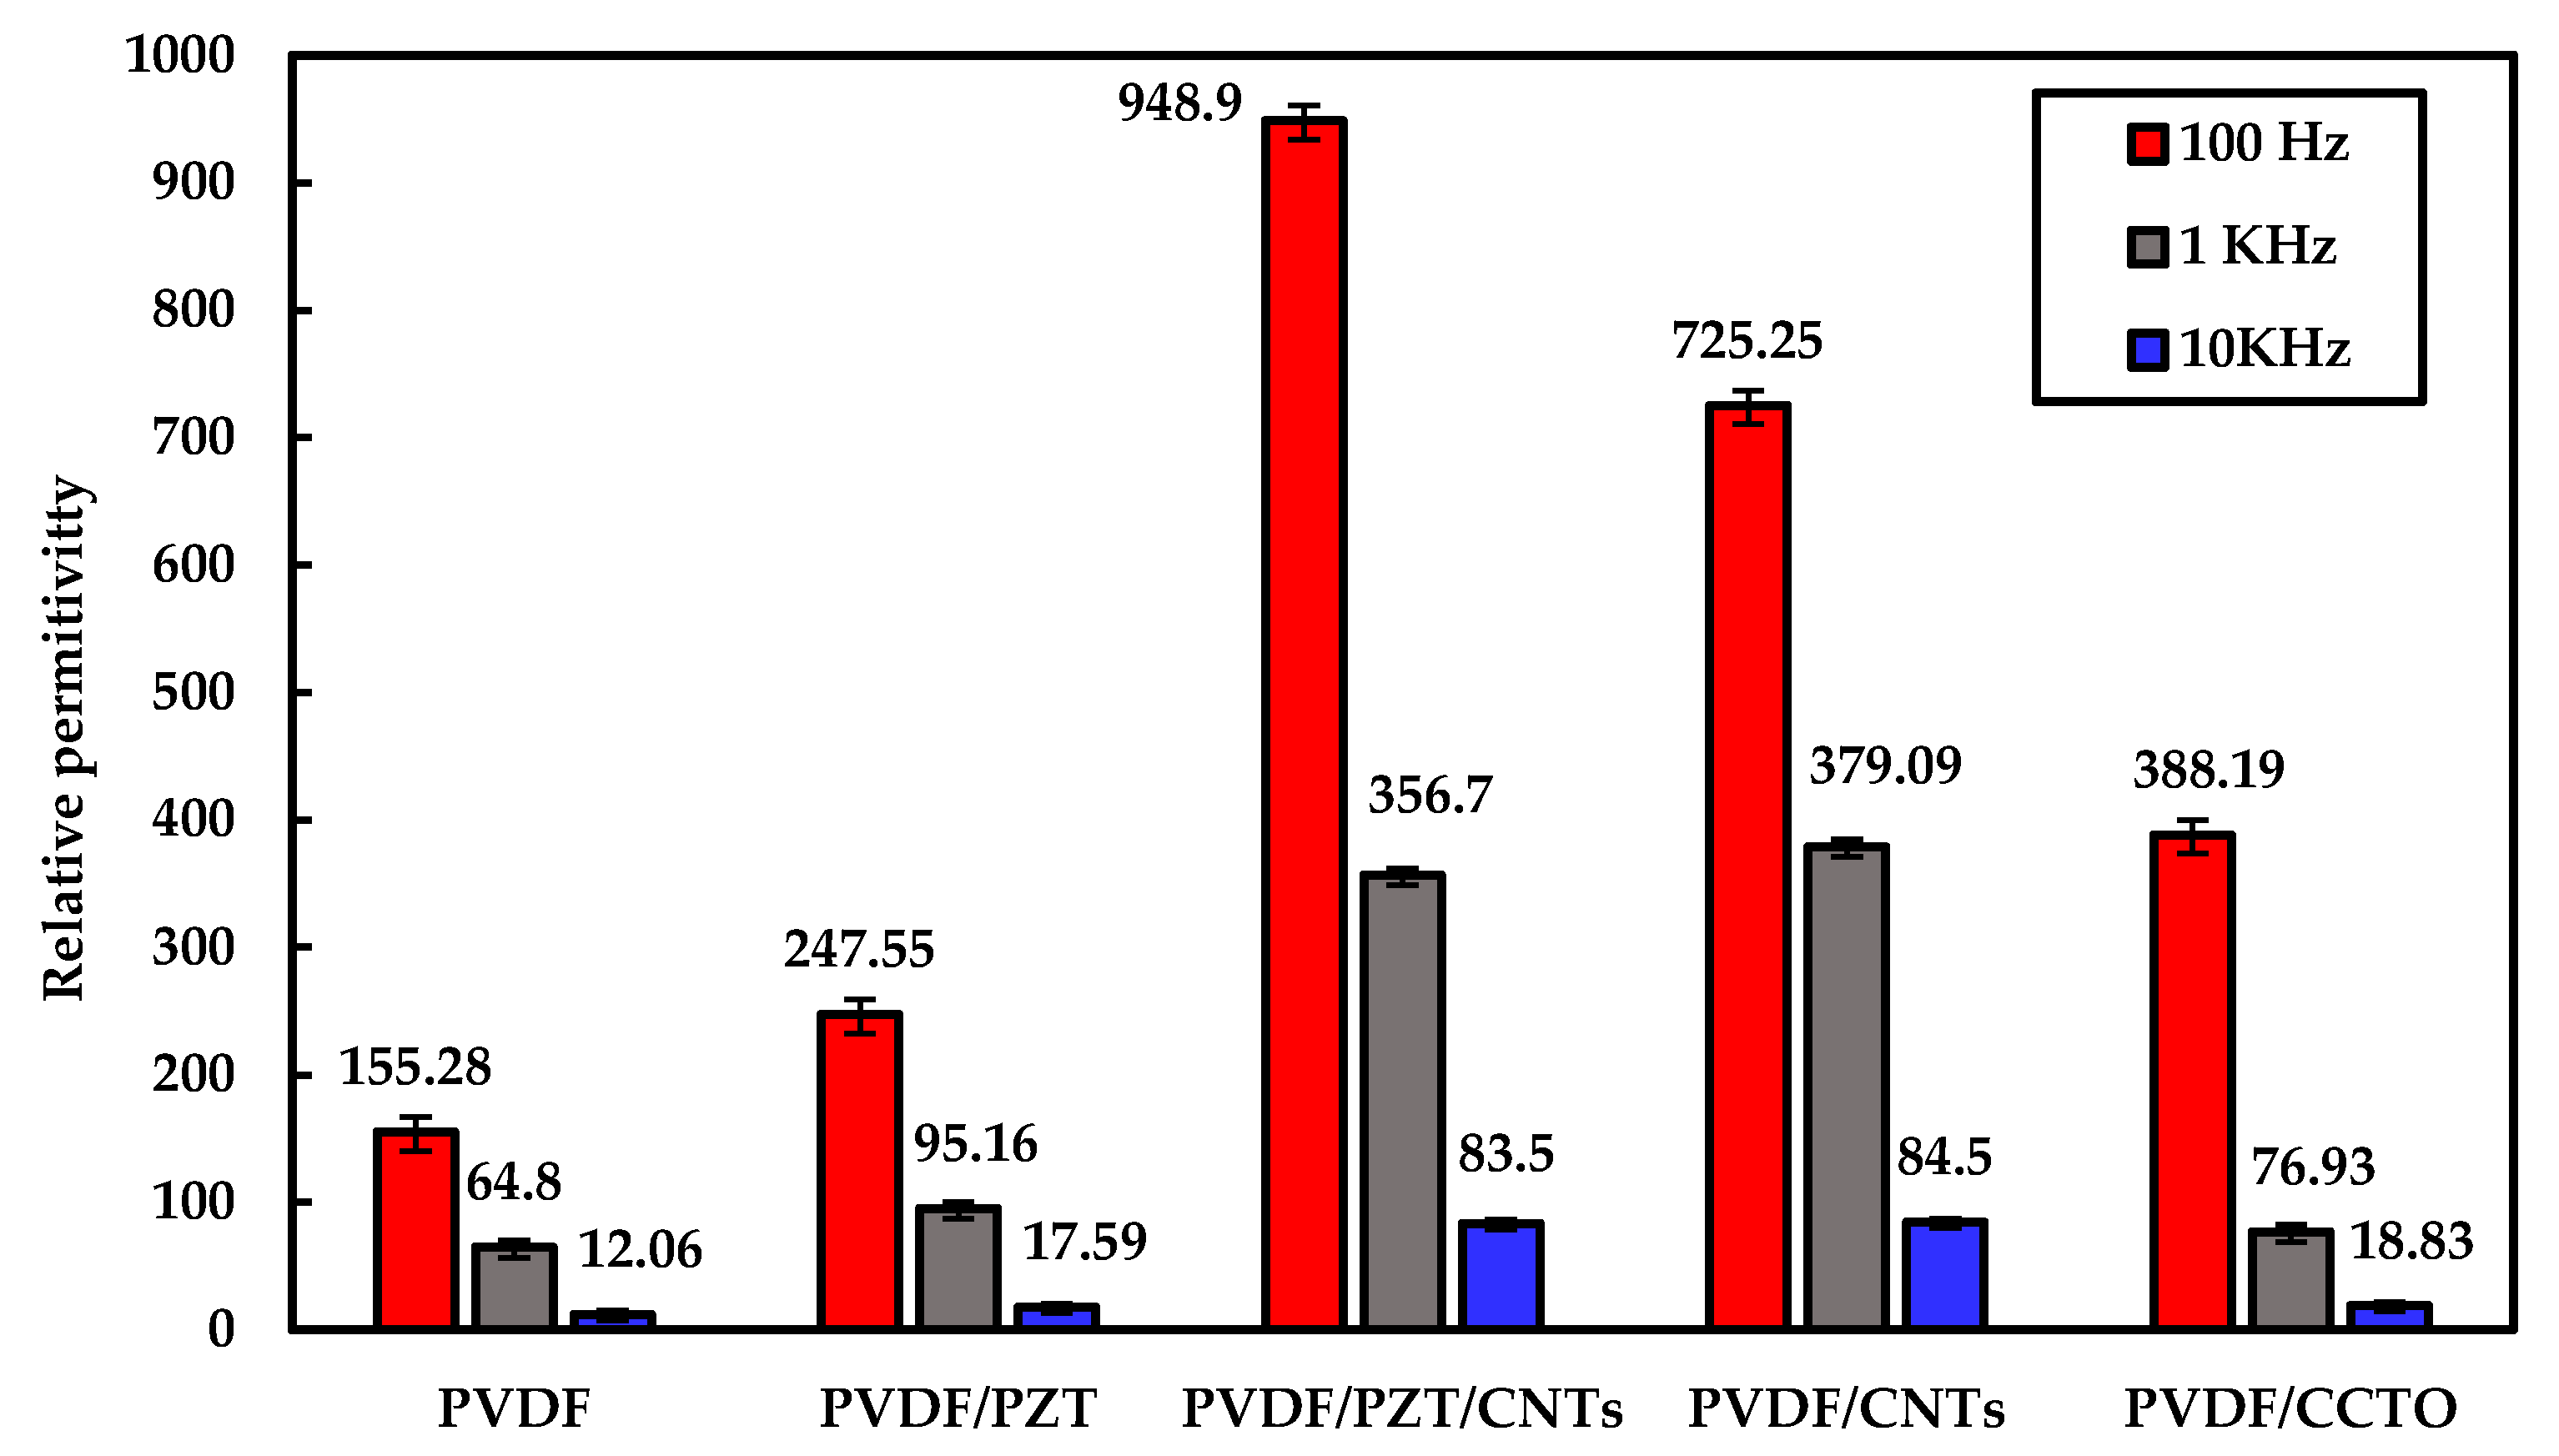
The dielectric constant was measured in different frequencies to evaluate the frequency-dependent nature, as shown in Figure 7, where the results show that the dielectric constant decreased with an increase in frequency due to the material’s net polarization drop.
The maximum value of 42 pC/N and relative permittivity of 948.9 were obtained in the PVDF sample incorporated with CNTs and PZT/CNTs, respectively. Although less content of conductive CNT fillers was added, these combinations showed noticeable enhancements in their piezoelectric properties, along with flexibility.
Additionally, from Table 3, it is observed that when relative permittivity increased, the piezoelectric voltage constant generally decreased, and when the piezoelectric coefficient increased, the voltage constant generally increased. From other combinations, it was noted that, despite the materials selected as fillers exhibiting enhanced piezoelectric properties, certain penalties have been observed. The composite substrate with CNT fillers incorporated exhibited overall high piezoelectric properties when compared with its counterparts.
4.4. Effect of Fillers in PVDF Polymer Mechanical Property
To measure the dynamic viscoelastic behavior and characterize material stiffness under temperature, dynamic mechanical analysis equipment (DMA 8000, PerkinElmer, Columbus, OH, USA) was used at a constant frequency for the different composite configurations. The temperature scan gave storage modulus, which was proportional to the stored energy (elastic response), and the loss modulus, which was proportional to the energy dissipated (viscous response).
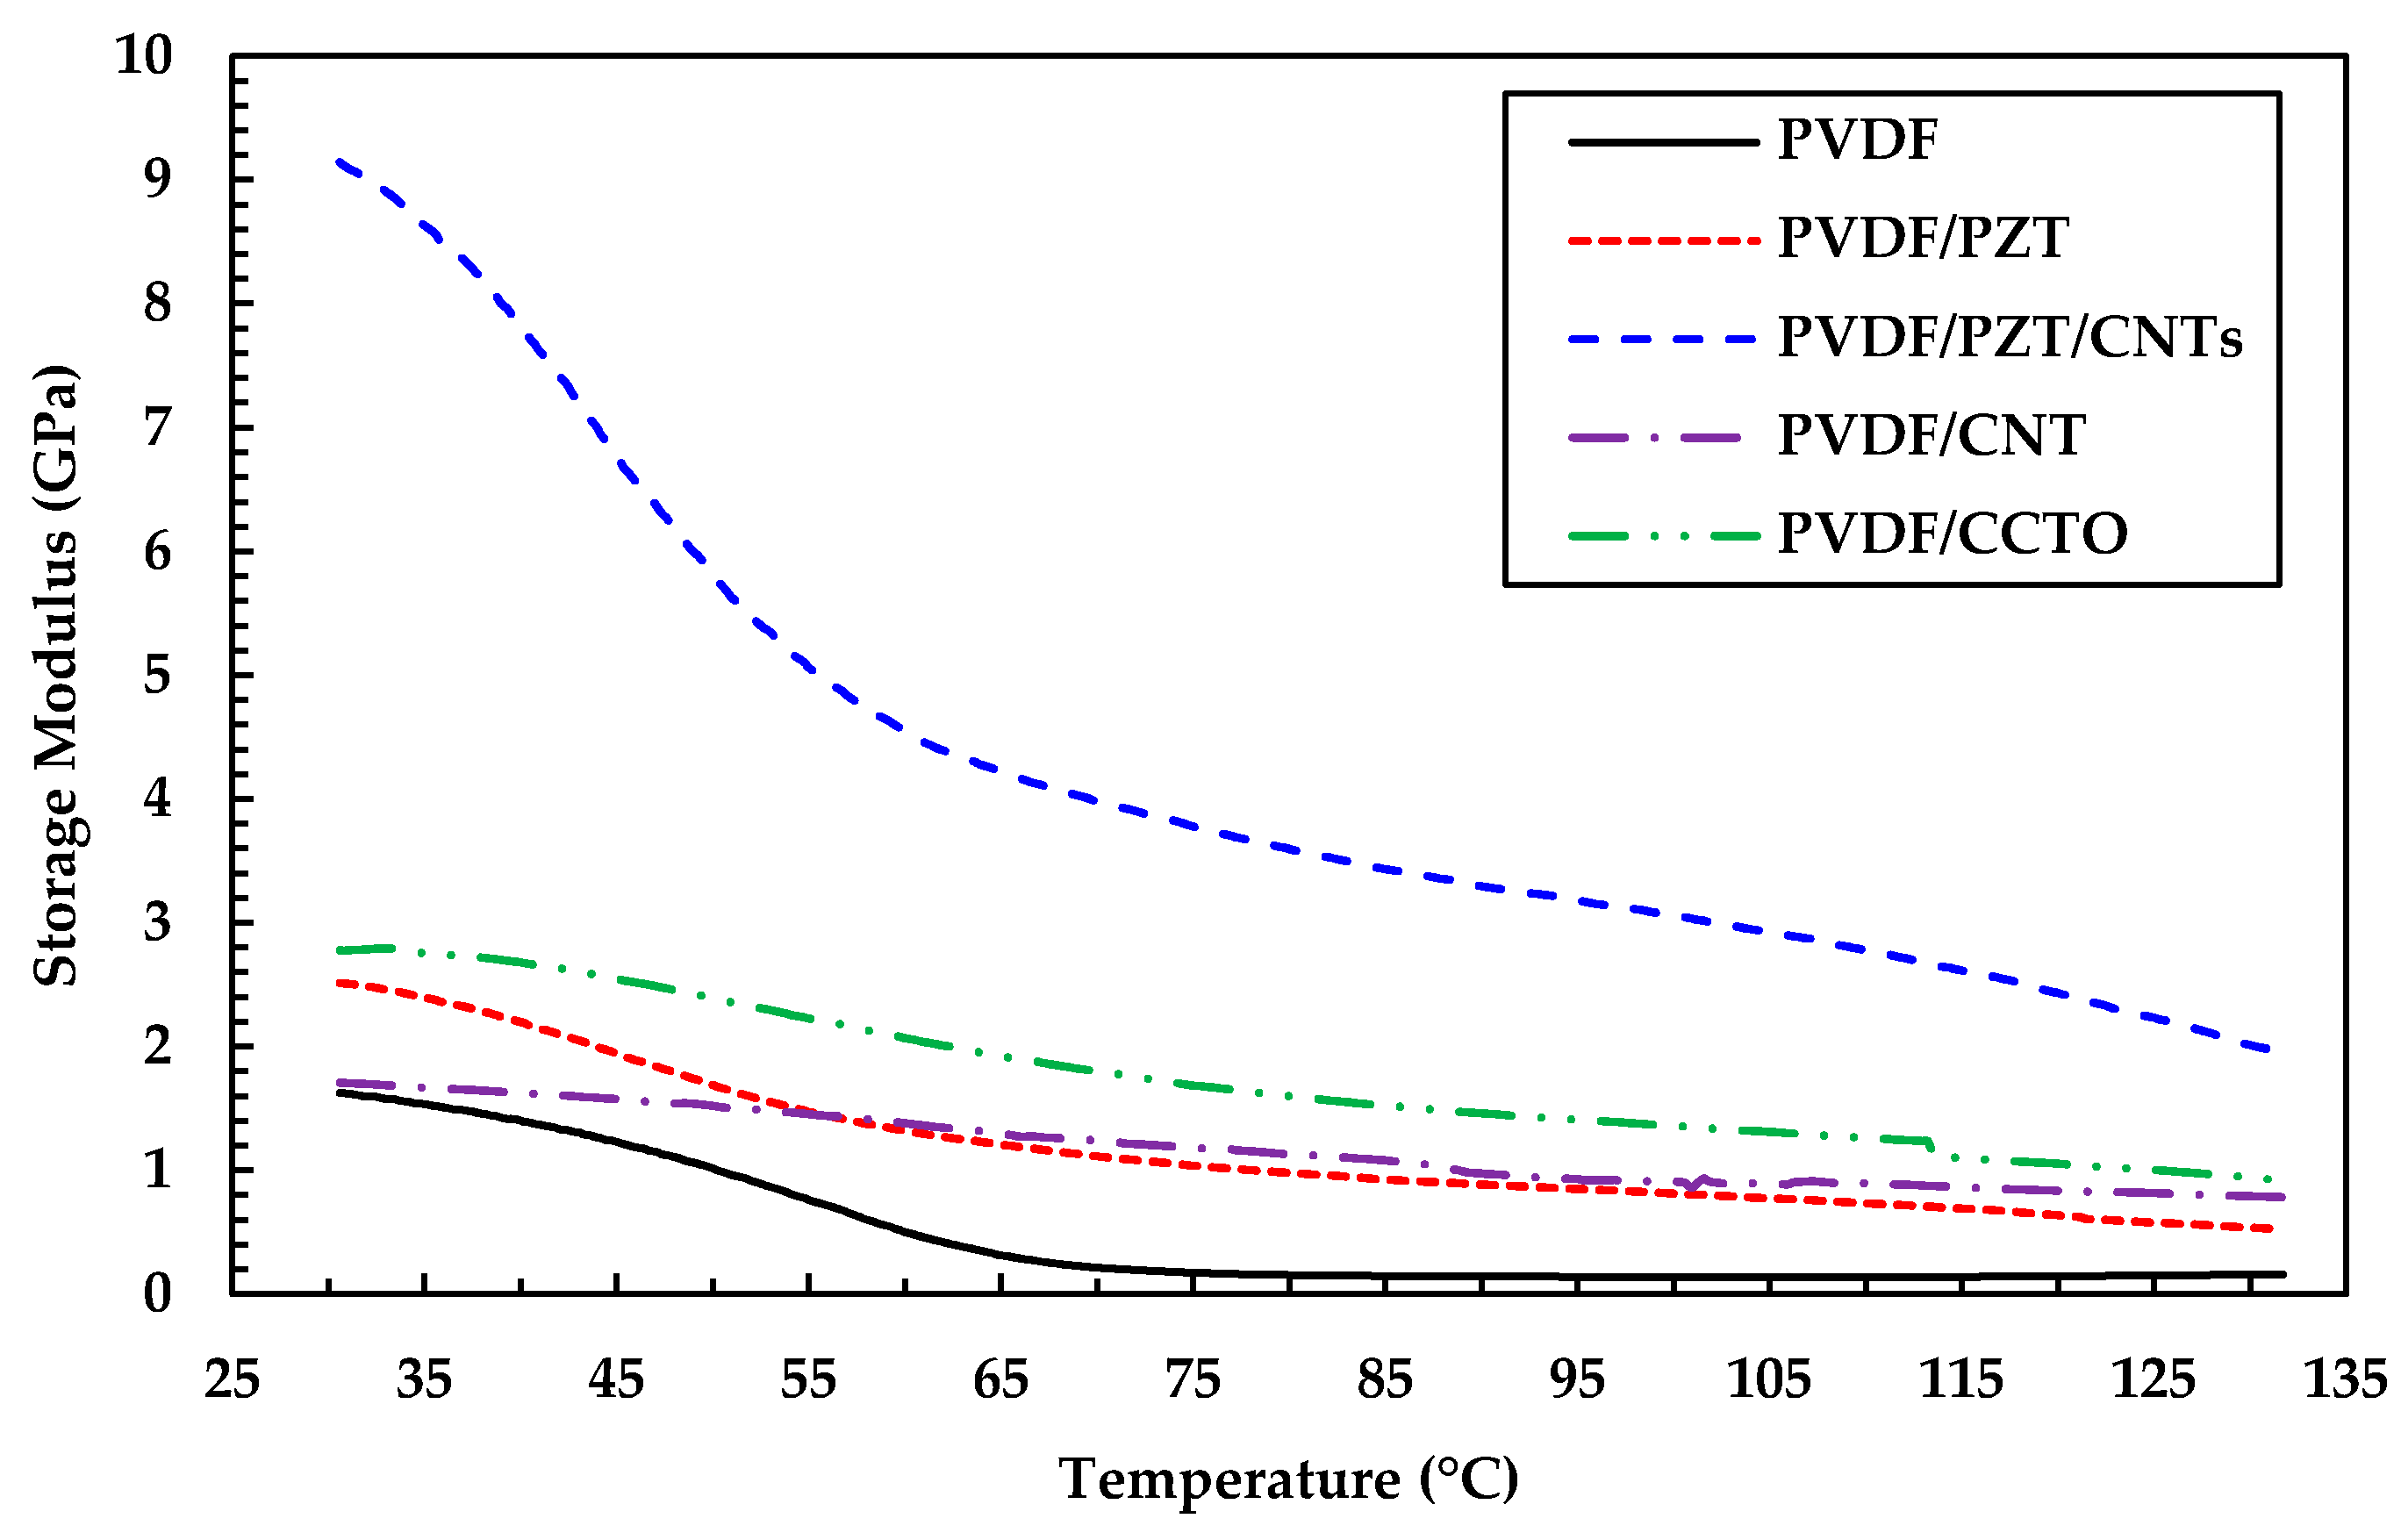
Figure 8 describes the storage modulus (E’) as a function of temperature at a constant frequency of 1 Hz for all the different sample configurations with the tensile fixture. It was observed that the storage modulus of PVDF increased when micro- and nano-fillers were added, which can be attributed to their effectiveness in transferring the interfacial stress and limiting the segmental motion of polymer chains. A maximum modulus of 9.14 GPa was obtained in a sample with two combinations of fillers, such as PZT and CNTs, which resulted in higher energy storage tendency when compared with only PZT, CNT, and CCTO fillers. It is evident that, when the amount of fillers was less, the tendency to restrict the molecular motion of PVDF polymer was limited, where less force was required for deformation, resulting in diminished overall E’ of the material with an increase in temperature.
4.5. Strain Quantification Using DIC and SAW Strain Measurement
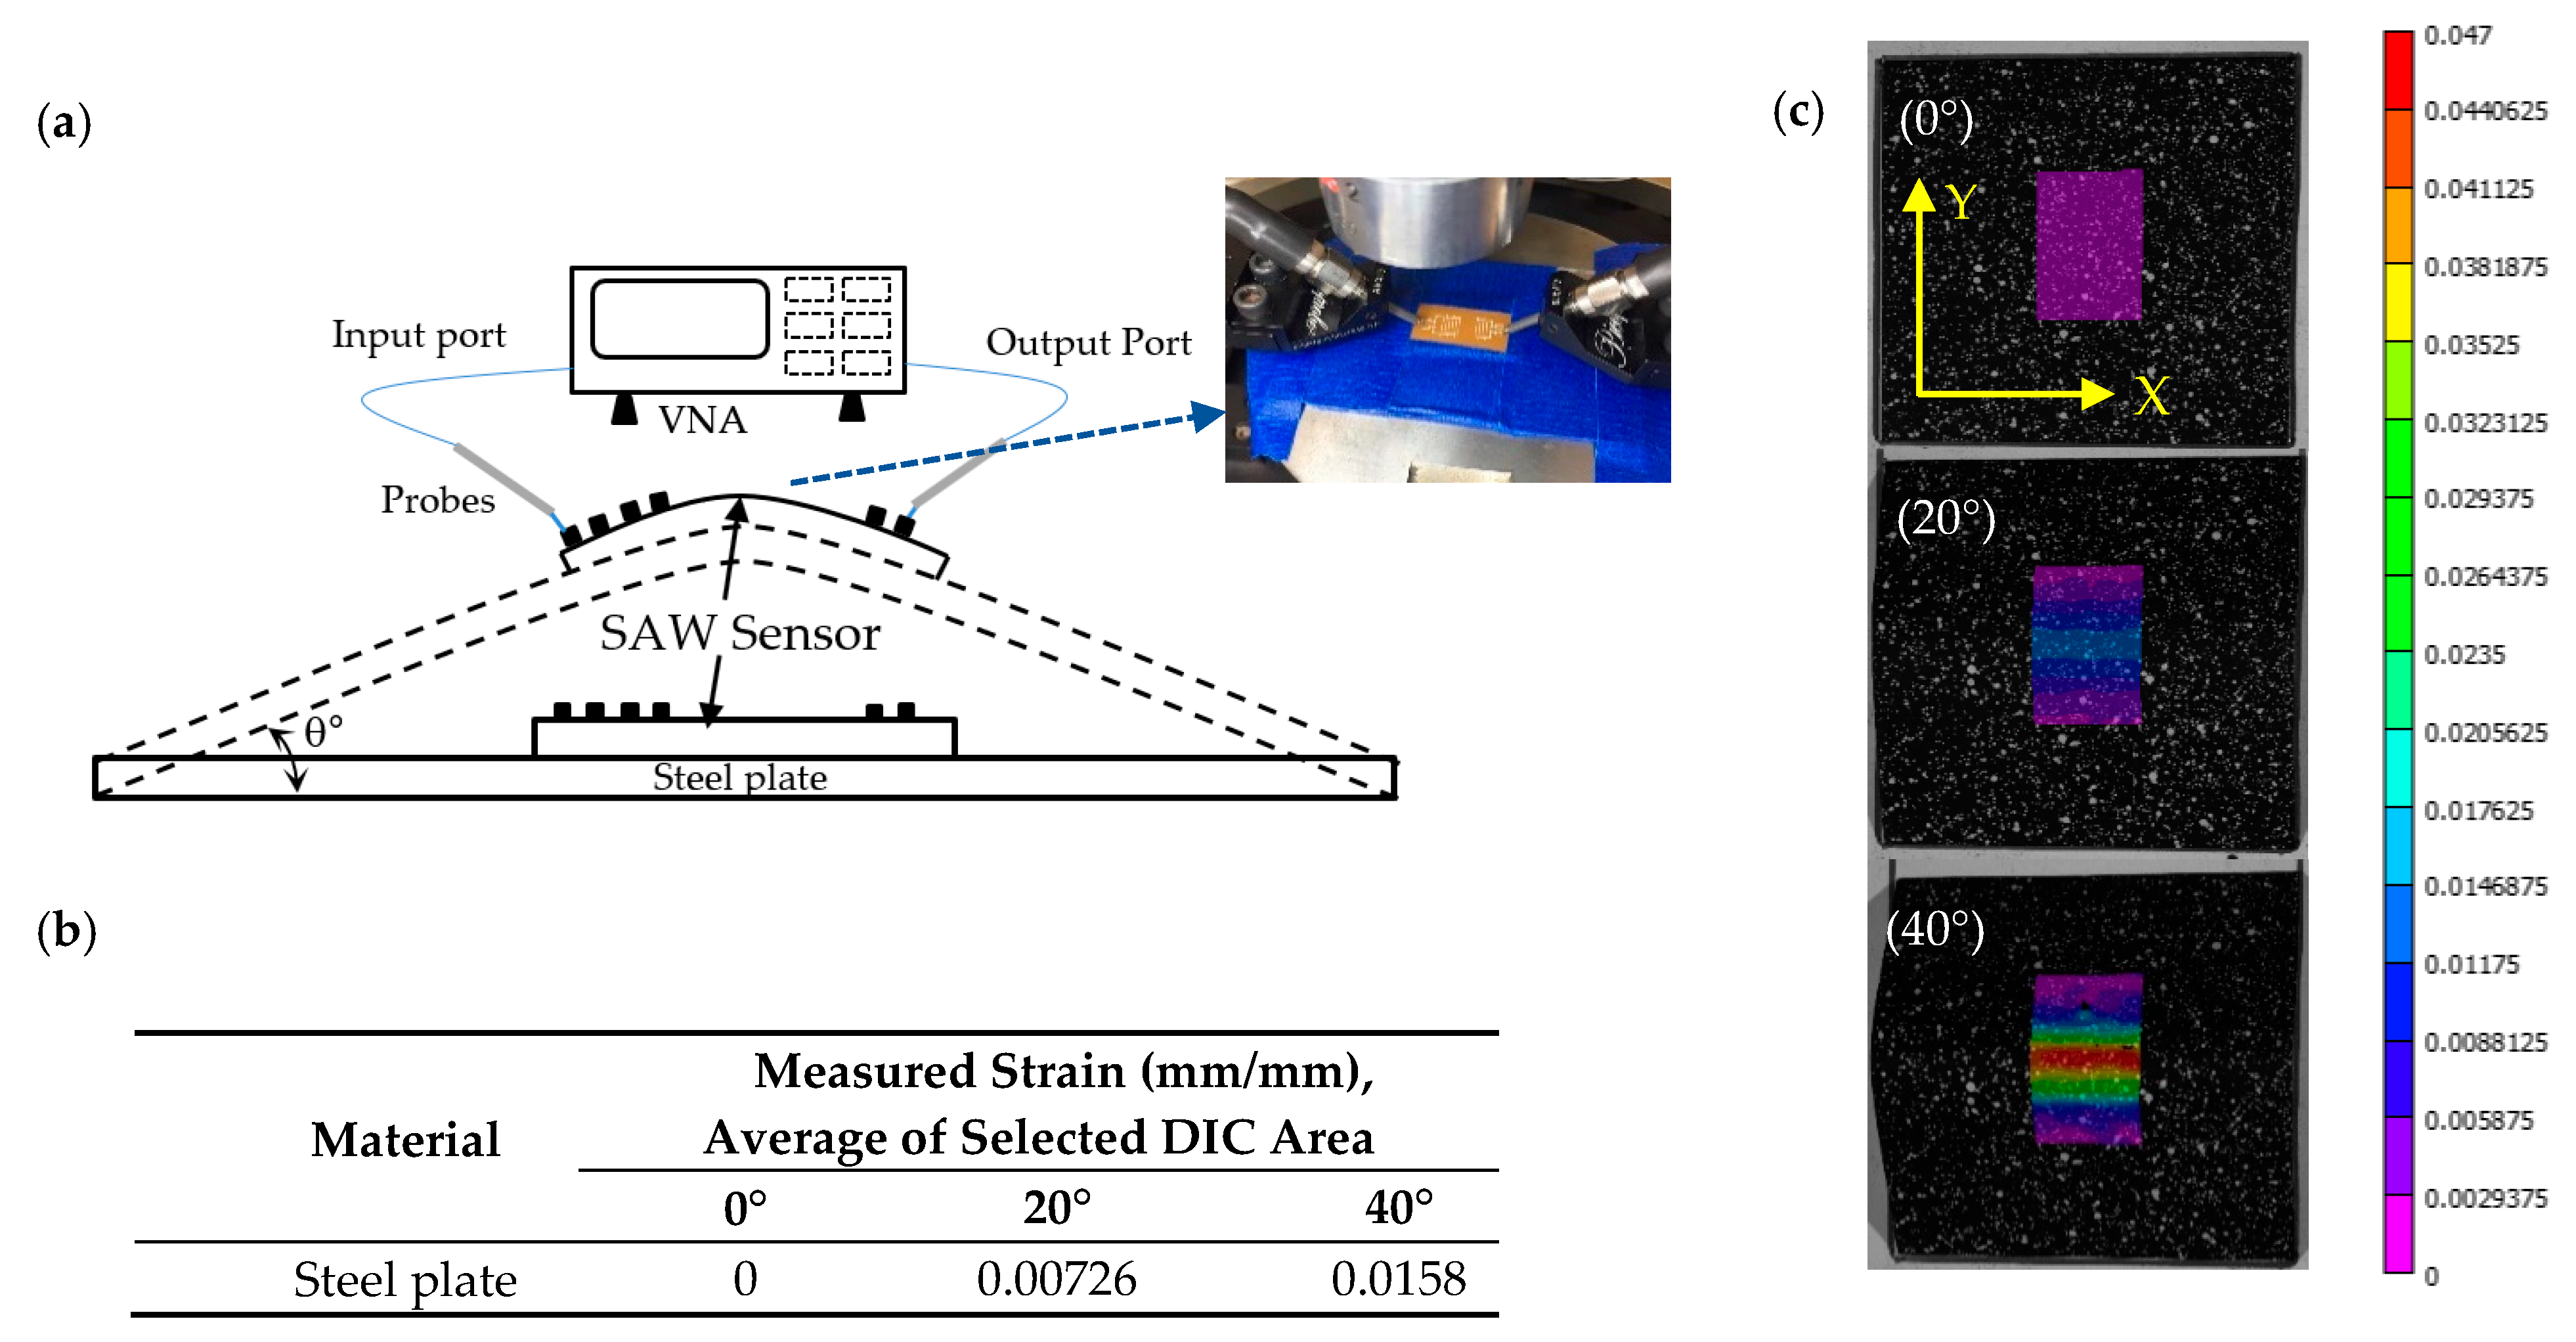
In order to measure the frequency response of the fabricated SAW sensor, the network analyzer probes were connected to the IDT terminals of the sensor, which was attached to the steel plate using a double sided Kapton tape. The sensor-mounted steel plate (size: 7.62 cm × 7.62 cm) was bent at different angles (0°, 20°, and 40°) from the ground surface using a trigger clamp, as shown in Figure 9a. Digital image correlation (DIC), a non-contact optical technique, was also used to show quantitative strains that occurred in Y-direction of the steel plate with selected area of SAW sensor mounted. By tracking the change in displacements of the speckle pattern, the averaged strain was quantitatively measured in three different angles using a correlation algorithm with a selected sensor area, as shown in Figure 9c.
The electro-acoustic behavior of the SAW sensor was investigated on its radio frequency (RF) scattering parameters response. RF probing was performed on the sensors under different bending conditions using a Keysight E5071C vector network analyzer, a probe station, and two (ECP 18-GSG-1250-DP) GGB probes. The probes were calibrated using a CS-10 calibration substrate, and the scattering parameters were measured in the frequency range 10 kHz–100 MHz, where the insertion loss of the sensor, as a function of frequency, was obtained. The frequency response mainly depended on the geometry of the IDT and the velocity of the acoustic and electromagnetic waves propagated, which were related to the electromagnetics and acoustic properties of the substrate material.
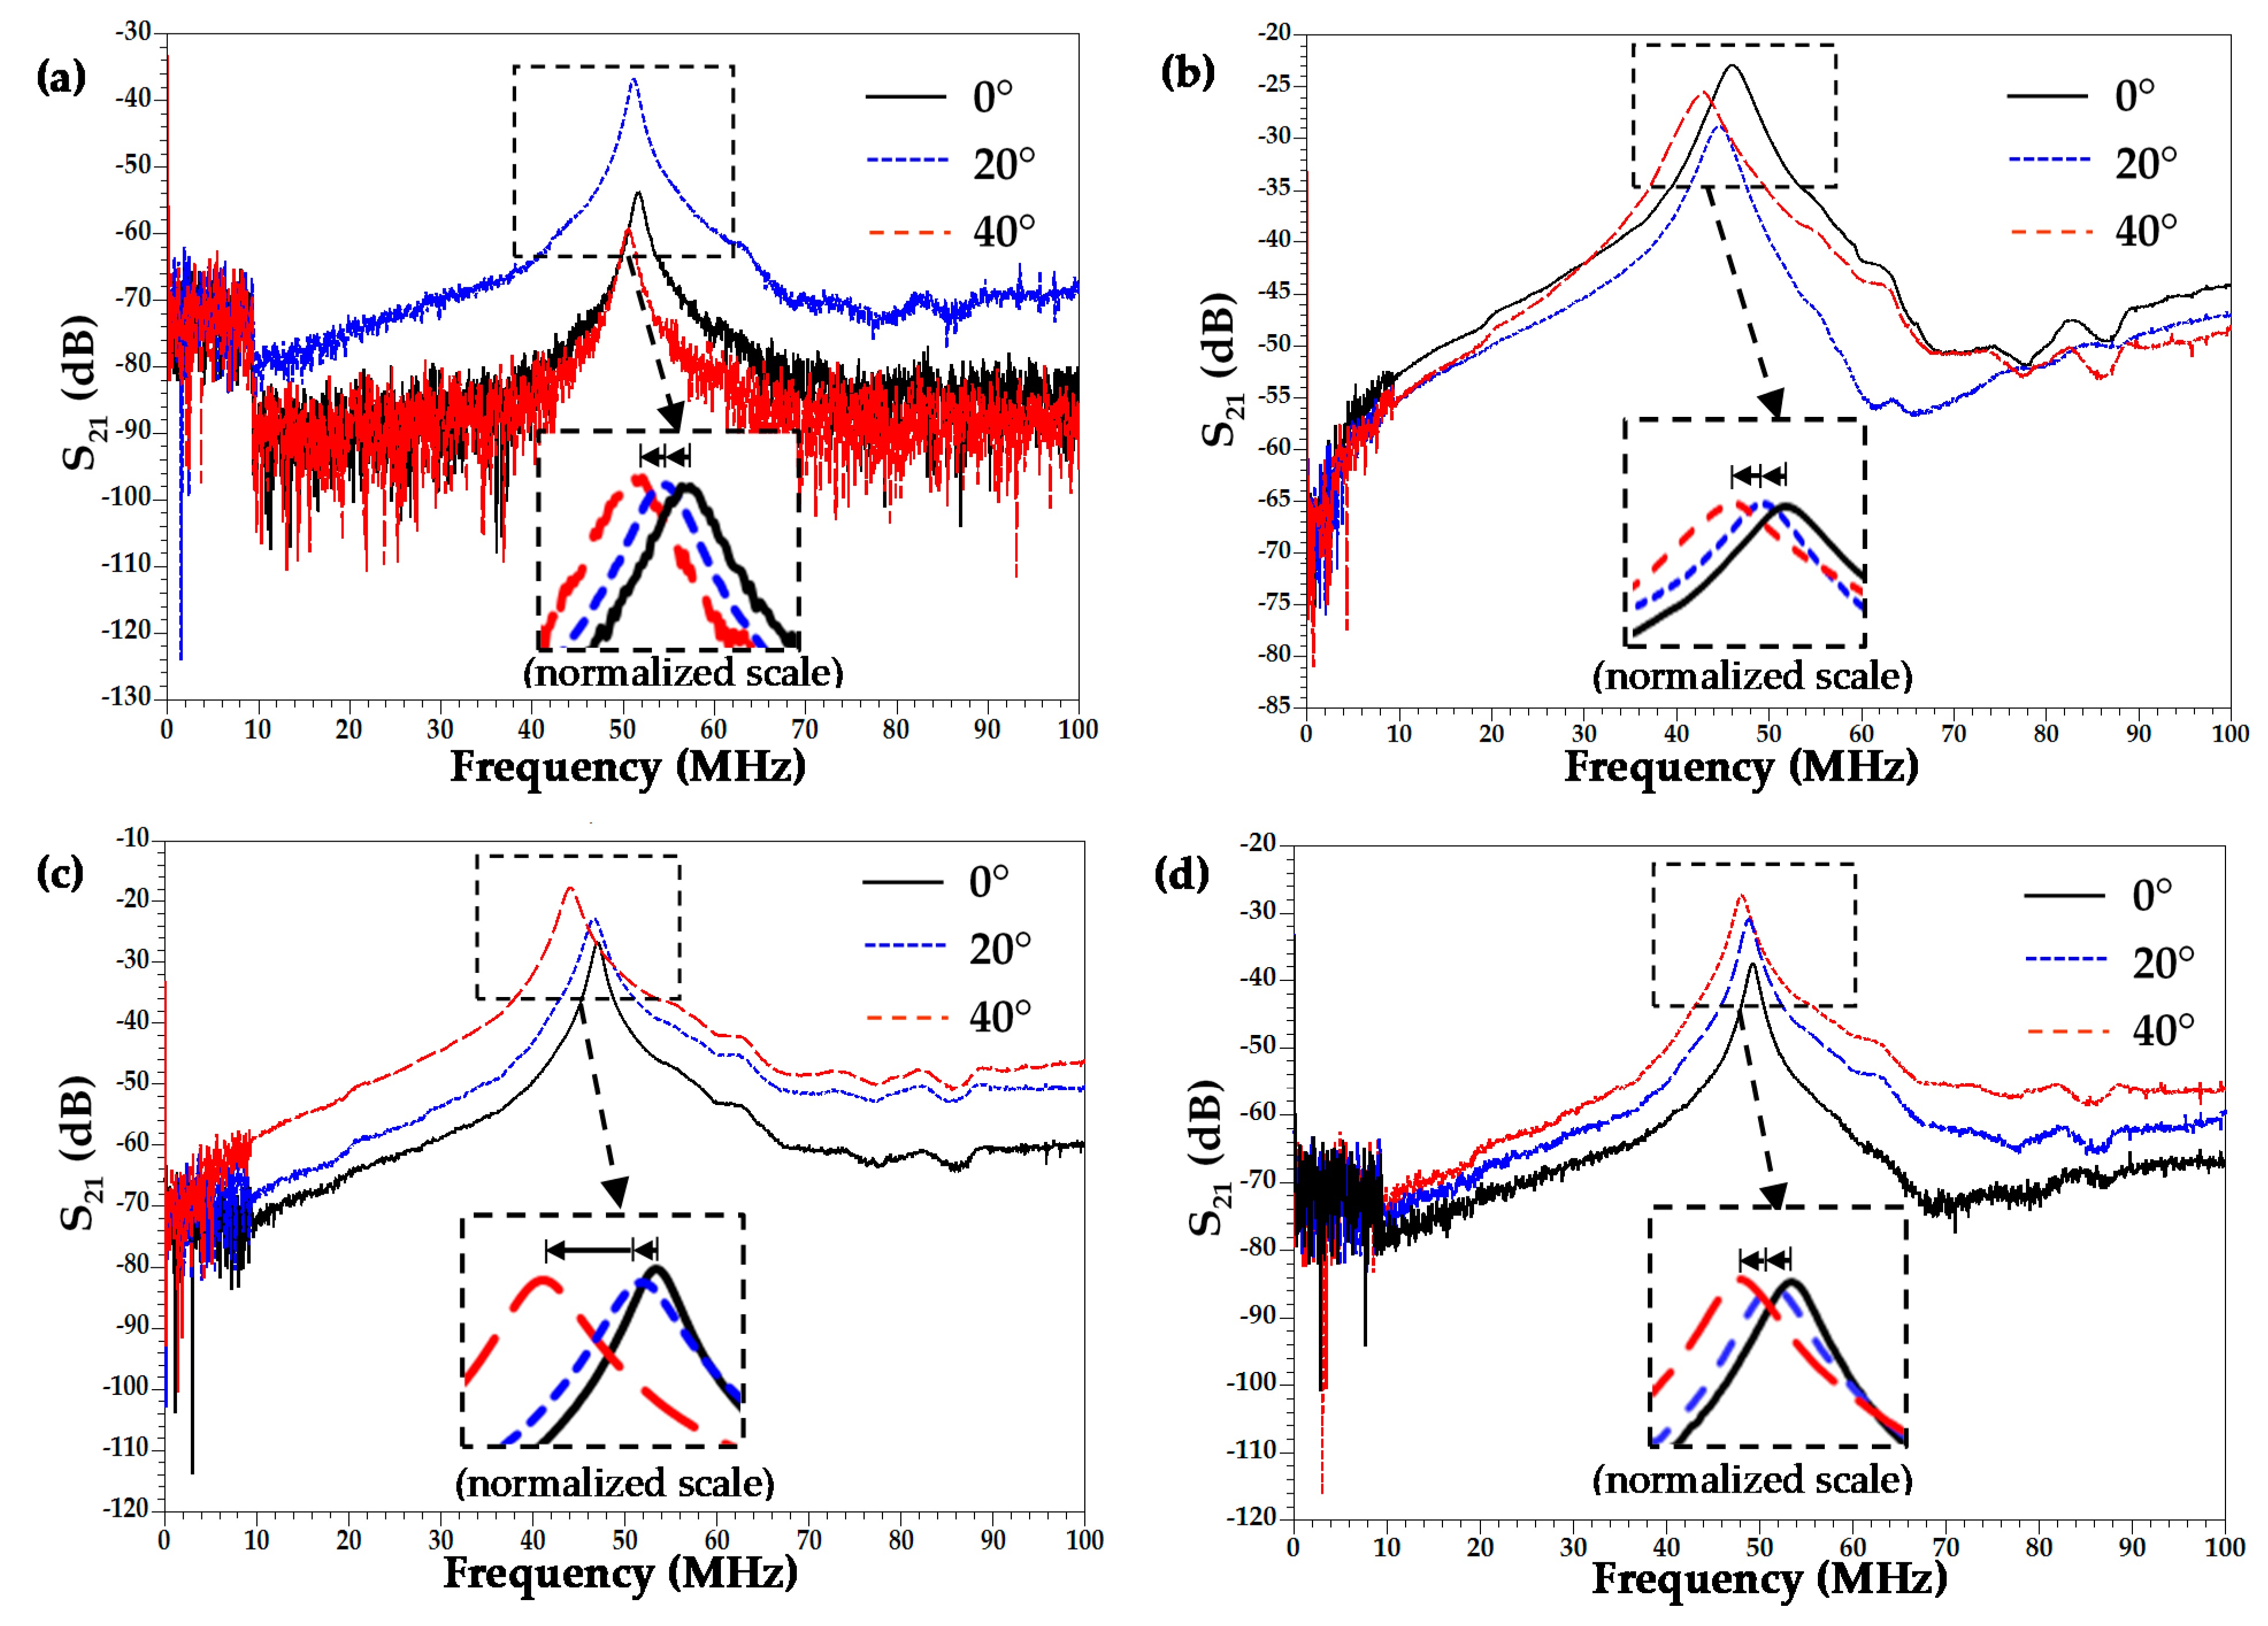
When the SAW sensor was bent due to deformation of the host structure, the polymer substrate stretched, extending the delay line distance and finger spacing, which can be proportional to the shift in frequency response. From the responses of differently fabricated SAW sensors, as shown in Figure 10, it is evident that each sensor type had its own resonance peak frequency corresponding to the wave characteristics of the substrate material. Each SAW sensor has fundamental and harmonic frequencies that were in phase and could be tuned to high frequency, which expanded the range of applications. A predominant harmonic peak in the S21 response was tracked between the different bending angles with an increase in strain, and Table 4 summarizes the frequency shift information of the peak for all the samples. Insertion loss, obtained in the frequency peaks, can be reduced by optimal impedance matching and different IDT types to reduce reflections.
5. Conclusions
The fabrication technique of a thin, flexible SAW sensor made of PVDF polymer with different micro- and nano-fillers by a hot-press process is explained. The printing of IDTs design through additive manufacturing technique is described. Adding fillers to the polymer had a great impact on the piezoelectric and structural properties of the piezocomposite. The piezoelectric strain coefficient, voltage constant, and dielectric constant values increased significantly when the PVDF polymer was incorporated with both PZT (micro-) and CNT (nano-) fillers while comparing with the counterparts. PVDF/CNTs composite yielded the maximum β fraction of 76.9%, as well as the maximum piezoelectric strain coefficient () of 42 pC/N. Other composite types also yielded maximum property values, i.e., 948.9 dielectric constant () by PVDF/PZT/CNTs and 11.87 piezoelectric voltage constant with PVDF/PZT. Mechanical strains were detected and measured, by utilizing the change in wave characteristics, such as frequency shifts in the response from the fabricated SAW sensor. Results show a correlation between the measured frequency response and the quantitatively measured mechanical strains up to 15,800 µε at 40° bending angle, which is relatively high for this specific application. Future works will be dedicated to optimizing the IDT design for better impedance matching and investigating the fundamental peak response of the surface acoustic wave towards measurand detection.
Author Contributions
Conceptualization, methodology, investigation and validation: R.S.G.; writing-review and editing: R.S.G., E.R.-N. and D.K.; resources: E.R.-N. and D.K.; supervision: D.K; project administration: R.S.G. and D.K. All authors have read and agreed to the published version of the manuscript.
Funding
This research received no external funding.
Institutional Review Board Statement
Not applicable.
Informed Consent Statement
Not applicable.
Data Availability Statement
Data are contained within the article.
Conflicts of Interest
The authors declare no conflict of interest.
References
- Xu, H.; Dong, S.; Xuan, W.; Farooq, U.; Huang, S.; Li, M.; Wu, T.; Jin, H.; Wang, X.; Luo, J. Flexible surface acoustic wave strain sensor based on single crystalline LiNbO3 thin film. Appl. Phys. Lett. 2018, 112, 093502. [Google Scholar] [CrossRef]
- Nicolay, P.; Chambon, H.; Bruckner, G.; Gruber, C.; Ballandras, S.; Courjon, E.; Stadler, M. A LN/Si-Based SAW Pressure Sensor. Sensors 2018, 18, 3482. [Google Scholar] [CrossRef] [Green Version]
- Reindl, L.; Shrena, I.; Kenshil, S.; Peter, R. Wireless measurement of temperature using surface acoustic waves sensors. In Proceedings of the IEEE International Frequency Control Symposium and PDA Exhibition Jointly with the 17th European Frequency and Time Forum, Tampa, FL, USA, 4–8 May 2003; pp. 935–941. [Google Scholar]
- Devkota, J.; Ohodnicki, P.R.; Greve, D.W. SAW sensors for chemical vapors and gases. Sensors 2017, 17, 801. [Google Scholar] [CrossRef] [Green Version]
- Feng, B.; Jin, H.; Fang, Z.; Yu, Z.; Dong, S.; Luo, J. Flexible strain sensor based on ultra-thin quartz plate. IEEE Sens. J. 2021, 21. [Google Scholar] [CrossRef]
- Li, L.; Peng, B.; Zhu, J.; He, Z.; Yang, Y.; Zhang, W. Strain Measurements With Langasite SAW Resonators at High Temperature. IEEE Sens. J. 2020, 21, 4688–4695. [Google Scholar] [CrossRef]
- Ren, J.; Anurakparadorn, K.; Gu, H.; Zhao, M.; Wei, X. Design of SAW sensor for longitudinal strain measurement with improved sensitivity. Microsyst. Technol. 2019, 25, 351–359. [Google Scholar] [CrossRef]
- Murphy, O.H.; Bahmanyar, M.R.; Borghi, A.; McLeod, C.N.; Navaratnarajah, M.; Yacoub, M.H.; Toumazou, C. Continuous in vivo blood pressure measurements using a fully implantable wireless SAW sensor. Biomed. Microdevices 2013, 15, 737–749. [Google Scholar] [CrossRef] [PubMed] [Green Version]
- Hu, B.; Zhang, S.; Zhang, H.; Lv, W.; Zhang, C.; Lv, X.; San, H. Fabrications of L-Band LiNbO3-Based SAW Resonators for Aerospace Applications. Micromachines 2019, 10, 349. [Google Scholar] [CrossRef] [Green Version]
- Wilson, W.; Malocha, D.; Kozlovski, N.; Gallagher, D.; Fisher, B.; Pavlina, J.; Saldanha, N.; Puccio, D.; Atkinson, G. Orthogonal frequency coded SAW sensors for aerospace SHM applications. IEEE Sens. J. 2009, 9, 1546–1556. [Google Scholar] [CrossRef]
- Park, S.; Parmar, K.; Shajari, S.; Sanati, M. Polymeric carbon nanotube nanocomposite-based force sensors. CIRP Ann. 2016, 65, 361–364. [Google Scholar] [CrossRef]
- Sirohi, J.; Chopra, I. Fundamental understanding of piezoelectric strain sensors. J. Intell. Mater. Syst. Struct. 2000, 11, 246–257. [Google Scholar] [CrossRef]
- Ruan, L.; Yao, X.; Chang, Y.; Zhou, L.; Qin, G.; Zhang, X. Properties and Applications of the β Phase Poly (vinylidene fluoride). Polymers 2018, 10, 228. [Google Scholar] [CrossRef] [Green Version]
- Araújo, E.; Eiras, J. Structural, electric and ferroelectric properties of PZT films obtained using oxide precursors. J. Phys. Condens. Matter 1999, 11, 1975. [Google Scholar] [CrossRef]
- Gao, L.; Huang, Y.; Hu, Y.; Du, H. Dielectric and ferroelectric properties of (1− x) BaTiO3–xBi0. 5Na0. 5TiO3 ceramics. Ceram. Int. 2007, 33, 1041–1046. [Google Scholar] [CrossRef]
- Zhang, J.; Zheng, P.; Shao, S.; Su, W.; Wang, C. Dielectric and electrical properties of CaCu3Ti4O12 ceramics at high temperatures. Ferroelectrics 2007, 356, 85–89. [Google Scholar] [CrossRef]
- Kumar, G.S.; Vishnupriya, D.; Chary, K.S.; Patro, T.U. High dielectric permittivity and improved mechanical and thermal properties of poly (vinylidene fluoride) composites with low carbon nanotube content: Effect of composite processing on phase behavior and dielectric properties. Nanotechnology 2016, 27, 385702. [Google Scholar] [CrossRef]
- Ferreira, A.; Martínez, M.; Ansón-Casaos, A.; Gómez-Pineda, L.; Vaz, F.; Lanceros-Mendez, S. Relationship between electromechanical response and percolation threshold in carbon nanotube/poly (vinylidene fluoride) composites. Carbon 2013, 61, 568–576. [Google Scholar] [CrossRef]
- Thongsanitgarn, P.; Watcharapasorn, A.; Jiansirisomboon, S. Electrical and mechanical properties of PZT/PVDF 0–3 composites. Surf. Rev. Lett. 2010, 17, 1–7. [Google Scholar] [CrossRef]
- Arlt, K.; Wegener, M. Piezoelectric PZT/PVDF-copolymer 0-3 composites: Aspects on film preparation and electrical poling. IEEE Trans. Dielectr. Electr. Insul. 2010, 17, 1178–1184. [Google Scholar] [CrossRef]
- Chen, D.; Heyer, S.; Ibbotson, S.; Salonitis, K.; Steingrímsson, J.G.; Thiede, S. Direct digital manufacturing: Definition, evolution, and sustainability implications. J. Clean. Prod. 2015, 107, 615–625. [Google Scholar] [CrossRef]
- Sajkiewicz, P.; Wasiak, A.; Gocłowski, Z. Phase transitions during stretching of poly (vinylidene fluoride). Eur. Polym. J. 1999, 35, 423–429. [Google Scholar] [CrossRef]
- Bharti, V.; Kaura, T.; Nath, R. Ferroelectric hysteresis in simultaneously stretched and corona-poled PVDF films. IEEE Trans. Dielectr. Electr. Insul. 1997, 4, 738–741. [Google Scholar] [CrossRef]
- Gonçalves, R.; Lopes, A.; Botelho, G.; Neves, I.C.; Lanceros-Mendez, S. Influence of solvent properties on the electrical response of poly (vinylidene fluoride)/NaY composites. J. Polym. Res. 2013, 20, 143. [Google Scholar] [CrossRef]
- Gregorio, R., Jr. Determination of the α, β, and γ crystalline phases of poly (vinylidene fluoride) films prepared at different conditions. J. Appl. Polym. Sci. 2006, 100, 3272–3279. [Google Scholar] [CrossRef]
- Wang, H.; Cai, H.; Zhou, W.; Liu, S. Poly (Vinylidene Fluoride)/Mg Doped CaCu 3 Ti 4 O 12 Composites with Improved Dielectric Properties. MSE 2019, 472, 012008. [Google Scholar]
- Ouyang, X.; Cao, P.; Zhang, W.; Liu, Z.; Huang, Z.; Gao, W. CaCu 3 Ti 4 O 12–PVDF polymeric composites with enhanced capacitive energy density. Int. J. Mod. Phys. B 2015, 29, 1540003. [Google Scholar] [CrossRef]
- Vicente, J.; Costa, P.; Lanceros-Mendez, S.; Abete, J.M.; Iturrospe, A. Electromechanical properties of PVDF-based polymers reinforced with nanocarbonaceous fillers for pressure sensing applications. Material 2019, 12, 3545. [Google Scholar] [CrossRef] [PubMed] [Green Version]
- Roy, R.E.; Vijayalakshmi, K.; Bhuvaneswari, S.; Rajeev, R. Influence of process conditions and effect of functionalization in inducing time dependent polymorphic states in single walled carbon nanotube incorporated poly (vinylidene fluoride). SN Appl. Sci. 2019, 1, 978. [Google Scholar] [CrossRef] [Green Version]
- Seema, A.; Dayas, K.; Varghese, J.M. PVDF-PZT-5H composites prepared by hot press and tape casting techniques. J. Appl. Polym. Sci. 2007, 106, 146–151. [Google Scholar] [CrossRef]
- Jain, A.; KJ, P.; Sharma, A.K.; Jain, A.; PN, R. Dielectric and piezoelectric properties of PVDF/PZT composites: A review. Polym. Eng. Sci. 2015, 55, 1589–1616. [Google Scholar] [CrossRef]
- Liu, L.; Grunlan, J.C. Clay assisted dispersion of carbon nanotubes in conductive epoxy nanocomposites. Adv. Funct. Mater. 2007, 17, 2343–2348. [Google Scholar] [CrossRef]
- Waller, D.; Safari, A. Corona poling of PZT ceramics and flexible piezoelectric composites. Ferroelectrics 1988, 87, 189–195. [Google Scholar] [CrossRef]
- Kim, H.; Torres, F.; Wu, Y.; Villagran, D.; Lin, Y.; Tseng, T.-L.B. Integrated 3D printing and corona poling process of PVDF piezoelectric films for pressure sensor application. Smart Mater. Struct. 2017, 26, 085027. [Google Scholar] [CrossRef]
- Mahadeva, S.K.; Berring, J.; Walus, K.; Stoeber, B. Effect of poling time and grid voltage on phase transition and piezoelectricity of poly (vinyledene fluoride) thin films using corona poling. J. Phys. D Appl. Phys. 2013, 46, 285305. [Google Scholar] [CrossRef]
- Cai, X.; Lei, T.; Sun, D.; Lin, L. A critical analysis of the α, β and γ phases in poly (vinylidene fluoride) using FTIR. RSC Adv. 2017, 7, 15382–15389. [Google Scholar] [CrossRef] [Green Version]
- Wang, P.; Pan, Z.; Wang, M.; Huang, S.; Liu, J.; Zhai, J. Polypyrrole random-coil induced permittivity from negative to positive in all-organic composite films. J. Mater. 2019, 6, 348–354. [Google Scholar] [CrossRef]
- Medeiros, K.A.R.; Rangel, E.Q.; Sant’Anna, A.R.; Louzada, D.R.; Barbosa, C.R.H.; d’Almeida, J.R.M. Evaluation of the electromechanical behavior of polyvinylidene fluoride used as a component of risers in the offshore oil industry. Oil Gas Sci.Technol. –Rev. d’IFP Energ. Nouv. 2018, 73, 48. [Google Scholar] [CrossRef] [Green Version]
- Peng, Y.; Sun, B.; Wu, P. Two-dimensional correlation infrared spectroscopic study on the crystallization and gelation of poly (vinylidene fluoride) in cyclohexanone. Appl. Spectrosc. 2008, 62, 295–301. [Google Scholar] [CrossRef] [PubMed]
- Benz, M.; Euler, W.B. Determination of the crystalline phases of poly (vinylidene fluoride) under different preparation conditions using differential scanning calorimetry and infrared spectroscopy. J. Appl. Polym. Sci. 2003, 89, 1093–1100. [Google Scholar] [CrossRef]
- Salimi, A.; Yousefi, A.A. Conformational changes and phase transformation mechanisms in PVDF solution-cast films. J. Polym. Sci. Part B Polym. Phys. 2004, 42, 3487–3495. [Google Scholar] [CrossRef]
- Sanati, M.; Sandwell, A.; Mostaghimi, H.; Park, S.S. Development of Nanocomposite-Based Strain Sensor with Piezoelectric and Piezoresistive Properties. Sensors 2018, 18, 3789. [Google Scholar] [CrossRef] [PubMed] [Green Version]
- García-Zaldívar, O.; Escamilla-Díaz, T.; Ramírez-Cardona, M.; Hernández-Landaverde, M.; Ramírez-Bon, R.; Yañez-Limón, J.; Calderón-Piñar, F. Ferroelectric-paraelectric transition in a membrane with quenched-induced δ-phase of PVDF. Sci. Rep. 2017, 7, 1–8. [Google Scholar] [CrossRef] [PubMed]
Figure 1.
(a) Flexibility demonstration of a hot-pressed thin sample. (b) Schematic of corona poling with dipole orientation before (c) and after (d) poling.
Figure 1.
(a) Flexibility demonstration of a hot-pressed thin sample. (b) Schematic of corona poling with dipole orientation before (c) and after (d) poling.

Figure 2.
(a) 3Dn series tabletop printer. (b) Micro-dispensing schematic of printing conductive electrode. (c) Printed IDT with dimensions.
Figure 2.
(a) 3Dn series tabletop printer. (b) Micro-dispensing schematic of printing conductive electrode. (c) Printed IDT with dimensions.

Figure 3.
FT-IR absorbance spectra of different fillers with PVDF polymer.

Figure 4.
(a) Relative fraction of calculated polar β phase. (b) DSC curve of PVDF sample.

Figure 5.
SEM images with different PVDF/ PZT concentrations: (a) 20:80; (b) 40:60; (c) 60:40; (d) 80:20.
Figure 5.
SEM images with different PVDF/ PZT concentrations: (a) 20:80; (b) 40:60; (c) 60:40; (d) 80:20.

Figure 6.
SEM images, (a) PVDF/PZT/CNTs (40:59.75:0.25), zoomed in picture shows CNTs. (b) PVDF/CCTO (40:60), showing a homogenous distribution of powder with less agglomeration.
Figure 6.
SEM images, (a) PVDF/PZT/CNTs (40:59.75:0.25), zoomed in picture shows CNTs. (b) PVDF/CCTO (40:60), showing a homogenous distribution of powder with less agglomeration.

Figure 7.
Frequency-dependent dielectric constant of PVDF mixed with different fillers.

Figure 8.
Storage modulus temperature sweep of PVDF polymer with different fillers at 1 Hz.

Figure 9.
(a) VNA test setup with SAW sensor attached to a steel plate bent with angle θ. (b) Quantitative average strain measured in sensor area with 0°, 20°, and 40° angles. (c) Digital image correlation of displacement in Y direction. Contour ranges: pink indicates low strains; red indicates high strains.

Figure 10.
Frequency response representation from 10 kHz–100 MHz at different angles: (a) PVDF/PZT; (b) PVDF/PZT/CNTs; (c) PVDF/CNTs; (d) PVDF/CCTO. The zoomed in box shows the peak shift in normalized frequency response when the SAW sensor was under bending in three different angles.
Figure 10.
Frequency response representation from 10 kHz–100 MHz at different angles: (a) PVDF/PZT; (b) PVDF/PZT/CNTs; (c) PVDF/CNTs; (d) PVDF/CCTO. The zoomed in box shows the peak shift in normalized frequency response when the SAW sensor was under bending in three different angles.


Table 1.
PVDF polymer with different micro- and nano-fillers ratio used in the nanocomposite process. DMSO solvent content was same for all combinations (30 wt. %).
Table 1.
PVDF polymer with different micro- and nano-fillers ratio used in the nanocomposite process. DMSO solvent content was same for all combinations (30 wt. %).
| Sample | PVDF (wt. %) | PZT (wt. %) | CNT (wt. %) | CCTO (wt. %) |
|---|---|---|---|---|
| PVDF | 100 | - | - | - |
| PVDF/PZT | 40 | 60 | - | - |
| PVDF/PZT/CNTs | 40 | 59.75 | 0.25 | - |
| PVDF/CNTs | 98 | - | 2 | - |
| PVDF/CCTO | 40 | - | - | 60 |
Table 2.
Piezoelectric and dielectric properties measurements for the different piezocomposites.
| Material | Thickness t (mm) | (pC/N) | ||
|---|---|---|---|---|
| PVDF | 0.25 | 12.3 | 155.3 | 8.95 |
| PVDF/PZT | 0.51 | 21.6 | 247.5 | 9.86 |
| PVDF/PZT/CNTs | 0.82 | 17.4 | 948.9 | 2.07 |
| PVDF/CNTs | 0.72 | 33.5 | 725.2 | 5.22 |
| PVDF/CCTO | 0.60 | 12.5 | 388.2 | 3.64 |
Table 3.
Effect of polarization in enhancing piezoelectric strain and voltage coefficient of the piezocomposites.
Table 3.
Effect of polarization in enhancing piezoelectric strain and voltage coefficient of the piezocomposites.
| Material | Polarized | % Increase | |
|---|---|---|---|
(pC/N) | |||
| PVDF | 16 | 11.64 | 30.08 |
| PVDF/PZT | 26 | 11.87 | 20.37 |
| PVDF/PZT/CNTs | 28 | 3.33 | 60.91 |
| PVDF/CNTs | 42 | 6.54 | 25.37 |
| PVDF/CCTO | 18 | 5.24 | 44 |
Table 4.
Frequency shift data for a different type of fillers in PVDF matrix.
| Material | 0° (MHz) | 20° (MHz) | 40° (MHz) |
| PVDF/PZT | 51.57 | 51.13 | 50.57 |
| PVDF/PZT/CNTs | 45.95 | 44.57 | 42.88 |
| PVDF/CNTs | 47.01 | 46.63 | 44.07 |
| PVDF/CCTO | 49.26 | 48.82 | 48.01 |
Publisher’s Note: MDPI stays neutral with regard to jurisdictional claims in published maps and institutional affiliations. |
© 2021 by the authors. Licensee MDPI, Basel, Switzerland. This article is an open access article distributed under the terms and conditions of the Creative Commons Attribution (CC BY) license (https://creativecommons.org/licenses/by/4.0/).
Share and Cite
MDPI and ACS Style
Srinivasaraghavan Govindarajan, R.; Rojas-Nastrucci, E.; Kim, D. Surface Acoustic Wave-Based Flexible Piezocomposite Strain Sensor. Crystals 2021, 11, 1576. https://0-doi-org.brum.beds.ac.uk/10.3390/cryst11121576
AMA Style
Srinivasaraghavan Govindarajan R, Rojas-Nastrucci E, Kim D. Surface Acoustic Wave-Based Flexible Piezocomposite Strain Sensor. Crystals. 2021; 11(12):1576. https://0-doi-org.brum.beds.ac.uk/10.3390/cryst11121576
Chicago/Turabian StyleSrinivasaraghavan Govindarajan, Rishikesh, Eduardo Rojas-Nastrucci, and Daewon Kim. 2021. "Surface Acoustic Wave-Based Flexible Piezocomposite Strain Sensor" Crystals 11, no. 12: 1576. https://0-doi-org.brum.beds.ac.uk/10.3390/cryst11121576
Note that from the first issue of 2016, this journal uses article numbers instead of page numbers. See further details here.