
Enhancement of Crystallization Process of the Organic Pharmaceutical Molecules through High Pressure


1
National Engineering Research Center of Industrial Crystallization Technology, School of Chemical Engineering and Technology, Tianjin University, Tianjin 300072, China
2
School of Chemical Engineering and Technology, Hainan University, Haikou 570228, China
*
Author to whom correspondence should be addressed.
Crystals 2022, 12(3), 432; https://0-doi-org.brum.beds.ac.uk/10.3390/cryst12030432
Submission received: 22 February 2022
/
Revised: 9 March 2022
/
Accepted: 16 March 2022
/
Published: 20 March 2022
(This article belongs to the Special Issue Polymorphism in Crystals)
Abstract
:The enhancement of the crystallization process through high pressures was studied by using ribavirin (RVB) as a model compound. The effects of high pressure on crystallization thermodynamics, nucleation kinetics, and process yield were evaluated and discussed. The solubility of ribavirin in three pure solvents was measured at different pressures from 283.15 to 323.15 K. The results indicate that the solubility data of ribavirin decreased slightly when pressure was increased. The induction time of the cooling crystallization of ribavirin under different pressures was measured. The results show that high pressure could significantly reduce the nucleation induction period. Furthermore, the nucleation kinetic parameters under different pressures were calculated according to the classical nucleation theory. The effect of high pressure on the anti-solvent crystallization of ribavirin was also studied.
1. Introduction
Crystallization is a very important unit operation in the pharmaceutical industry because more than 90% of active pharmaceutical ingredients (API) are crystalline products [1]. Recently, researchers have studied the crystallization process of pharmaceutical molecules under physical fields, including the electric field [2], magnetic field [3], laser [4], ultrasonic [5], gravity [6], pressure [7], etc. As a basic thermodynamic variable, pressure is a powerful tool for exploring new materials [8]. As early as 2003, Fabiani et al. obtained one methanol solvate by compressing the methanol solution of paracetamol at 0.62 GPa [9]. In the following 20 years, researchers have conducted a lot of work in the high-pressure crystallization of API [7]. Wierschem et al. found that high pressure can significantly reduce the induction time and improve the crystal growth rate under 200–450 MPa [10]. Elena Boldyreva have systematically studied the solid-phase transformation of a variety of amino acids under several GPA, which provides an effective method for the understanding of the mechanism of phase transitions between polymorphs of small organic molecules [11,12,13]. Andrzej Katrusiak obtained different polymorphisms and solvates of organic molecules such as xylazine hydrochloride and triiodoimidazole under several GPA and provided guidance for predicting the formation and structure of solvates under high pressure [14,15]. However, from the literature review, the high-pressure crystallization of API is mainly carried out by diamond anvil cell (DAC) under the pressure of hundreds of MPa to several GPa. There are few studies on the solution crystallization process of API under several MPa, although several MPa is easier to achieve on an industrial scale.
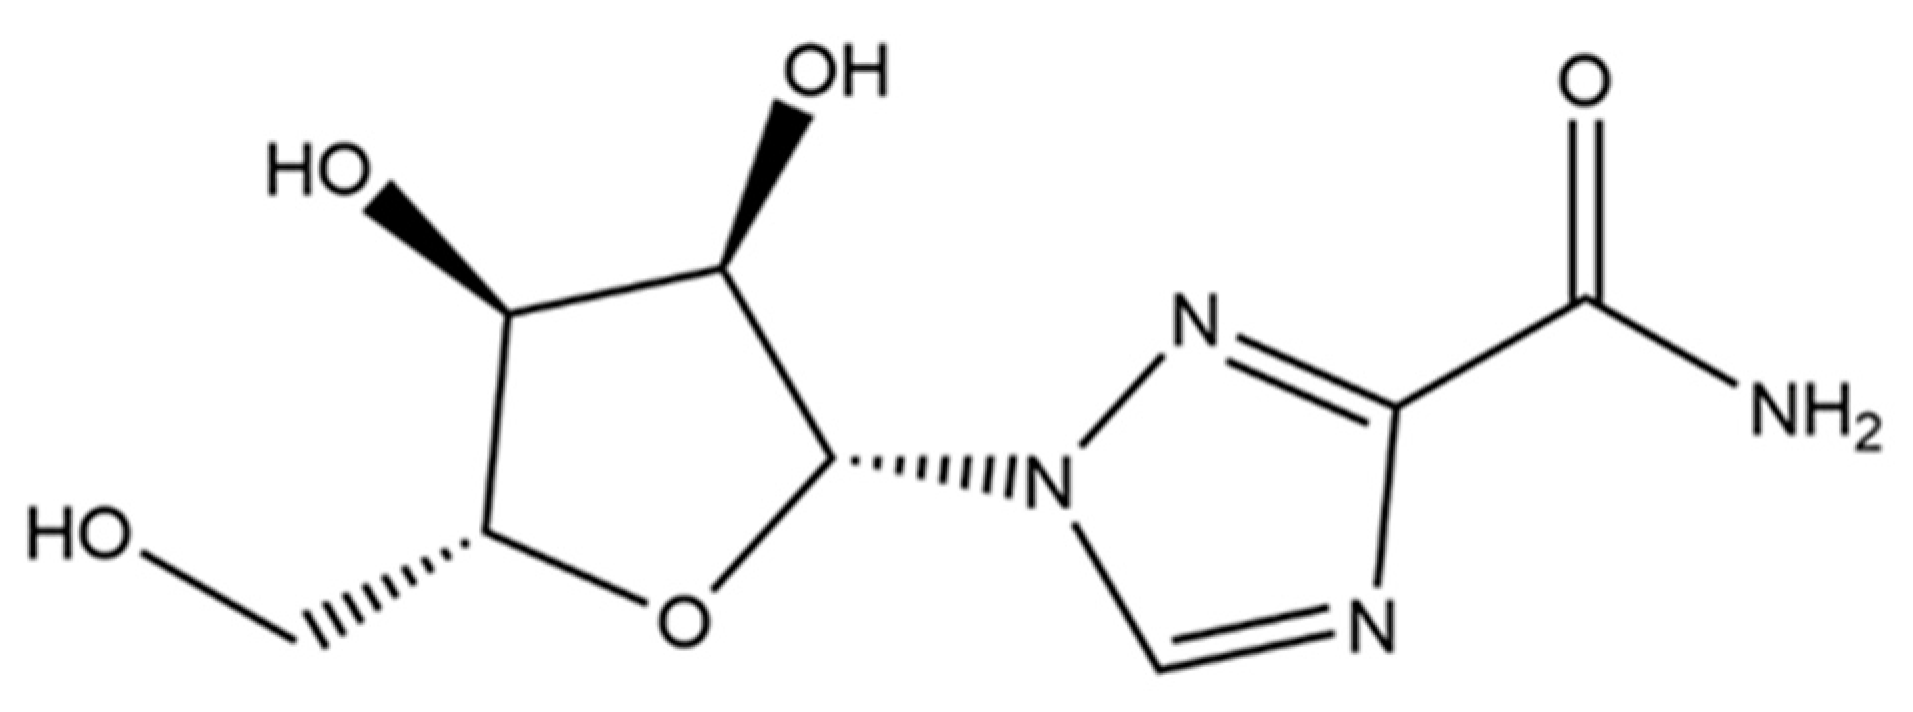
In this paper, the enhancement crystallization process of API at several MPa was studied, and whether this enhancement will bring the risk of polymorphic transformation was also considered, which can enrich the control methods of the crystallization process that are easily realized in industry. Ribavirin (RBV, C8H12N4O5, CAS No. 36791-04-5) is an antiviral drug widely used in hepatitis C virus infection treatment [16]. The chemical structure of ribavirin is presented in Figure 1. Three crystal forms of RBV have been previously reported, conventionally referred to as Form I, Form II, and DMSO solvate [17,18]. However, its crystallization behaviors and its polymorphic forms under high pressure have not been studied. In this work, the solubility of RBV in three solvents (water, dimethylformamide, and dimethylacetamide) was firstly measured from 283.15 to 323.15 K at 12.0 MPa and 0.1 MPa since the solubility is basic data of crystallization thermodynamics. Then, the induction time of cooling crystallization of RBV in water was measured under different temperatures, pressures, and supersaturations. Furthermore, nucleation parameters under different pressures were calculated based on the induction time data. The yield and crystal form of anti-solvent crystallization under different pressures were characterized and compared.
2. Experimental
2.1. Materials
Ribavirin (Form II, mass purity ≥ 99.0%) was purchased from Shanghai Xianding Biotechnology Co., Ltd. (Shanghai, China). Ultrapure water with a resistivity of 18.2 MΩ·cm was prepared in our laboratory. Other solvents were obtained from Lianlong Bohua Chemical Co., Ltd. and were directly used without further purification.
Ribavirin (Form I) was prepared by anti-solvent crystallization. The raw material (100 g) was dissolved in dimethylacetamide (300 mL) at 313.15 K and crystallized by gradually adding n-butanol (2000 mL, 5 mL/min). The product was washed with ethanol and dried in a vacuum-drying oven.
2.2. High-Pressure Device
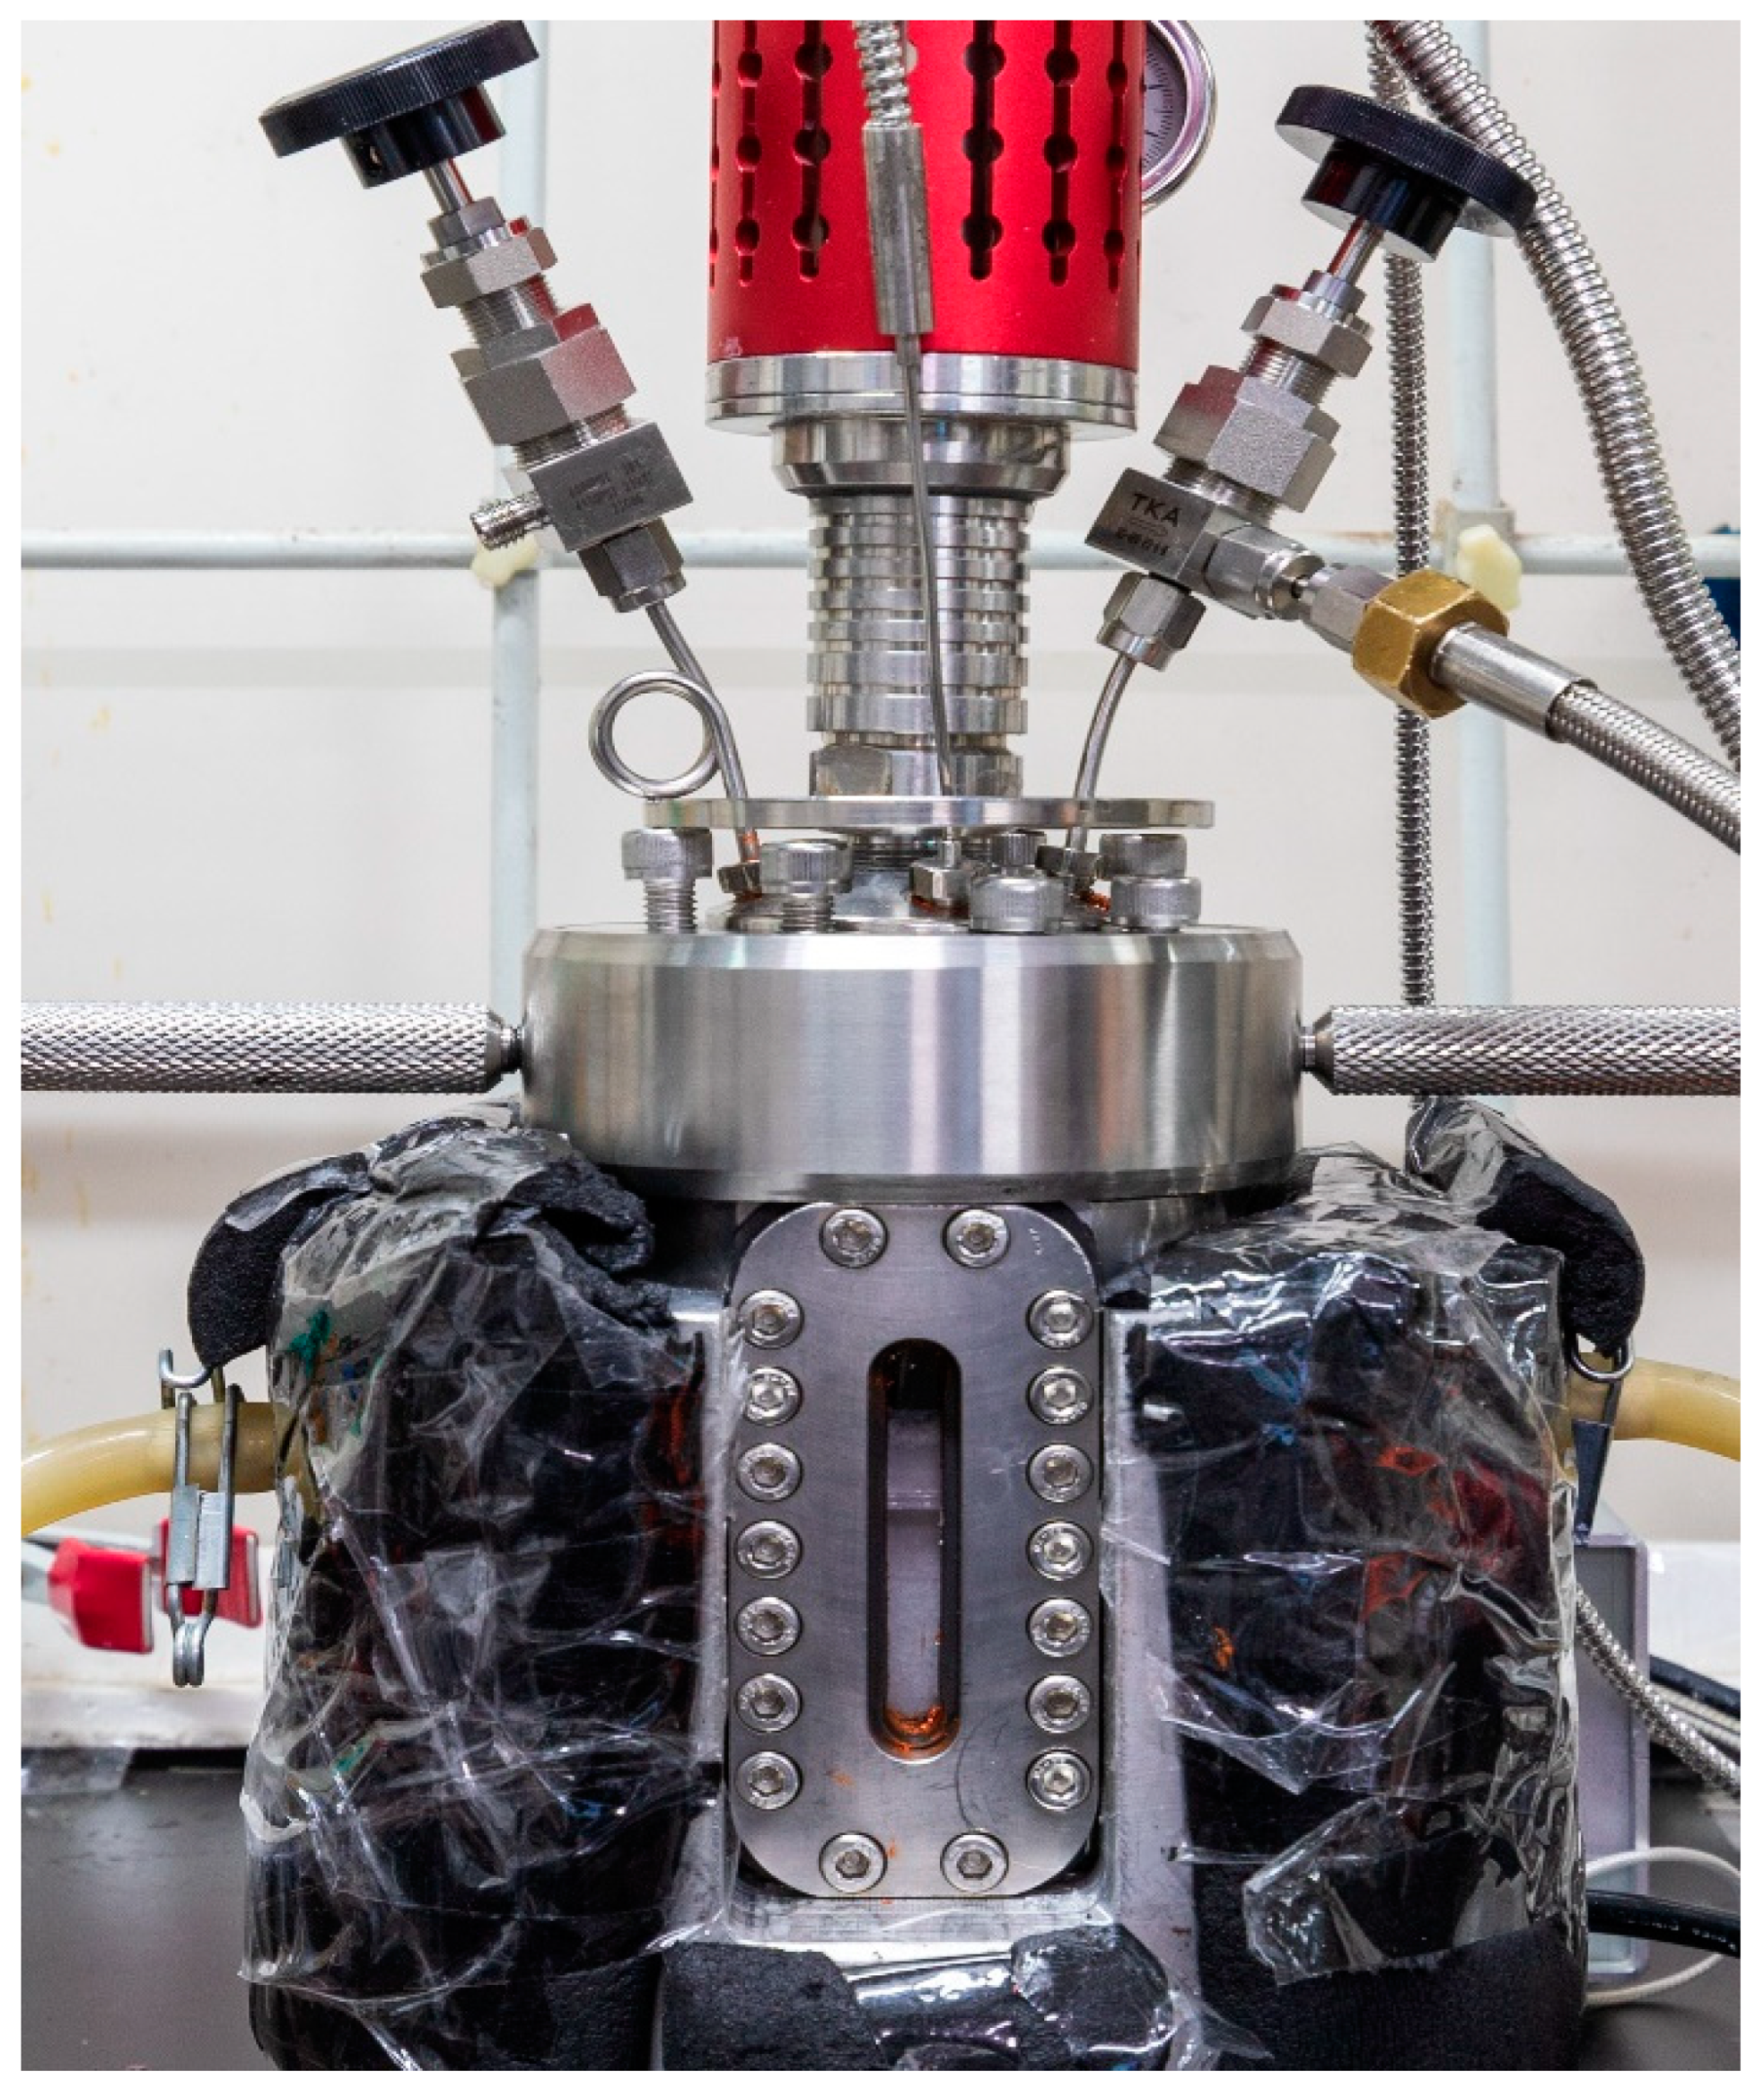
The device used in the experiment was a high-pressure stainless-steel reactor (Xi’an Taikang Biotechnology Co., Ltd., Xi’an, China) with a volume of 100 mL and a maximum pressure of 12.5 MPa. As shown in Figure 2, the reactor was equipped with an inflation valve, liquid-taking valve, magnetic–mechanical coupled stirring, and a sapphire window for observing the crystallization process. The high pressure of the reactor was provided by a nitrogen steel cylinder (Tianjin Liufang Industrial Gas Distribution Co., Ltd., Tianjin, China) with the nitrogen purity ≥ 99.999% and the initial pressure ≥ 14.5 MPa. The pressure of the reactor was controlled by the pressure-reducing valve, and the control accuracy was 0.1 MPa. All experiments at 0.1 MPa in this paper were carried out at atmospheric pressure. A thermostat (CF41, Julabo Technology Co., Ltd., Seelbach, Germany) and jacket were used to control the temperature of the reactor with a temperature accuracy of 0.1 K.
2.3. Solubility Measurement
The solubility of RBV in three solvents (water, dimethylformamide, and dimethylacetamide) at 12.0 MPa was determined by the gravimetric method in the above reactor [19]. Firstly, pure solvent (about 50 mL), excess RBV, and a magneton were added to the reactor. After the device was assembled, the pressure-reducing valve was opened to pressurize the reactor to 12.0 MPa. Then, the solid-liquid system in the reactor was continuously stirred with a magnetic stirrer at 300 rpm for 8 h to ensure that the system reached equilibrium, which had been proven by preliminary experiments. Then, the magnetic stirrer was stopped, and the solid–liquid system was kept still at a constant temperature for 4 h to obtain a clear, saturated solution. Finally, the liquid-taking valve was opened, and the supernatant liquid (about 5 mL) was pressed into the pre-weighed beaker through a polytetrafluoroethylene (PTFE) membrane filter (0.45 μm, Tianjin Jinteng Experimental Equipment Co., Ltd., Tianjin, China).
For comparison, the solubility of RBV in four solvents at 0.1 MPa was also determined by the gravimetric method. A jacketed crystallizer was used for measurements, and the steps were similar to the above description. The difference was that the supernatant was extracted through a syringe, and then was quickly filtered into a pre-weighed beaker through the above PTFE membrane filter.
The beaker containing the supernatant was weighted quickly and dried in a vacuum oven at 333.15 K for 72 h to ensure that the solvent was completely volatilized. The above operations were performed three times, and the average value was taken to calculate the solubility data. The solubility of ribavirin expressed in the molar fraction was calculated according to the following equation [20]:
where m1 and M1 are the mass and molar mass of RBV, respectively, and m2 and M2 are the mass and molar mass of the pure solvent, respectively.
2.4. Induction Time Measurement
The induction time (tind) is defined as the time from the generation of constant supersaturation to the appearance of crystals [21,22]. In this paper, the induction time of the cooling crystallization of RBV in water was measured by naked eye observation [23]. All measurements were carried out in the same high-pressure reactor, with pressures of 0.1 MPa, 5.0 MPa and 10.0 MPa and temperatures of 283.15 K, 293.15 K and 303.15 K, respectively. Firstly, RBV (Form II) aqueous solution with different supersaturation (S) was prepared. The preparation temperatures of supersaturated solutions at 283.15 K, 293.15 K and 303.15 K were 308.15 K, 313.15 K and 318.15 K, respectively, to ensure that the solute was completely dissolved. Then, 50 mL of supersaturated solution was quickly transferred into the pre-cooled reactor. The high-pressure nitrogen was added to the reactor when the solution was cooled down to the preset temperature. Then, the mechanical stirring was started at speed of 200 rpm and the timing was started. After the crystals appeared, the timing was stopped, and the crystals were separated immediately and characterized by microscope and PXRD. The above operations were carried out three times, and the average value was taken to calculate the induction time.
The supersaturation was calculated by Equation (2).
where c is the actual concentration of the solute, and c0 is the equilibrium concentration of the solute.
2.5. Anti-Solvent Crystallization
The yield and crystal form of anti-solvent crystallization at 10.0 MPa and 0.1 MPa were compared. Firstly, RBV (5 g, Form II) was dissolved in solvent (15 g, water, dimethyl sulfoxide, and dimethylformamide). Then, anti-solvent (15 mL, alcohol solvents such as methanol, ethyl acetate, and butyl acetate) was added to the solution. The solution was stood for 24 h at 10.0 MPa and atmospheric pressure at 20 ℃ to allow crystal nucleation and growth. Finally, the solution was filtered, and the crystals were washed with ethanol and dried at room temperature. The crystals were weighed and characterized by PXRD. The above operations were carried out three times and the average value was taken for further calculation.
3. Results and Discussion
3.1. Effect of High Pressure on Solubility
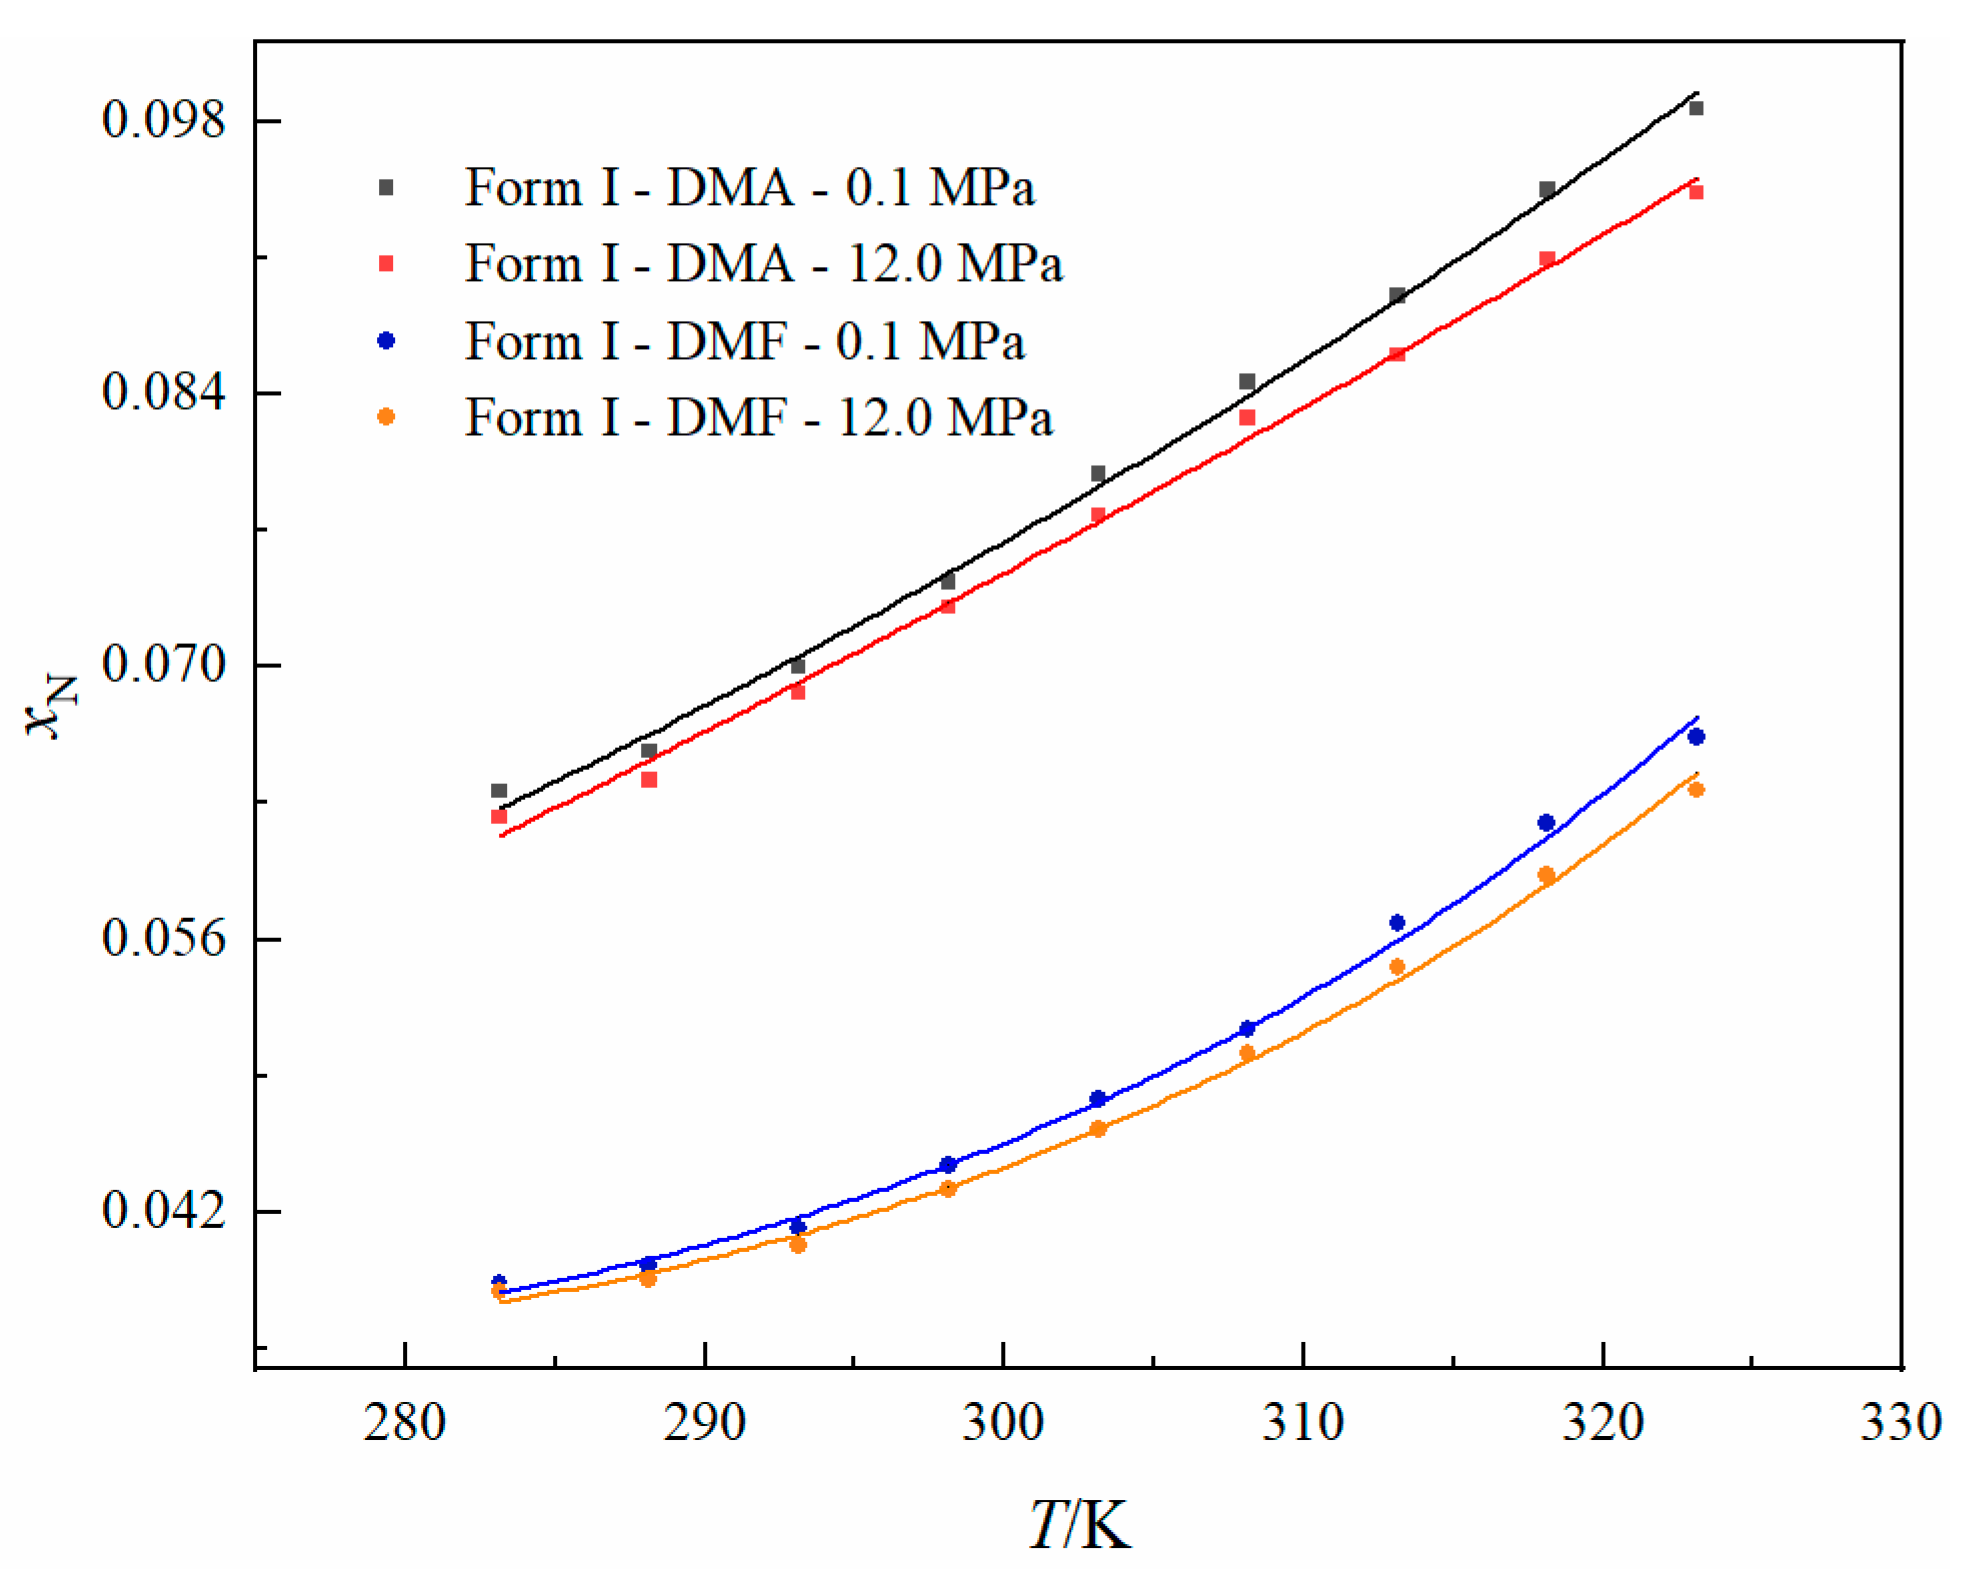
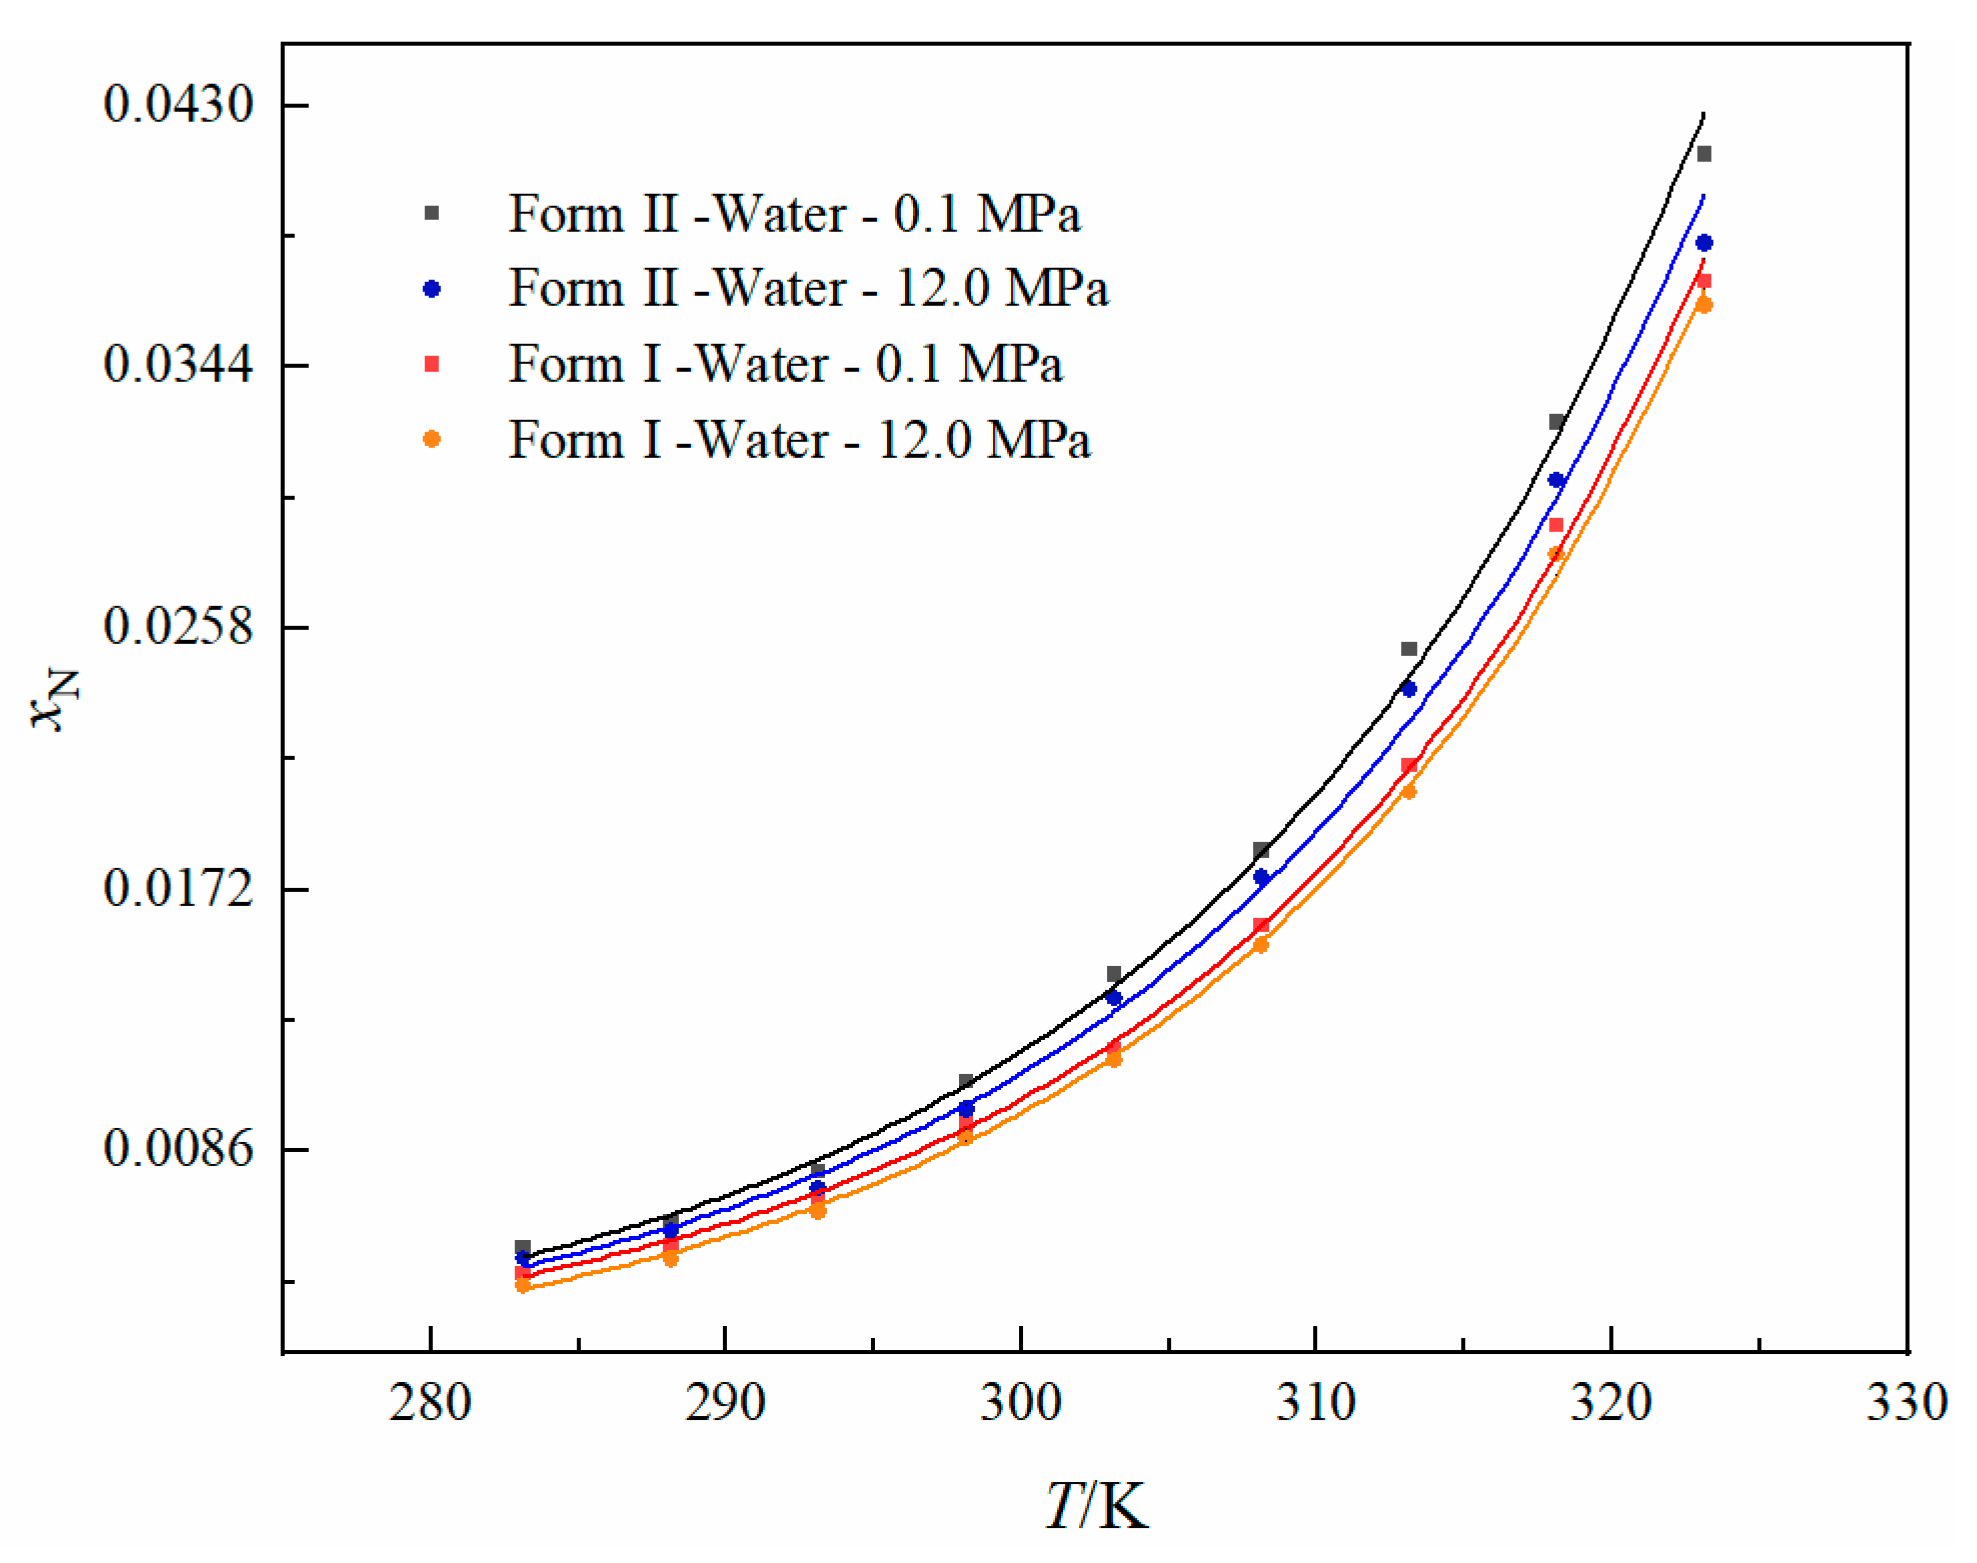
The solubility data of RBV in four solvents at 12.0 MPa and 0.1 MPa are shown in Tables S1 and S2 and Figure 3 and Figure 4. The experimental solubility data were correlated by the modified Apelblat model Equation (3), and the fitting curves are also given in Figure 3 and Figure 4.
where x1 represents the mole fraction solubility of RBV. T is the temperature (K). A, B, and C are model parameters [24].
The results indicate that all the solubilities of the two crystal forms of RBV at 12.0 MPa decrease slightly when compared with those at 0.1 MPa. The solubility data of RBV increase significantly with the increase in temperature whether at 12.0 MPa or 0.1 MPa. The effect of pressure on solubility values is weaker than the effect of temperature. In addition, the solubility of Form I in water is smaller than that of Form II, which is consistent with Form I being a thermodynamically stable form.
The PXRD patterns and DSC plots of the RBV (Form I and Form II) used in the solubility experiment are shown in Figures S1 and S2. The PXRD patterns of undissolved wet solid taken out after the solubility experiments are shown in Figure S3. It can be seen that the PXRD patterns of the samples before and after the experiments are consistent, and they are all pure crystal forms. Therefore, no polymorphic transformation or solvate formation happened in the solubility experiments at two pressures. Furthermore, the decrease in solubility at high pressure is not caused by crystal transformation.
3.2. Effect of High Pressure on the Induction Time
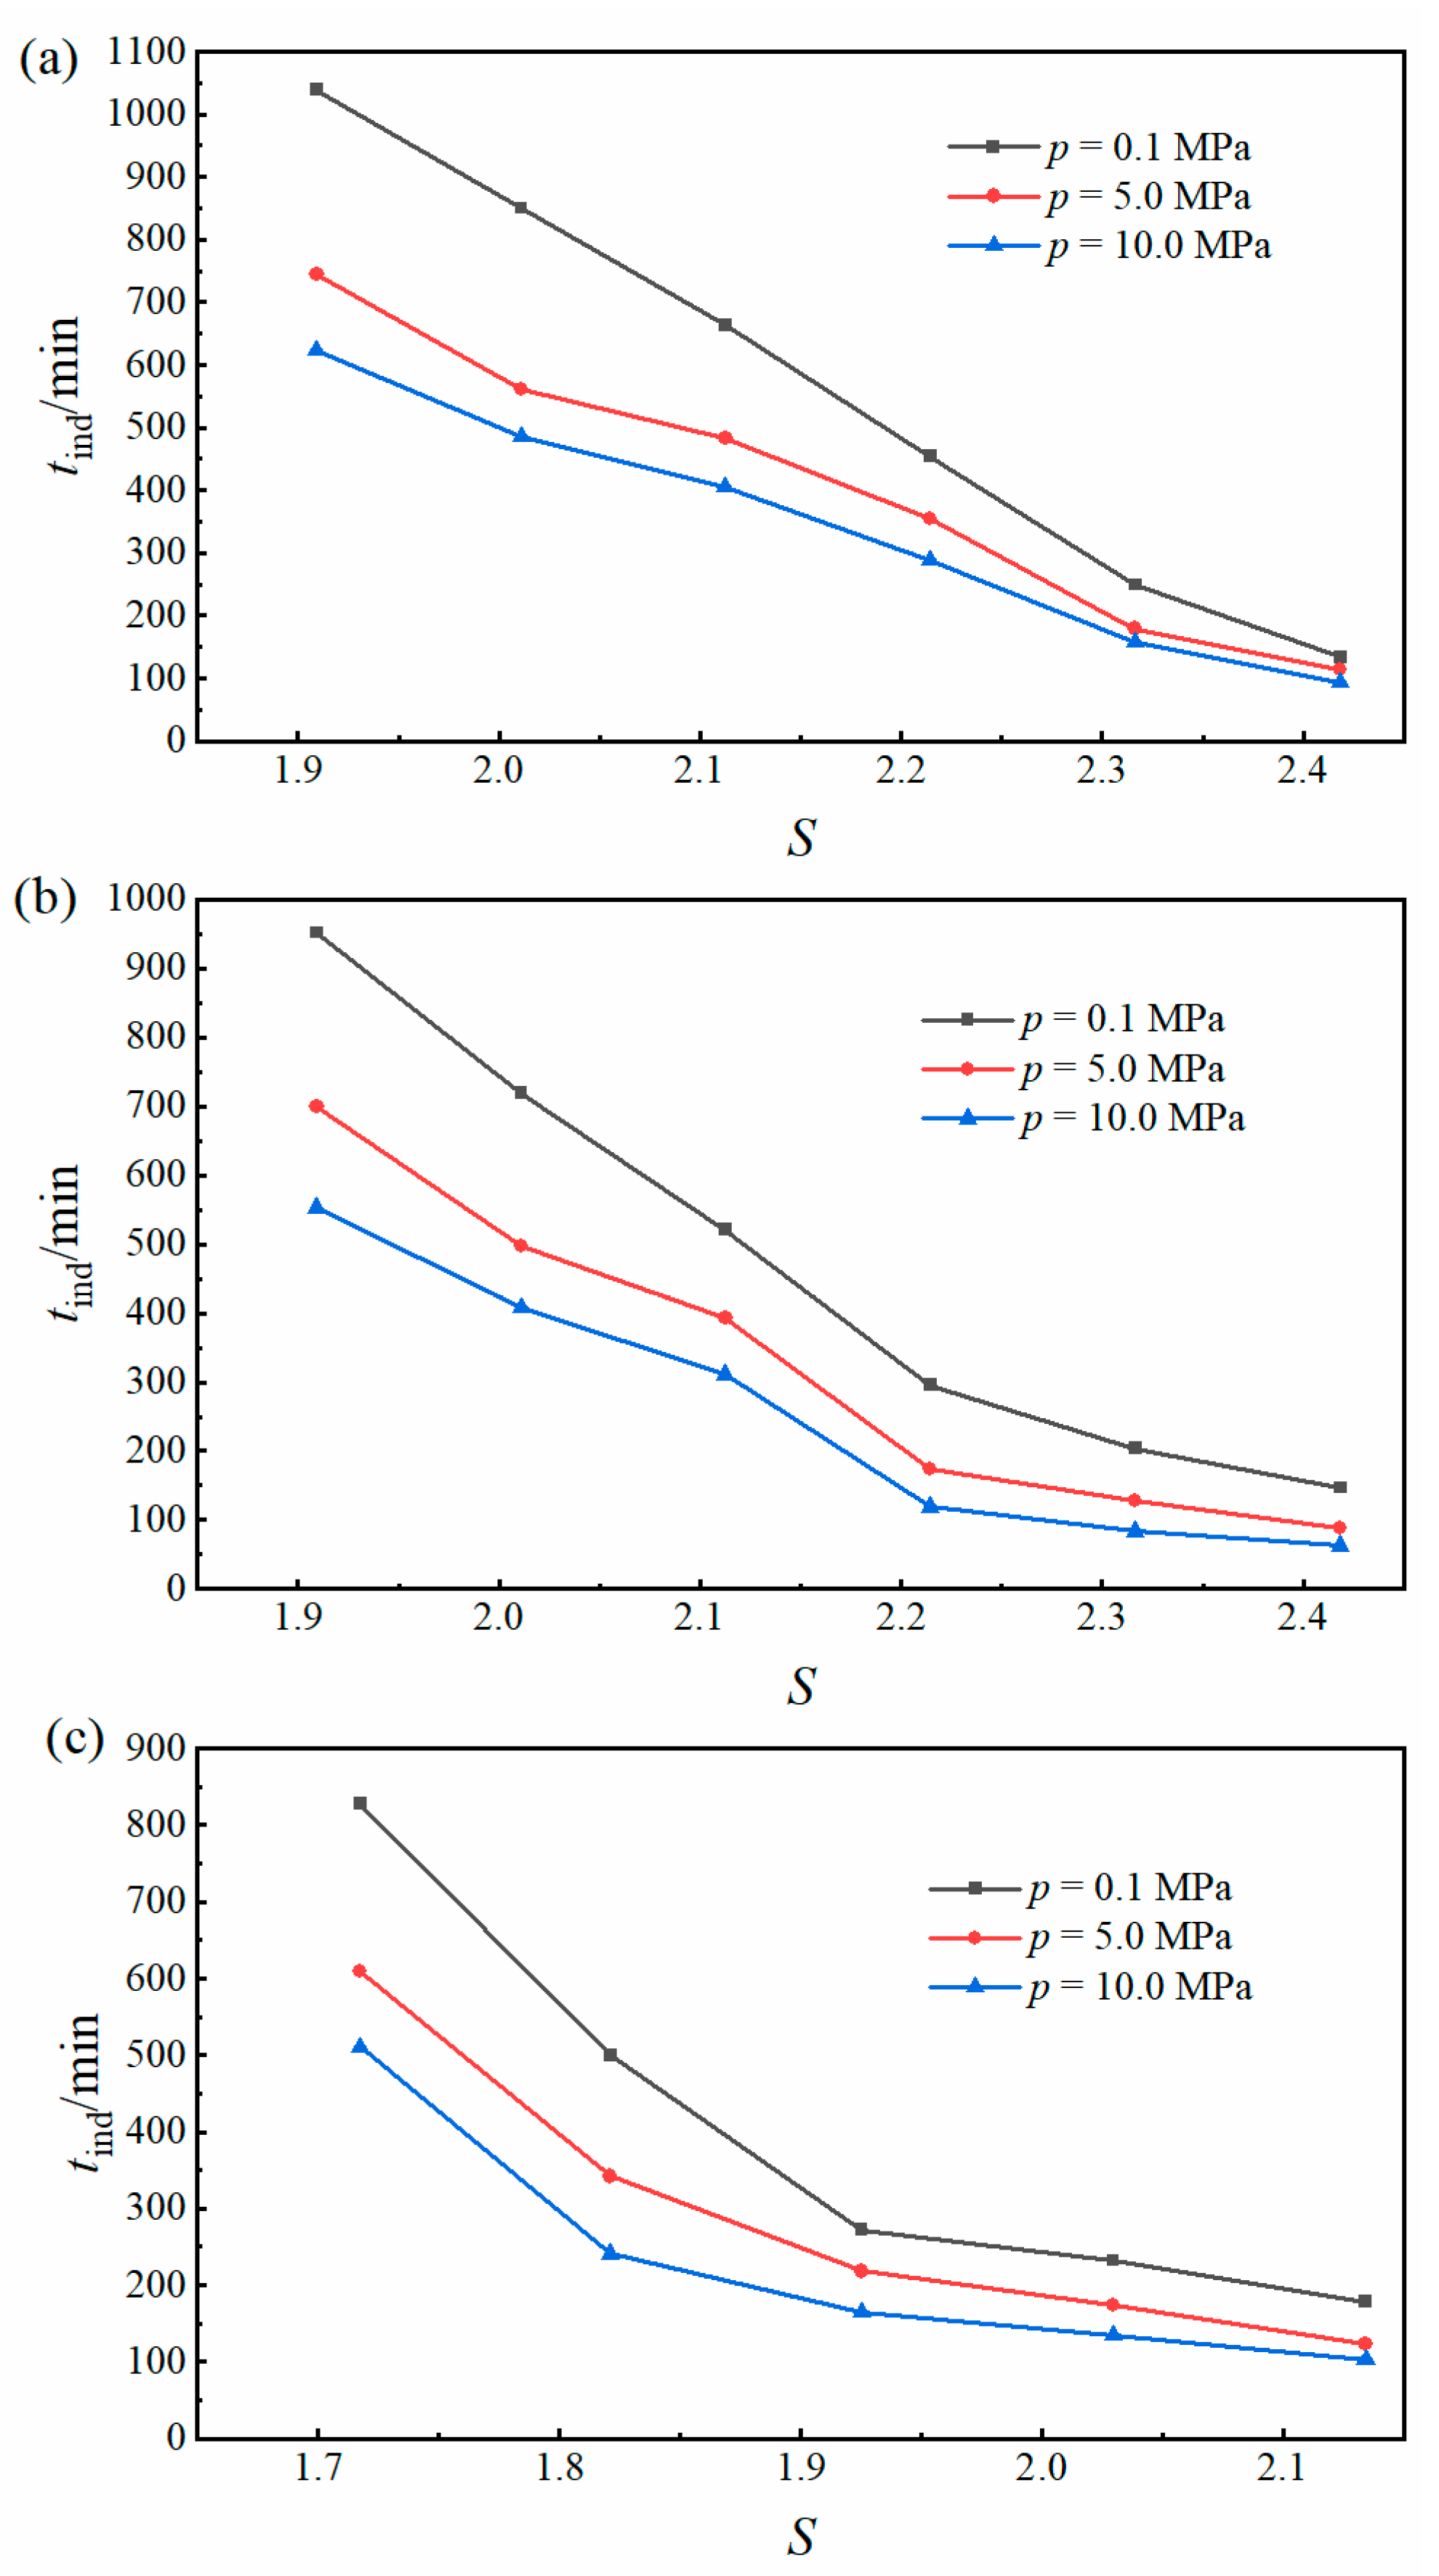
The influence of high pressure on the induction time of the cooling crystallization of RBV in water is shown in Figure 5. The specific induction time data are listed in Table S3. For the convenience of calculation and comparison, all the calculations of supersaturation under high pressure in this section were based on the solubility data of RBV (Form II) at atmospheric pressure. At the same time, it is also because Form II is the polymorph always obtained in the induction time experiment. It can be seen that the induction time decreases significantly with the increasing concentration of RBV, whether at atmospheric pressure or high pressure. More importantly, the induction time of RBV cooling crystallization decreases significantly at high pressure. The PXRD characterization shows that all the crystals obtained in the induction time experiment are RBV (Form II). Therefore, the reduction in the induction time is independent of the crystal form of RBV. The high pressure may enhance the collision probability of solute molecules in the solution, thus promoting the nucleation process.
3.3. Effect of High Pressure on the Nucleation Kinetics
To quantitatively explain the effect of pressure on nucleation rate, the nucleation kinetic parameters under different pressures were calculated according to the classical nucleation theory (CNT) [25,26,27]. The crystal nucleation rate equation in the classical nucleation theory is given by the following formula [28,29]:
where J represents the nucleation rate (m−3 s−1), A is the pre-exponential factor, T is the nucleation temperature (K), κ refers to the Boltzmann constant (J K−1), S is the supersaturation ratio, γ is the crystal-solution interfacial tension (J K−1), and Vm is the molecular volume of the solute molecule (m3) [30]. In this paper, the molecular volume of RBV is 1.943 × 10⁻²⁸ m3, which was calculated according to the Avogadro constant and the molar volume obtained from CAS SciFindern Database.
There is an inverse relationship between nucleation rate and induction time, which can be expressed follows:
Therefore, the relationship between supersaturation and induction time can be written as follows:
A linear relationship exists between lntind and ln−2S. By linear fitting, the interfacial tension (γ) can be obtained from the slope (α):
Generally, the lower the interfacial energy, the easier the nucleation will be [31]. Based on the interfacial tension and supersaturation, the other four nucleation parameters, including the change of Gibbs free energy per unit volume (ΔGV), the critical nucleation radius (r*), the change of critical Gibbs free energy (ΔG*), and the number of molecules constituting the critical nucleus (i*) can be calculated by the following equations [32,33]:
Among them, ΔGV can represent the driving force of nucleation, where ΔG* represents the critical energy barrier that must be overcome in the nucleation process [32].
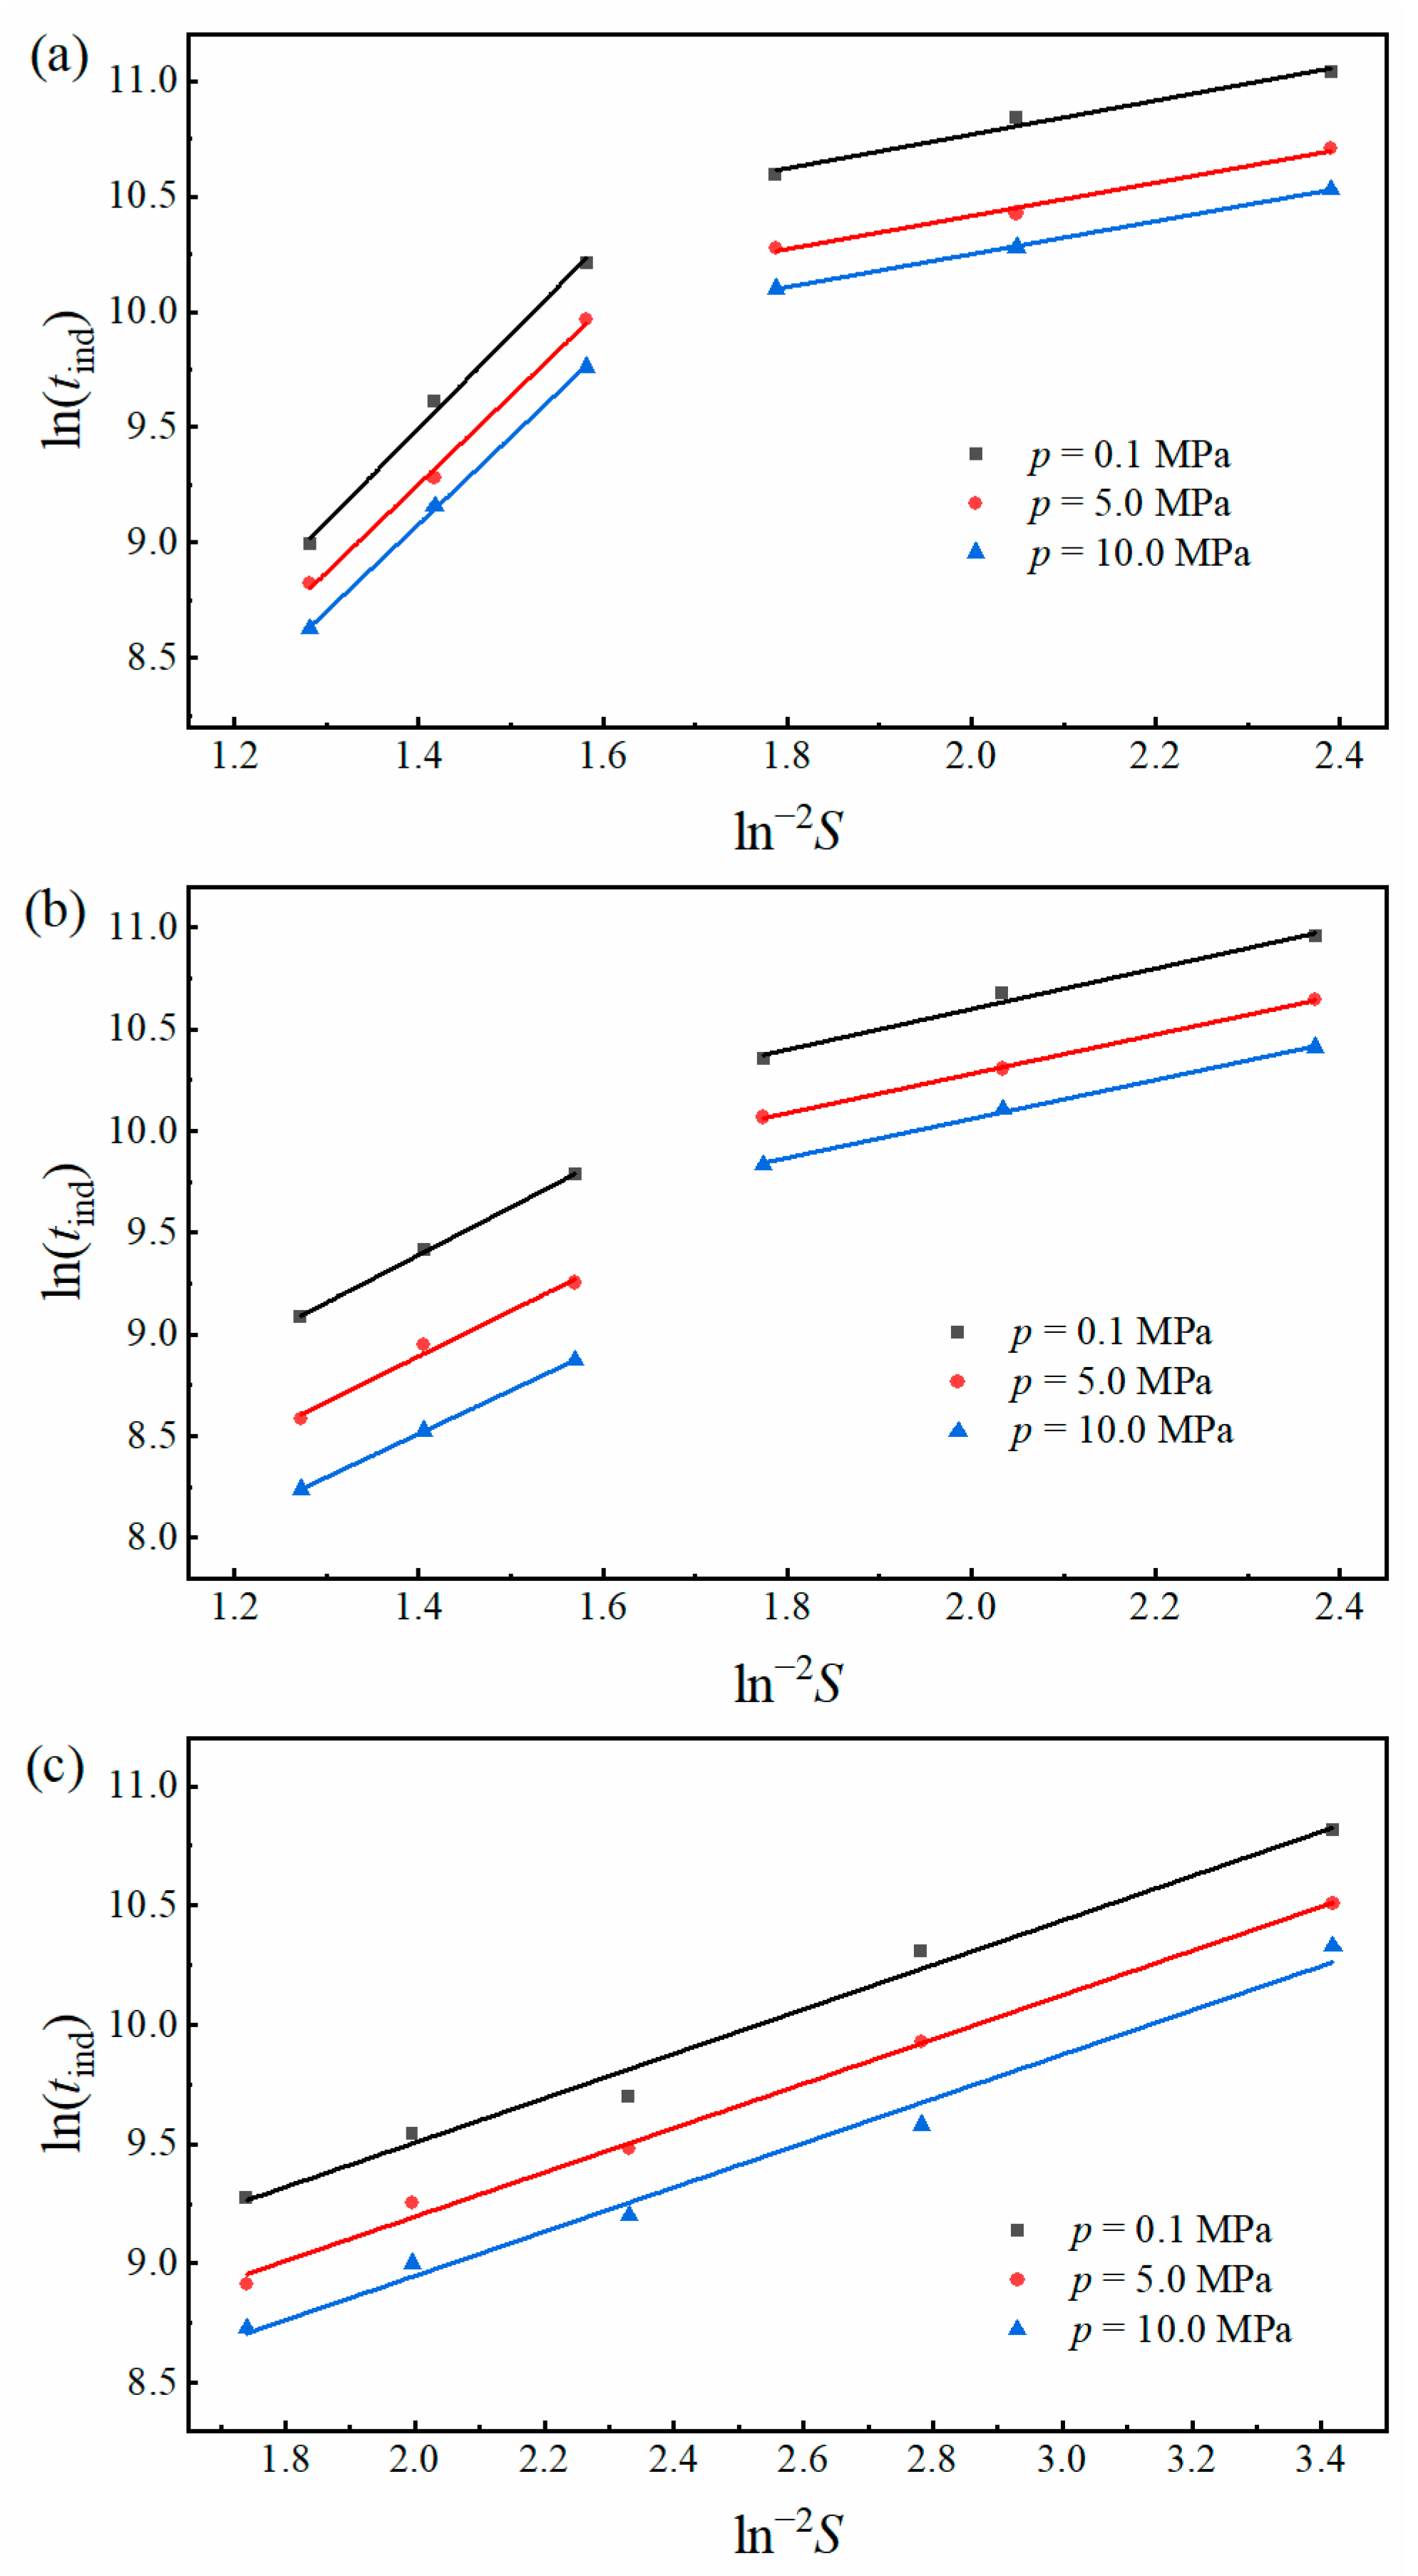
The linear fitting between ln(tind) and ln−2S is shown in Figure 6. It can be found that there is more than one linear relationship between ln(tind) and ln−2S at 283.15 K, 293.15 K, and the experimental supersaturation. According to the classical nucleation theory, homogeneous nucleation is dominant in the nucleation process at high supersaturation, whereas heterogeneous nucleation will be dominant at low supersaturation [34,35]. Therefore, there may be two different linear relationships. It can be found from Figure 6 that there are two linear lines between ln(tind) and ln−2S at 283.15 K, 293.15 K. The high supersaturation range with a large slope indicates the homogeneous nucleation, and the low supersaturation range with a small slope indicates the heterogeneous nucleation. At 303.15 K, there is only one linear relationship between ln(tind) and ln−2S and the slope is small, indicating the heterogeneous nucleation. In the homogeneous nucleation region, the slope (α) can be used to calculate the interfacial tension (γ) according to Equation (6) above [30].
The results of linear fitting slope and interfacial tension calculated according to the slope are shown in Table 1. The results show that the value of γ decreases with the increase in pressure, which further proves that high pressure can promote the nucleation of RBV.
Based on the interfacial tension and supersaturation, the calculation results of the other four nucleation parameters are listed in Table 2. Firstly, these four nucleation parameters decrease with the increase in supersaturation under both atmospheric pressure and high pressure, which proves that high supersaturation is conducive to nucleation. In addition, at the same supersaturation, the nucleation parameters of r*, ΔG*, and i* decrease slightly under high pressure compared with atmospheric pressure, which is consistent with the decrease in induction time under high pressure.
3.4. Effect of High Pressure on Anti-Solvent Crystallization
The yield and crystal form of anti-solvent crystallization at 10.0 MPa and 0.1 MPa are shown in Table 3, Table 4 and Table 5. It can be found that the yield of anti-solvent crystallization under high pressure is higher than that under atmospheric pressure, and it is independent of the choice of solvent. Furthermore, the increase in the pressure of several MPa does not affect the final crystal polymorph.
4. Conclusions
The crystallization process of RBV at high pressure was systematically studied. It was found that the solubility data of ribavirin in three pure solvents decrease under high pressure. In terms of crystallization kinetics, high pressure can reduce the nucleation induction period, interfacial tension, and nucleation energy barrier. Therefore, high pressure is conducive to nucleation. In addition, the results of anti-solvent crystallization under high pressure show that high pressure can improve the crystallization yield without changing the crystal form. In short, whether it is the cooling crystallization of a single solvent system or the anti-solvent crystallization of a variety of solvents system, the yield and the nucleation of the crystallization process of RBV could be enhanced.
Supplementary Materials
The following supporting information can be downloaded at: https://0-www-mdpi-com.brum.beds.ac.uk/article/10.3390/cryst12030432/s1, Table S1: Mole fraction solubility of RBV (Form I) at 0.1 MPa and 12.0 MPa; Table S2: Mole fraction solubility of RBV (Form I and Form II) in water; Figure S1: The DSC plots of the RBV raw material (Form I and Form II); Figure S2: The PXRD patterns of the RBV raw material (Form I and Form II); Figure S3: The PXRD patterns of residual solid in solubility experiment; Table S3: The induction time of cooling crystallization of RBV in water at different pressures.
Author Contributions
Conceptualization, Y.F. and H.H.; Methodology, Y.F.; Software, N.W.; Validation, Y.F., H.H. and X.H.; Formal Analysis, T.W.; Investigation, Y.C.; Resources, H.H.; Data Curation, Y.F.; Writing—Original Draft Preparation, Y.F.; Writing—Review and Editing, H.H.; Visualization, N.W.; Supervision, X.H.; Project Administration, X.H.; Funding Acquisition, H.H. All authors have read and agreed to the published version of the manuscript.
Funding
This research was funded by National Natural Science Foundation of China, grant number 21978201 and 21908159.
Institutional Review Board Statement
Not applicable.
Informed Consent Statement
Not applicable.
Data Availability Statement
Not applicable.
Acknowledgments
The author thanks the National Engineering Research Center of Industrial Crystallization Technology of Tianjin University for equipment support.
Conflicts of Interest
The authors declare no competing financial interest.
References
- Orehek, J.; Teslić, D.; Likozar, B. Continuous Crystallization Processes in Pharmaceutical Manufacturing: A Review. Org. Process Res. Dev. 2021, 25, 16–42. [Google Scholar] [CrossRef]
- Parks, C.; Koswara, A.; Tung, H.-H.; Nere, N.; Bordawekar, S.; Nagy, Z.K.; Ramkrishna, D. Molecular Dynamics Electric Field Crystallization Simulations of Paracetamol Produce a New Polymorph. Cryst. Growth Des. 2017, 17, 3751–3765. [Google Scholar] [CrossRef]
- Potticary, J.; Hall, C.L.; Guo, R.; Price, S.L.; Hall, S.R. On the Application of Strong Magnetic Fields during Organic Crystal Growth. Cryst. Growth Des. 2021, 21, 6254–6265. [Google Scholar] [CrossRef]
- Yu, J.; Yan, J.; Jiang, L. Crystallization of Polymorphic Sulfathiazole Controlled by Femtosecond Laser-Induced Cavitation Bubbles. Cryst. Growth Des. 2021, 21, 3202–3210. [Google Scholar] [CrossRef]
- Los Santos Castillo-Peinado, L.; Luque de Castro, M. The role of ultrasound in pharmaceutical production: Sonocrystallization. J. Pharm. Pharmacol. 2016, 68, 1249. [Google Scholar] [CrossRef] [PubMed]
- Wu, K.; Wu, H.; Dai, T.; Liu, X.; Chen, J.; Le, Y. Controlling Nucleation and Fabricating Nanoparticulate Formulation of Sorafenib Using a High-Gravity Rotating Packed Bed. Ind. Eng. Chem. Res. 2018, 57, 1903. [Google Scholar] [CrossRef]
- Guerain, M. A Review on High Pressure Experiments for Study of Crystallographic Behavior and Polymorphism of Pharmaceutical Materials. J. Pharm. Sci. 2020, 109, 2640. [Google Scholar] [CrossRef]
- Zhang, L.; Wang, Y.; Lv, J.; Ma, Y. Materials discovery at high pressures. Nat. Rev. Mater. 2017, 2, 17005. [Google Scholar] [CrossRef]
- Fabbiani, F.; Allan, D.; Dawson, A.; David, W.; McGregor, P.; Oswald, I.; Parsons, S.; Pulham, C. Pressure-induced formation of a solvate of paracetamol. Chem. Commun. 2003, 3, 3004. [Google Scholar] [CrossRef] [Green Version]
- Ferstl, P.; Eder, C.; Ruß, W.; Wierschem, A. Pressure-induced crystallization of triacylglycerides. High Press. Res. 2011, 31, 339–349. [Google Scholar] [CrossRef]
- Zakharov, B.A.; Boldyreva, E.V. A high-pressure single-crystal to single-crystal phase transition inDL-alaninium semi-oxalate monohydrate with switching-over hydrogen bonds. Acta Crystallogr. Sect. B Struct. Sci. Cryst. Eng. Mater. 2013, 69, 271–280. [Google Scholar] [CrossRef] [PubMed]
- Minkov, V.S.; Goryainov, S.V.; Boldyreva, E.V.; Görbitz, C.H. Raman study of pressure-induced phase transitions in crystals of orthorhombic and monoclinic polymorphs of L-cysteine: Dynamics of the side chain. J. Raman Spectrosc. 2010, 41, 1748–1758. [Google Scholar] [CrossRef]
- Fisch, M.; Lanza, A.; Boldyreva, E.; Macchi, P.; Casati, N. Kinetic Control of High-Pressure Solid-State Phase Transitions: A Case Study on l-Serine. J. Phys. Chem. C 2015, 119, 18611–18617. [Google Scholar] [CrossRef] [Green Version]
- Olejniczak, A.; Krūkle-Bērziņa, K.; Katrusiak, A. Pressure-Stabilized Solvates of Xylazine Hydrochloride. Cryst. Growth Des. 2016, 16, 3756–3762. [Google Scholar] [CrossRef]
- Marciniak, J.; Kaźmierczak, M.; Rajewski, K.W.; Katrusiak, A. Volume and Pressure Effects for Solvation: The Case Study on Polymorphs of Neat Triiodoimidazole Replaced by Its Solvate. Cryst. Growth Des. 2016, 16, 3917–3923. [Google Scholar] [CrossRef]
- Clercq, E.D.; Li, G. Approved Antiviral Drugs over the Past 50 Years. Clin. Microbiol. Rev. 2016, 29, 695. [Google Scholar] [CrossRef] [PubMed] [Green Version]
- Vasa, D.M.; Wildfong, P.L. Solid-state transformations of ribavirin as a result of high-shear mechanical processing. Int. J. Pharm. 2017, 524, 339–350. [Google Scholar] [CrossRef] [PubMed]
- Xing, C.; Song, J.; Zhang, L.; Yang, S.; Shi, Y.; Du, G.; Lu, Y. Polymorphism and Pharmacokinetic Research of Ribavirin. Chin. Pharm. J. 2013, 48, 621. [Google Scholar]
- Li, X.; Huang, X.; Luan, Y.; Li, J.; Wang, N.; Zhang, X.; Ferguson, S.; Meng, X.; Hao, H. Solubility and thermodynamic properties of 5-nitrofurazone form γ in mono-solvents and binary solvent mixtures. J. Mol. Liq. 2019, 275, 815–828. [Google Scholar] [CrossRef]
- Ji, X.; Wang, J.; Yang, J.; Wang, N.; Li, X.; Tian, B.; Huang, X.; Hao, H. Solubility and isoelectric point of cefradine in different solvent systems. J. Mol. Liq. 2020, 300, 112312. [Google Scholar] [CrossRef]
- Li, D.; Wang, Y.; Zong, S.; Wang, N.; Li, X.; Dong, Y.; Wang, T.; Huang, X.; Hao, H. Unveiling the self-association and desolvation in crystal nucleation. IUCrJ 2021, 8, 468–479. [Google Scholar] [CrossRef] [PubMed]
- de Castro, M.L.D.; Priego-Capote, F. Ultrasound-assisted crystallization (sonocrystallization). Ultrason. Sonochemistry 2007, 14, 717–724. [Google Scholar] [CrossRef] [PubMed]
- Su, M.; Han, J.; Li, Y.; Chen, J.; Zhao, Y.; Chadwick, K. Ultrasonic Crystallization of Calcium Carbonate in Presence of Seawater Ions. Desalination 2015, 369, 85–90. [Google Scholar] [CrossRef]
- Baluja, S.; Hirapara, A. Solubility and solution thermodynamics of novel pyrazolo chalcone derivatives in various solvents from 298.15 K to 328.15 K. J. Mol. Liq. 2019, 277, 692–704. [Google Scholar] [CrossRef]
- Teychené, S.; Biscans, B. Nucleation Kinetics of Polymorphs: Induction Period and Interfacial Energy Measurements. Cryst. Growth Des. 2008, 8, 1133–1139. [Google Scholar] [CrossRef]
- Zhao, Y.; Hou, B.; Liu, C.; Ji, X.; Huang, Y.; Sui, J.; Liu, D.; Wang, N.; Hao, H. Mechanistic Study on the Effect of Magnetic Field on the Crystallization of Organic Small Molecules. Ind. Eng. Chem. Res. 2021, 60, 15741–15751. [Google Scholar] [CrossRef]
- Liu, X.; Wang, Z.; Duan, A.; Zhang, G.; Wang, X.; Sun, Z.; Zhu, L.; Yu, G.; Sun, G.; Xu, D. Measurement of l-arginine trifluoroacetate crystal nucleation kinetics. J. Cryst. Growth 2008, 310, 2590–2592. [Google Scholar] [CrossRef]
- Hao, H.; Wang, J.; Wang, Y. Determination of induction period and crystal growth mechanism of dexamethasone sodium phosphate in methanol–acetone system. J. Cryst. Growth 2005, 274, 545–549. [Google Scholar] [CrossRef]
- Zhou, L.; Wang, Z.; Zhang, M.; Guo, M.; Xu, S.; Yin, Q. Determination of metastable zone and induction time of analgin for cooling crystallization. Chin. J. Chem. Eng. 2017, 25, 313–318. [Google Scholar] [CrossRef]
- Lenka, M.; Sarkar, D. Determination of metastable zone width, induction period and primary nucleation kinetics for cooling crystallization of l-asparaginenohydrate. J. Cryst. Growth 2014, 408, 85. [Google Scholar] [CrossRef]
- Karthika, S.; Radhakrishnan, T.; Kalaichelvi, P. Measurement of nucleation rate of ibuprofen in ionic liquid using induction time method. J. Cryst. Growth 2019, 521, 55–59. [Google Scholar] [CrossRef]
- Devi, K.R.; Raja, A.; Srinivasan, K. Ultrasound assisted nucleation and growth characteristics of glycine polymorphs—A combined experimental and analytical approach. Ultrason. Sonochemistry 2015, 24, 107–113. [Google Scholar] [CrossRef] [PubMed]
- Shang, Z.; Li, M.; Hou, B.; Zhang, J.; Wang, K.; Hu, W.; Deng, T.; Gong, J.; Wu, S. Ultrasound assisted crystallization of cephalexin monohydrate: Nucleation mechanism and crystal habit control. Chin. J. Chem. Eng. 2022, 41, 430–440. [Google Scholar] [CrossRef]
- Li, X.; Yin, Q.; Zhang, M.; Hou, B.; Bao, Y.; Gong, J.; Hao, H.; Wang, Y.; Wang, J.; Wang, Z. Antisolvent Crystallization of Erythromycin Ethylsuccinate in the Presence of Liquid–Liquid Phase Separation. Ind. Eng. Chem. Res. 2016, 55, 766. [Google Scholar] [CrossRef]
- Cui, P.; Zhang, X.; Yin, Q.; Gong, J. Evidence of Hydrogen-Bond Formation during Crystallization of Cefodizime Sodium from Induction-Time Measurements and In Situ Raman Spectroscopy. Ind. Eng. Chem. Res. 2012, 51, 13663–13669. [Google Scholar] [CrossRef]
Figure 1.
Chemical structure of ribavirin.

Figure 2.
High-pressure experimental device.

Figure 3.
Mole fraction solubility of RBV (Form I) in dimethylacetamide (DMA) and dimethylformamide (DMF) at 0.1 MPa and 12.0 MPa: symbol—experimental values, curve—calculated values by the modified Apelblat model.
Figure 3.
Mole fraction solubility of RBV (Form I) in dimethylacetamide (DMA) and dimethylformamide (DMF) at 0.1 MPa and 12.0 MPa: symbol—experimental values, curve—calculated values by the modified Apelblat model.

Figure 4.
Mole fraction solubility of RBV (Form I and Form II) in water at 0.1 MPa and 12.0 MPa: symbol—experimental values, curve—calculated values by the modified Apelblat model.
Figure 4.
Mole fraction solubility of RBV (Form I and Form II) in water at 0.1 MPa and 12.0 MPa: symbol—experimental values, curve—calculated values by the modified Apelblat model.

Figure 5.
The induction time of cooling crystallization of RBV (Form II) in water at different supersaturation and pressure: (a) 283.15 K, (b) 293.15 K, (c) 303.15 K.
Figure 5.
The induction time of cooling crystallization of RBV (Form II) in water at different supersaturation and pressure: (a) 283.15 K, (b) 293.15 K, (c) 303.15 K.

Figure 6.
The plot of ln(tind) versus ln−2S for RBV (Form II) in water at different supersaturations and pressures: (a) 283.15 K, (b) 293.15 K, (c) 303.15 K.
Figure 6.
The plot of ln(tind) versus ln−2S for RBV (Form II) in water at different supersaturations and pressures: (a) 283.15 K, (b) 293.15 K, (c) 303.15 K.


Table 1.
The fitting parameters of ln(tind) and ln−2S and calculated interfacial tension.
| Pressure/MPa | α | R2 | Nucleation | γ/mJ m−2 |
|---|---|---|---|---|
| 283.15 K | ||||
| 0.1 | 4.053 | 0.9956 | Homogeneous | 7.007 |
| 0.7348 | 0.9816 | Heterogeneous | / | |
| 5.0 | 3.829 | 0.9970 | Homogeneous | 6.876 |
| 0.7207 | 0.9903 | Heterogeneous | / | |
| 10.0 | 3.776 | 0.9996 | Homogeneous | 6.844 |
| 0.7137 | 0.9997 | Heterogeneous | / | |
| 293.15 K | ||||
| 0.1 | 2.345 | 0.9996 | Homogeneous | 6.053 |
| 0.9966 | 0.9865 | Heterogeneous | / | |
| 5.0 | 2.235 | 0.9888 | Homogeneous | 5.957 |
| 0.9665 | 0.9995 | Heterogeneous | / | |
| 10.0 | 2.133 | 0.9999 | Homogeneous | 5.865 |
| 0.9569 | 0.9981 | Heterogeneous | / | |
| 303.15 K | ||||
| 0.1 | 0.9307 | 0.9870 | Heterogeneous | / |
| 5.0 | 0.9281 | 0.9961 | Heterogeneous | / |
| 10.0 | 0.9272 | 0.9871 | Heterogeneous | / |
Table 2.
The calculation results of nucleation parameters.
| S | ΔGV × 10−7/J m−3 | r*/nm | ΔG* × 10−16/J | i* |
|---|---|---|---|---|
| T = 283.15 K, p = 0.1 MPa | ||||
| 2.215 | −1.544 | 0.9080 | 4.926 | 16.13 |
| 2.316 | −1.631 | 0.8594 | 4.412 | 13.67 |
| 2.418 | −1.715 | 0.8174 | 3.992 | 11.77 |
| T = 283.15 K, p = 5.0 MPa | ||||
| 2.215 | −1.544 | 0.8910 | 4.833 | 15.24 |
| 2.316 | −1.631 | 0.8432 | 4.329 | 12.92 |
| 2.418 | −1.715 | 0.8021 | 3.917 | 11.12 |
| T = 283.15 K, p = 10.0 MPa | ||||
| 2.215 | −1.544 | 0.8868 | 4.811 | 15.03 |
| 2.316 | −1.631 | 0.8393 | 4.309 | 12.74 |
| 2.418 | −1.715 | 0.7983 | 3.899 | 10.96 |
| T = 293.15 K, p = 0.1 MPa | ||||
| 2.221 | −1.606 | 0.7537 | 3.929 | 9.226 |
| 2.324 | −1.697 | 0.7133 | 3.519 | 7.819 |
| 2.427 | −1.785 | 0.6784 | 3.183 | 6.727 |
| T = 293.15 K, p = 5.0 MPa | ||||
| 2.221 | −1.606 | 0.7417 | 3.867 | 8.793 |
| 2.324 | −1.697 | 0.7019 | 3.463 | 7.452 |
| 2.427 | −1.785 | 0.6676 | 3.132 | 6.411 |
| T = 293.15 K, p = 10.0 MPa | ||||
| 2.221 | −1.606 | 0.7303 | 3.807 | 8.392 |
| 2.324 | −1.697 | 0.6911 | 3.409 | 7.112 |
| 2.427 | −1.785 | 0.6573 | 3.084 | 6.119 |
Table 3.
The results of anti-solvent crystallization at 10.0 MPa and 0.1 MPa (DMSO as solvent).
| Anti-Solvent | p = 0.1 MPa | p = 10.0 MPa | ||
|---|---|---|---|---|
| Yield/% | Crystal Form | Yield/% | Crystal Form | |
| Methanol | 18.8 | DMSO solvate | 20.1 | DMSO solvate |
| Ethanol | 48.9 | DMSO solvate | 50.1 | DMSO solvate |
| N-propanol | 49.2 | DMSO solvate | 50.6 | DMSO solvate |
| Isopropanol | 51.4 | DMSO solvate | 52.2 | DMSO solvate |
| N-butanol | 48.4 | DMSO solvate | 49.3 | DMSO solvate |
| Isobutanol | 76.1 | DMSO solvate | 85.8 | DMSO solvate |
| Ethyl acetate | 51.4 | DMSO solvate | 61.9 | DMSO solvate |
| Butyl acetate | 35.7 | DMSO solvate | 38.8 | DMSO solvate |
Table 4.
The results of anti-solvent crystallization at 10.0 MPa and 0.1 MPa (DMF as solvent).
| Anti-Solvent | p = 0.1 MPa | p = 10.0 MPa | ||
|---|---|---|---|---|
| Yield/% | Crystal Form | Yield/% | Crystal Form | |
| Methanol | 8.83 | Form I | 12.1 | Form I |
| Ethanol | 9.28 | Form I | 14.0 | Form I |
| N-propanol | 26.1 | Form I | 43.5 | Form I |
| Isopropanol | 10.3 | Form I | 13.5 | Form I |
| N-butanol | 33.3 | Form I | 42.7 | Form I |
| Isobutanol | 28.1 | Form I | 38.1 | Form I |
| Ethyl acetate | 14.8 | Form I | 27.1 | Form I |
| Butyl acetate | 15.6 | Form I | 31.2 | Form I |
Table 5.
The results of anti-solvent crystallization at 10.0 MPa and 0.1 MPa (water as solvent).
| Anti-Solvent | p = 0.1 MPa | p = 10.0 MPa | ||
|---|---|---|---|---|
| Yield/% | Crystal Form | Yield/% | Crystal Form | |
| Methanol | 25.9 | Form II | 33.0 | Form II |
| Ethanol | 23.9 | Form II | 39.2 | Form II |
| N-propanol | 11.8 | Form II | 19.4 | Form II |
| Isopropanol | 26.5 | Form II | 30.9 | Form II |
Publisher’s Note: MDPI stays neutral with regard to jurisdictional claims in published maps and institutional affiliations. |
© 2022 by the authors. Licensee MDPI, Basel, Switzerland. This article is an open access article distributed under the terms and conditions of the Creative Commons Attribution (CC BY) license (https://creativecommons.org/licenses/by/4.0/).
Share and Cite
MDPI and ACS Style
Feng, Y.; Hao, H.; Chen, Y.; Wang, N.; Wang, T.; Huang, X. Enhancement of Crystallization Process of the Organic Pharmaceutical Molecules through High Pressure. Crystals 2022, 12, 432. https://0-doi-org.brum.beds.ac.uk/10.3390/cryst12030432
AMA Style
Feng Y, Hao H, Chen Y, Wang N, Wang T, Huang X. Enhancement of Crystallization Process of the Organic Pharmaceutical Molecules through High Pressure. Crystals. 2022; 12(3):432. https://0-doi-org.brum.beds.ac.uk/10.3390/cryst12030432
Chicago/Turabian StyleFeng, Yaoguang, Hongxun Hao, Yiqing Chen, Na Wang, Ting Wang, and Xin Huang. 2022. "Enhancement of Crystallization Process of the Organic Pharmaceutical Molecules through High Pressure" Crystals 12, no. 3: 432. https://0-doi-org.brum.beds.ac.uk/10.3390/cryst12030432
Note that from the first issue of 2016, this journal uses article numbers instead of page numbers. See further details here.