
Thermodynamics of Point Defects in Solids and Relation with the Bulk Properties: Recent Results


Section of Condensed Matter Physics and Solid Earth Physics Institute, Department of Physics, National and Kapodistrian University of Athens, Panepistimiopolis, Zografos, 157 84 Athens, Greece
*
Author to whom correspondence should be addressed.
Crystals 2022, 12(5), 686; https://0-doi-org.brum.beds.ac.uk/10.3390/cryst12050686
Submission received: 2 April 2022
/
Revised: 5 May 2022
/
Accepted: 9 May 2022
/
Published: 11 May 2022
(This article belongs to the Special Issue Feature Papers on "Hybrid and Composite Crystalline Materials" 2021-2022)
Abstract
:For several decades, the crucial question has arisen as to whether there exists any direct interconnection between the thermodynamic parameters of point defects in solids with the bulk properties of the solid under investigation. To answer this important question, an interrelation of the defect Gibbs energy in solids with bulk properties has been proposed almost half a century ago. Considering that corresponds to an isobaric and isothermal process, this interrelation states that, for different processes (defect formation, self-diffusion activation, and heterodiffusion), is proportional to the isothermal bulk modulus B and the mean volume per atom , termed cB model. Here, we review several challenging applications of this interrelation that appeared during the last decade (2011–2021), including high pressure diamond anvil measurements, high T superconductors, nuclear fuels, and materials for micro-electronics devices, applications of usefulness in Geophysics and Seismology, a problem of major technological interest, search for compositions of better target properties in Cu-Co-Si alloys via machine learning as well as two independent studies on the physical origin of this interrelation that has been further strengthened during the last few years.
1. Introduction
The question of whether the defect Gibbs energy (where i denotes the corresponding process, i.e., defect formation, f, migration, m, or self-diffusion activation, ) is explicitly interrelated with bulk properties in solids is of paramount importance in the studies of crystals. Almost half a century ago, a model [1,2,3,4,5,6,7,8,9,10,11]—hereafter called cB model—argued (e.g., see Ref. [12]) that should be proportional to the isothermal bulk modulus B and the mean volume per atom, which differs essentially [12] (for a review, see also Ref. [13]) from an earlier model by Zener [14,15,16] in which is related with the shear modulus, .
Following a strict foundation of thermodynamics of point defects in solids [12], the defect formation parameters are defined by comparing a real (i.e., containing defects) crystal either to an isobaric ideal (i.e., not containing defects) crystal or to an isochoric ideal crystal. Thus, there are two different families of defect formation parameters, which are interconnected through thermodynamic relations in which the isothermal bulk modulus B plays an important role [12]. The isobaric parameters are defined in terms of the corresponding Gibbs energy () as follows:
and hence ,
where (P and T denote the pressure and temperature, respectively) and , and designate the defect formation entropy, enthalpy, and volume, respectively.
According to the cB model, the defect Gibbs energy is interconnected with the bulk properties of the solid through the relation [2,3,4,5,6,7,8,9,10,11] (cf., for its justification, see Ref. [12]):
where is dimensionless, which—to the first approximation—can be considered as independent of temperature and pressure (cf. this approximation holds if the ratio —where refers to the pressure range under consideration—is appreciably smaller than unity; otherwise, a correction factor should be also taken into account, see p. 126 of Ref. [12]). The superscript i in Equation (4) refers, as mentioned, to the defect processes under consideration, i.e., f, , m (formation, activation and migration, respectively), and of course . By inserting Equation (4) into Equations (1)–(3), we find
where is the thermal (volume) expansion coefficient of the bulk material. These relations suggest that the quantities , and solely depend on bulk properties. Furthermore, we note that, for the defect volume , its thermal expansion coefficient and compressibility can be explicitly calculated from Equation (7) and—as shown in detail in Ref. [12]—exceed markedly the corresponding quantities and , respectively of the bulk solid. They are given by
and
which can be alternatively written as:
and
When a single mechanism is operating in mono-atomic crystals, the self-diffusion activation process can be expressed through the activation Gibbs energy , which stands for the sum of the Gibbs energies and corresponding to the formation and migration processes, respectively. The activation entropy and the activation enthalpy are then defined accordingly (e.g., see Ref. [12]): and and the diffusion coefficient D is given by
and, inserting Equation (4) into Equation (12), we get
where is a numerical constant depending on the diffusion mechanism and the structure, denotes the lattice constant, and the attempt frequency which is of the order of the Debye frequency . The plots versus (for P = const) and versus P (for T = const) are usually found to be straight lines that reflect that varies linearly upon increasing the temperature (for P = const) and pressure (for T = const), respectively, but in some cases, e.g., Na, these plots deviate strongly from linearity.
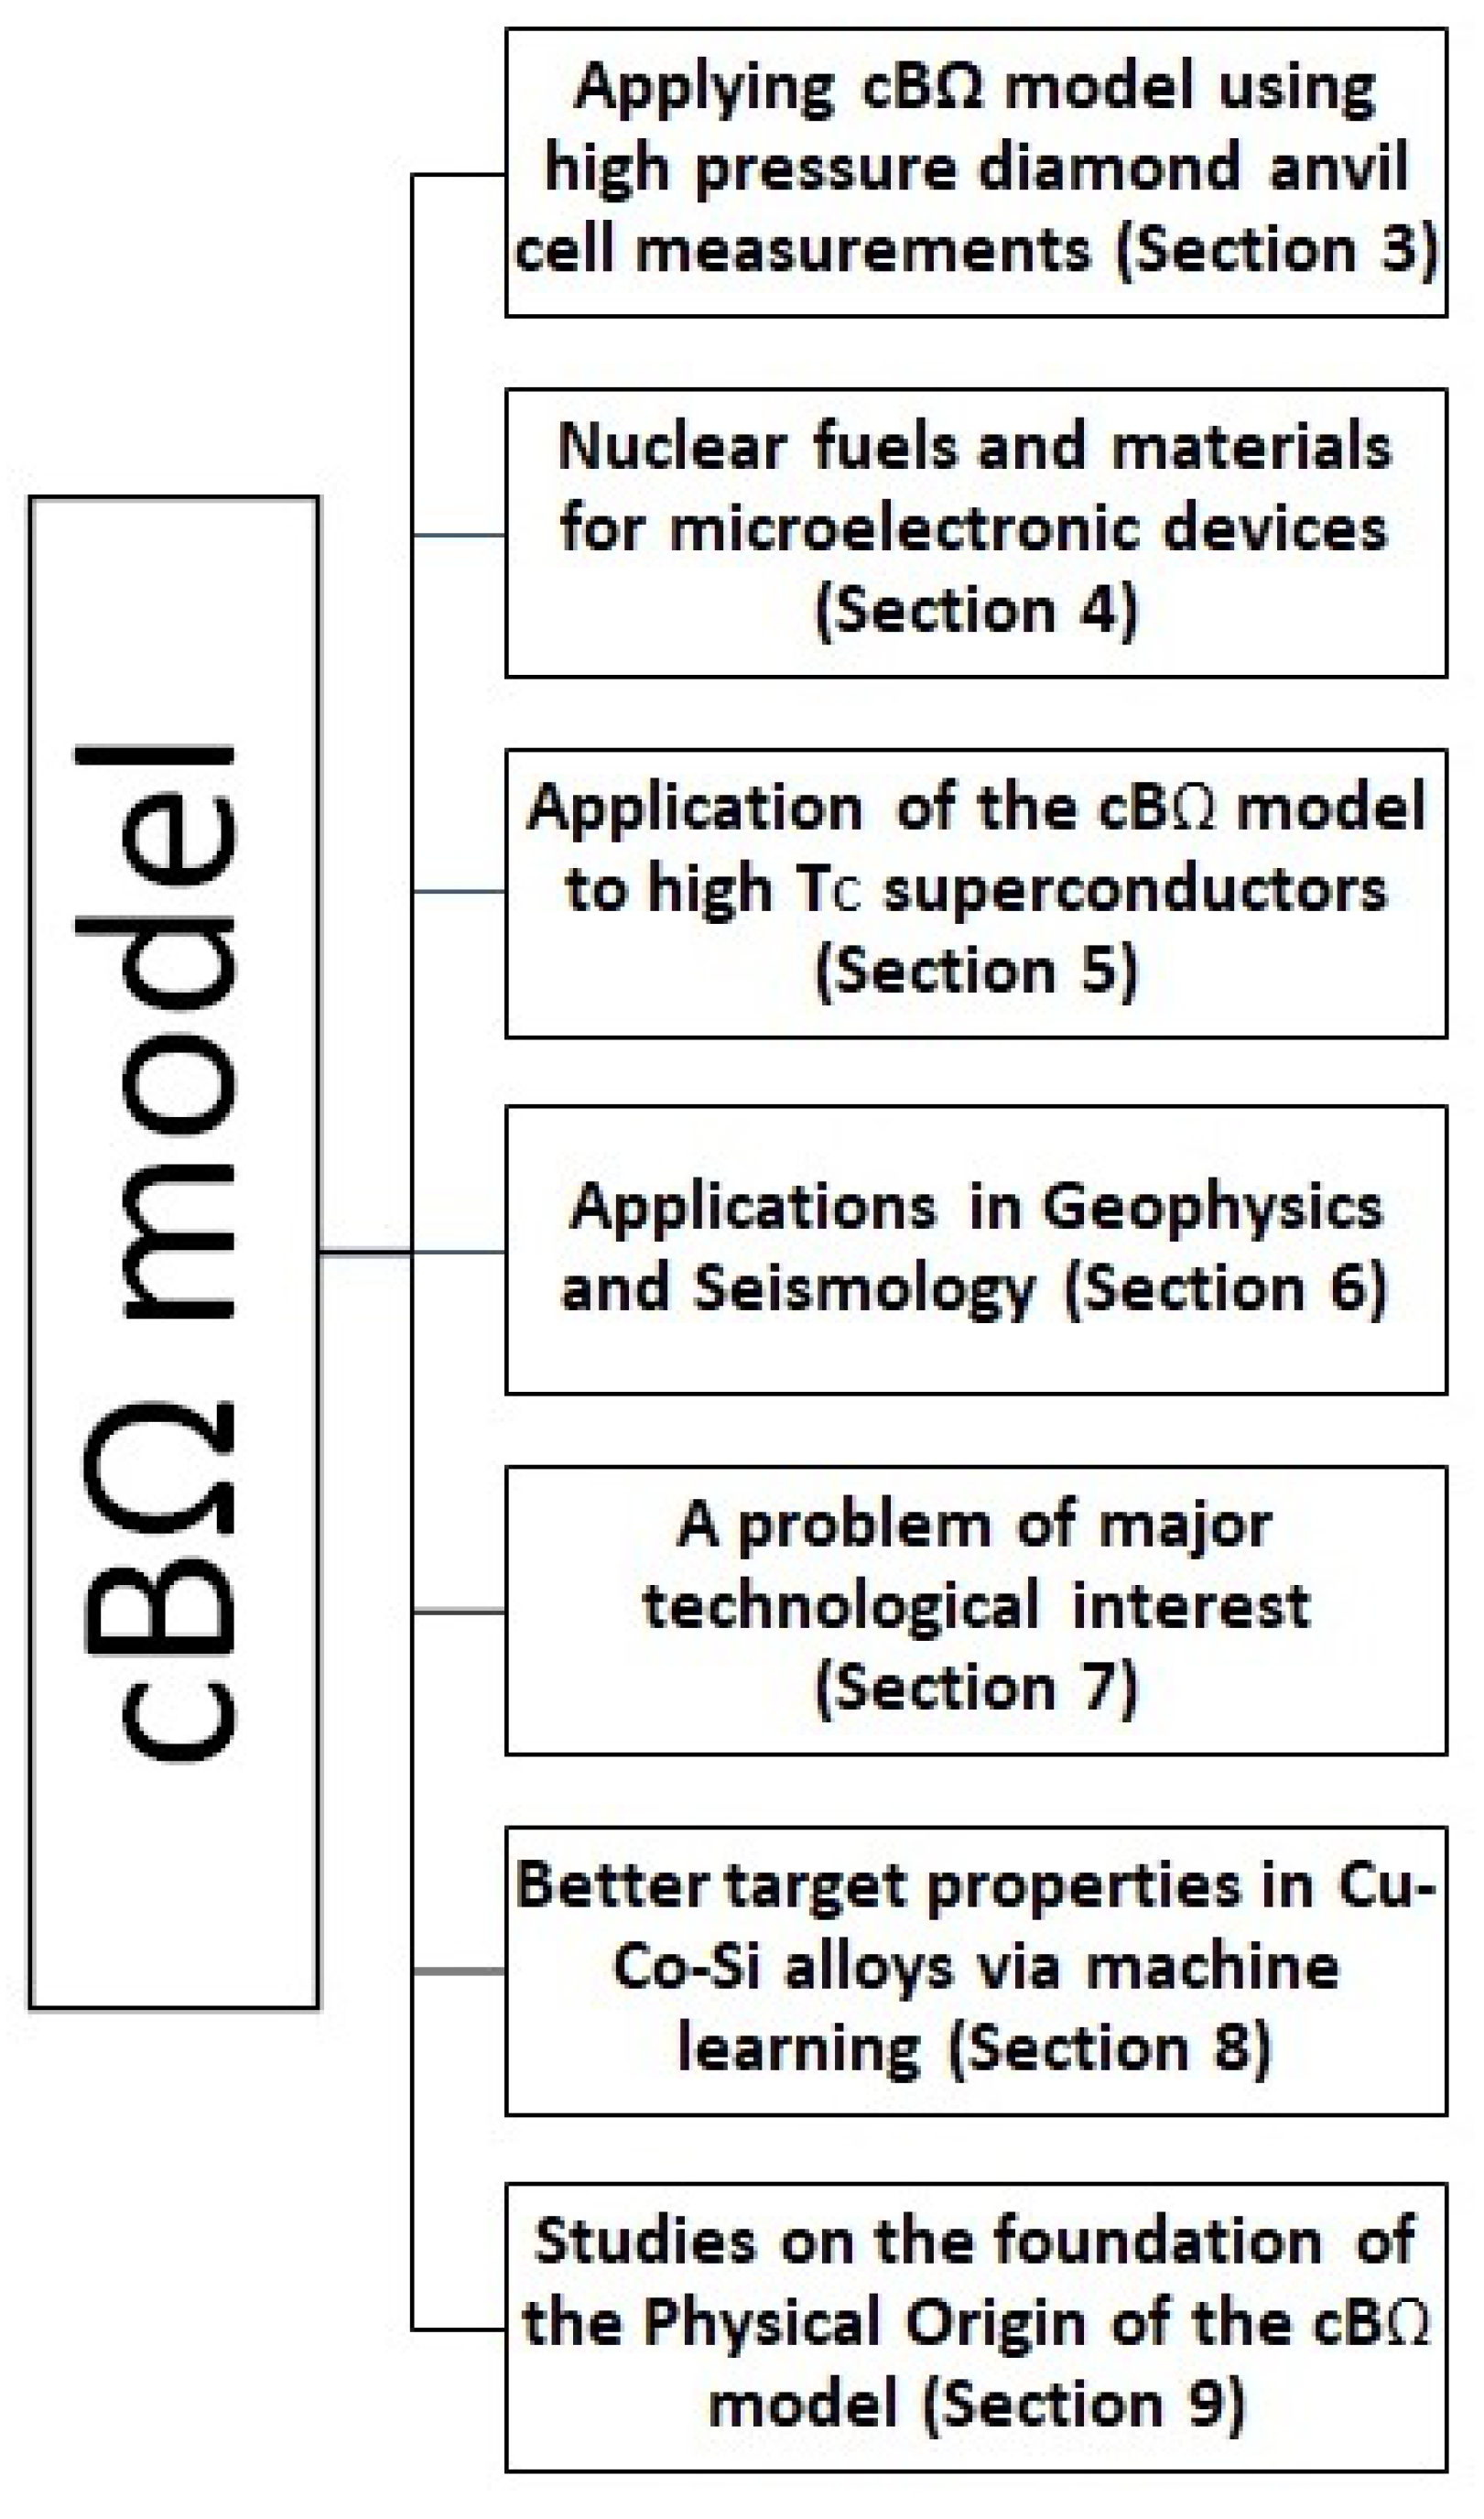
It is the scope of this feature article to present the most striking applications of the cB model that appeared in the literature in various scientific disciplines during the last decade, as well as two studies on the foundation of the physical origin of the cB model which have just been published during the last two years; see the block diagram in Figure 1. In view of the multitude of the scientific disciplines discussed in each box of the block diagram, we insert for reader’s convenience the section at which each of the matters is described.
2. Materials and Methods
The temperature variation of D at a constant pressure can be deduced in the frame of the cB model as follows (for a review, see also Ref. [13]): When the value is determined experimentally at a temperature , the value of can be estimated because the factor is approximately known. An error of around 2 when setting equal to does not change the value of significantly [8]. Hence, once the value of has been determined from , the value of for any temperature can be estimated from Equation (13) if the elastic and expansivity data are known at this temperature. Once has been estimated , the values of , , and can be computed at any temperature from Equations (5)–(7), respectively. The D value can be studied at any pressure for const when is estimated through Equation (13) from measured at a single pressure .
3. Applying cB Model to High Pressure Diamond Anvil Measurements
Lithium fluoride (LiF) is a unique crystal that exhibits the largest band gap. It is believed that it remains transparent to visible light under stresses in excess of 1000 GPa [17]. Before 2014, the high-pressure static compression behavior of LiF has been determined only up to 9 GPa under hydrostatic conditions [18]. In 2014, the compression behavior of LiF and its equation of state have been determined to 92 GPa by X-ray diffraction in a diamond anvil cell [19]. Recently [20], an independent study reported the equation of state of several solids (including LiF, NaCl, and Pb) measured under ambient temperature in the Mbar range using diamond anvil cells with a quasi-hydrostatic pressure transmitting medium (helium or neon) and coupled with X-ray diffraction.
In 2020, the applicability of the cB model was studied by using the equation of state of LiF that has been obtained, as mentioned above, in Ref. [20]. Equation (7) can be rewritten as:
or
The Rydberg–Vinet equation of state of LiF in the Mbar range that was reported in the recent work by Dewaele [20] (third column of his Table 1) gives at T = 300 K: B = 62.3 GPa and ( = 16.391 Å). In a previous work, Dong et al. [19], after compression of LiF to 92 GPa, found B = 66.2 GPa and through the 3rd-order Birch–Murnaghan equation of state.
McKeever and Lilley [21] measured the thermally stimulated polarisation currents (TSPC) and the thermally stimulated depolarisation currents (TSDC) of LiF doped with Mg. Their TSPC and TSDC curves exhibited the maximum (approximately around at T = 211 ± 3 K) corresponding to a single relaxation process, the analysis of which resulted in [21]: = 0.66 eV and of the parameters , in the Arrhenius relation:
where denotes the pre-exponential factor and denotes the enthalpy for the bound cation vacancy motion.
Following Ref. [22], the quantity for the bound vacancy motion in the (re)orientation process of the dipole ‘Mg-cation vacancy’ is estimated from
where k stands for the Boltzmann’s constant and for the frequency of the (moving) ion vibrating in the direction of the potential barrier. By accepting the approximation [23] that , where is the frequency at very long wavelengths of the transverse optical mode, and using in Equation (17) the values [24] and , we find .
Since both parameters eV and k are now known, the value can be obtained by means of at any temperature. Hence, at T = T = 211 K, we find = 0.62 eV. The aforementioned value k is comparable to the one ( k) of the free cation vacancy motion identified in the measurements in Ref. [25], which also resulted in = 0.75 eV leading to = 0.69 eV at T = 300 K for the cation vacancy motion.
As far as the Schottky defect formation process is concerned, Lallemand [25] found = 2.37 eV and = 8.9 k, which result in = 2.14 eV at T = 300 K. The experimental results for the defect volumes are = (12.6–13.2) cm/mole and = (3.2–4.0) cm/mole for the cation vacancy migration process [25], and hence the corresponding values are
and
for these two defect processes, respectively.
Assuming that the defect migration volume for the bound cation vacancy motion is approximately equal [12] to that of the free cation vacancy motion, we find
According to Equation (15), the ratio should be equal to irrespective of the defect processes. By considering the values B = 62.3 GPa and = 5.01 reported in the third column of Table 1 of Dewaele [20], as mentioned, we find
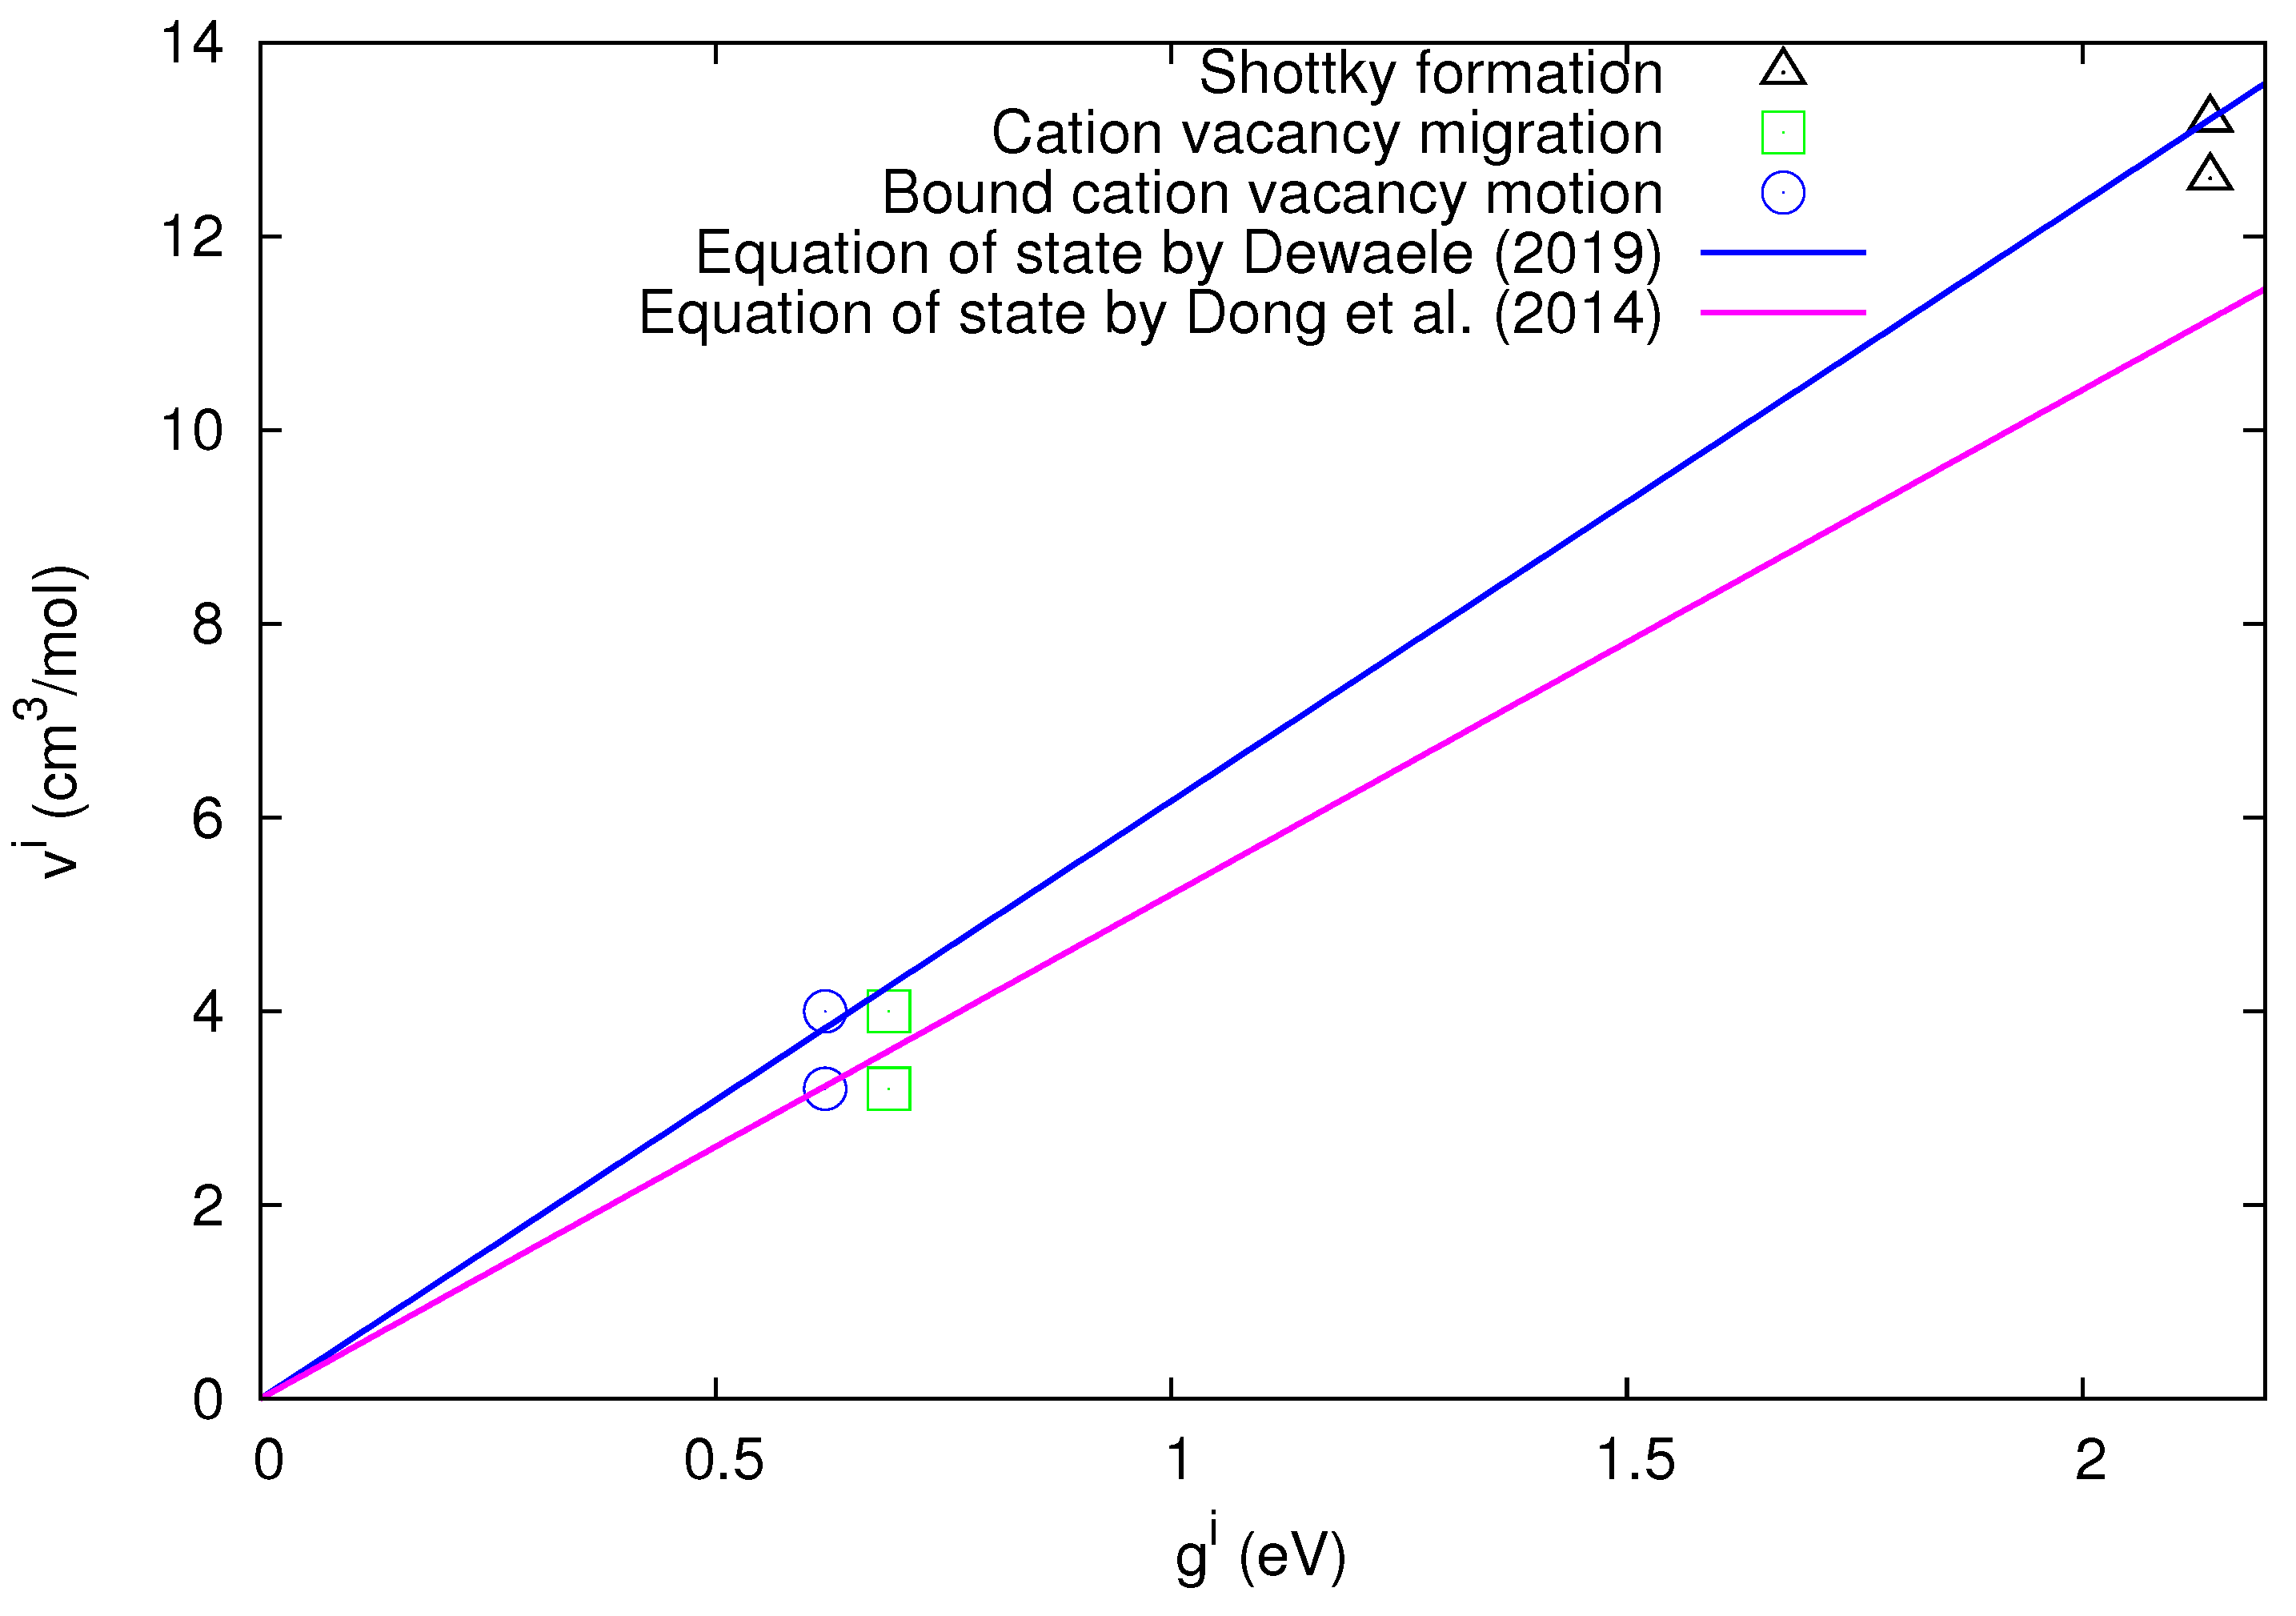
In order to visualize the agreement between the experimental values and the bulk quantity predicted by the cB model, the values are plotted in Figure 2 versus the values. In the same figure, we also plot the straight lines corresponding to the predicted values of the ratio from Equation (15) deduced either from the above-mentioned measurements by Dewaele [20] (blue straight line) or by Dong et al. [19] (magenta straight line).
Figure 2 shows that, for all three defect processes, the experimental results of agree with those deduced from the cB model. A more detailed inspection of Figure 2 uncovers that the experimental results of lie closer to the blue straight line, which remarkably corresponds to the latest equation of state that appeared in Ref. [20].
In short, the experimental results of various defect processes in LiF confirm the cB model upon using the most recent equation of state [20].
4. Applications of the cB Model to Nuclear Fuels and Materials for Microelectronic Devices
The strength of the cB model to describe the defect processes of nuclear and electronic materials has been recently highlighted considering, for example, nuclear fuel [26,27,28] and materials for microelectronics devices [29,30,31]. Regarding nuclear fuel, there is considerable work on UO; however, the advent of proliferation resistant fuel such as ThO and novel fuels (mixed oxide) requires a systematic understanding of their material properties in a wide range of conditions (pressure and temperature). Cooper et al. [27] investigated oxygen self-diffusion in UO using molecular dynamics in conjunction with the cB model. This theoretical approach allowed the study to span over a considerable range of temperatures (300–1900 K) and pressures (0–10 GPa), which would be difficult and expensive to consider experimentally. Importantly, it was highlighted that there is a considerable reduction in oxygen self-diffusion (increase in the activation energy of oxygen self-diffusion) as a function of the increasing pressure.
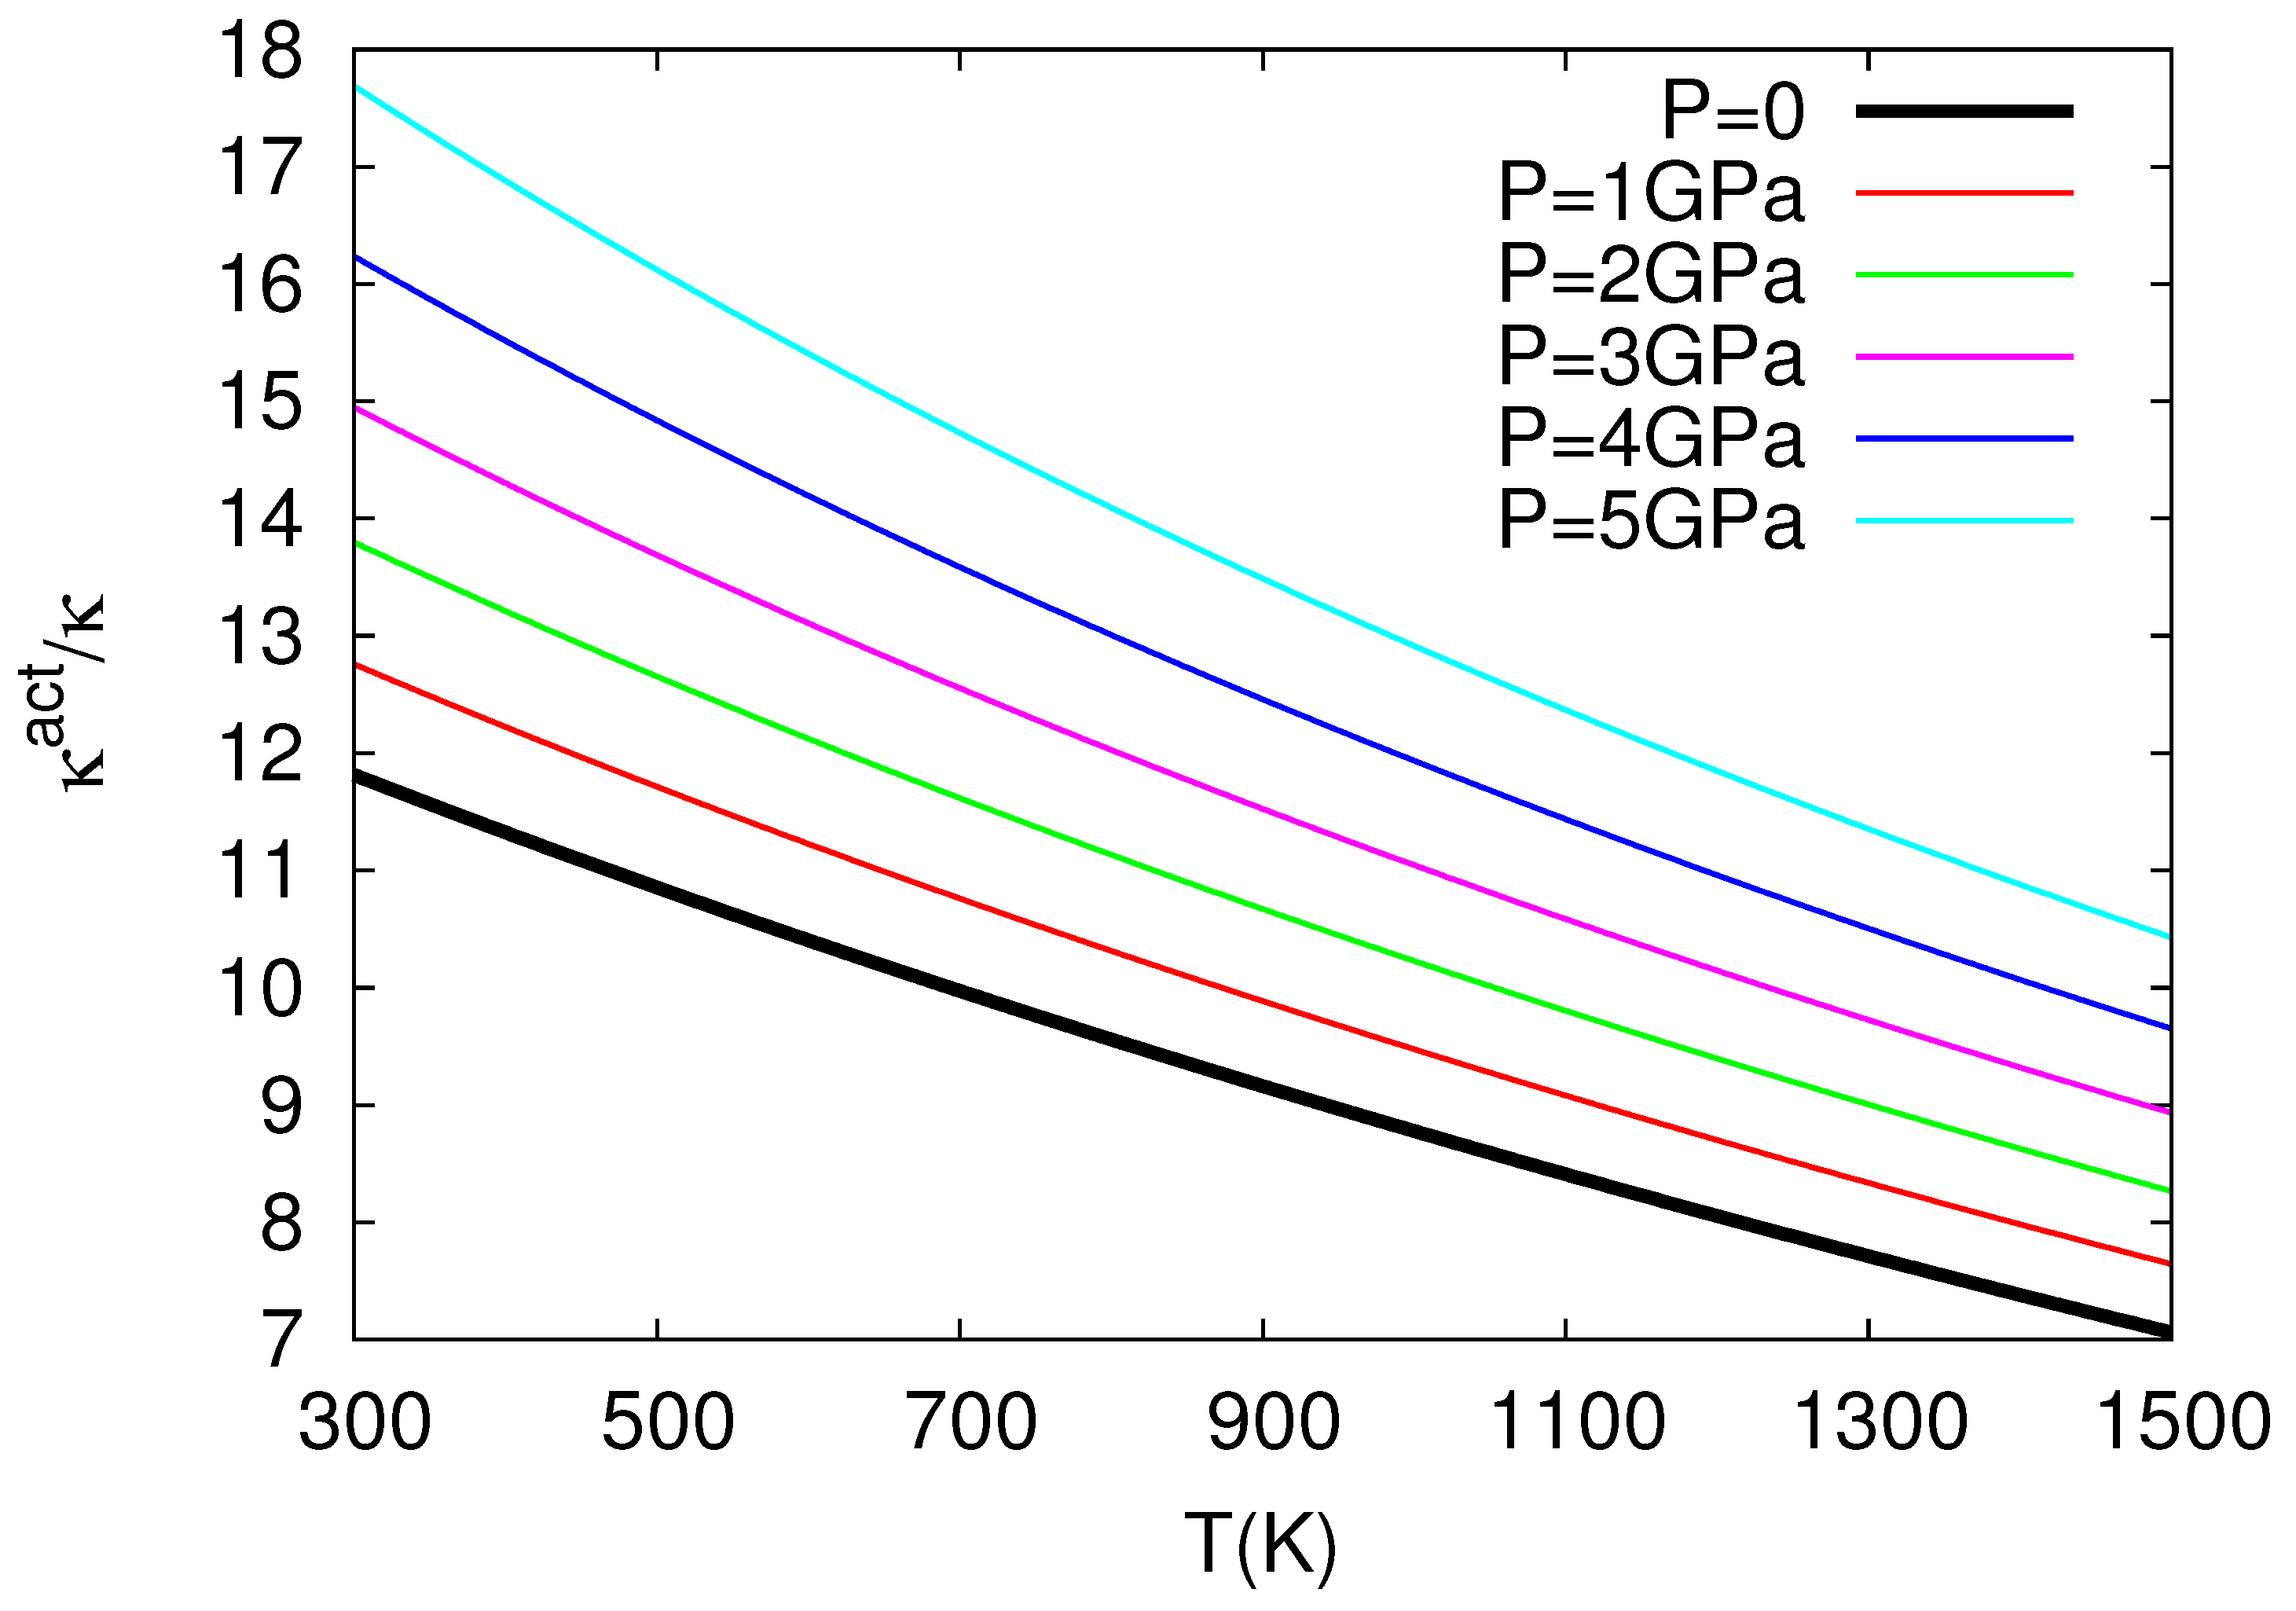
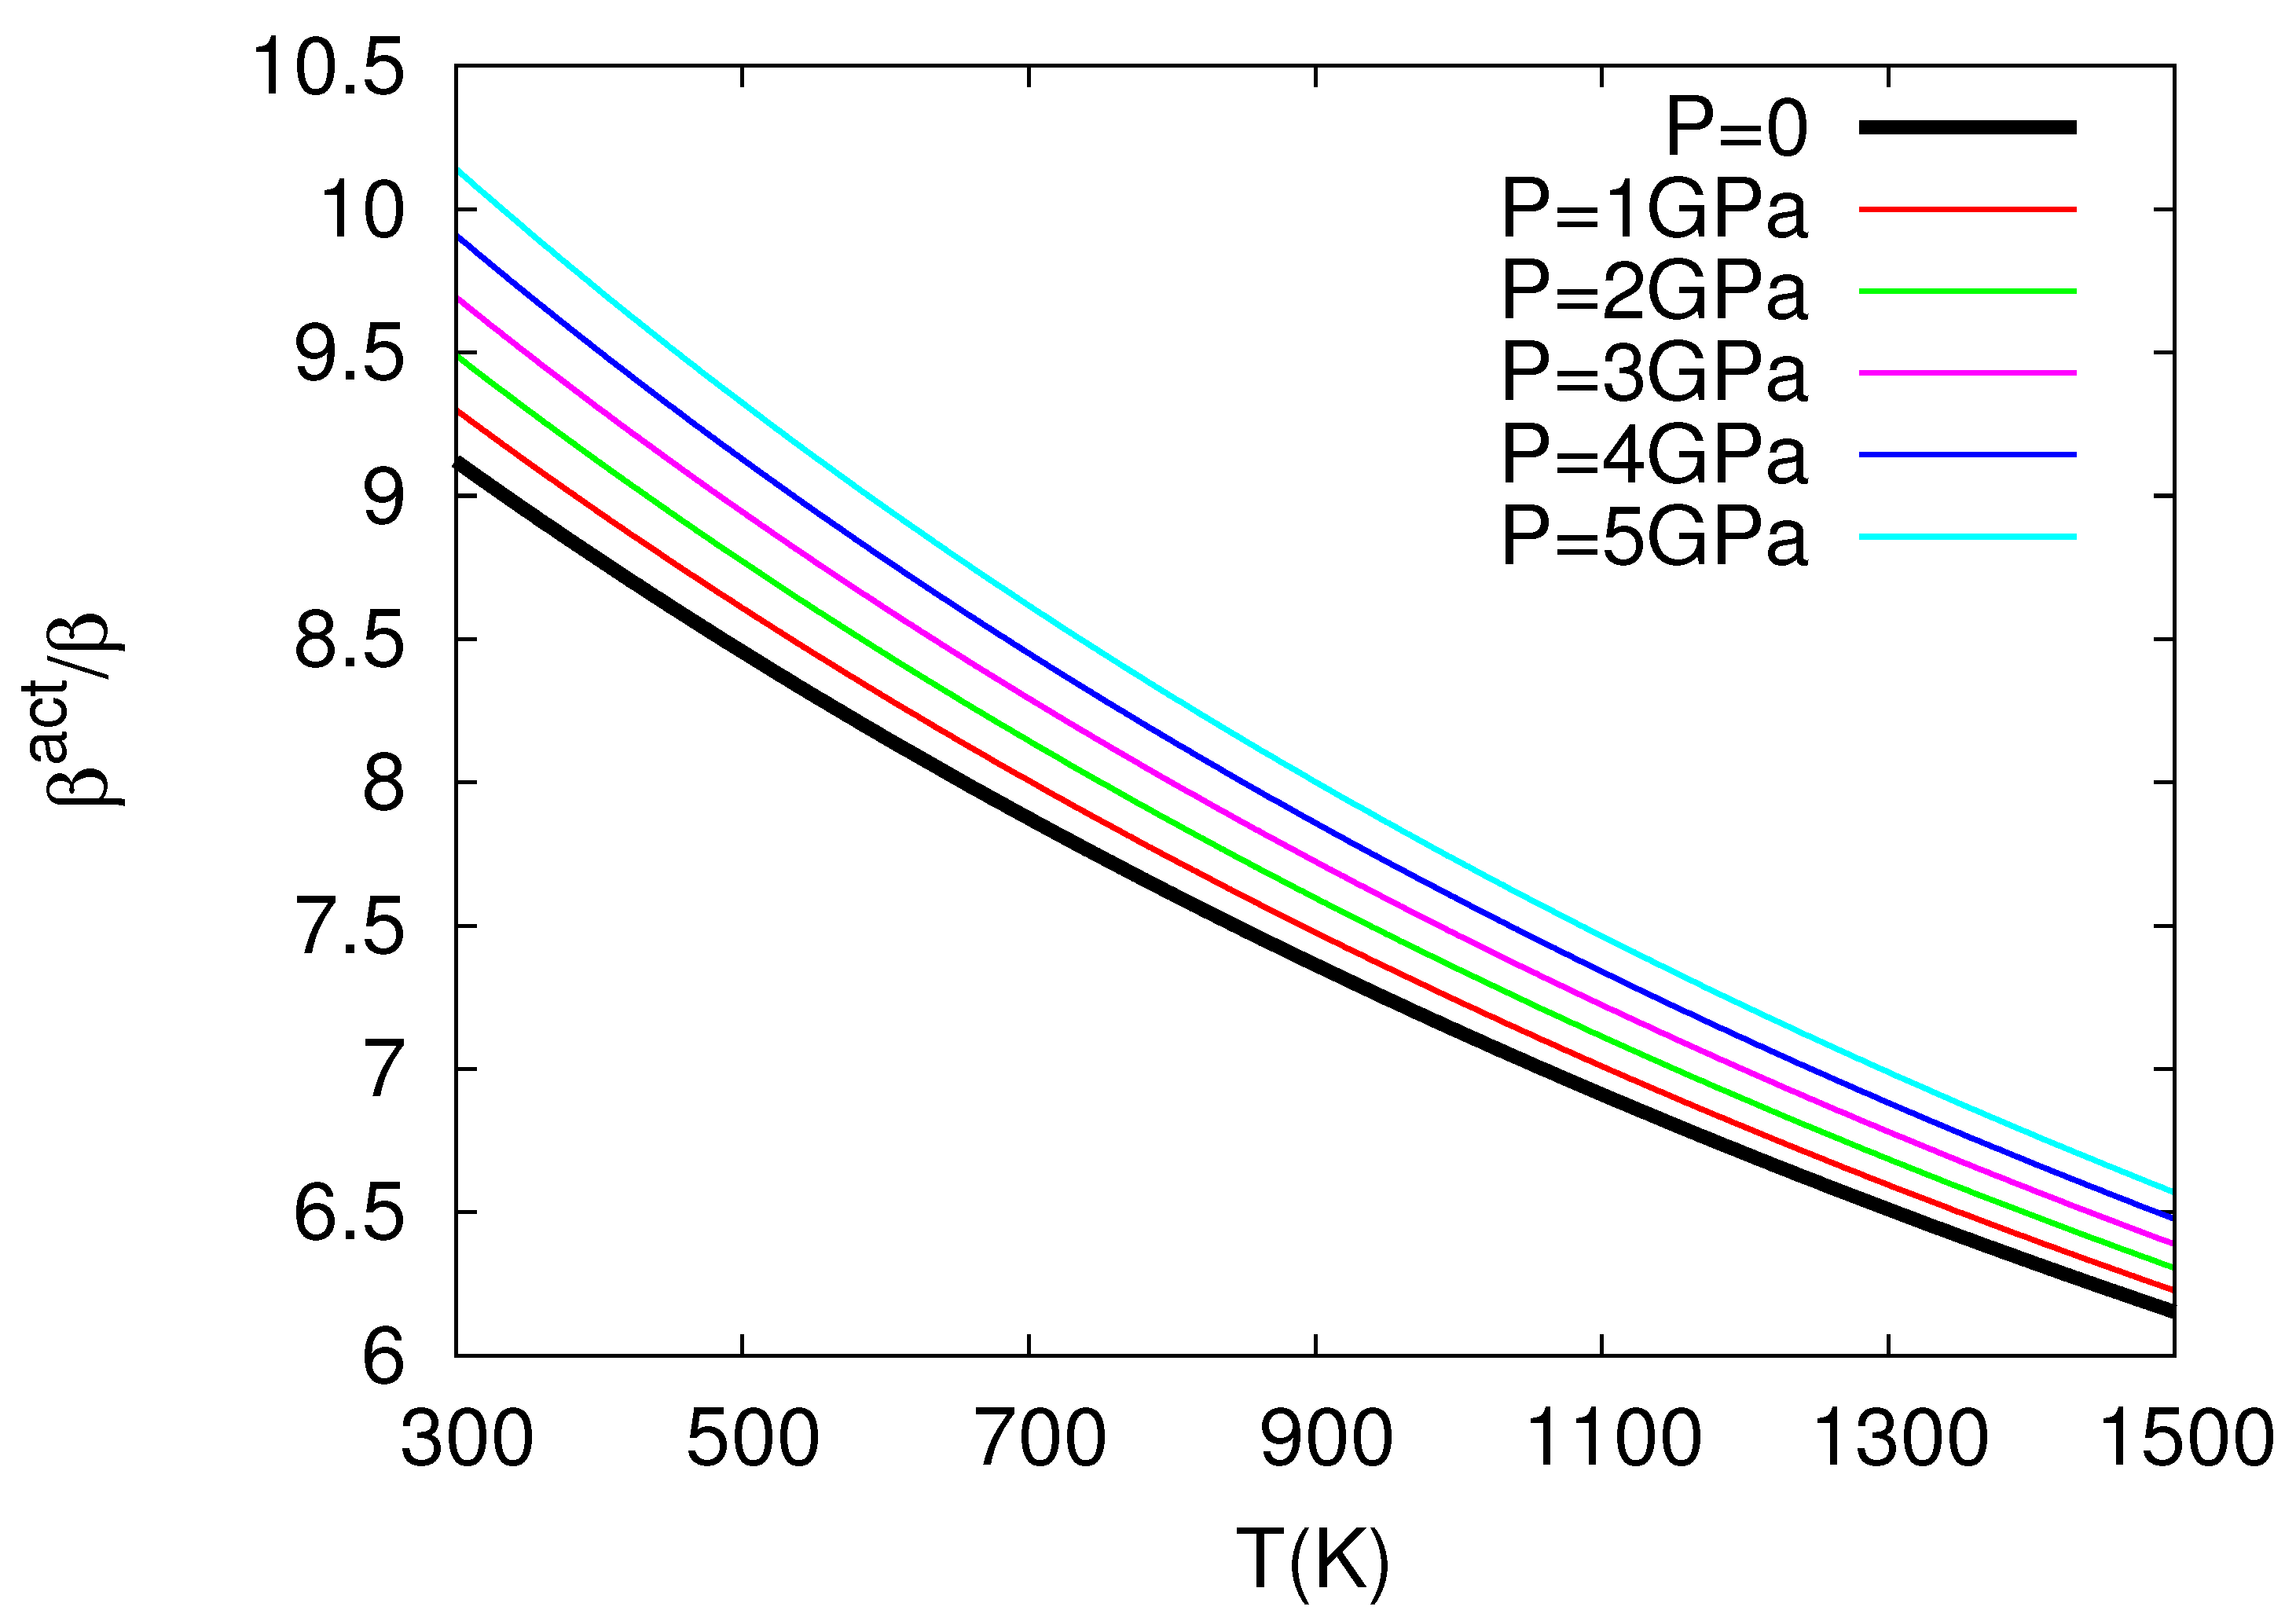
The above study by Chroneos and coworkers in nuclear fuels was further elaborated in Ref. [32], which revealed the very interesting result that thermal expansivity and compressibility of in the oxygen self-diffusion in UO exceed the corresponding bulk quantities almost by one order of magnitude, see Figure 3 and Figure 4 for the ratios and versus temperature for several pressures. More precisely, these results have been obtained as follows:
Cooper et al. [27] derived both the expansivity and B using molecular dynamics (MD) calculations and found the following expression for B(T,P):
where = 218.0 GPa is the bulk modulus at T = 0, P = 0, GPa K, GPa K, = 5.864 is the pressure derivative of B, i.e., , at T = 0, P = 0, GPa and K (see Table 1 of Cooper et al. [27]). By means of Equation (23), the use of Equation (10) leads to the ratio at various temperatures for various pressures depicted in Figure 3. This figure reveals that exceeds unity, as expected from Equation (10) because in its last term we have [12]: in the numerator and in the denominator. We find that exceeds by almost an order of magnitude or so, which is important because it is usually assumed [33,34,35] that the activation volume changes with pressure similarly with the crystal volume, i.e., [36]. Furthermore, we also calculate at various temperatures and pressures by applying Equation (11), and the results are depicted in Figure 4, where has been calculated from the relation:
The latter relation is similar to that of Equation (23) and results from a polynomial fit to the data presented in Figure 1 of Ref. [27] yielding Å, Å GPa, Å GPa, Å K, Å K, and Å GPa K; it gives B values compatible within ±5% to the ones obtained when using Equation (23) for GPa and K. Figure 4 shows that exceeds unity (by almost one order of magnitude) as expected from Equation (11) if we consider that the numerator of the last term is positive since the value of increases upon increasing the temperature due to anharmonic effects [12]. Concerning Figure 3 and Figure 4, the following comments are now in order: These two figures have been plotted in the temperature 300–1500 K, which somewhat exceeds (i.e., by around 140 degrees) the higher temperature limit K for the elastic and expansivity data mentioned above when using Equations (23) and (24). This does not change the importance of the results obtained here, i.e., as well as exceed unity by almost one order of magnitude in view of the following: The curvature of the Arrhenius plots (with one operation mechanism) is quantified by the quantity: see p. 388 of Ref. [12]. We find that the quantity between parentheses changes only slightly from the value 5.3 to 5.2 for the aforementioned two cases K and 1500 K, respectively, which means that the extent of the Arrhenius curvature for oxygen self-diffusion plots in UO studied by Cooper et al. [27] does not seriously change upon investigating the above two temperature ranges.
Considering materials for electronics, the aggressive scaling for decades has led to characteristic dimensions of a few nanometers. This in turn requires the understanding of intrinsic defect properties and dopant-defect interaction in both established materials (silicon) [30,31] and emerging materials (germanium, silicon germanium, and III-V alloys) [29,31]. For example, Kube et al. [37] determined a curved Arrhenius plot on self-diffusion in Si and proposed that it is associated with two diffusion mechanisms (vacancies and self-interstitials). On the contrary, on the basis of the cB model, Saltas et al. [30] proposed that the experimental results can also be comprehended by a single diffusion mechanism if the nonlinear anharmonic behaviour of the isothermal bulk modulus is considered. Interestingly, the analysis on the ground of the cB model reveals that the activation enthalpy of self-diffusion varies nonlinearly from 3.6 eV to 4.9 eV in good agreement with the experimental data by Kube et al. [37]. Finally, there are numerous studies on germanium, silicon germanium, and III-V alloys and, in these systems, the cB model can provide complementary information to the limited experimental data (refer to Ref. [38] and references therein).
5. Application of the cB Model to High T Superconductors
In high T superconductors, like , high critical current densities can be achieved by the presence of high-density defects which will provide suitable pinning centers for the magnetic flux lines (e.g., see Ref. [39] and references therein). In such a flux-line pinning, point defects play an important role in in which the superconductivity coherence length is of order of tens of Å. Doping with alkaline earth elements improve bulk and grain-boundary transport [40] and in addition was found by Su et al. [41] to lead to a formation energy for a Schottky defect, which interestingly is in accordance with the expectations of the cB model (e.g., see [8,10,26,38,42]). This model, however, does not seem to describe the case when replacing Y in the doping of by rare earth elements (which is strikingly reminiscent, of an earlier finding [43] that in alkali halides doped with alkaline earth divalent cations, the value for the reorientation process of the electric dipoles formed by a divalent cation vacancy increases upon increasing the ionic radius of the dopants but not for rare earth divalent dopant). In a work which just appeared [44], the influence of high hydrostatic pressure up to 11 kbar on the conductivity in the basal ab-plane of medium-doped with praseodymium () single-crystal samples was investigated and the following interesting fact emerged: in contrast to the pure samples with the optimal oxygen content, the application of high pressure leads to the formation of phase separation in the basal plane of single crystals. Possible mechanisms of the effect of Pr doping and high pressure on the two-step resistive transition to the superconducting state were discussed, and it was determined that, in the normal state, the conductivity is metallic limited by phonon scattering (Bloch-Grüneisen regime) and defects. It has been concluded that doping with Pr leads to the appearance of an anisotropic distribution of defects and flat macroscopic superconducting regions with different T are formed. A concentration increase of Pr leads to a decrease in the localization length of charge carriers, which indicates a decrease in the spatial propagation of the wave function of charge carriers. In the normal state, the main contribution to the resistivity of the single crystal is made by intraband scattering () and residual resistivity. Concerning the hydrostatic pressure, it leads to anisotropy decrease of linear compressibility along with a decrease in phonon resistivity and residual resistivity, while Debye temperature and coherence length remain constant.
6. Applications of Usefulness in Geophysics and Seismology
We start with the following three cases: self-diffusion in diamond, self-diffusion in iron and the thermodynamic estimation of the compressibility of ferropericlase under high pressure.
In earth sciences, diamond diffusion properties are important because natural diamonds and their mineral inclusions provide information about the geochemical character and geotherm of the ancient continental lithosphere e.g., see Ref. [45] and references therein. Specifically, the spatial distribution of carbon and nitrogen isotopes in diamond provides information on mantle residence time [46]. Diamonds with long residence at high temperature will gradually lose their initial zoning patterns due to diffusion; thus, the diffusion data can constrain the maximum possible age of diamonds. Rare diamonds that originate from the mantle transition zone should have developed [46] a length scale of ≈1 mm of isotopic zoning over the age of the Earth years. A calculation of point defect parameters in diamond based on the cB model has been initially made by Varotsos [39] in 2007, which was followed in 2012 by a calculation of the self-diffusion coefficients by Zhang and Wu [47]. These authors, in light of more recent pressure–volume–temperature relationships, showed that the self-diffusion coefficient of diamond as a function of temperature and pressure can be reproduced by means of the cB model using bulk elastic and expansivity data. In particular, Zhang and Wu stated that they found an excellent agreement between the calculated self-diffusion coefficients () over a range of temperatures (1000–2800 K) and pressures (0–80 GPa), see their Figure 1. Specifically, they found from the slope and intercept () of vs. the values eV and which are comparable to the experimental derived values eV and , respectively.
Concerning iron, it is considered as the major component of the Earth’s core [48] and since it is known that the diffusion is related strongly to the creep, grain boundary motion, and solid phase transition in a metal and alloy, a knowledge of the transport properties of iron and its alloys is important for understanding the evolution and current dynamics of the cores of many of the planets, including Earth. In 2014, Zhang [49] used the available equation of state of iron and successfully reproduced the temperature and pressure dependence of self-diffusion coefficients in iron polymorphs ( and phases) in terms of the bulk elastic and expansivity data by means of the cB model. It was found that the calculated diffusion parameters, such as self-diffusion coefficient, activation energy and activation volume, over a broad temperature range (500–2500 K) and pressure range (0–100 GPa), compare favorably well with the experimental ones when the uncertainties are considered. Interestingly, this approach has been satisfactorily applied to the case of -Fe under the corresponding (up to 100 GPa and 2500 K) conditions of the lower mantle; such data should have important implications for the physical and chemical processes of deep planetary interiors [50,51].
We now turn to ferropericlase (Mg,Fe)O, which is widely believed to be a major phase in the lower mantle of the Earth, coexisting with Mg-rich silicate perovskite, (Mg,Fe,Al)SiO. Since the elastic properties of (MgFe)O ferropericlase are essential to analyze seismic data and to constrain its chemical composition in the lower mantle, Zhang and Xu [52] proceeded to the estimation of the bulk moduli of (MgFe)O ferropericlase as a function of component x in terms of the elastic data of the end members. Along these lines, they followed the method proposed by Varotsos and Alexopoulos [12] to explain how the compressibility of a solid solution AB is interrelated with the compressibilities of two end members A and B upon using the cB model. Zhang and Xu [52] stated that they found an excellent consistency between the calculated B values and the experimental ones in ferropericlase. Hence, they concluded that this method based on the cB model exhibits credibility of describing compresibility in terms of the bulk moduli of the two end members, i.e., MgO and FeO; thus, it constitutes an interesting method to determine the compressibility of Earth materials with complicated structure using the measured compressibilities of their end members.
Finally, we point out a mechanism that has been proposed in Ref. [53], which achieves in bridging the water solubility and ion diffusivity in the Earth’s mantle silicates by using the cB model. This is important because, since numerous studies have demonstrated that even tens of ppm of water by weight also exerts a considerable effect on the transport properties of mantle minerals such as diffusion [54,55,56,57], rheology (Mei and Kohlstedt [58]; Xu et al. [59]), and electrical conductivity [60,61,62], an understanding of water dissolution in nominally anhydrous minerals at the atomic level is fundamental for the development of dynamic models of the Earth’s mantle. This is crucial because several theoretical and experimental studies have revealed that water can be incorporated into silicate minerals by a variety of potential defect mechanisms, such as metal site vacancy, Si site vacancy, and O ions [63,64,65,66,67,68], which makes the role of the cB model important in this case.
Beyond the aforementioned three examples, several other applications of the cB model to Geophysics have been published, e.g., calculation of diffusion parameters of He in olivine [69], calculation of oxygen self-diffusion coefficients in minerals [70], calculation of diffusion parameters of Si in silicates [71] or of Si self-diffusion in stishovite [72]; for more such applications, see Ref. [38].
7. Application of the cB Model to a Problem of Major Technological Interest
Si-based anodes can drastically improve the energy density of current in Li-ion batteries, but their actual use is still limited by a huge volume change (up to 300%) during charging and discharging [73]. This is due to complex structural transformations that Si experiences during Li insertion and removal [74]. It is therefore of paramount importance to investigate the kinetics of Li in both bulk Si and various lithiated phases LiSi in order to understand the structural changes.
An approach to obtain a non-classical description of diffusion based on the transition state theory (TST) has been proposed [75,76], which is often used with the harmonic approximation for computing the phonon frequencies; thus, it is important to estimate the effect of anharmonicity in the system that might become significant at a high temperature. Such a methodology based on TST was recently followed by Kumar et al. [77] to study Li interstitial diffusion in bulk Si, as well as Li diffusion in the crystalline lithiated phase LiSi. They also took into account nuclear quantum approximation and anharmonic effects. Concerning the latter, Kumar et al. [77] pointed out that, in the literature on anharmonicity in diffusion, mainly two types of effects are discussed: (1) those due to the change in the lattice parameter owing to thermal expansion at a high temperature [78,79] and (2) those due to the phonon–phonon interactions [80,81]. The first effect, i.e., the volume change, is often studied through the quasiharmonic approximations that provide a first order anharmonic correction [82]. However, it can underestimate the phonon frequency change when the phonon–phonon interactions contribute significantly in phonon softening at high temperatures [80]. In order to address both effects, Kumar et al. [77] considered the cB model. They finally concluded that, as compared to the classical approach, the addition of quantum effects for Li diffusion in Si lowers the value of the room temperature diffusion coefficient by 33% because of a higher effective energy barrier. The cB model and the quasi-harmonic approximation suggest an increase in the diffusion coefficient by 60% in the case of bulk Si by including anharmonic effects. In the case of LiSi, Kumar et al.’s calculations are in better agreement with the experimental data than previous ab initio molecular dynamics studies conducted at higher temperatures. They also obtained an effective diffusion barrier of 0.27 eV ± 0.01 eV with a pre-factor of 2.8 for Li diffusion in LiSi.
8. Search for Composition of Better Target Properties in Cu-Co-Si Alloys via Machine Learning
Zhao et al., in a very recent work [83], limiting the discovery of alloys with high hardness and good electrical conductivity (EC), propose the combination of a Gaussian process regression-based machine learning (ML) surrogate model and the phase diagram to search for compositions with better target properties in Cu-Co-Si alloys. Since Ag is more expensive, Cu finds wide use in household and industrial products in view of its excellent conductivity. Other alloying elements are introduced to pure Cu to improve its strength [84,85]. The introduction of alloying elements brings strengthening of Cu alloys and in particular Si is one of the common alloying elements in Cu alloys because it produces a strong solution strengthening effect and decreases the surface tension as well as improves the fluidity of Cu melt [86]. However, the equilibrium solubility of Si in Cu lattice is as high as 4.6 wt% at an ageing temperature of 450 C [87], which contributes to strong electron scattering and a decrease in EC. Co can react with Si to form CoSi and CoSi compounds. In addition, the equilibrium solubility of Co in the Cu matrix at 450 C is close to 0 wt% [88]. Therefore, the addition of Co has the potential to improve the strength and conductivity of the Cu-Si alloy simultaneously.
As for ageing strengthened Cu alloys, the precipitation phase formed by alloying elements affects the conductivity and hardness. To confirm the influence of the compositions and microstructures on properties in Cu-Co-Si alloys, their ML model automatically designed 12,000 alloys and predicted their properties. Combined with the phase diagram and microstructure characterization, they concluded that the EC and hardness of Cu-Co-Si alloys are related to the moderate CoSi and CoSi precipitation.
For metals with vacancy diffusion as the main diffusion mechanism, atomic diffusion requires diffusion activation Gibbs energy to provide power. According to the cB model [6,11], the defect Gibbs energy is proportional to the isothermal bulk modulus, thus the diffusion coefficient D was obtained from Equation (13) (see also Section 2).
The formation of precipitation driven by atom diffusion is the core reason for the high strength and high conductivity of ageing strengthened copper alloys. Therefore, Zhao et al. [83] inferred that the isothermal bulk modulus and compressibility are key factors to predict hardness and electrical conductivity. This is why the cB model plays an important role in the aforementioned research for composition of better target properties in Cu-Co-Si alloys.
9. Recent Studies on the Foundation of the Physical Origin of the cB Model
During the last two years, two studies appeared which shed more light on the foundation of the physical origin of the cB model. They are summarised below:
9.1. Foundation of cB Model Studying the Interfacial Mobility Gradient in Thin Polymer Films Using Molecular Dynamics Simulations on a Layer-by-Layer Basis
In Ref. [89], Zhang et al. examined the mobility gradient in the interfacial region of substrate-supported polymer films using molecular dynamics simulations and interpreted these gradients within the string model of glass-formation. After analyzing the mobility gradient on a layer-by-layer basis, they found that no large gradients in the extent of collective motion exist in these simulated films. In other words, the novelty of this work by Zhang et al. [89] is that they applied the string model on a layer-by-layer basis in the supported polymer film, which allowed the quantification of the activation parameters and on a layer-by-layer basis. They concluded that the interfacial mobility gradient derives mainly from a gradient in the high-temperature activation enthalpy and entropy as a function of depth z. In order to gain more insight into the interfacial mobility gradient, they also examined various material properties suggested previously to influence in condensed materials, including density, potential, cohesive energy density, and a local measure of stiffness or , where is the average mean squared particle displacement at a caging time on the order of a ps. They also finally found that changes in local stiffness best correlate with changes in and that contributes significantly to the interfacial mobility gradient, so it must not be neglected. This constitutes a direct confirmation of the cB model because it clearly demonstrates that and best correlate with changes of the bulk modulus B as follows (note that, for example, Equation (6) can be alternatively written as , where is the intercept of the linear part of the graph with the vertical axis since it is found experimentally that B decreases almost linearly upon increasing temperature, e.g., see Equations (5)–(12) in Ref. [4]): In Ref. [89], it was clearly stated that earlier studies [90,91] have shown a quantitative relation between the bulk modulus and Debye–Waller (DW) factor , suggesting that at a local scale might provide a local measure of material stiffness. The DW factor is defined by the mean square particle displacement at a caging time on the order of a ps. Physically, one can expect that the amplitude of molecular vibrations is affected by the local stiffness of the material, providing some intuition for the possible relationship of and the bulk modulus. At a more basic level, as a measure of molecular rigidity derives from the harmonic oscillator model in which the harmonic oscillator force constant equals [92]. In short, Ref. [89] of all the quantities considered, (which they argued relates to bulk modulus) best tracks the variation of with film depth.
9.2. Analytical Method for the Foundation of the cB Model Using Mie–Lennard–Jones Interatomic Potential
In Ref. [93], Magomedov proposed an analytical method for calculating the parameters of vacancy formation and self-diffusion of atoms in a single-component crystal. The method is based on the four-parameter pairwise Mie–Lennard–Jones interatomic interaction potential. The method allows calculation of all activation process parameters, that is, Gibbs energy, enthalpy, entropy, and volume, for both the vacancy formation process and the self-diffusion process. As an example, Magomedov presented the case for gold calculated from T = 10–1330 K along two isobars, P = 0 and 24 GPa. In the high-temperature region, the vacancy formation and the self-diffusion coefficient pass into classical Arrhenius dependencies, with a weakly temperature-dependent enthalpy and a positive value for the activation process entropy, which is a behavior strikingly similar with that exhibited by the cB model, as it was published since 1977 [2]. In short, Magomedov’s analytical method leads to results that are fully compatible with the cB model.
10. Summary and Conclusions
In the 1980s, a strict foundation of thermodynamics of point defects in solids appeared and revealed the existence of two families of defect parameters pointing to the key role of isothermal bulk modulus. Thus, the cB model naturally emerged as a tentative interrelation between point defect parameters and bulk properties. Here, the following results have been obtained:
(i) During the last decade, in a multitude and variety of fields, several successful applications of the cB model appeared including high pressure diamond anvil measurements, high T superconductors, nuclear fuels, and materials for micro-electronics devices, applications of usefulness in Geophysics and Seismology, a problem of major technological interest and search for compositions of better target properties in Cu-Co-Si alloys via machine learning.
(ii) During the last few years, the foundation of the physical origin of the cB model has been further strengthened by means of two independent studies.
Hence, in view of the above recent results, we conclude that such an interconnection between the point defect parameters and bulk properties in solids does exist.
Author Contributions
Conceptualization, P.A.V.; methodology, P.A.V., N.V.S. and E.S.S.; software, N.V.S. and E.S.S.; validation, P.A.V., N.V.S. and E.S.S.; formal analysis, P.A.V.; investigation, P.A.V., N.V.S. and E.S.S.; resources, P.A.V., N.V.S. and E.S.S.; data curation, N.V.S. and E.S.S.; writing—original draft preparation, P.A.V.; writing—review and editing, P.A.V., N.V.S. and E.S.S.; visualization, N.V.S. and E.S.S.; supervision, P.A.V.; project administration, P.A.V. All authors have read and agreed to the published version of the manuscript.
Funding
This research received no external funding.
Institutional Review Board Statement
Not applicable.
Informed Consent Statement
Not applicable.
Data Availability Statement
Data are contained within the article.
Conflicts of Interest
The authors declare no conflict of interest.
References
- Varotsos, P. Comments on the formation entropy of a Frenkel defect in BaF2 and CaF2. Phys. Rev. B 1976, 13, 938. [Google Scholar] [CrossRef]
- Varotsos, P.; Alexopoulos, K. The curvature in conductivity plots of alkali halides as a consequence of anharmonicity. J. Phys. Chem. Solids 1977, 38, 997–1001. [Google Scholar] [CrossRef]
- Varotsos, P.; Alexopoulos, K. Estimation of the migration enthalpy and entropy for cation vacancy motion in alkali halides with the NaCl-type structure. Phys. Rev. B 1977, 15, 2348–2351. [Google Scholar] [CrossRef]
- Varotsos, P.; Alexopoulos, K. Calculation of the formation entropy of vacancies due to anharmonic effects. Phys. Rev. B 1977, 15, 4111–4114. [Google Scholar] [CrossRef]
- Varotsos, P.A. On the temperature and pressure dependence of the defect formation volume in ionic crystals. J. Phys. Lett. 1977, 38, L455–L458. [Google Scholar] [CrossRef]
- Varotsos, P.; Ludwig, W.; Alexopoulos, K. Calculation of the formation volume of vacancies in solids. Phys. Rev. B 1978, 18, 2683–2691. [Google Scholar] [CrossRef]
- Varotsos, P.; Alexopoulos, K. Calculation of the migration volume of vacancies in ionic solids from macroscopic parameters. Phys. Status Solidi 1978, 47, K133–K136. [Google Scholar] [CrossRef]
- Varotsos, P.; Alexopoulos, K. Calculation of diffusion coefficients at any temperature and pressure from a single measurement. I. Self diffusion. Phys. Rev. B 1980, 22, 3130–3134. [Google Scholar] [CrossRef]
- Varotsos, P.; Alexopoulos, K. Negative activation volumes of defects in solids. Phys. Rev. B 1980, 21, 4898. [Google Scholar] [CrossRef]
- Varotsos, P.; Alexopoulos, K. Decisive importance of the bulk modulus and the anharmonicity in the calculation of migration and formation volumes. Phys. Rev. B 1981, 24, 904–910. [Google Scholar] [CrossRef]
- Varotsos, P.; Alexopoulos, K. Connection between the formation volume and formation Gibbs energy in noble-gas solids. Phys. Rev. B 1984, 30, 7305–7306. [Google Scholar] [CrossRef]
- Varotsos, P.; Alexopoulos, K. Thermodynamics of Point Defects and Their Relation with Bulk Properties; Elsevier: Amsterdam, The Netherlands, 1986. [Google Scholar]
- Varotsos, P. Comparison of models that interconnect point defect parameters in solids with bulk properties. J. Appl. Phys. 2007, 101, 123503. [Google Scholar] [CrossRef]
- Zener, C. Theory of Do for Atomic Diffusion in Metals. J. Appl. Phys. 1951, 22, 372–375. [Google Scholar] [CrossRef]
- Wert, C.; Zener, C. Interstitial Atomic Diffusion Coefficients. Phys. Rev. 1949, 76, 1169–1175. [Google Scholar] [CrossRef]
- Zener, C. Imperfections in Nearly Perfect Crystals; Wiley: New York, NY, USA, 1952. [Google Scholar]
- Fratanduono, D.E.; Boehly, T.R.; Barrios, M.A.; Meyerhofer, D.D.; Eggert, J.H.; Smith, R.F.; Hicks, D.G.; Celliers, P.M.; Braun, D.G.; Collins, G.W. Refractive index of lithium fluoride ramp compressed to 800 GPa. J. Appl. Phys. 2011, 109, 123521. [Google Scholar] [CrossRef] [Green Version]
- Yagi, T. Experimental determination of thermal expansivity of several alkali halides at high pressures. J. Phys. Chem. Solids 1978, 39, 563–571. [Google Scholar] [CrossRef]
- Dong, H.; Dorfman, S.M.; Holl, C.M.; Meng, Y.; Prakapenka, V.B.; He, D.; Duffy, T.S. Compression of lithium fluoride to 92 GPa. High Press. Res. 2014, 34, 39–48. [Google Scholar] [CrossRef]
- Dewaele, A. Equations of State of Simple Solids (Including Pb, NaCl and LiF) Compressed in Helium or Neon in the Mbar Range. Minerals 2019, 9, 684. [Google Scholar] [CrossRef] [Green Version]
- McKeever, S.W.S.; Lilley, E. Thermally stimulated polarisation and depolarisation currents (TSPC and TSDC) in LiF:Mg2+(TLD-100). J. Phys. Solid State Phys. 1981, 14, 3547–3555. [Google Scholar] [CrossRef]
- Varotsos, P.; Alexopoulos, K. Migration entropy for the bound fluorine motion in alkaline earth fluorides. J. Phys. Chem. Solids 1980, 41, 443–446. [Google Scholar] [CrossRef]
- Dryden, J.S.; Heydon, R.G. Energy parameters of cation motion in alkali halides as determined by dielectric relaxation measurements. J. Phys. Solid State Phys. 1978, 11, 393–401. [Google Scholar] [CrossRef]
- Kittel, C. Introduction to Solid State Physics; Wiley: New York, NY, USA, 1971; p. 190. [Google Scholar]
- Lallemand, M. Étude de l’Influence d’une Pression Hydrostatique sur la Conductivité Électrique a Haute Température de Cristaux de Fluorure de Lithium et de Fluorures de Métaux Alcalinoterreux. Ph.D. Thesis, Université de Paris VI, Paris, France, 1972. [Google Scholar]
- Chroneos, A.; Vovk, R. Modeling self-diffusion in UO2 and ThO2 by connecting point defect parameters with bulk properties. Solid State Ion. 2015, 274, 1–3. [Google Scholar] [CrossRef]
- Cooper, M.; Grimes, R.; Fitzpatrick, M.; Chroneos, A. Modeling oxygen self-diffusion in UO2 under pressure. Solid State Ion. 2015, 282, 26–30. [Google Scholar] [CrossRef]
- Parfitt, D.C.; Cooper, M.W.D.; Rushton, M.J.D.; Christopoulos, S.R.G.; Fitzpatrick, M.E.; Chroneos, A. Thermodynamic calculations of oxygen self-diffusion in mixed-oxide nuclear fuels. RSC Adv. 2016, 6, 74018–74027. [Google Scholar] [CrossRef]
- Saltas, V.; Chroneos, A.; Vallianatos, F. A thermodynamic approach of self- and hetero-diffusion in GaAs: Connecting point defect parameters with bulk properties. RSC Adv. 2016, 6, 53324–53330. [Google Scholar] [CrossRef]
- Saltas, V.; Chroneos, A.; Vallianatos, F. A thermodynamic approach to self-diffusion in silicon: Evidence of a single diffusion mechanism? Mater. Chem. Phys. 2016, 181, 204–208. [Google Scholar] [CrossRef]
- Saltas, V.; Chroneos, A.; Vallianatos, F. Composition and temperature dependence of self-diffusion in Si1−xGex alloys. Sci. Rep. 2017, 7, 1374. [Google Scholar] [CrossRef] [Green Version]
- Sarlis, N.; Skordas, E. Pressure and temperature dependence of the oxygen self-diffusion activation volume in UO2 by a thermodynamical model. Solid State Ion. 2016, 290, 121–123. [Google Scholar] [CrossRef]
- Ita, J.; Cohen, R.E. Effects of Pressure on Diffusion and Vacancy Formation in MgO from Nonempirical Free-Energy Integrations. Phys. Rev. Lett. 1997, 79, 3198–3201. [Google Scholar] [CrossRef] [Green Version]
- Mills, D.R.; Parker, S.C.; Wall, A. The effect of pressure on Schottky pair formation in MgO: A lattice dynamical approach. Philos. Mag. A 1991, 64, 1133–1144. [Google Scholar] [CrossRef]
- Poirier, J.; Liebermann, R. On the activation volume for creep and its variation with depth in the Earth’s lower mantle. Phys. Earth Planet. Inter. 1984, 35, 283–293. [Google Scholar] [CrossRef]
- Karato, S. Rheology of the lower mantle. Phys. Earth Planet. Inter. 1981, 24, 1–14. [Google Scholar] [CrossRef]
- Kube, R.; Bracht, H.; Hüger, E.; Schmidt, H.; Hansen, J.L.; Larsen, A.N.; Ager, J.W.; Haller, E.E.; Geue, T.; Stahn, J. Contributions of vacancies and self-interstitials to self-diffusion in silicon under thermal equilibrium and nonequilibrium conditions. Phys. Rev. B 2013, 88, 085206. [Google Scholar] [CrossRef] [Green Version]
- Chroneos, A. Connecting point defect parameters with bulk properties to describe diffusion in solids. Appl. Phys. Rev. 2016, 3, 041304. [Google Scholar] [CrossRef]
- Varotsos, P.A. Calculation of point defect parameters in diamond. Phys. Rev. B 2007, 75, 172107. [Google Scholar] [CrossRef]
- Hilgenkamp, H.; Mannhart, J. Grain boundaries in high-Tc superconductors. Rev. Mod. Phys. 2002, 74, 485–549. [Google Scholar] [CrossRef] [Green Version]
- Su, H.; Welch, D.O.; Wong-Ng, W. Strain effects on point defects and chain-oxygen order-disorder transition in 123 cuprate compounds. Phys. Rev. B 2004, 70, 054517. [Google Scholar] [CrossRef] [Green Version]
- Alexopoulos, K.; Varotsos, P. Calculation of diffusion coefficients at any temperature and pressure from a single measurement. II. Heterodiffusion. Phys. Rev. B 1981, 24, 3606–3609. [Google Scholar] [CrossRef]
- Varotsos, P.; Miliotis, D. New aspects on the dielectric properties of the alkali halides with divalent impurities. J. Phys. Chem. Solids 1974, 35, 927–930. [Google Scholar] [CrossRef]
- Chroneos, A.; Khadzhai, G.Y.; Goulatis, I.L.; Mazepulin, A.V.; Korobkov, M.V.; Vovk, R.V. Effect of high pressure on temperature dependences of the resistivity in the ab-plane of Y0.77Pr0.23Ba2Cu3O7-δ single crystals. J. Mater. Sci. Mater. Electron. 2022, 33, 9875–9884. [Google Scholar] [CrossRef]
- Koga, K.T.; Walter, M.J.; Nakamura, E.; Kobayashi, K. Carbon self-diffusion in a natural diamond. Phys. Rev. B 2005, 72, 024108. [Google Scholar] [CrossRef]
- Koga, K.T.; Van Orman, J.A.; Walter, M.J. Diffusive relaxation of carbon and nitrogen isotope heterogeneity in diamond: A new thermochronometer. Phys. Earth Planet. Inter. 2003, 139, 35–43. [Google Scholar] [CrossRef]
- Zhang, B.; Wu, X. Calculation of self-diffusion coefficients in diamond. Appl. Phys. Lett. 2012, 100, 051901. [Google Scholar] [CrossRef]
- Birch, F. Elasticity and constitution of the Earth’s interior. J. Geophys. Res. 1952, 57, 227–286. [Google Scholar] [CrossRef]
- Zhang, B. Calculation of self-diffusion coefficients in iron. AIP Adv. 2014, 4, 017128. [Google Scholar] [CrossRef] [Green Version]
- Yunker, M.L.; Van Orman, J.A. Interdiffusion of solid iron and nickel at high pressure. Earth Planet. Sci. Lett. 2007, 254, 203–213. [Google Scholar] [CrossRef]
- Reaman, D.M.; Colijn, H.O.; Yang, F.; Hauser, A.J.; Panero, W.R. Interdiffusion of Earth’s core materials to 65 GPa and 2200 K. Earth Planet. Sci. Lett. 2012, 349–350, 8–14. [Google Scholar] [CrossRef]
- Zhang, B.; Xu, J. Thermodynamic estimation the compressibility of ferropericlase under high pressure. AIP Adv. 2016, 6, 115112. [Google Scholar] [CrossRef] [Green Version]
- Xu, J.; Zhang, B. Bridging the water solubility and ion diffusivity in the mantle silicates by a thermodynamic model. Mineral. Petrol. 2020, 114, 1–13. [Google Scholar] [CrossRef]
- Costa, F.; Chakraborty, S. The effect of water on Si and O diffusion rates in olivine and implications for transport properties and processes in the upper mantle. Phys. Earth Planet. Inter. 2008, 166, 11–29. [Google Scholar] [CrossRef] [Green Version]
- Demouchy, S.; Mackwell, S.; Kohlstedt, D. Influence of hydrogen on Fe–Mg interdiffusion in (Mg,Fe)O and implications for Earth’s lower mantle. Contrib. Mineral. Petrol. 2007, 154, 279–289. [Google Scholar] [CrossRef]
- Hier-Majumder, S.; Anderson, I.M.; Kohlstedt, D.L. Influence of protons on Fe-Mg interdiffusion in olivine. J. Geophys. Res. Solid Earth 2005, 110, B02202. [Google Scholar] [CrossRef] [Green Version]
- Wang, Z.; Hiraga, T.; Kohlstedt, D.L. Effect of H+ on Fe–Mg interdiffusion in olivine, (Fe,Mg)2SiO4. Appl. Phys. Lett. 2004, 85, 209–211. [Google Scholar] [CrossRef]
- Mei, S.; Kohlstedt, D.L. Influence of water on plastic deformation of olivine aggregates: 1. Diffusion creep regime. J. Geophys. Res. Solid Earth 2000, 105, 21457–21469. [Google Scholar] [CrossRef]
- Xu, L.; Mei, S.; Dixon, N.; Jin, Z.; Suzuki, A.; Kohlstedt, D. Effect of water on rheological properties of garnet at high temperatures and pressures. Earth Planet. Sci. Lett. 2013, 379, 158–165. [Google Scholar] [CrossRef]
- Wang, D.; Mookherjee, M.; Xu, Y.; Karato, S. The effect of water on the electrical conductivity of olivine. Nature 2006, 443, 977–980. [Google Scholar] [CrossRef]
- Yoshino, T.; Matsuzaki, T.; Yamashita, S.; Katsura, T. Hydrous olivine unable to account for conductivity anomaly at the top of the asthenosphere. Nature 2006, 443, 973–976. [Google Scholar] [CrossRef] [PubMed]
- Zhang, B.; Yoshino, T.; Wu, X.; Matsuzaki, T.; Shan, S.M.; Katsura, T. Electrical conductivity of enstatite as a function of water content: Implications for the electrical structure in the upper mantle. Earth Planet. Sci. Lett. 2012, 357–358, 11–20. [Google Scholar] [CrossRef]
- Griffin, J.M.; Berry, A.J.; Frost, D.J.; Wimperis, S.; Ashbrook, S.E. Water in the Earth’s mantle: A solid-state NMR study of hydrous wadsleyite. Chem. Sci. 2013, 4, 1523–1538. [Google Scholar] [CrossRef] [Green Version]
- Grüninger, H.; Armstrong, K.; Greim, D.; Boffa-Ballaran, T.; Frost, D.J.; Senker, J. Hidden Oceans? Unraveling the Structure of Hydrous Defects in the Earth’s Deep Interior. Earth Planet. Sci. Lett. 2017, 139, 10499–10505. [Google Scholar] [CrossRef]
- Rutter, E.H.; Karato, S.-I. Deformation of Earth Materials. An Introduction to the Rheology of Solid Earth. Geol. Mag. 2008, 147, 317–318. [Google Scholar] [CrossRef]
- Panero, W. First principles determination of the structure and elasticity of hydrous ringwoodite. J. Geophys. Res. 2010, 115, 3203. [Google Scholar] [CrossRef]
- Wright, K. Atomistic Models of OH Defects in Nominally Anhydrous Minerals. Rev. Mineral. Geochem. 2006, 62, 67–83. [Google Scholar] [CrossRef]
- Xue, X.; Kanzaki, M.; Turner, D.; Loroch, D. Hydrogen incorporation mechanisms in forsterite: New insights from 1H and 29Si NMR spectroscopy and first-principles calculation. Am. Mineral. 2017, 102, 519–536. [Google Scholar] [CrossRef]
- Vallianatos, F.; Saltas, V. Application of the cBΩ model to the calculation of diffusion parameters of He in olivine. Phys. Chem. Miner. 2014, 41, 181–188. [Google Scholar] [CrossRef]
- Zhang, B.; Wu, X.; Xu, J.; Zhou, R. Application of the cBΩ model for the calculation of oxygen self-diffusion coefficients in minerals. J. Appl. Phys. 2010, 108, 053505. [Google Scholar] [CrossRef]
- Zhang, B.; Shan, S. Application of the cBΩ model to the calculation of diffusion parameters of Si in silicates. Geochem. Geophys. Geosyst. 2015, 16, 705–718. [Google Scholar] [CrossRef]
- Saltas, V.; Vallianatos, F. Silicon Self-Diffusion in Stishovite: Calculations of Point Defect Parameters Based on the cBΩ Thermodynamic Model. Environ. Sci. Proc. 2021, 6, 6. [Google Scholar] [CrossRef]
- Park, C.M.; Kim, J.H.; Kim, H.; Sohn, H.J. Li-alloy based anode materials for Li secondary batteries. Chem. Soc. Rev. 2010, 39, 3115–3141. [Google Scholar] [CrossRef]
- Beaulieu, L.Y.; Eberman, K.W.; Turner, R.L.; Krause, L.J.; Dahn, J.R. Colossal Reversible Volume Changes in Lithium Alloys. Electrochem. Solid-State Lett. 2001, 4, A137. [Google Scholar] [CrossRef]
- Toyoura, K.; Koyama, Y.; Kuwabara, A.; Oba, F.; Tanaka, I. First-principles approach to chemical diffusion of lithium atoms in a graphite intercalation compound. Phys. Rev. B 2008, 78, 214303. [Google Scholar] [CrossRef] [Green Version]
- Di Stefano, D.; Mrovec, M.; Elsässer, C. First-principles investigation of quantum mechanical effects on the diffusion of hydrogen in iron and nickel. Phys. Rev. B 2015, 92, 224301. [Google Scholar] [CrossRef]
- Kumar, V.; Di Stefano, D.; Rignanese, G.M.; Gonze, X. Li diffusion in Si and LiSi: Nuclear quantum effects and anharmonicity. J. Chem. Phys. 2020, 152, 244101. [Google Scholar] [CrossRef] [PubMed]
- Flynn, C.P. Anharmonicity in Diffusion. Z. Naturforschung A 1971, 26, 99–106. [Google Scholar] [CrossRef]
- DeLorenzi, G.; Flynn, C.P.; Jacucci, G. Effect of anharmonicity on diffusion jump rates. Phys. Rev. B 1984, 30, 5430–5448. [Google Scholar] [CrossRef]
- Kim, D.S.; Smith, H.L.; Niedziela, J.L.; Li, C.W.; Abernathy, D.L.; Fultz, B. Phonon anharmonicity in silicon from 100 to 1500 K. Phys. Rev. B 2015, 91, 014307. [Google Scholar] [CrossRef] [Green Version]
- Saltas, V.; Chroneos, A.; Vallianatos, F. Mg diffusion in Si on a thermodynamic basis. J. Mater. Sci. Mater. Electron. 2018, 29, 12022–12027. [Google Scholar] [CrossRef] [Green Version]
- Wimmer, E.; Wolf, W.; Sticht, J.; Saxe, P.; Geller, C.B.; Najafabadi, R.; Young, G.A. Temperature-dependent diffusion coefficients from ab initio computations: Hydrogen, deuterium, and tritium in nickel. Phys. Rev. B 2008, 77, 134305. [Google Scholar] [CrossRef]
- Zhao, F.; Lei, C.; Zhao, Q.; Yang, H.; Ling, G.; Liu, J.; Zhou, H.; Wang, H. Predicting the property contour-map and optimum composition of Cu-Co-Si alloys via machine learning. Mater. Today Commun. 2022, 30, 103138. [Google Scholar] [CrossRef]
- Zhao, Z.; Zhang, Y.; Tian, B.; Jia, Y.; Liu, Y.; Song, K.; Volinsky, A.A. Co effects on Cu-Ni-Si alloys microstructure and physical properties. J. Alloys Compd. 2019, 797, 1327–1337. [Google Scholar] [CrossRef]
- Li, R.; Zhang, S.; Zou, C.; Kang, H.; Wang, T. The roles of Hf element in optimizing strength, ductility and electrical conductivity of copper alloys. Mater. Sci. Eng. A 2019, 758, 130–138. [Google Scholar] [CrossRef]
- Lei, C.; Yang, H.; Zhao, F.; Fang, X.; Fang, Y.; Meng, L.; Liu, J.; Wang, H. Effect of Co addition on hardness and electrical conductivity of Cu–Si alloys. J. Mater. Sci. 2021, 56, 14821–14831. [Google Scholar] [CrossRef]
- Soldi, L.; Laplace, A.; Roskosz, M.; Gossé, S. Phase diagram and thermodynamic model for the Cu-Si and the Cu-Fe-Si systems. J. Alloys Compd. 2019, 803, 61–70. [Google Scholar] [CrossRef]
- Geng, Y.; Li, X.; Zhou, H.; Zhang, Y.; Jia, Y.; Tian, B.; Liu, Y.; Volinsky, A.A.; Zhang, X.; Song, K.; et al. Effect of Ti addition on microstructure evolution and precipitation in Cu–Co–Si alloy during hot deformation. J. Alloys Compd. 2020, 821, 153518. [Google Scholar] [CrossRef]
- Zhang, W.; Starr, F.W.; Douglas, J.F. Activation free energy gradient controls interfacial mobility gradient in thin polymer films. J. Chem. Phys. 2021, 155, 174901. [Google Scholar] [CrossRef]
- Dyre, J.C.; Wang, W.H. The instantaneous shear modulus in the shoving model. J. Chem. Phys. 2012, 136, 224108. [Google Scholar] [CrossRef] [Green Version]
- Puosi, F.; Leporini, D. The kinetic fragility of liquids as manifestation of the elastic softening. Eur. Phys. J. E 2015, 38, 87. [Google Scholar] [CrossRef] [Green Version]
- Vargas-Lara, F.; Starr, F.W.; Douglas, J.F. Molecular rigidity and enthalpy–entropy compensation in DNA melting. Soft Matter 2017, 13, 8309–8330. [Google Scholar] [CrossRef]
- Magomedov, M. Dependencies of the parameters of vacancy formation and self-diffusion in a single-component crystal on temperature and pressure. J. Phys. Chem. Solids 2022, 165, 110653. [Google Scholar] [CrossRef]
Figure 1.
A block diagram summarizing the applications of cB model discussed here.

Figure 2.
The experimental values of the defect volumes in LiF versus the defect Gibbs energy for all three defect processes mentioned in the inset. Concerning the blue straight line and the magenta line, see the inset as well as the text.
Figure 2.
The experimental values of the defect volumes in LiF versus the defect Gibbs energy for all three defect processes mentioned in the inset. Concerning the blue straight line and the magenta line, see the inset as well as the text.

Figure 3.
The values versus temperature (P = const) plotted for several pressures.

Figure 4.
The values versus temperature (P = const) plotted for several pressures.

Publisher’s Note: MDPI stays neutral with regard to jurisdictional claims in published maps and institutional affiliations. |
© 2022 by the authors. Licensee MDPI, Basel, Switzerland. This article is an open access article distributed under the terms and conditions of the Creative Commons Attribution (CC BY) license (https://creativecommons.org/licenses/by/4.0/).
Share and Cite
MDPI and ACS Style
Varotsos, P.A.; Sarlis, N.V.; Skordas, E.S. Thermodynamics of Point Defects in Solids and Relation with the Bulk Properties: Recent Results. Crystals 2022, 12, 686. https://0-doi-org.brum.beds.ac.uk/10.3390/cryst12050686
AMA Style
Varotsos PA, Sarlis NV, Skordas ES. Thermodynamics of Point Defects in Solids and Relation with the Bulk Properties: Recent Results. Crystals. 2022; 12(5):686. https://0-doi-org.brum.beds.ac.uk/10.3390/cryst12050686
Chicago/Turabian StyleVarotsos, Panayiotis A., Nicholas V. Sarlis, and Efthimios S. Skordas. 2022. "Thermodynamics of Point Defects in Solids and Relation with the Bulk Properties: Recent Results" Crystals 12, no. 5: 686. https://0-doi-org.brum.beds.ac.uk/10.3390/cryst12050686
Note that from the first issue of 2016, this journal uses article numbers instead of page numbers. See further details here.