
Properties of Self-Compacting Concrete Using Multi-Component Blend Binders for CO2 Reduction


Department of Environmental and Energy Engineering, Daejin University, Hoguk-ro 1007, Pocheon-si 11159, Korea
Crystals 2022, 12(6), 864; https://0-doi-org.brum.beds.ac.uk/10.3390/cryst12060864
Submission received: 28 April 2022
/
Revised: 12 June 2022
/
Accepted: 17 June 2022
/
Published: 19 June 2022
(This article belongs to the Special Issue Crystalizations in Cementitous Composites)
Abstract
:This paper aims to reduce the quantity of cement used by up to 80% by utilizing industrial by-products. By reducing the amount of cement used, there is an effect of reducing CO2 emissions during cement manufacturing. To reduce the amount of cement used, ground granulated blast-furnace slag (GGBF), fly-ash (FA), and calcium carbonate (CC) were used as substitute materials for cement. CC is a by-product, discharged by collecting CO2 emitted from a coal-fired power plant and reacting with additives. The specific surface area and the average particle size of CC used are 12,239 cm2/g and 5.9 μm (D50), respectively. The viscosity of pastes that contained GGFF and FA decreased by up to 51 and 49% respectively compared to the use of only cement (OPC) paste. However, paste using with CC increased up to 23% in relation to plain. As a result of measuring slump flow, segregation resistance ability, and filling ability to evaluate construction performance, slump flow was reduced by up to 3% (G40F10C30) in relation to plain concrete. Segregation resistance ability of fresh concrete using, GGBF (15, 30, and 45%), FA (10, 20, and 30%), CC (10, 20, and 30%), the time it takes for the slump flow to reach 500 mm, time it takes to through the V-funnel showed a decreasing tendency as the usage of FA increased. However, CC increased with increasing mixing ratio. This trend is, the viscosity increase when CC was mixed in terms of rheology. Filling ability of fresh concrete using GGBF (15, 30, and 45%), FA (10, 20, and 30%) and CC (10, 20, and 30%), the criteria were met, and the average increase was 16% and the maximum was 20% in relation to plain concrete. In the case of compressive strength, the compressive strength at 1 day was found to be an average of 5 MPa when 80% of the cementitious was substituted. At 3 days, at least 8 MPa was measured. The compressive strength at 28 days showed a tendency to decrease as the mixing rate of CC increased, but was measured to be at least 34 MPa. The relationship between compressive strength and splitting tensile strength or elastic modulus at 28 days satisfies the standard range.
1. Introduction
Environmental problems caused by air pollution are recognized as a social problem to be solved throughout the industry [1]. The cement industry emits more than 500 million tons of CO2 per year. This is because about 0.7 tons of CO2 is emitted when manufacturing 1 ton of cement [2,3]. During the cement manufacturing process, the CO2 emission from limestone decarboxylation is about 60%, and the emission from fuel combustion during the calcination process is about 30% [4,5]. Accordingly, efforts are being made in the cement industry to reduce greenhouse gas emissions, develop new facilities, and increase the content of admixtures, but the initial investment cost increase due to the development of new technologies and installation of facilities. In contrast, increasing the amount of industrial by-products used in concrete production and reducing the amount of cement can secure economic feasibility and significantly reduce CO2 emissions. Until recently of research and development of self-compacting concrete, various types of concrete with mineral admixtures used as a replacement of cement are examined [6,7]. In general, the replacement rate of cement is only about 60%. If 60% or more is replaced with other cementitious it is important to initial strength. This paper aims to reduce the amount of CO2 generated during cement manufacturing by maximally reducing the amount of cement used by using up to 80% of industrial by-products [8]. Especially, calcium carbonate used as a substitute for cement is a by-products discharged by collecting CO2 emitted from a coal-fired power plant and reacting with additives. And GGBF and FA were used. In this study, after examining the rheological properties of cementitious substances (GGBF, FA and CC), the properties of fresh concrete such as workability, segregation resistance ability and filling capacity were examined [9,10]. And the compressive strength at 1 day and 28 days, splitting tensile strength and elastic moduli at 28 days were measured and reviewed [11,12]. Through the results, it is that to provide basic data as one of the CO2 reduction measures in the cement industry.
2. Materials and Methods
2.1. Materials
Table 1 summarizes the cementitious properties. Fine aggregate density of 2.59 g/cm3 and absorption ratio of 1.56% were used, and coarse aggregates with a maximum size of 20 mm, density of 2.67 g/cm3, and absorption ratio of 0.8% were used. For the flowability of self-compacting concrete, polycarbonate-based superplasticizer (SP) and air-entraining admixture (AE) were used [13].
2.2. Experimental Plan
2.2.1. Calcium Carbonate Review
2.2.2. Rheological Review
2.2.3. Concrete Test
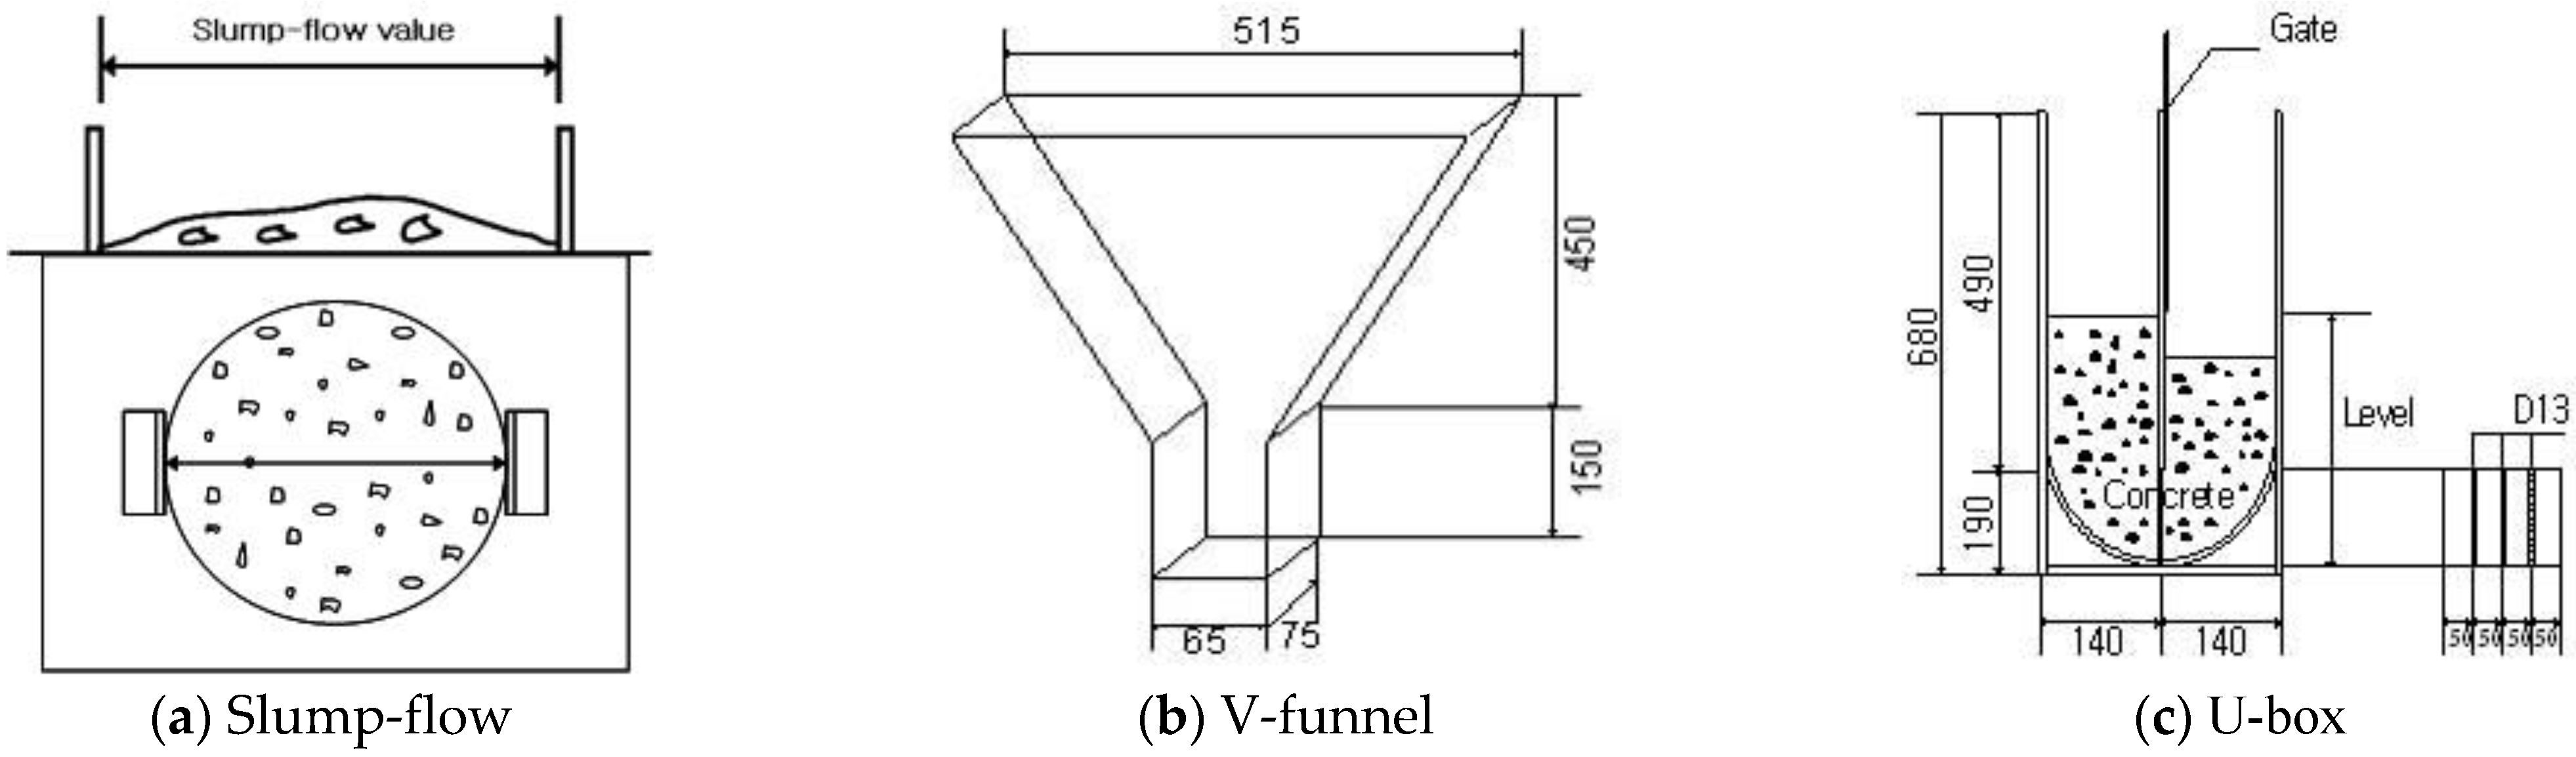
Table 3 shows the mixture proportions of multi-component blended binder self-compacting concrete. The substitution ratio of GGBF is 20 to 60%, the substitution ratio of FA is 10 to 30%, and the substitution ratio of CC is 10 to 30% (total weight of cementitious materials). As the plain, only OPC was used. Table 4 shows the criteria of self-compacting concrete. Review items include slump flow, time it takes to through the V-funnel, time it takes for the slump flow to reach 500 mm and U-box test [9,10]. Figure 1 shows the equipment for evaluating the properties of self-compacting concrete. Figure 1a is for measuring slump flow and time it takes for the slump flow to reach 500 mm. Figure 1b is to measure the time it takes to through the V-funnel. Figure 1c is for measuring the U-box test. To examine the mechanical properties of concrete, compressive strength at 1 day, 3 days, and 28 days of age was measured. In addition, the splitting tensile strength and elastic moduli at the age of 28 were measured and examined [11,12].
3. Results and Discussion
3.1. Calcium Carbonate
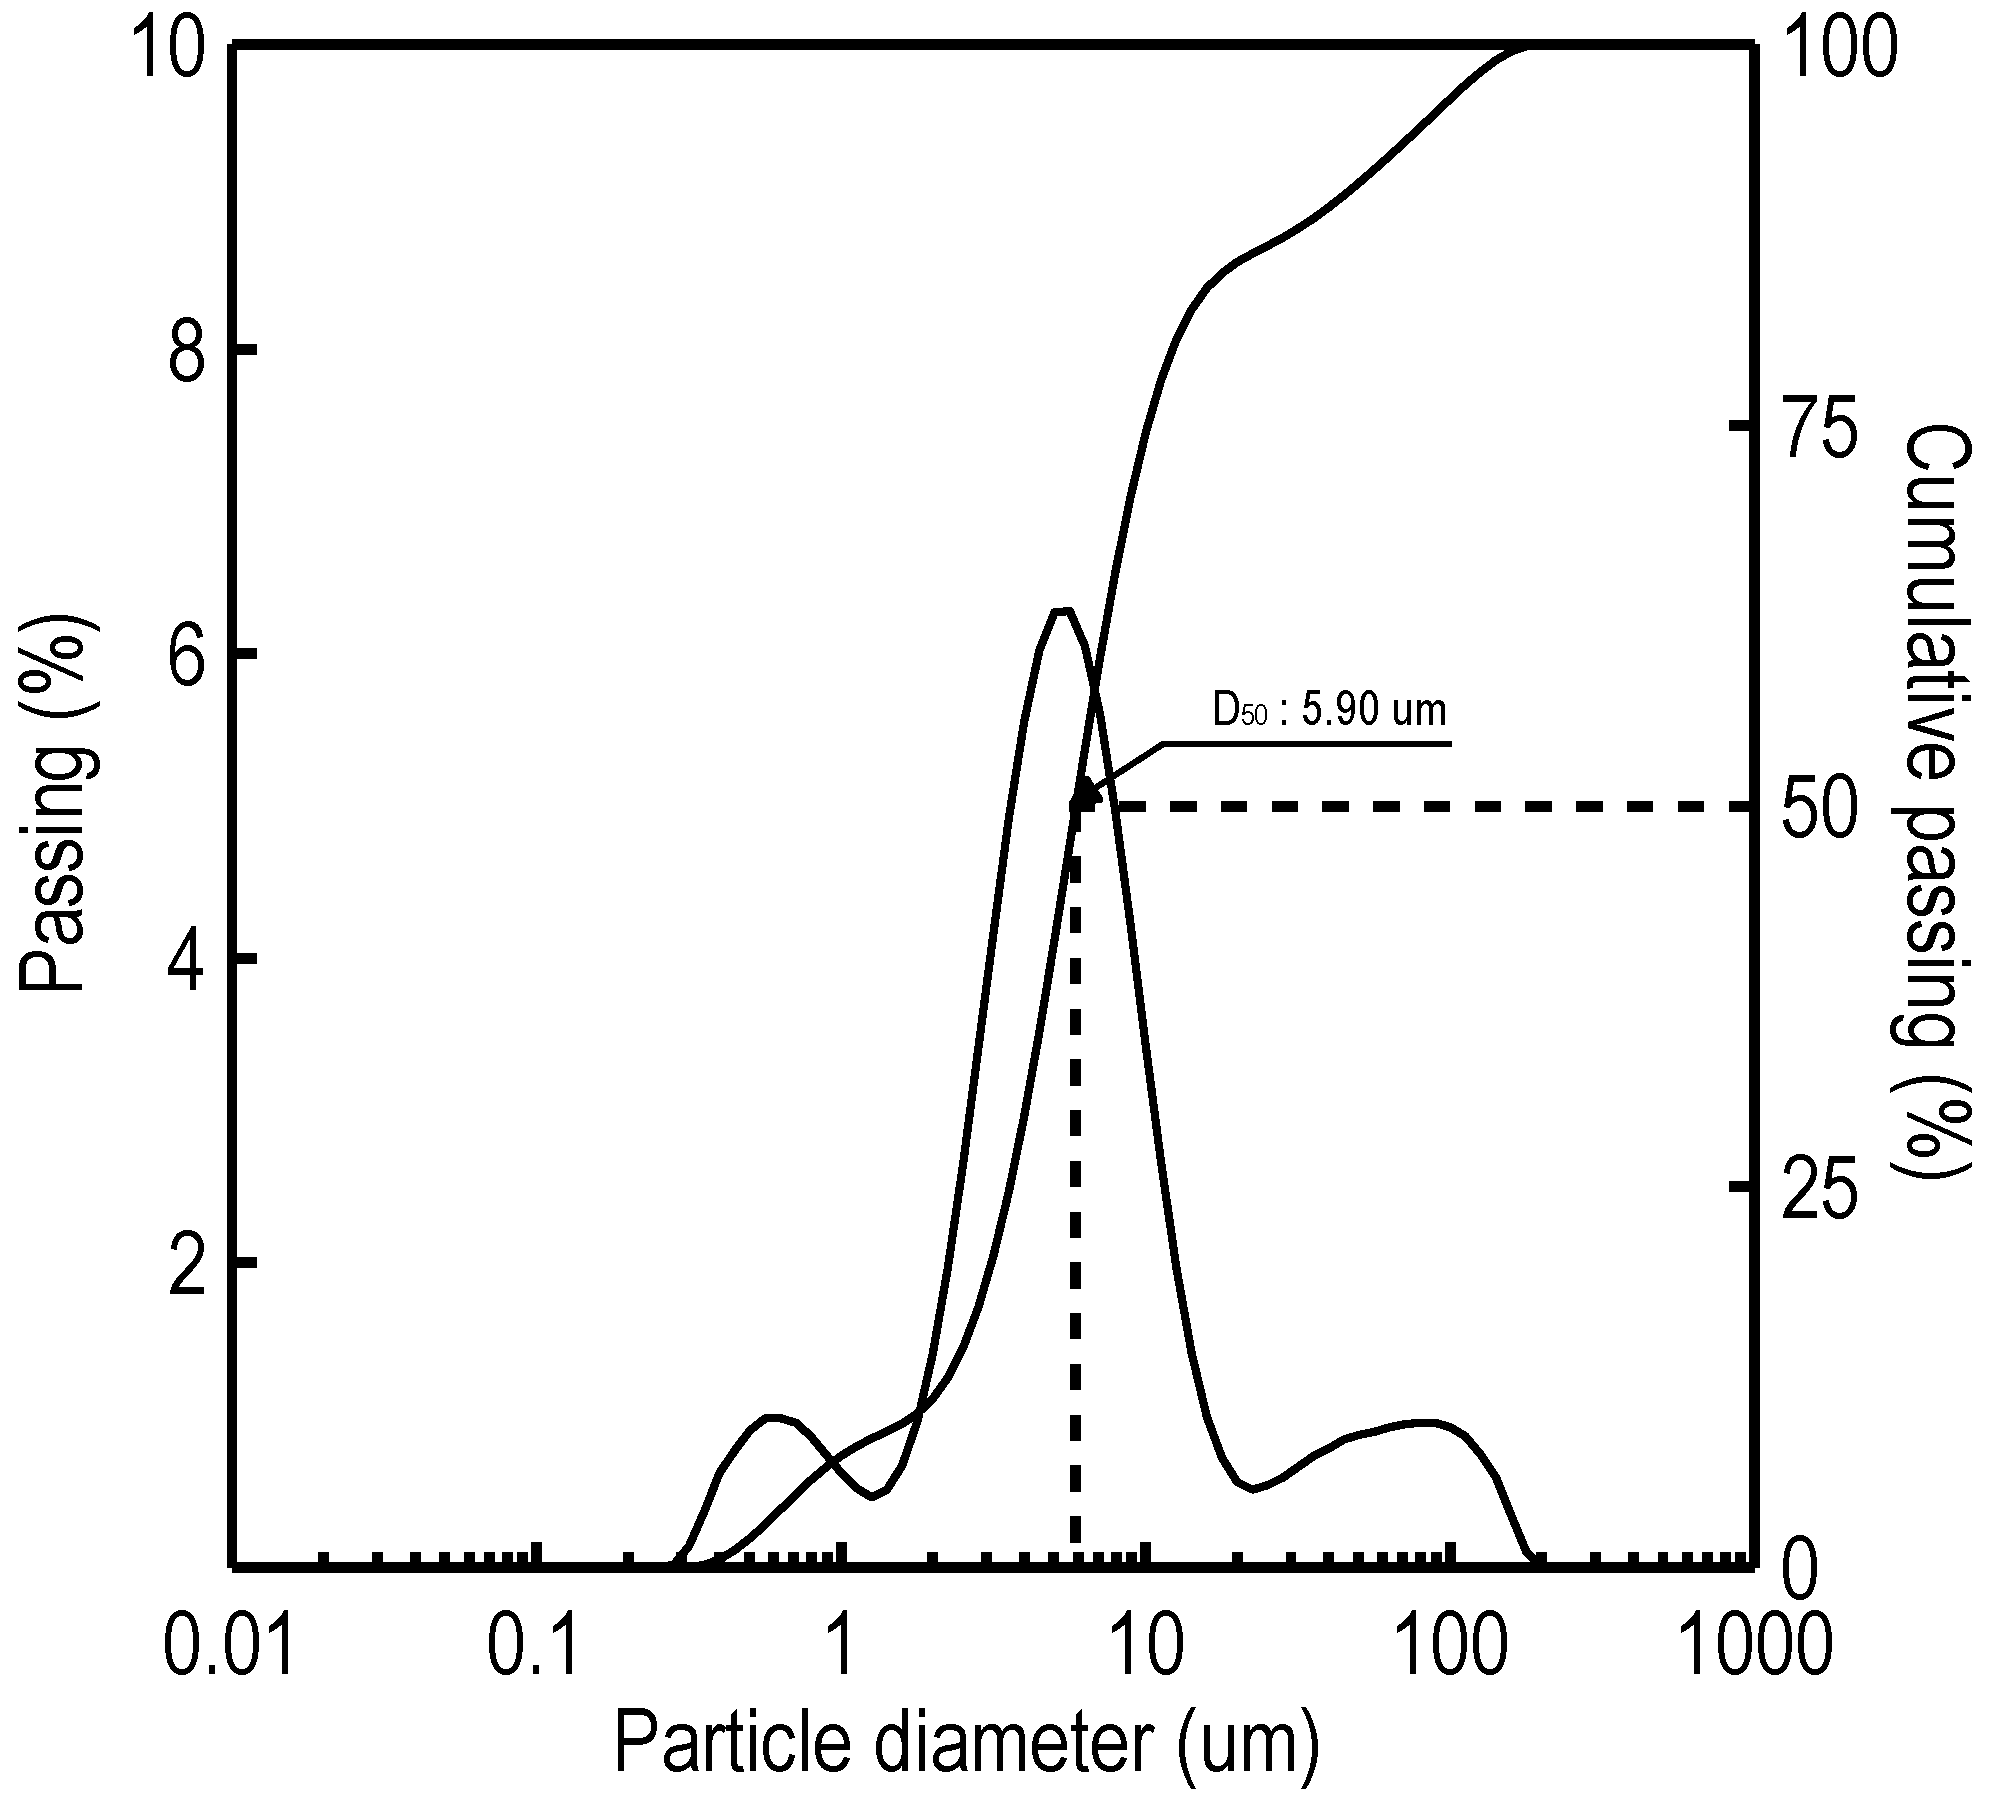
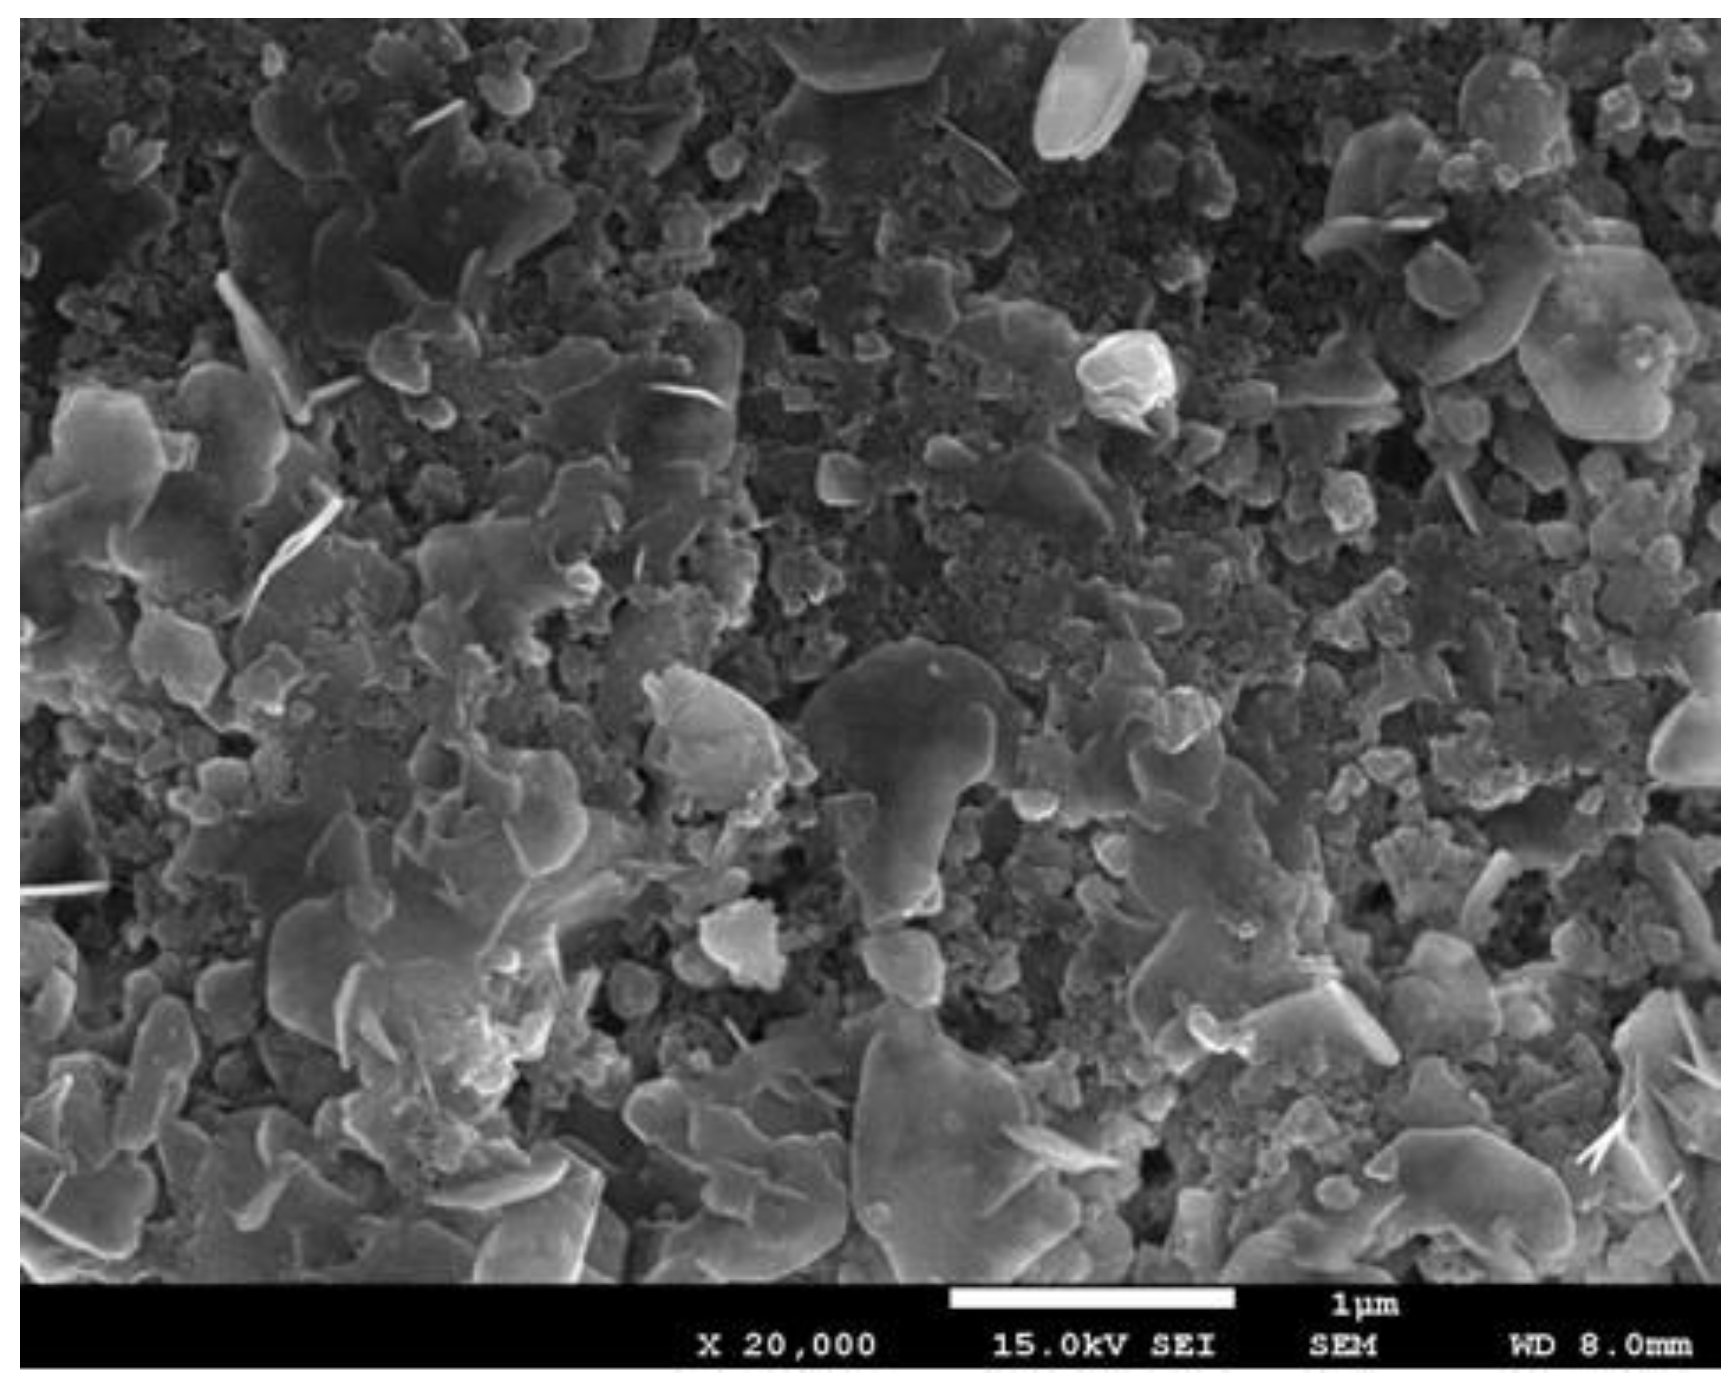
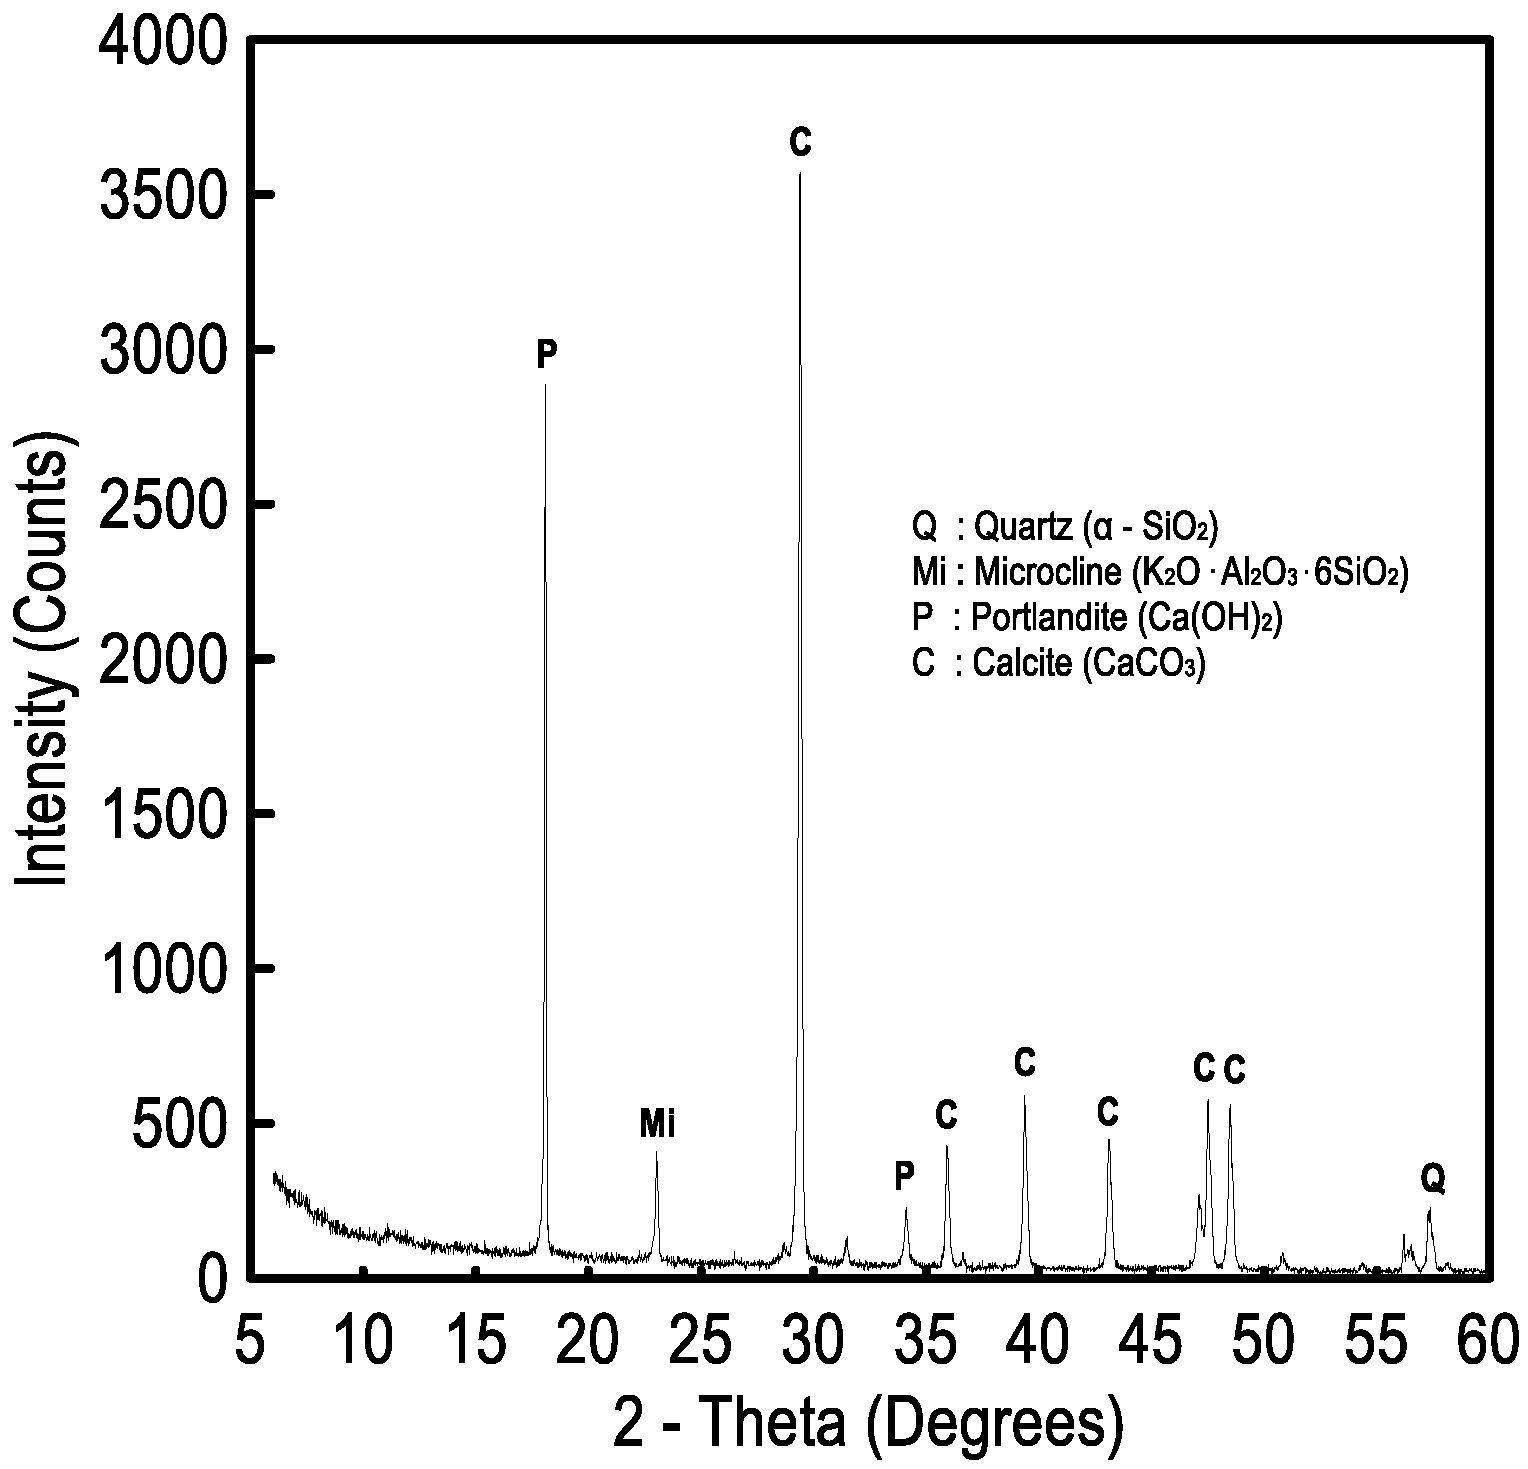
Figure 2 summarizes the particle size distribution of CC. As a result of Figure 2, the diameter of the calcium carbonate particles was 5.9 μm when the cumulative passage amount was 50%. Figure 3 shows the scanning electron microscope (SEM) image of CC. As shown in Figure 3, CC particle has an irregular shape in the form of a rhombus. Figure 4 summarizes the X-ray diffraction (XRD) analysis of CC. As a result of Figure 4, the main intensity was found to be around 30 degrees, and it was found that the main composition was calcite [16].
3.2. Paste Properties
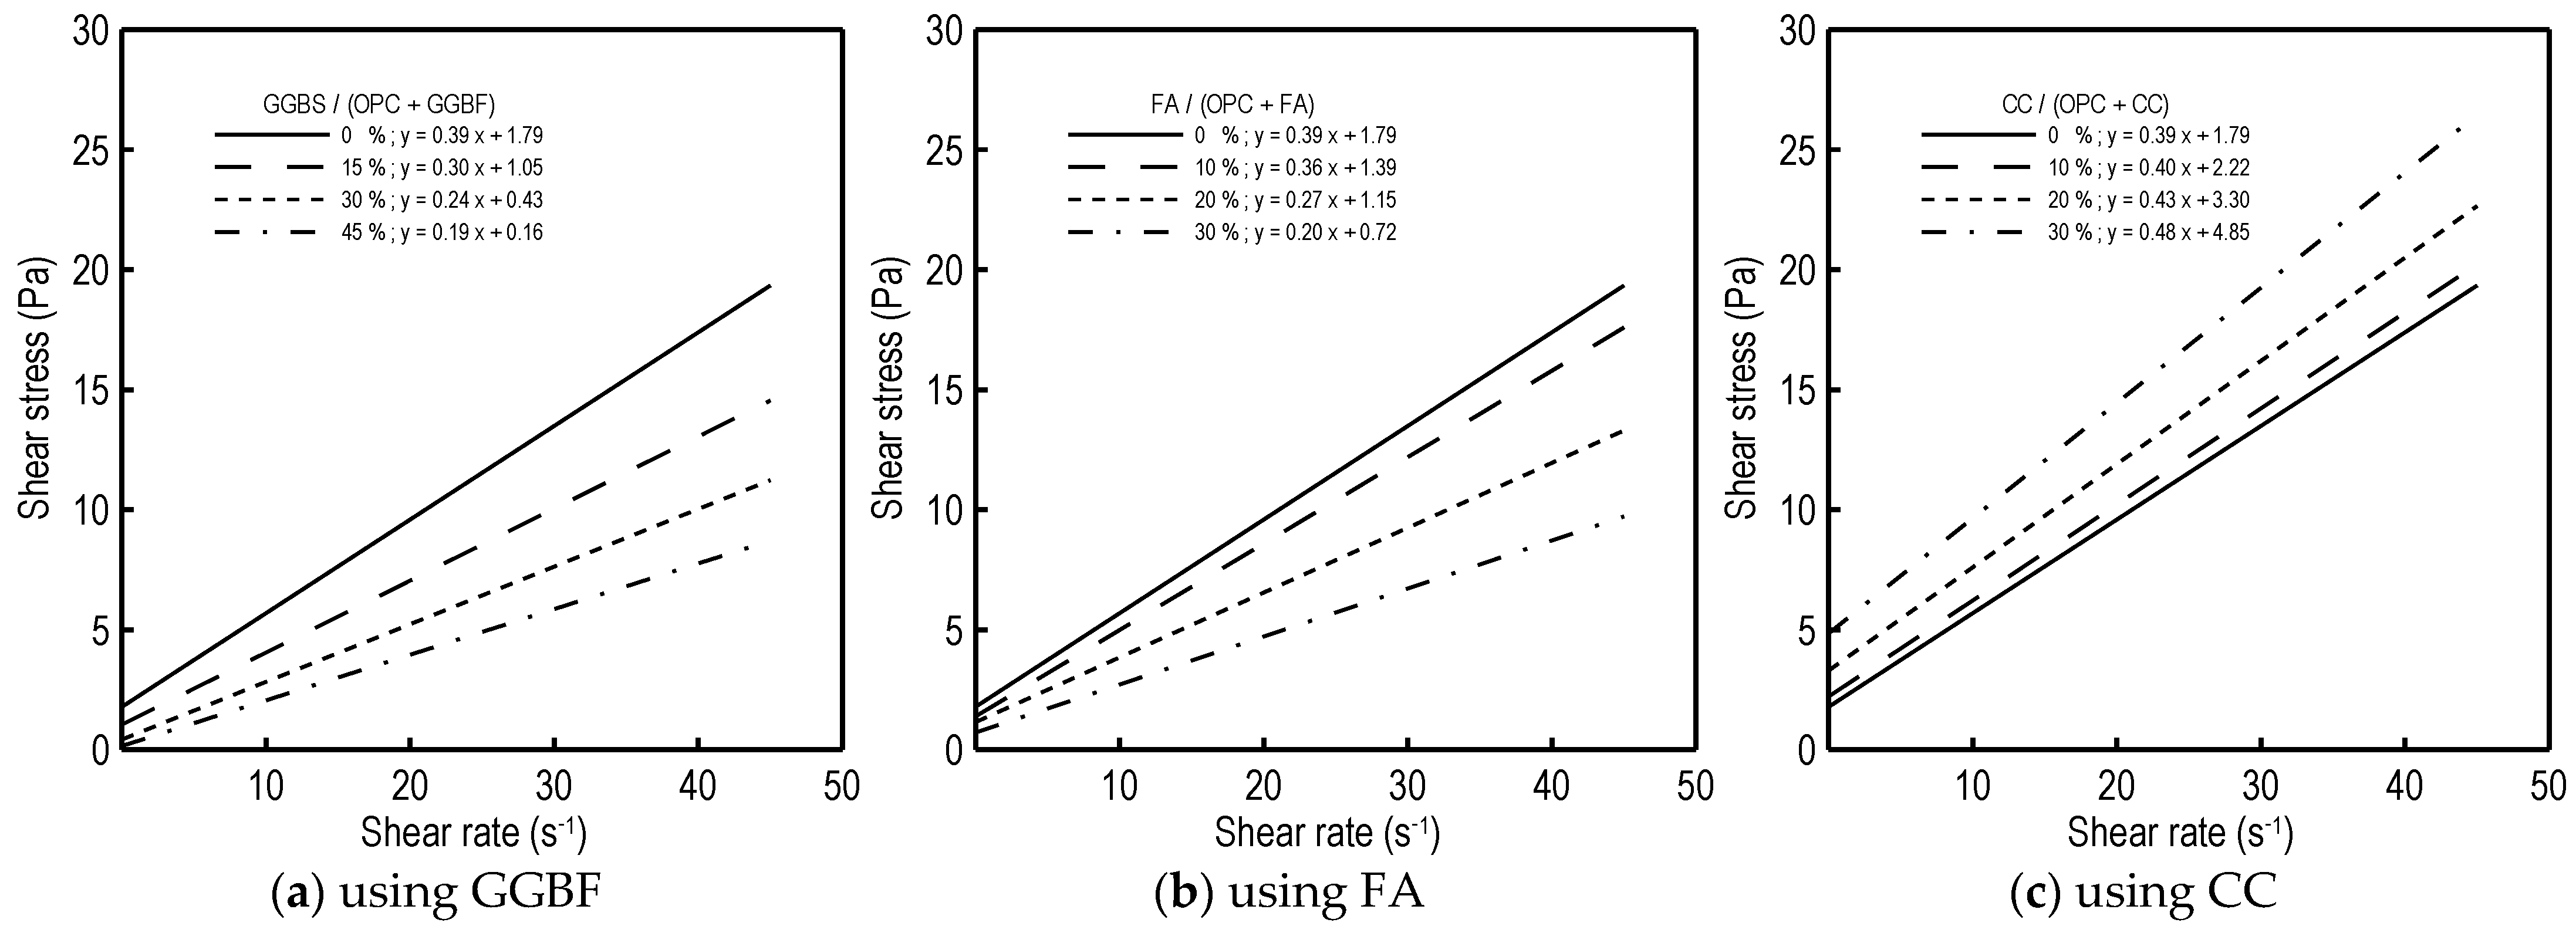
Figure 5 shows the results of measuring the shear rate and shear stress of the paste to examine the rheological properties of GGBF, FA, and CC. In Figure 5, the slope is the viscosity, and the y-intercept is the yield stress. As a result of Figure 5a, as the substitution ratio of GGBF increased to 15, 30, and 45%, the viscosity decreased by 23, 38, and 51% in relation to plain. The viscosity properties of the paste using, FA and the viscosity properties of the paste using, GGBF show similar trends. Figure 5b, as the substitution ratio of FA increased to 10, 20, and 30%, the viscosity decreased by 8, 31, and 49% in relation to plain. The reason for the lower viscosity of the paste using, GGBF and FA in relation to plain is that the lubrication action by impermeable anodizing of the GGBF surface is activated, and FA is thought to be, the particles, spherical [17]. Figure 5c summarizes the rheological properties of the paste using, CC. As a result of Figure 5c, as the substitution ratio of CC increased to 10, 20, and 30%, the viscosity increased by 3, 8, and 23% in relation to plain. Those differences are considered to be, the fact that CC has smaller particles than OPC, GGBF, and FA. And CC has an angular shape. The yield stress also has a tendency similar to the viscosity. In Figure 5a, as the substitution ratio of GGBF increased to 15, 30, and 45%, its yield stress decreased by 41, 76 and 91% in relation to plain. Figure 5b, as the substitution ratio of FA increased to 10, 20, and 30%, its yield stress decreased by 22, 36, and 60% [15]. However, Figure 5c, as the substitution ratio of CC increased to 10, 20, and 30%, its yield stress increased by 24, 84, and 171% in relation to plain. These causes are similar to viscosity results.
3.3. Fresh Concrete
3.3.1. Air Content
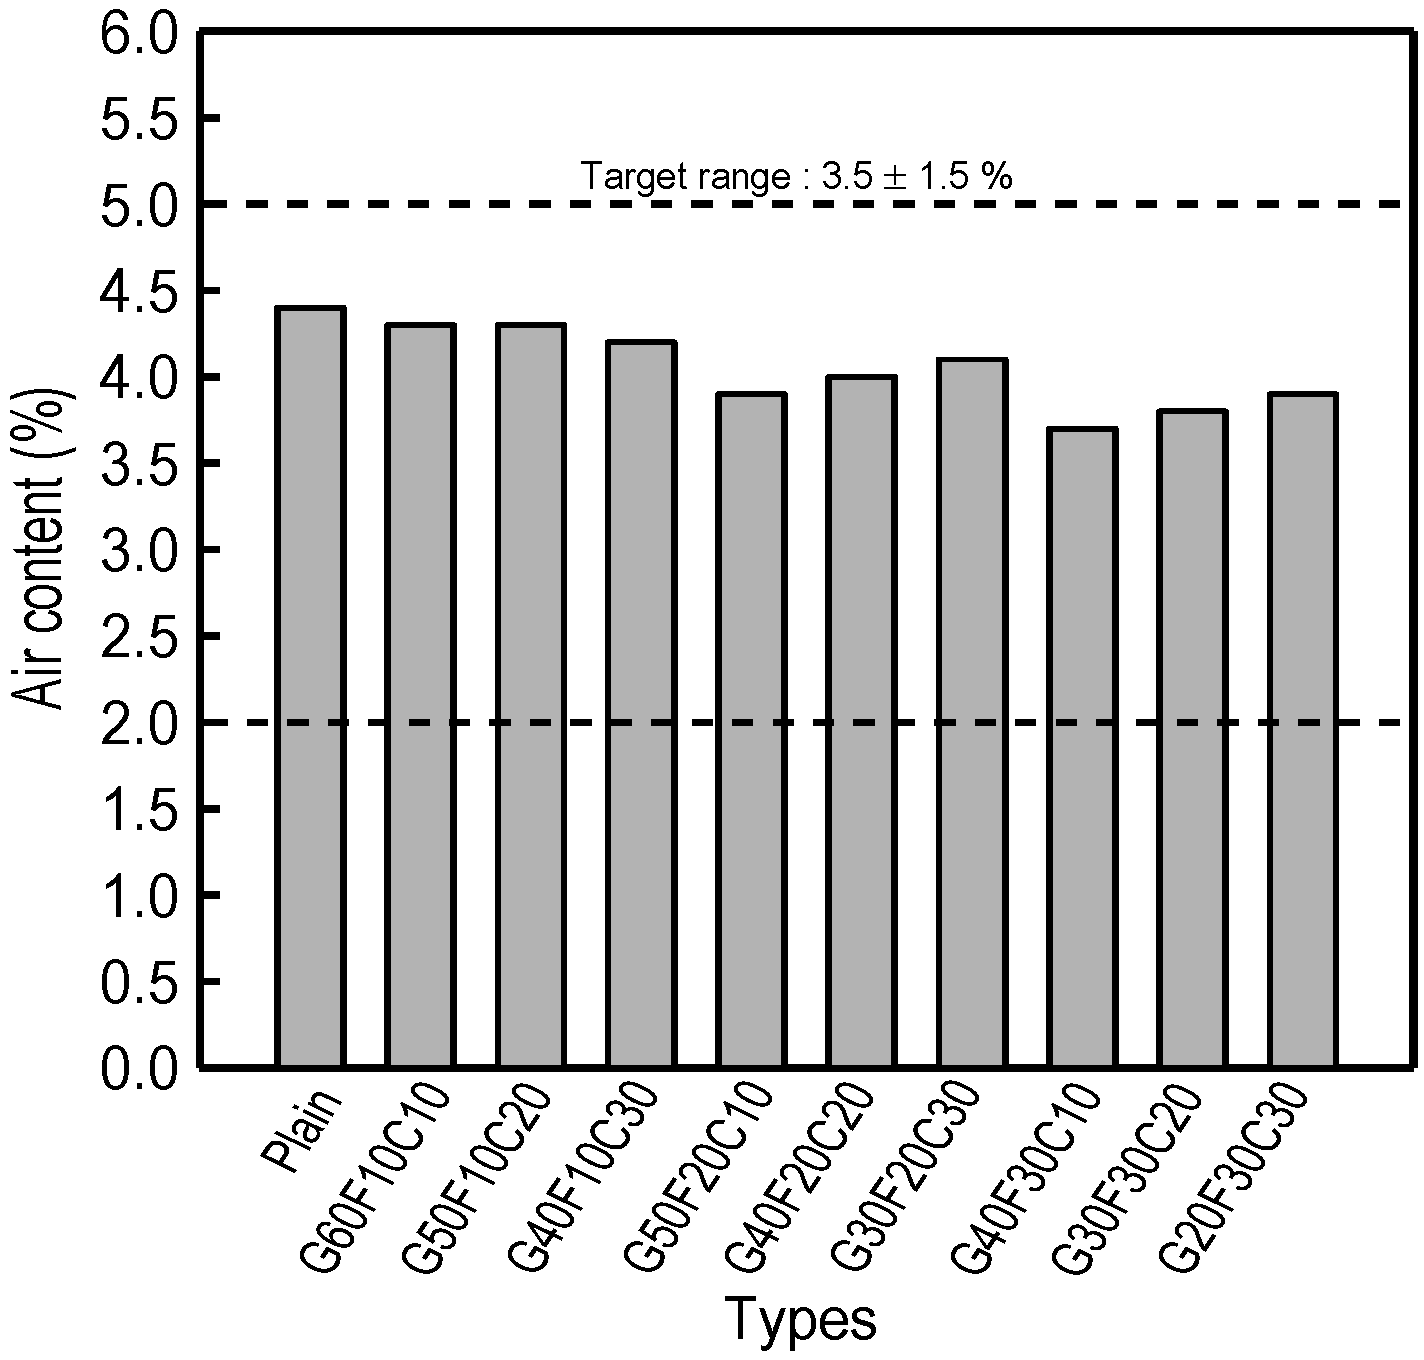
The amount of entrained air in concrete is important in terms of durability and strength. If it is too small, durability becomes weak, and if it is too large, a problem of a decrease in strength occurs. In general, in the case of normal strength concrete, the entrained air amount is about 4.5 ± 1.5%, and in the case of high strength such as self-compacting concrete, 3.5 ± 1.5% is appropriate. Therefore, the entrained air volume in this study is 3.5%. Figure 6 shows the results of entrained-air volume measurement. In the scope of this study, the target entrained air volume was satisfied. [18].
3.3.2. Slump Flow
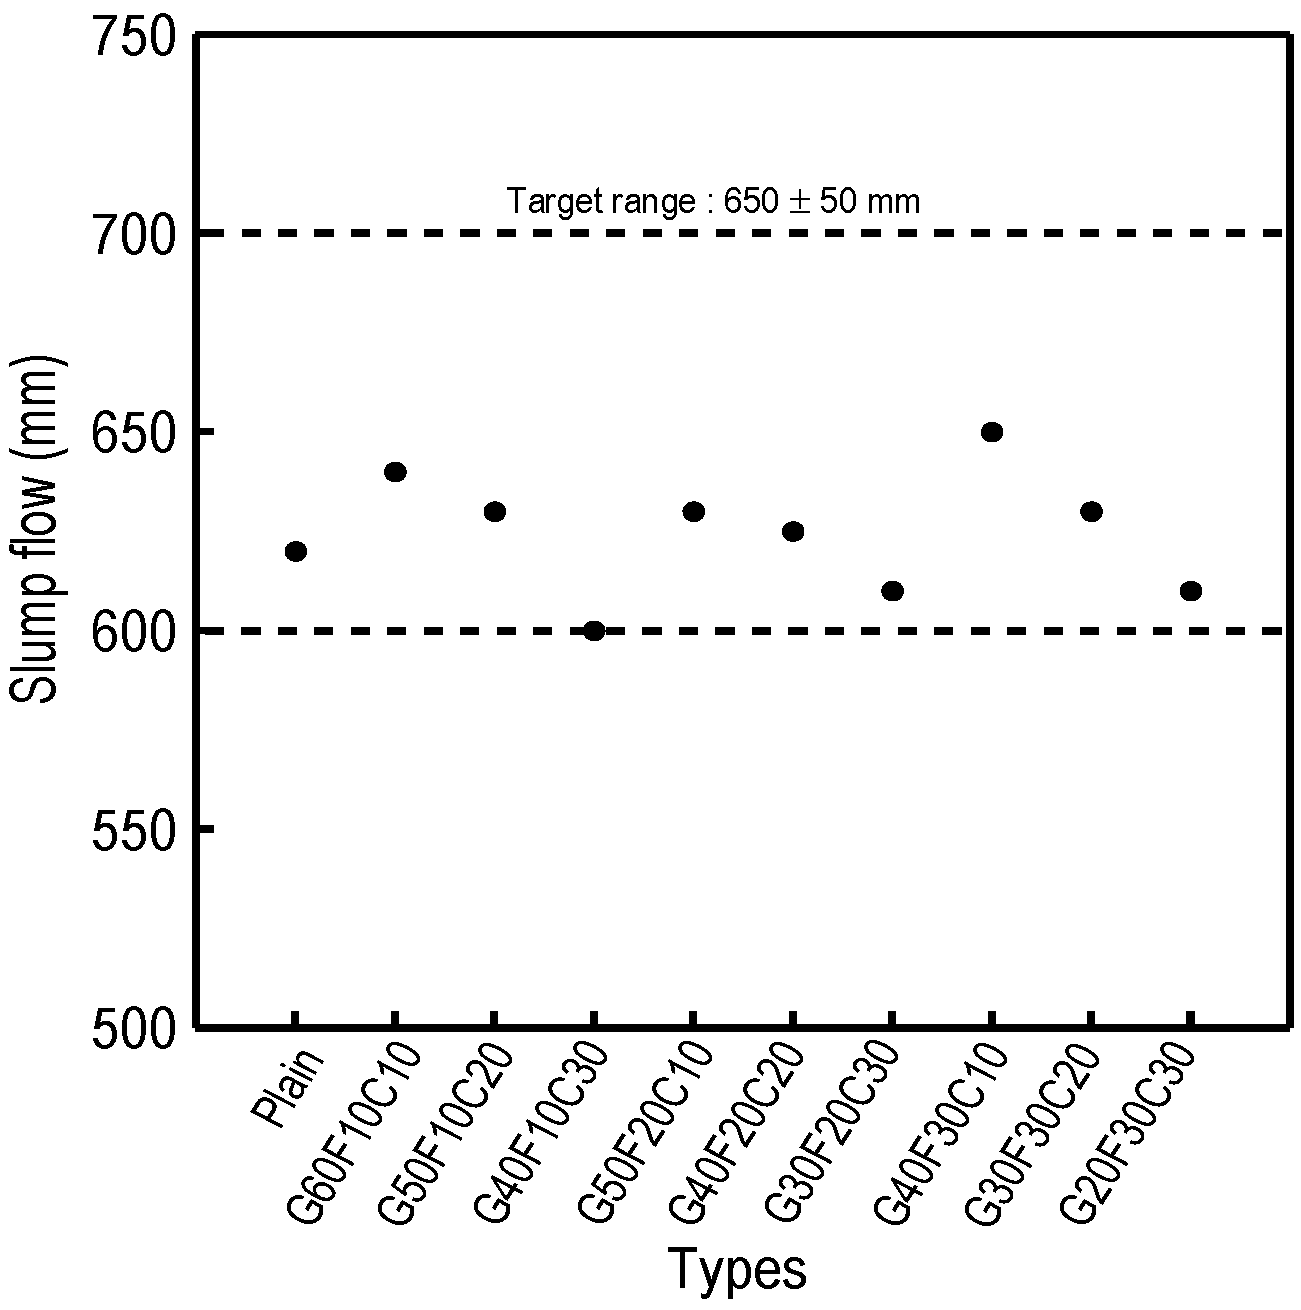
Figure 7 shows the measurement of slump flow by changing the rates of GGBF, FA, and CC to examine the flowability of the cementitious used as a cement replacement material. As shown in Figure 7, the target slump flow was satisfied under the experimental conditions of this study. From a rheological point of view, as the CC substitution rate increased, the slump flow decreased, GGBF and FA are expected to be more advantageous than CC [19]. In other words, in terms of rheology, concrete using with CC tends to have a higher yield stress than when GGBF and FA are used. In general, yield stress and slump flow are inversely proportional to each other. Therefore, when the yield stress is large, the slump flow tends to decrease.
3.3.3. Segregation Resistance Ability
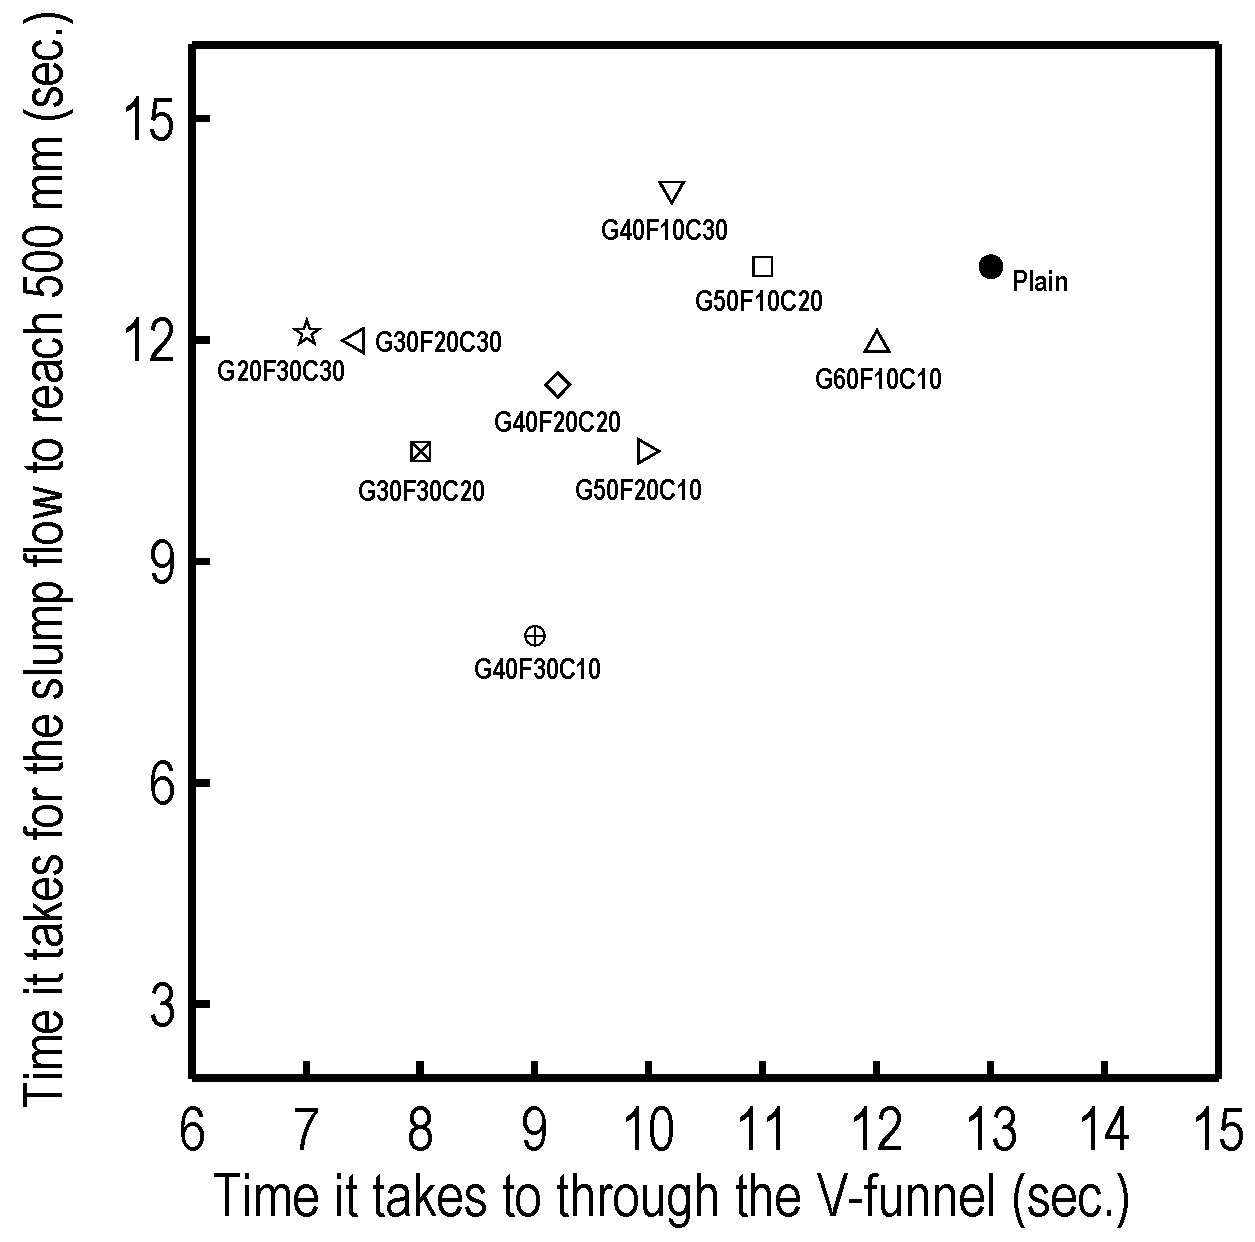
Figure 8 shows the time it takes for fresh concrete to through the V-funnel and the time it takes for the slump flow to reach 500 mm. This is to evaluate the segregation resistance ability of fresh concrete. In the case of the time it takes for the slump flow to reach 500 mm, the target standard (3–15 s) was satisfied. In Figure 8, as the substitution ratio of FA increased, the time to reach 500 mm of the slump flow decreased, and in the case of CC, it increased as the substitution ratio increased. This is because the viscosity increased as the substitution ratio of CC increased [19]. The time it takes for fresh concrete to through the V-funnel of fresh concrete satisfies the target range (7–13 s).
3.3.4. Filling Ability
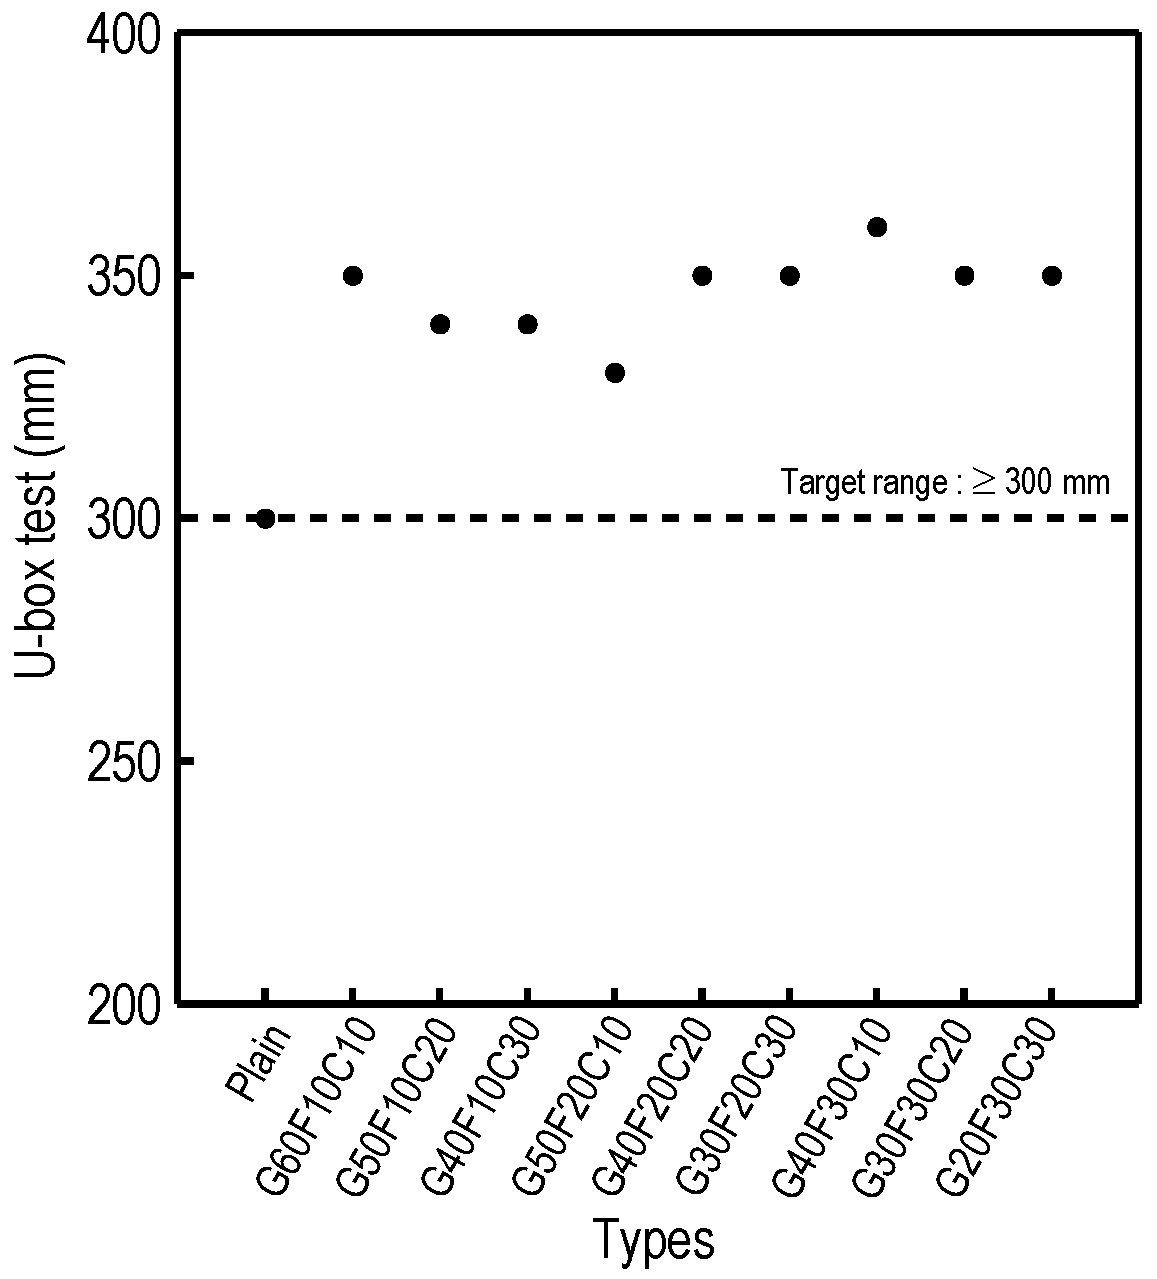
Figure 9 shows the results of the U-box test. In the case of self-compacting concrete, it is essential to evaluate the filling capacity in the fresh state. As a result of Figure 9, the target criteria were satisfied within the scope of this study. The filling capacity was improved by an average of 16% in cases.
3.4. Mechanical Properties of Concrete
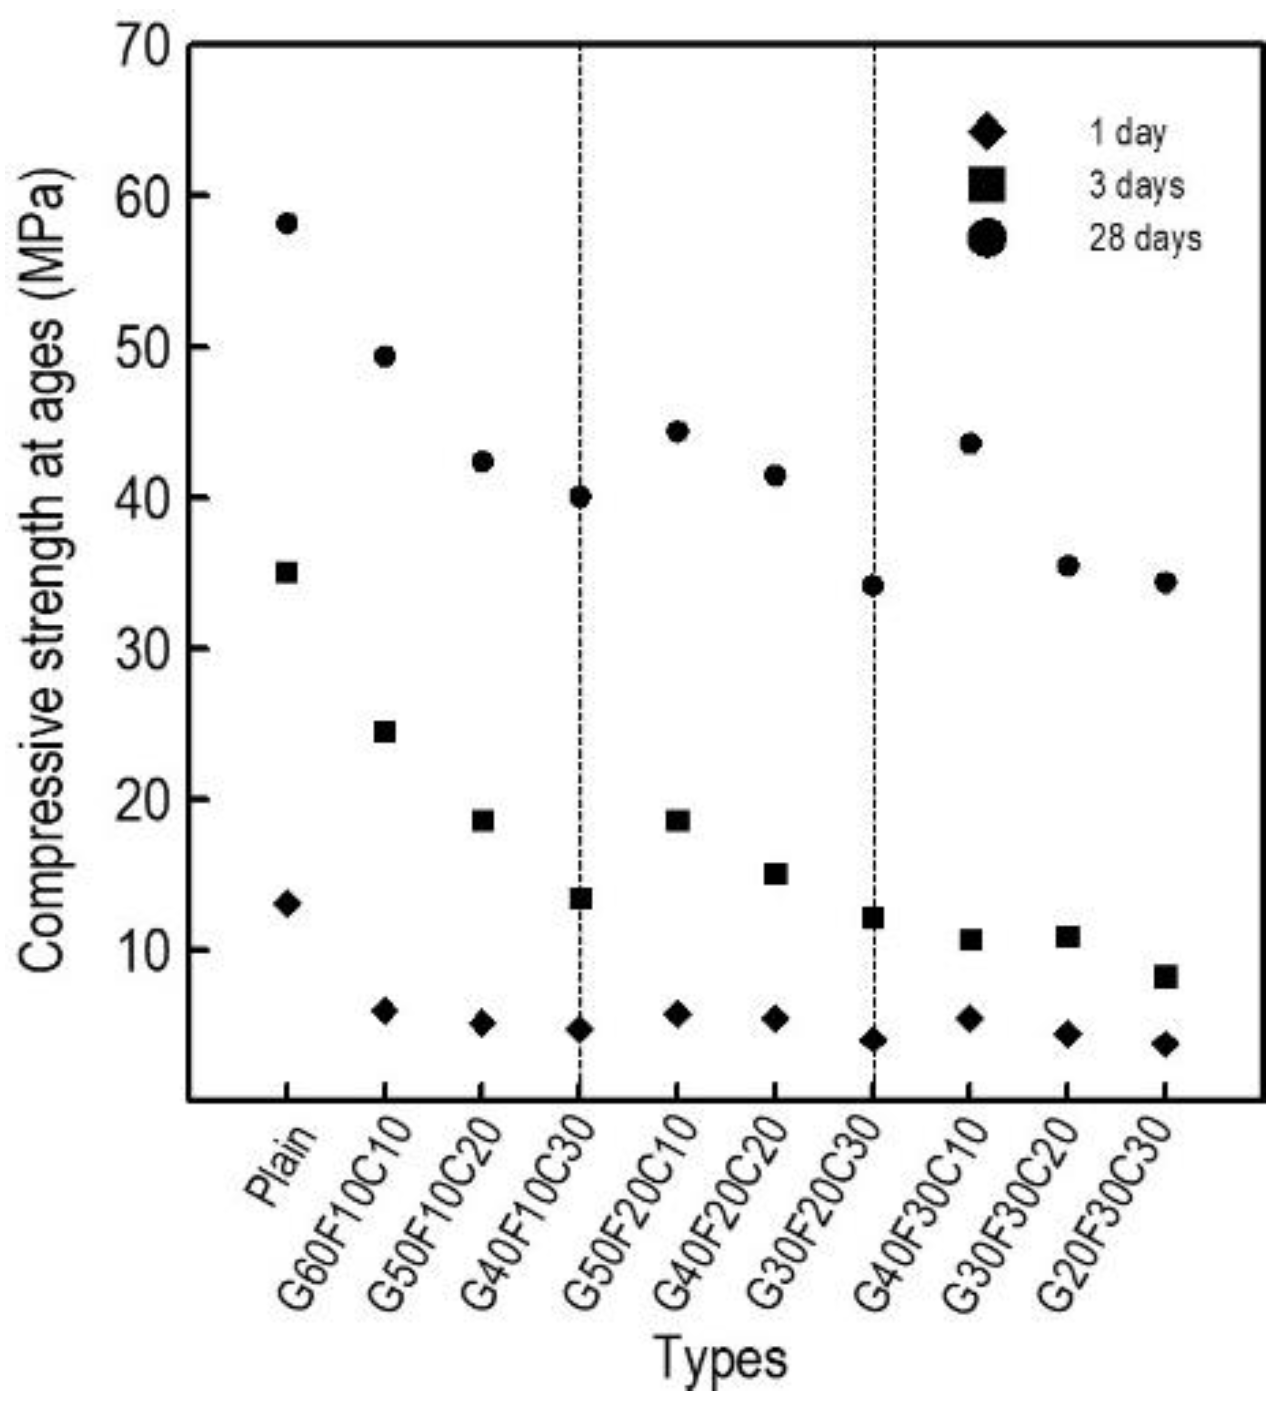
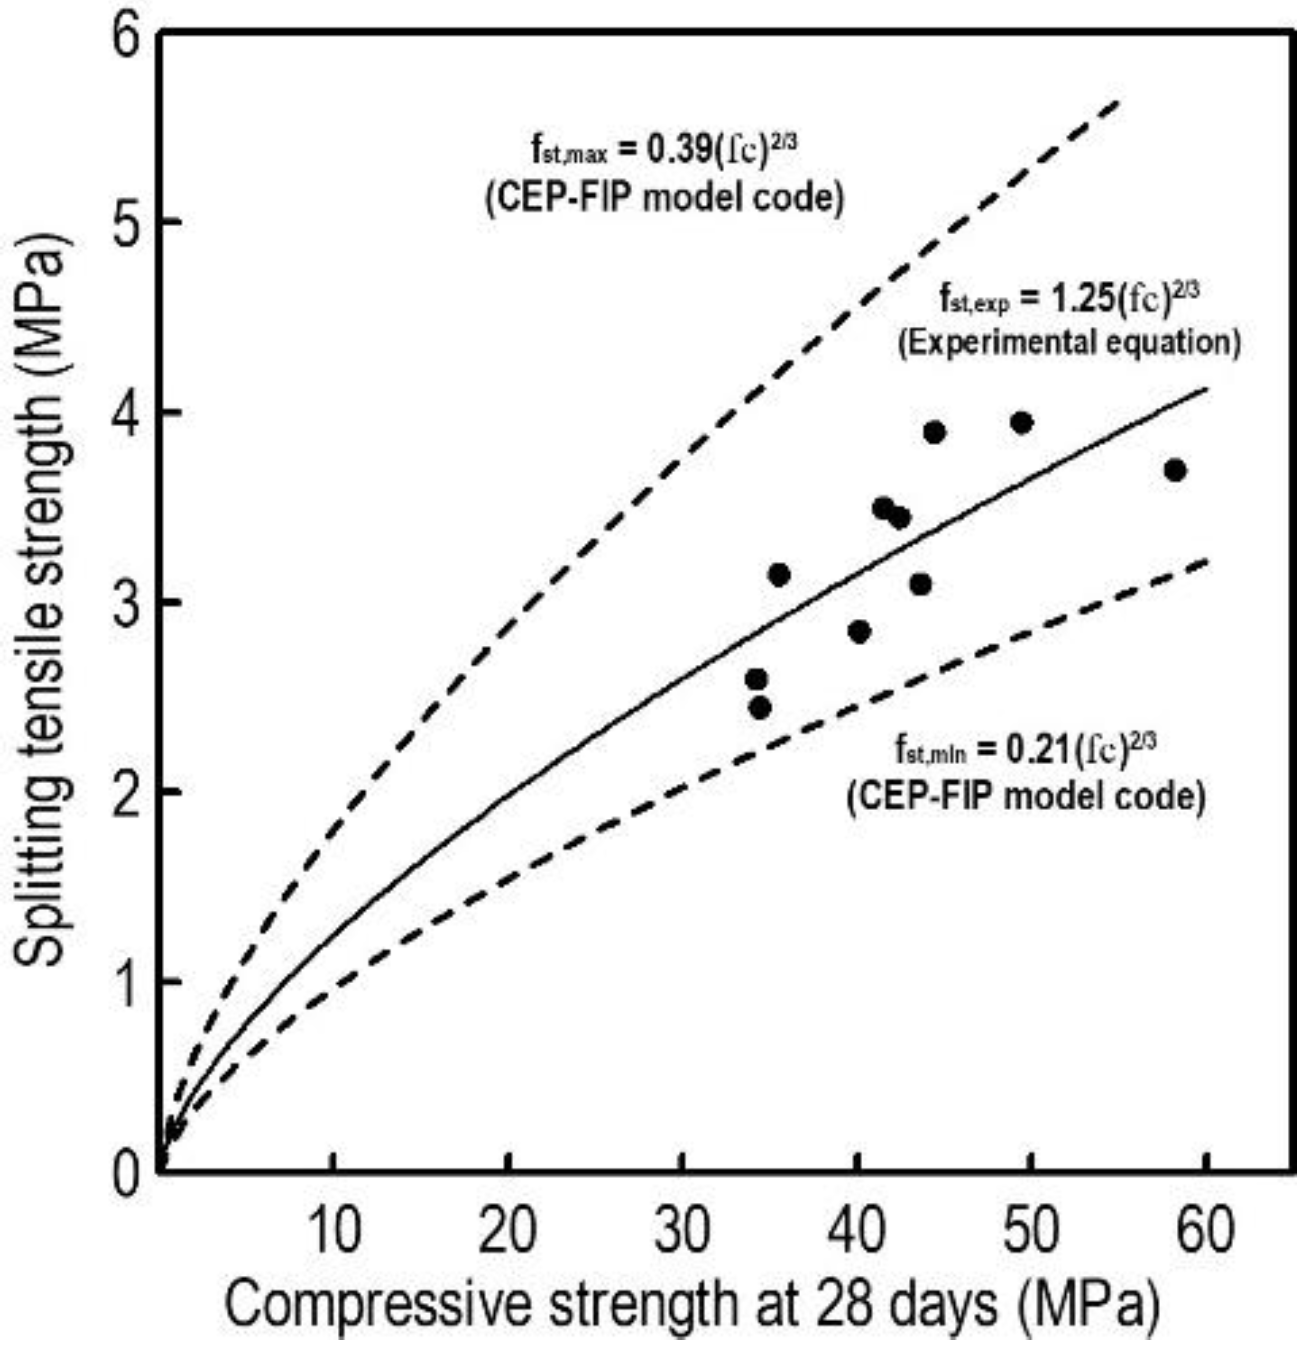
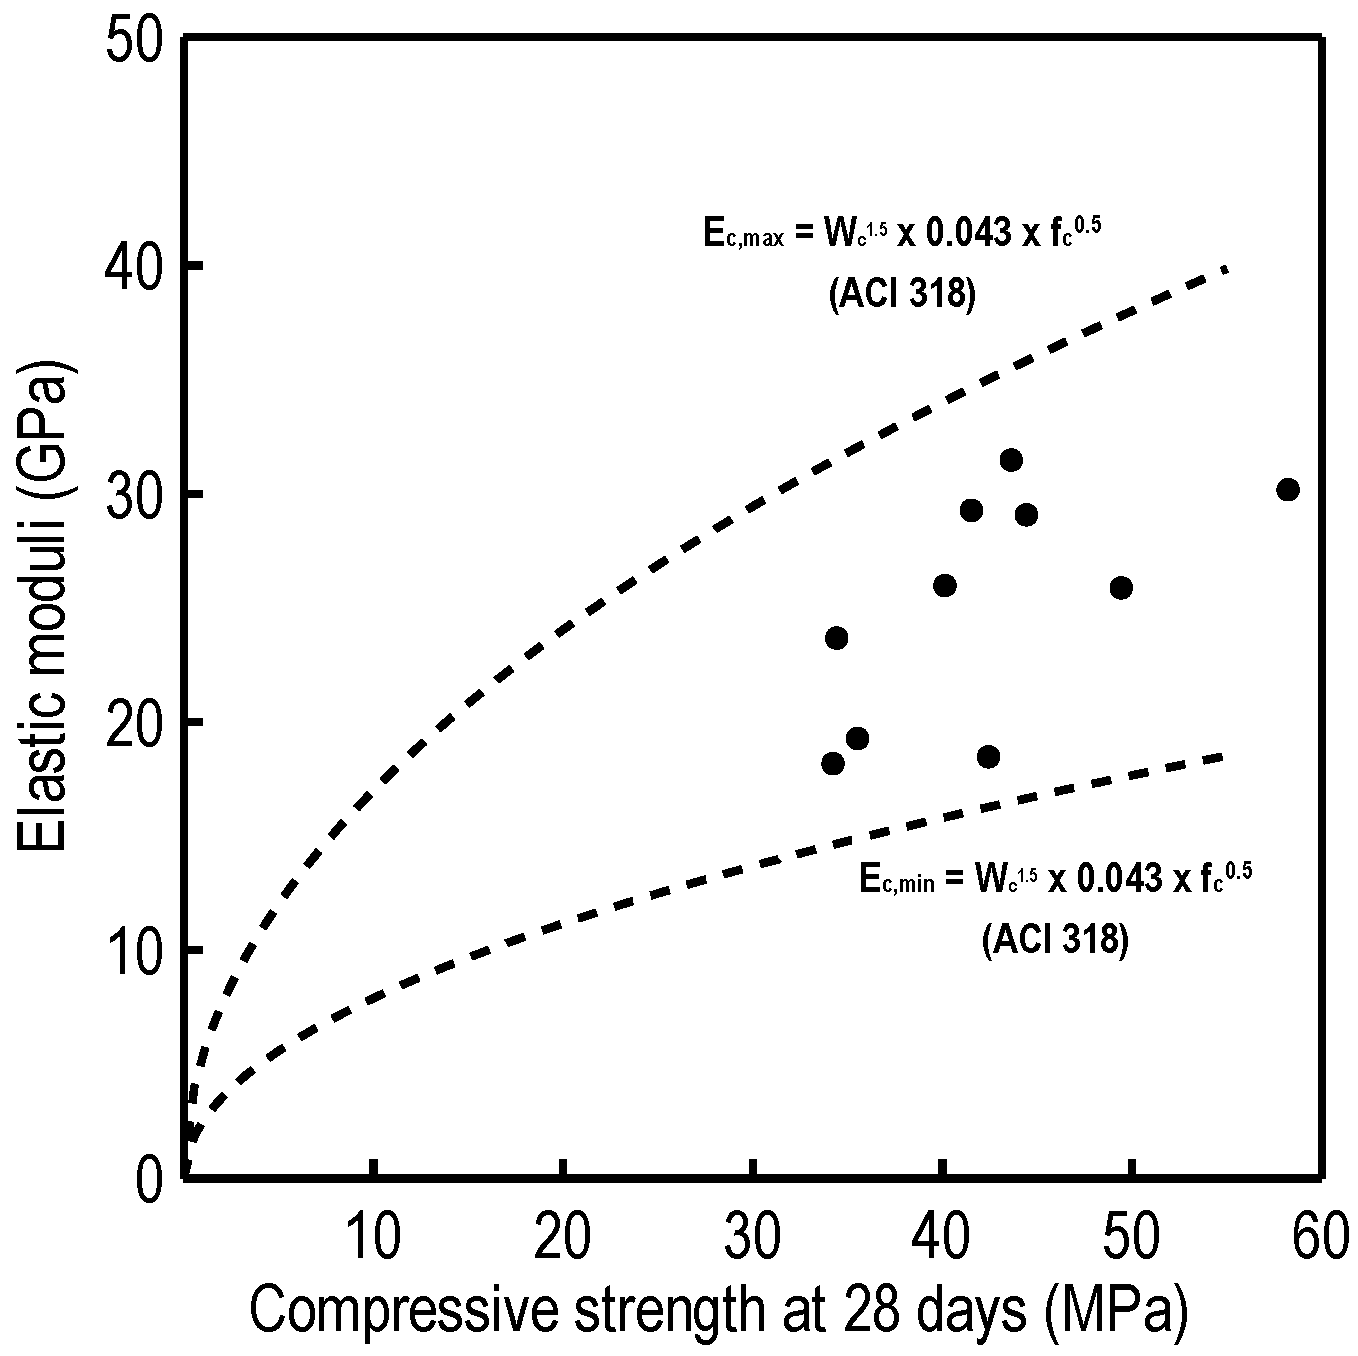
Figure 10 summarizes the compressive strength according to ages. In the case of plain concrete, the compressive strength at 1 day was 13 MPa, and in the case of 80% replacement of cement, the average was 5 MPa. As a result of measuring the compressive strength at 3 and 28 days, as the mixing rate of CC increased, the compressive strength showed a tendency to decrease. Compared to the plain concrete, the compressive strength at 28 days showed a tendency to decrease by up to 25% when CC was replaced by 10%, by up to 39% when CC was replaced by 20%, and by up to 41% when CC was replaced by 30%. In the case of CC, it is thought that it can be used for strength control when a filling effect is required as a non-reactive powder. Figure 11 and Figure 12 summarize the relationship between compressive strength and splitting tensile strength, compressive strength and elastic moduli at 28 days. In Figure 11, the relationship between compressive strength and splitting tensile strength at 28 days satisfies the range of maximum and minimum values of CEP-FIP Model Code [20]. As a result of Figure 12, the relationship between compressive strength and elastic moduli at 28 days satisfies the criteria of ACI 318 [21].
4. Conclusions
(1) The viscosity and yield stress of paste using with GGBF (15, 30, and 45%) and FA (10, 20, and 30%) decreased up to 51 and, 91%, and 49 and, 60%, respectively, in relation to plain. However, the viscosity and yield stress of paste using with CC (10, 20, and 30%) increased up to 23 and, 171% in relation to plain. Those differences are considered to be from the fact that CC has smaller particles than OPC, GGBF and FA. Also, CC has a rhomboidal and irregular shape.
(2) The slump flow of fresh concrete decreased as CC mixing ratio (10, 20, and 30%) increased. This was the same when the FA was 20% and 30%. This is because, in terms of rheology, concrete using CC tends to have a higher yield stress than when using GGBF and FA.
(3) In the scope of this study, the time it takes for fresh concrete to through the V-funnel and the time it takes for the slump flow to reach 500 mm showed a tendency to decrease as the FA substitution ratio increased. However, the separation resistance was satisfactory. In the case of filling capacity, an average of 16% was improved.
(4) The compressive strength at 1 day was measured to be 5 MPa on average when 80% of cement was replaced, except for the plain concrete, and the compressive strength at 28 days decreased by up to 41% at the 30% replacement rate of CC compared to the plain concrete. The relationship between compressive strength and splitting tensile strength or elastic moduli satisfies the CEP-FIP and ACI 318 standards. Therefore, in the case of CC, it is a non-reactive powder, and it is necessary to determine the optimal substitution rate and use it for strength control.
Funding
This research received no external funding.
Institutional Review Board Statement
Not applicable.
Informed Consent Statement
Not applicable.
Data Availability Statement
Not applicable.
Conflicts of Interest
The authors declare no conflict of interest.
References
- Higuchi, T.; Morioka, M.; Yoshioka, I.; Yokozeki, K. Development of a new ecological concrete with CO2 emissions below zero. Constr. Build. Mater. 2014, 67, 338–343. [Google Scholar] [CrossRef]
- Environment, U.N.; Scrivener, K.L.; John, V.M.; Gartner, E.M. Eco-efficient cements: Potential economically viable solutions for a low-CO2 cement-based materials industry. Cem. Concr. Res. 2018, 114, 2–26. [Google Scholar]
- Gartner, E. Industrially interesting approaches to “low-CO2” cements. Cem. Concr. Res. 2004, 34, 1489–1498. [Google Scholar] [CrossRef]
- Filippo, J.D.; Karpman, J.; Deshazo, J.R. The impacts of policies to reduce CO2 emissions within the concrete supply chain. Cem. Concr. Compos. 2019, 101, 67–82. [Google Scholar] [CrossRef]
- He, Z.; Zhu, X.; Wang, J.; Mu, M.; Wang, Y. Comparison of CO2 emissions from OPC and recycled cement production. Constr. Build. Mater. 2019, 211, 965–973. [Google Scholar] [CrossRef]
- Xie, T.; Mohamad Ali, M.S.; Elchalakani, M.; Visintin, P. Modelling fresh and hardened properties of self-compacting concrete containing supplementary cementitious materials using reactive moduli. Constr. Build. Mater. 2021, 272, 121954. [Google Scholar] [CrossRef]
- Pang, L.; Liu, Z.; Wang, D.; An, M. Review on the Application of Supplementary Cementitious Materials in Self-Compacting Concrete. Crystals 2022, 12, 180. [Google Scholar] [CrossRef]
- Gartner, E.; Hirao, H. A review of alternative approaches to the reduction of CO2 emissions associated with the manufacture of the binder phase in concrete. Cem. Concr. Res. 2015, 78, 126–142. [Google Scholar] [CrossRef] [Green Version]
- Kim, Y.J. Quality properties of self-consolidating concrete mixed with waste concrete powder. Constr. Build. Mater. 2017, 135, 177–185. [Google Scholar] [CrossRef]
- Choi, Y.W.; Kim, Y.J.; Shin, H.C.; Moon, H.Y. An experimental research on the fluidity and mechanical properties of high-strength lightweight self-compacting concrete. Cem. Concr. Res. 2006, 36, 1595–1602. [Google Scholar] [CrossRef]
- ASTM C39/39M; Standard Test Method for Compressive Strength of Cylindrical Concrete Specimens. ASTM International: West Conshohocken, PA, USA, 2005.
- ASTM C496/496M; Standard Test Method for Splitting Tensile Strength of Cylindrical Concrete Specimens. ASTM International: West Conshohocken, PA, USA, 2004.
- ASTM C494/494M; Standard Specification for Chemical Admixtures for Concrete. ASTM International: West Conshohocken, PA, USA, 2005.
- Kim, Y.J.; Choi, Y.W. Utilization of waste concrete powder as a substitution material for cement. Constr. Build. Mater. 2012, 30, 500–504. [Google Scholar] [CrossRef]
- Choi, Y.W.; Kim, Y.J.; Choi, O.; Lee, K.M.; Lachemi, M. Utilization of tailings from tungsten mine waste as a substitution material for cement. Constr. Build. Mater. 2009, 23, 2481–2486. [Google Scholar] [CrossRef]
- Shaikh, F.U.A.; Supit, S.W.M. Mechanical and durability properties of high volume fly ash (HVFA) concrete containing calcium carbonate (CaCO3) nanoparticles. Constr. Build. Mater. 2014, 70, 309–321. [Google Scholar] [CrossRef]
- Hui, Z.; Wei, S.; Xiaoming, W.; Bo, G. The properties of the self-compacting concrete with fly ash and ground granulated blast furnace slag mineral admixtures. J. Clean. Prod. 2015, 95, 66–74. [Google Scholar]
- Li, Y.; Lin, H.; Wang, Z. Quantitative analysis of fly ash in hardened cement paste. Constr. Build. Mater. 2017, 153, 139–145. [Google Scholar] [CrossRef]
- Pusit, L.; Gritsada, S.I.; Natt, M. Effects of calcium carbonate powder on the fresh and hardened properties of self-consolidating concrete incorporating untreated rice husk ash. J. Clean. Prod. 2018, 172, 3265–3278. [Google Scholar]
- CEB-FIP. FIP Model Code for Concrete Structures 2010; Wilhelm Ernst & Sohn: Berlin, Germany, 2013; pp. 77–78. [Google Scholar]
- Mehta, P.K.; Monteiro, P.J. Concrete: Microstructure, Properties, and Materials, 4th ed.; McGraw-Hill Education: New York, NY, USA, 2013; pp. 84–85. [Google Scholar]
Figure 1.
Self-compacting concrete properties evaluation equipment.

Figure 2.
Particle size distribution of CC.

Figure 3.
SEM image of CC.

Figure 4.
X-ray diffraction analysis of CC.

Figure 5.
Shear rate and shear stress of paste.

Figure 6.
Results of air content.

Figure 7.
Results of slump flow.

Figure 8.
Time it takes to through the V-funnel and the time it takes for the slump flow to reach 500 mm.
Figure 8.
Time it takes to through the V-funnel and the time it takes for the slump flow to reach 500 mm.

Figure 9.
U-box test.

Figure 10.
Compressive strength.

Figure 11.
Compressive and splitting tensile strength.

Figure 12.
Compressive strength and elastic moduli.


Table 1.
Cementitious properties.
| Types | OPC 1 | GGBF 2 | FA 3 | CC 4 |
|---|---|---|---|---|
| Chemical analysis (wt.%) | ||||
| SiO2 | 21.60 | 33.33 | 58.20 | 0.67 |
| Al2O3 | 6.00 | 15.34 | 26.28 | 0.39 |
| Fe2O3 | 3.10 | 0.44 | 7.43 | 0.51 |
| CaO | 61.40 | 42.12 | 6.51 | 95.69 |
| MgO | 3.40 | 5.70 | 1.10 | 1.76 |
| SO3 | 2.50 | 2.08 | 0.30 | 0.17 |
| Physical properties | ||||
| Density (g/cm3) | 3.15 | 2.90 | 2.18 | 2.51 |
| Blaine Fineness (cm2/g) | 3539 | 4160 | 3550 | 12,239 |
1 Ordinary Portland Cement; 2 Ground Granulated Blast-Furnace slag; 3 Fly ash; 4 Calcium Carbonate.
Table 2.
Mixture proportions of paste.
| Types | W/B 1 | Substitution Ratio (%) |
|---|---|---|
| OPC | 50 | |
| GGBF | 50 | 15, 30 and 45 |
| FA | 50 | 10, 20 and 30 |
| CC | 50 | 10, 20 and 30 |
1 Binder (cementitious).
Table 3.
Mixture proportions.
| No. | Note | Replacement Ratio (%) | W/B | Unit Mass (kg/m3) | SP (×B, %) | AE (×B, %) | ||||||||
|---|---|---|---|---|---|---|---|---|---|---|---|---|---|---|
| GGBF | FA | CC | W | OPC | GGBF | FA | CC | Sand | G | |||||
| 1 | Plain | 0 | 0 | 0 | 0.32 | 155 | 484 | 0 | 0 | 0 | 820 | 860 | 1.6 | 0.005 |
| 2 | G60F10C10 | 60 | 10 | 10 | 0.32 | 155 | 97 | 291 | 48 | 48 | 796 | 835 | 1.2 | |
| 3 | G50F10C20 | 50 | 10 | 20 | 0.32 | 155 | 97 | 242 | 48 | 97 | 793 | 832 | 1.2 | |
| 4 | G40F10C30 | 40 | 10 | 30 | 0.32 | 155 | 97 | 194 | 48 | 145 | 789 | 828 | 1.4 | |
| 5 | G50F20C10 | 50 | 20 | 10 | 0.32 | 155 | 97 | 242 | 97 | 78 | 789 | 828 | 1.4 | |
| 6 | G40F20C20 | 40 | 20 | 20 | 0.32 | 155 | 97 | 194 | 97 | 94 | 786 | 824 | 1.5 | |
| 7 | G30F20C30 | 30 | 20 | 30 | 0.32 | 155 | 97 | 145 | 97 | 145 | 782 | 821 | 1.6 | |
| 8 | G40F30C10 | 40 | 30 | 10 | 0.32 | 155 | 97 | 194 | 145 | 48 | 782 | 820 | 1.5 | |
| 9 | G30F30C20 | 30 | 30 | 20 | 0.32 | 155 | 97 | 145 | 145 | 97 | 779 | 817 | 1.5 | |
| 10 | G20F30C30 | 20 | 30 | 30 | 0.32 | 155 | 97 | 97 | 145 | 145 | 775 | 813 | 1.7 | |
Table 4.
Criteria of self-compacting concrete.
| Items | Target Range | |
|---|---|---|
| Construction condition | Minimum gap between reinforcement (mm) Amount of reinforcement (kg/m3) | 60–200 100–350 |
| Flowability Segregation resistance ability U-box test (mm) | Slump flow (mm) Time it takes to go through the V-funnel (s) Time it takes for the slump flow to reach 500 mm (s) | 600–700 7–13 3–15 ≥300 |
Publisher’s Note: MDPI stays neutral with regard to jurisdictional claims in published maps and institutional affiliations. |
© 2022 by the author. Licensee MDPI, Basel, Switzerland. This article is an open access article distributed under the terms and conditions of the Creative Commons Attribution (CC BY) license (https://creativecommons.org/licenses/by/4.0/).
Share and Cite
MDPI and ACS Style
Kim, Y.J. Properties of Self-Compacting Concrete Using Multi-Component Blend Binders for CO2 Reduction. Crystals 2022, 12, 864. https://0-doi-org.brum.beds.ac.uk/10.3390/cryst12060864
AMA Style
Kim YJ. Properties of Self-Compacting Concrete Using Multi-Component Blend Binders for CO2 Reduction. Crystals. 2022; 12(6):864. https://0-doi-org.brum.beds.ac.uk/10.3390/cryst12060864
Chicago/Turabian StyleKim, Yong Jic. 2022. "Properties of Self-Compacting Concrete Using Multi-Component Blend Binders for CO2 Reduction" Crystals 12, no. 6: 864. https://0-doi-org.brum.beds.ac.uk/10.3390/cryst12060864
Note that from the first issue of 2016, this journal uses article numbers instead of page numbers. See further details here.