Article

Effects of Physical and Chemical Pressure on Charge Density Wave Transitions in LaAg1−xAuxSb2 Single Crystals

1
Ames National Laboratory, Department of Physics and Astronomy, Iowa State University, Ames, IA 50011, USA
2
Physics Department and Centre for the Physics of Materials, McGill University, 3600 University Street, Montreal, QC H3A 2T8, Canada
*
Author to whom correspondence should be addressed.
Current address: National High Magnetic Field Laboratory, Florida State University, Tallahassee, FL 32310, USA.
Submission received: 1 November 2022 / Revised: 20 November 2022 / Accepted: 21 November 2022 / Published: 23 November 2022
(This article belongs to the Special Issue Pressure-Induced Phase Transformations (Volume II))

Abstract

:
The structural characterization and electrical transport measurements at ambient and applied pressures of the compounds of the LaAg 1 x Au x Sb 2 family are presented. Up to two charge density wave (CDW) transitions could be detected upon cooling from room temperature and an equivalence of the effects of chemical and physical pressure on the CDW ordering temperatures was observed with the unit cell volume being a salient structural parameter. As such LaAg 1 x Au x Sb 2 is a rare example of a non-cubic system that exhibits good agreement between the effects of applied, physical, pressure and changes in unit cell volume from steric changes induced by isovalent substitution. Additionally, for LaAg 0.54 Au 0.46 Sb 2 anomalies in low temperature electrical transport were observed in the pressure range where the lower charge density wave is completely suppressed.

1. Introduction

Physical (hydrostatic) pressure and chemical substitution are two common ways to tune the physical properties of materials. Whereas hydrostatic pressure is considered to be a clean parameter that does not introduce additional disorder, as well as changes in band filling in many cases, the experimental techniques available under pressure are more limited. Chemical substitution necessarily involves some additional disorder. In the case of aliovalent substitutions the corresponding electron- or hole- doping effects are often dominant. For isovalent substitution the primary effect is thought to be steric and the comparison with physical pressure can be more relevant. Whereas such isovalent substitutions can be referred to as “chemical pressure” differences in how pressure and substitution affect a compound, especially a non-cubic one, can be greater than similarities in some cases. It is of particular importance when there is a desire to stabilize a particular high pressure phase/state (like high temperature superconductivity [1]) using chemical and/or physical pressure. Additionally, observation of an apparent equivalence [2,3,4] or non-equivalence [5] of chemical and physical pressure can help in understanding of structure—property relations and in recognizing relevant structural motifs.
The members of the family of compounds chosen for this study, LaAg 1 x Au x Sb 2 , demonstrate charge density wave (CDW) transitions, or spontaneous superstructures formed by electrons [6]. Decades ago Peierls showed the instability of a (one-dimensional) metal interacting with the lattice towards a lattice distortion and the opening of a gap in the electronic spectrum [7]. This concept is often applied to CDW formation in low-dimensional materials, although alternatives are widely discussed [8,9,10]. Studies of CDW phenomena in solids and competition of CDW with other collective phenomena remain one of the active subfields of quantum materials research.
In this work, we study effects of pressure on single crystals of selected members of the LaAg 1 x Au x Sb 2 family which are then compared to those of chemical pressure implemented via Ag ↔ Au substitution. The end-compounds, LaAgSb 2 and LaAuSb 2 were first synthesized almost three decades ago [11,12] and were reported to crystallize in the same tetragonal ZrCuSi 2 -type structure ( P 4 / n m m , No. 129). CDW transitions were observed in electrical transport at ∼210 K and ∼100 K for LaAgSb 2 and LaAuSb 2 , respectively, refs. [13,14]. Synchrotron X-ray scattering study [15] and further thermodynamic measurements [16] identified second, lower temperature, CDW transition at 185 K in LaAgSb 2 . Similarly, in addition to T C D W 1 110 K, a second CDW transition at T C D W 2 90 K was detected by electrical transport measurements in near stoichiometric LaAuSb 2 [17]. The synthesis and evolution of the higher temperature, T C D W 1 in the LaAg 1 x Au x Sb 2 series was reported in Ref. [18] but without any measurements of T C D W 2 or companion applied pressure studies.
For LaAgSb 2 , pressure reportedly suppressed T C D W 1 [19,20,21,22,23] as well as T C D W 2 [21,23] with the results being consistent in majority of publications [19,20,21]. Qualitatively similar behavior under pressure was also observed for LaAuSb 2 [17,24,25]. Additionally, in LaAgSb 2 and LaAuSb 2 , low temperature superconductivity was discovered and studied under pressure [23,24]. It has to be noted that the exact Au stoichiometry in LaAu x Sb 2 depends on details of the synthesis and affects both the ambient pressure values of T C D W 1 and T C D W 2 and their pressure derivatives [17].
Earlier comparison of the effects of pressure and chemical substitution in this family of materials [19] was based on a study of the La 1 x R x AgSb 2 series (R = Y, Ce, Nd, Gd) and a significant contribution of disorder prevailing in the case of substitution was found, thus resulting in a significant difference between physical and chemical pressure. In this work, we address the same question in the different, transition metal site, substitution series.

2. Materials and Methods

Single crystals of LaAg 1 x Au x Sb 2 were grown from an antimony-rich self-flux following the method described in Refs. [13,17,26]. Pure elements were loaded into an alumina Canfield crucible set [27] which was placed into an amorphous silica tube and sealed in partial atmosphere of argon. The sealed tubes were heated to 1050 C over 10 h, held for 8 h, then cooled to 800 C over a period of 10 h prior to starting the crystal growth. Crystal growth occurred during the 100 h cooling from 800 C to 670 C, after which the excess flux was decanted with the aid of a centrifuge.
In this work, crystals of LaAg 1 x Au x Sb 2 with nominal compositions x = 0 , 0.25 , 0.5 , 0.75 were grown with the initial La:T:Sb (T = Ag 1 x Au x ) growth compositions: 1:2:20 (T2). To investigate whether reported Au deficiency [14,17,18] is relevant and can be tuned for the intermediate Au concentrations in LaAg 1 x Au x Sb 2 , for x = 0.25 , 0.75 the growth composition of 1:6:20 (T6) was used as well. For the end compound, LaAu x Sb 2 , the data from the recent Ref. [17] are used when appropriate.
Cu-K α X-ray diffraction patterns were taken using a Rigaku Miniflex-II diffractometer. The crystals were ground and the powder was mounted on a low-background single-crystal silicon plate using a trace amount of Dow Corning silicone vacuum grease. The mount was spun during data collection to reduce possible effects of texture. Data taken for Rietveld refinement were collected in two overlapping blocks: 10 2 θ 48 and 38 2 θ 100 , with the second block counted for 4–5 times longer than the first to compensate for the loss of scattered intensity at higher angles due to the X-ray form factors. The two data blocks for each sample were co-refined within GSAS [28,29] using a single set of structural and instrumental parameters but with independent scale factors to allow for the different counting times used. Parameters for both the primary phase and any impurity were refined. We found that the materials were easy to grind into a random powder and no texture or preferential orientation effects were observed in the residuals. The diffractometer and analysis procedures were checked using Al 2 O 3 (SRM 676a [30]); our fitted values of a = 4.7586(2) Å and c = 12.9903(7) Å were both 1.6(4) × 10 4 Å smaller than the values on the certificate [30], suggesting a small but statistically significant mis-calibration of the instrument. The fitted lattice parameters given in the analysis that follows do not include this correction.
Chemical analysis of the crystals was performed using an Oxford Instruments energy-dispersive X-ray spectroscopy (EDS) system on a Thermo Scientific Teneo scanning electron microscope. The measurements were performed on polished a b surfaces of single crystals with four to eight points taken for every sample.
Standard, linear 4-probe ac resistivity was measured on bar—shaped samples of LaAg 1 x Au x Sb 2 in two arrangements: I | | a b and, when needed, I | | c . The size of the samples was 1.5–2 mm length, 0.2–0.4 mm width and about 0.1 mm thickness. The frequency used was 17 Hz, typical current values were 3 mA for in-plane electrical transport and 5 mA for the c-axis measurements. The contact resistances between the leads and the samples were below 1 Ω. Based on our experience with the LaAu x Sb 2 samples with similar size and contact resistance [17], we do not expect heating effects to be observed either at ambient pressure or in the pressure cell environment. The measurements were performed using the ACT option of a Quantum Design Physical Property Measurement System (PPMS).
For selected samples, resistivity measurements under pressure were performed in a hybrid, BeCu/NiCrAl piston-cylinder pressure cell (modified version of the one used in Ref. [31]) in the temperature environment provided by a PPMS instrument. A 40:60 mixture of light mineral oil and n-pentane was used as a pressure-transmitting medium. This medium solidifies at room temperature in the pressure range of 30–40 kbar, [4,31,32] which is above the maximum pressure in this work. Elemental Pb was used as a low temperature pressure gauge [33]. It has been shown that in piston-cylinder pressure cells the value of pressure depends on temperature (see Ref. [34] for mineral oil:n-pentane pressure medium and this particular design of the cell). Below we use the Pb gauge pressure value. Given that the upper transition for LaAgSb 2 , highest in the series, is at ambient pressure at ∼200 K, this may give rise to pressure differences with the values determined by Pb gauge by at most 2 kbar.

3. Results

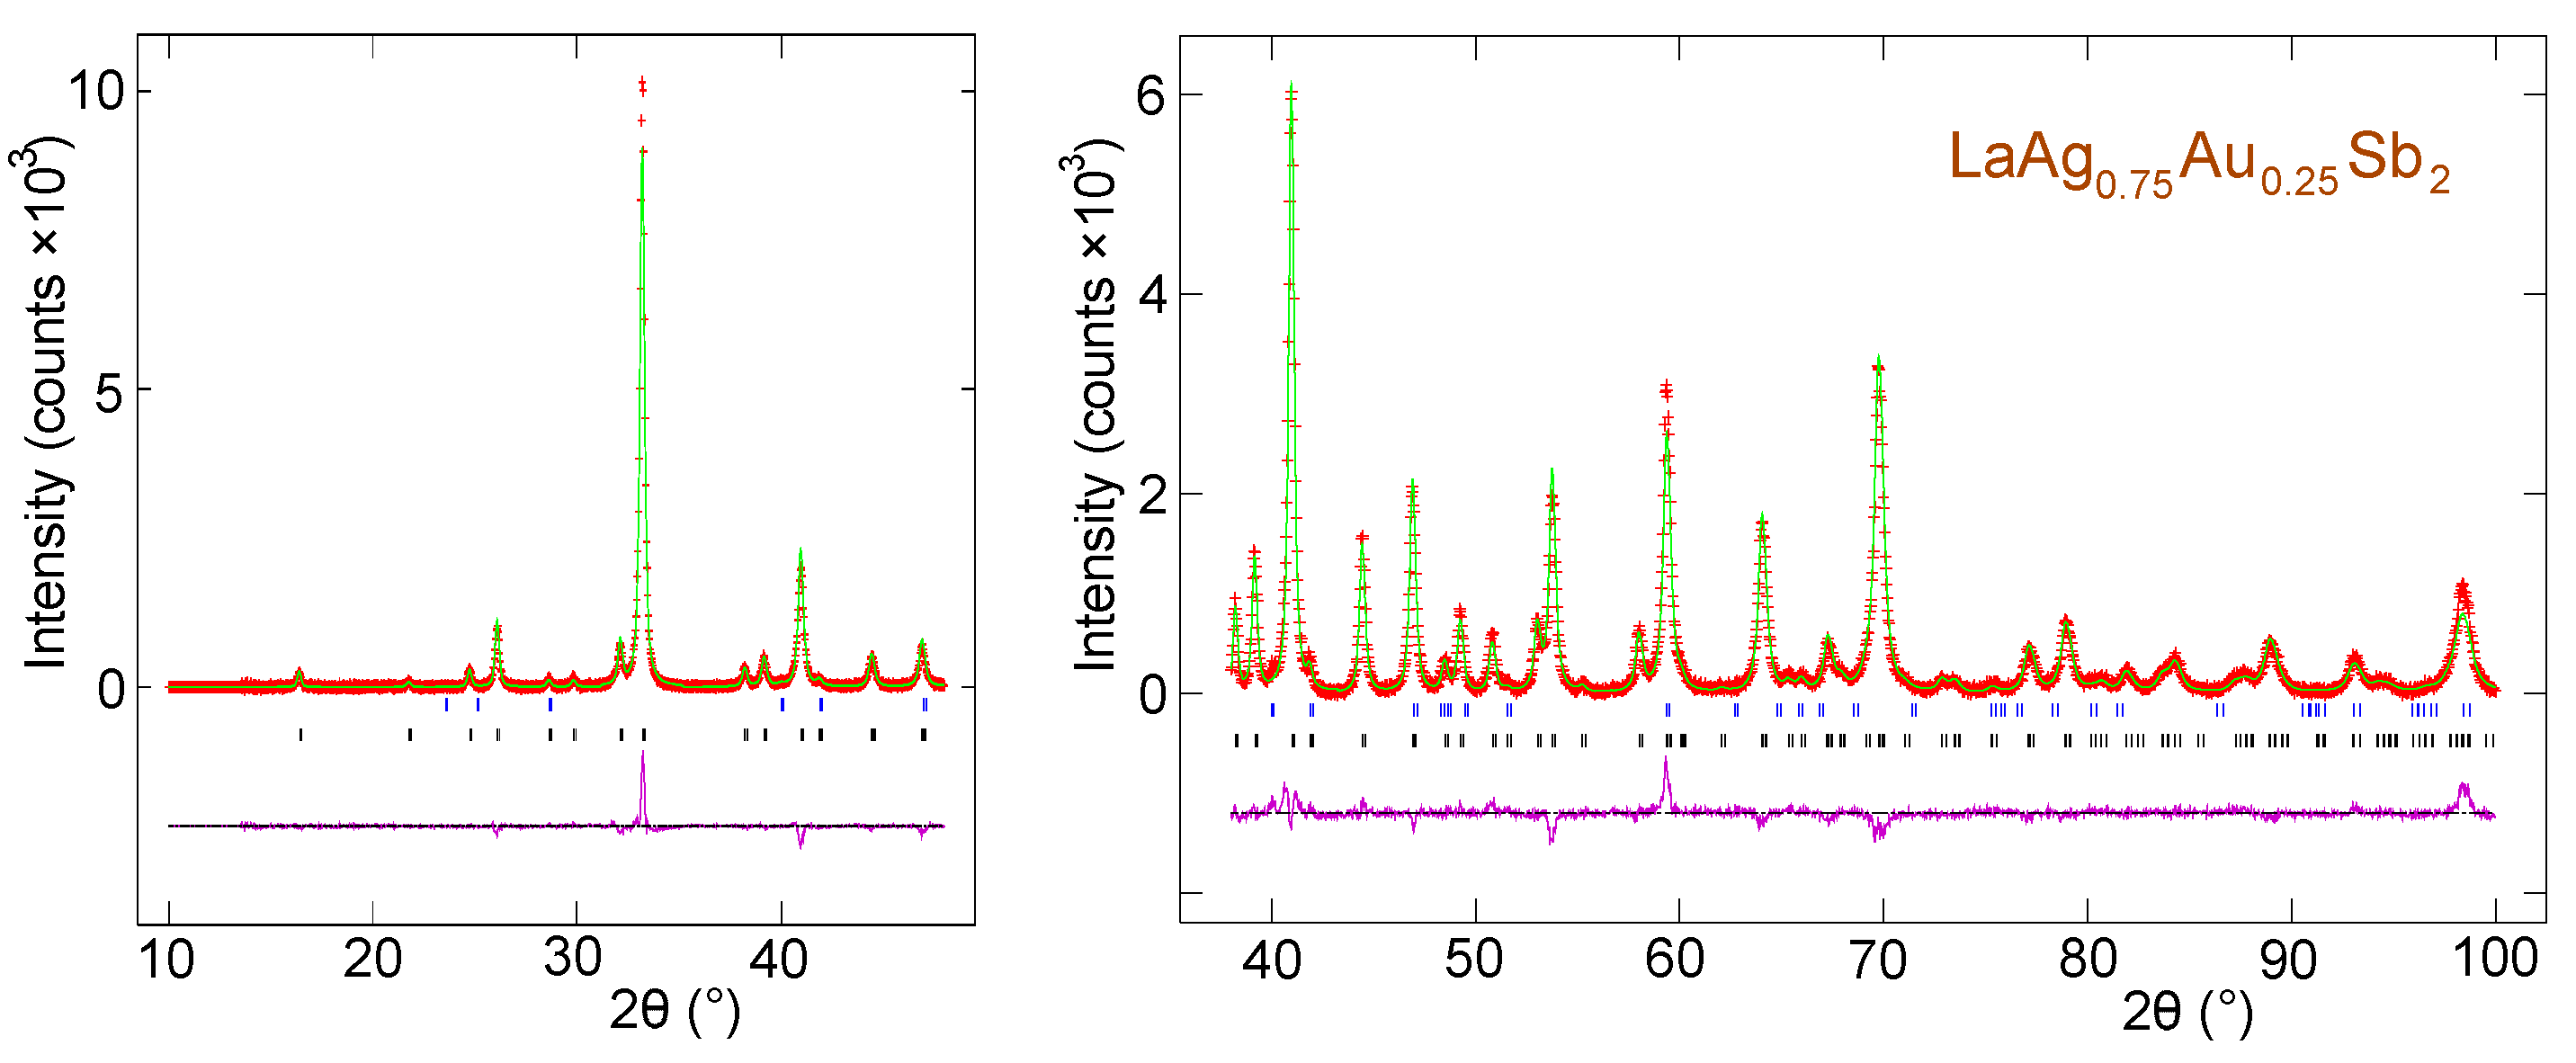
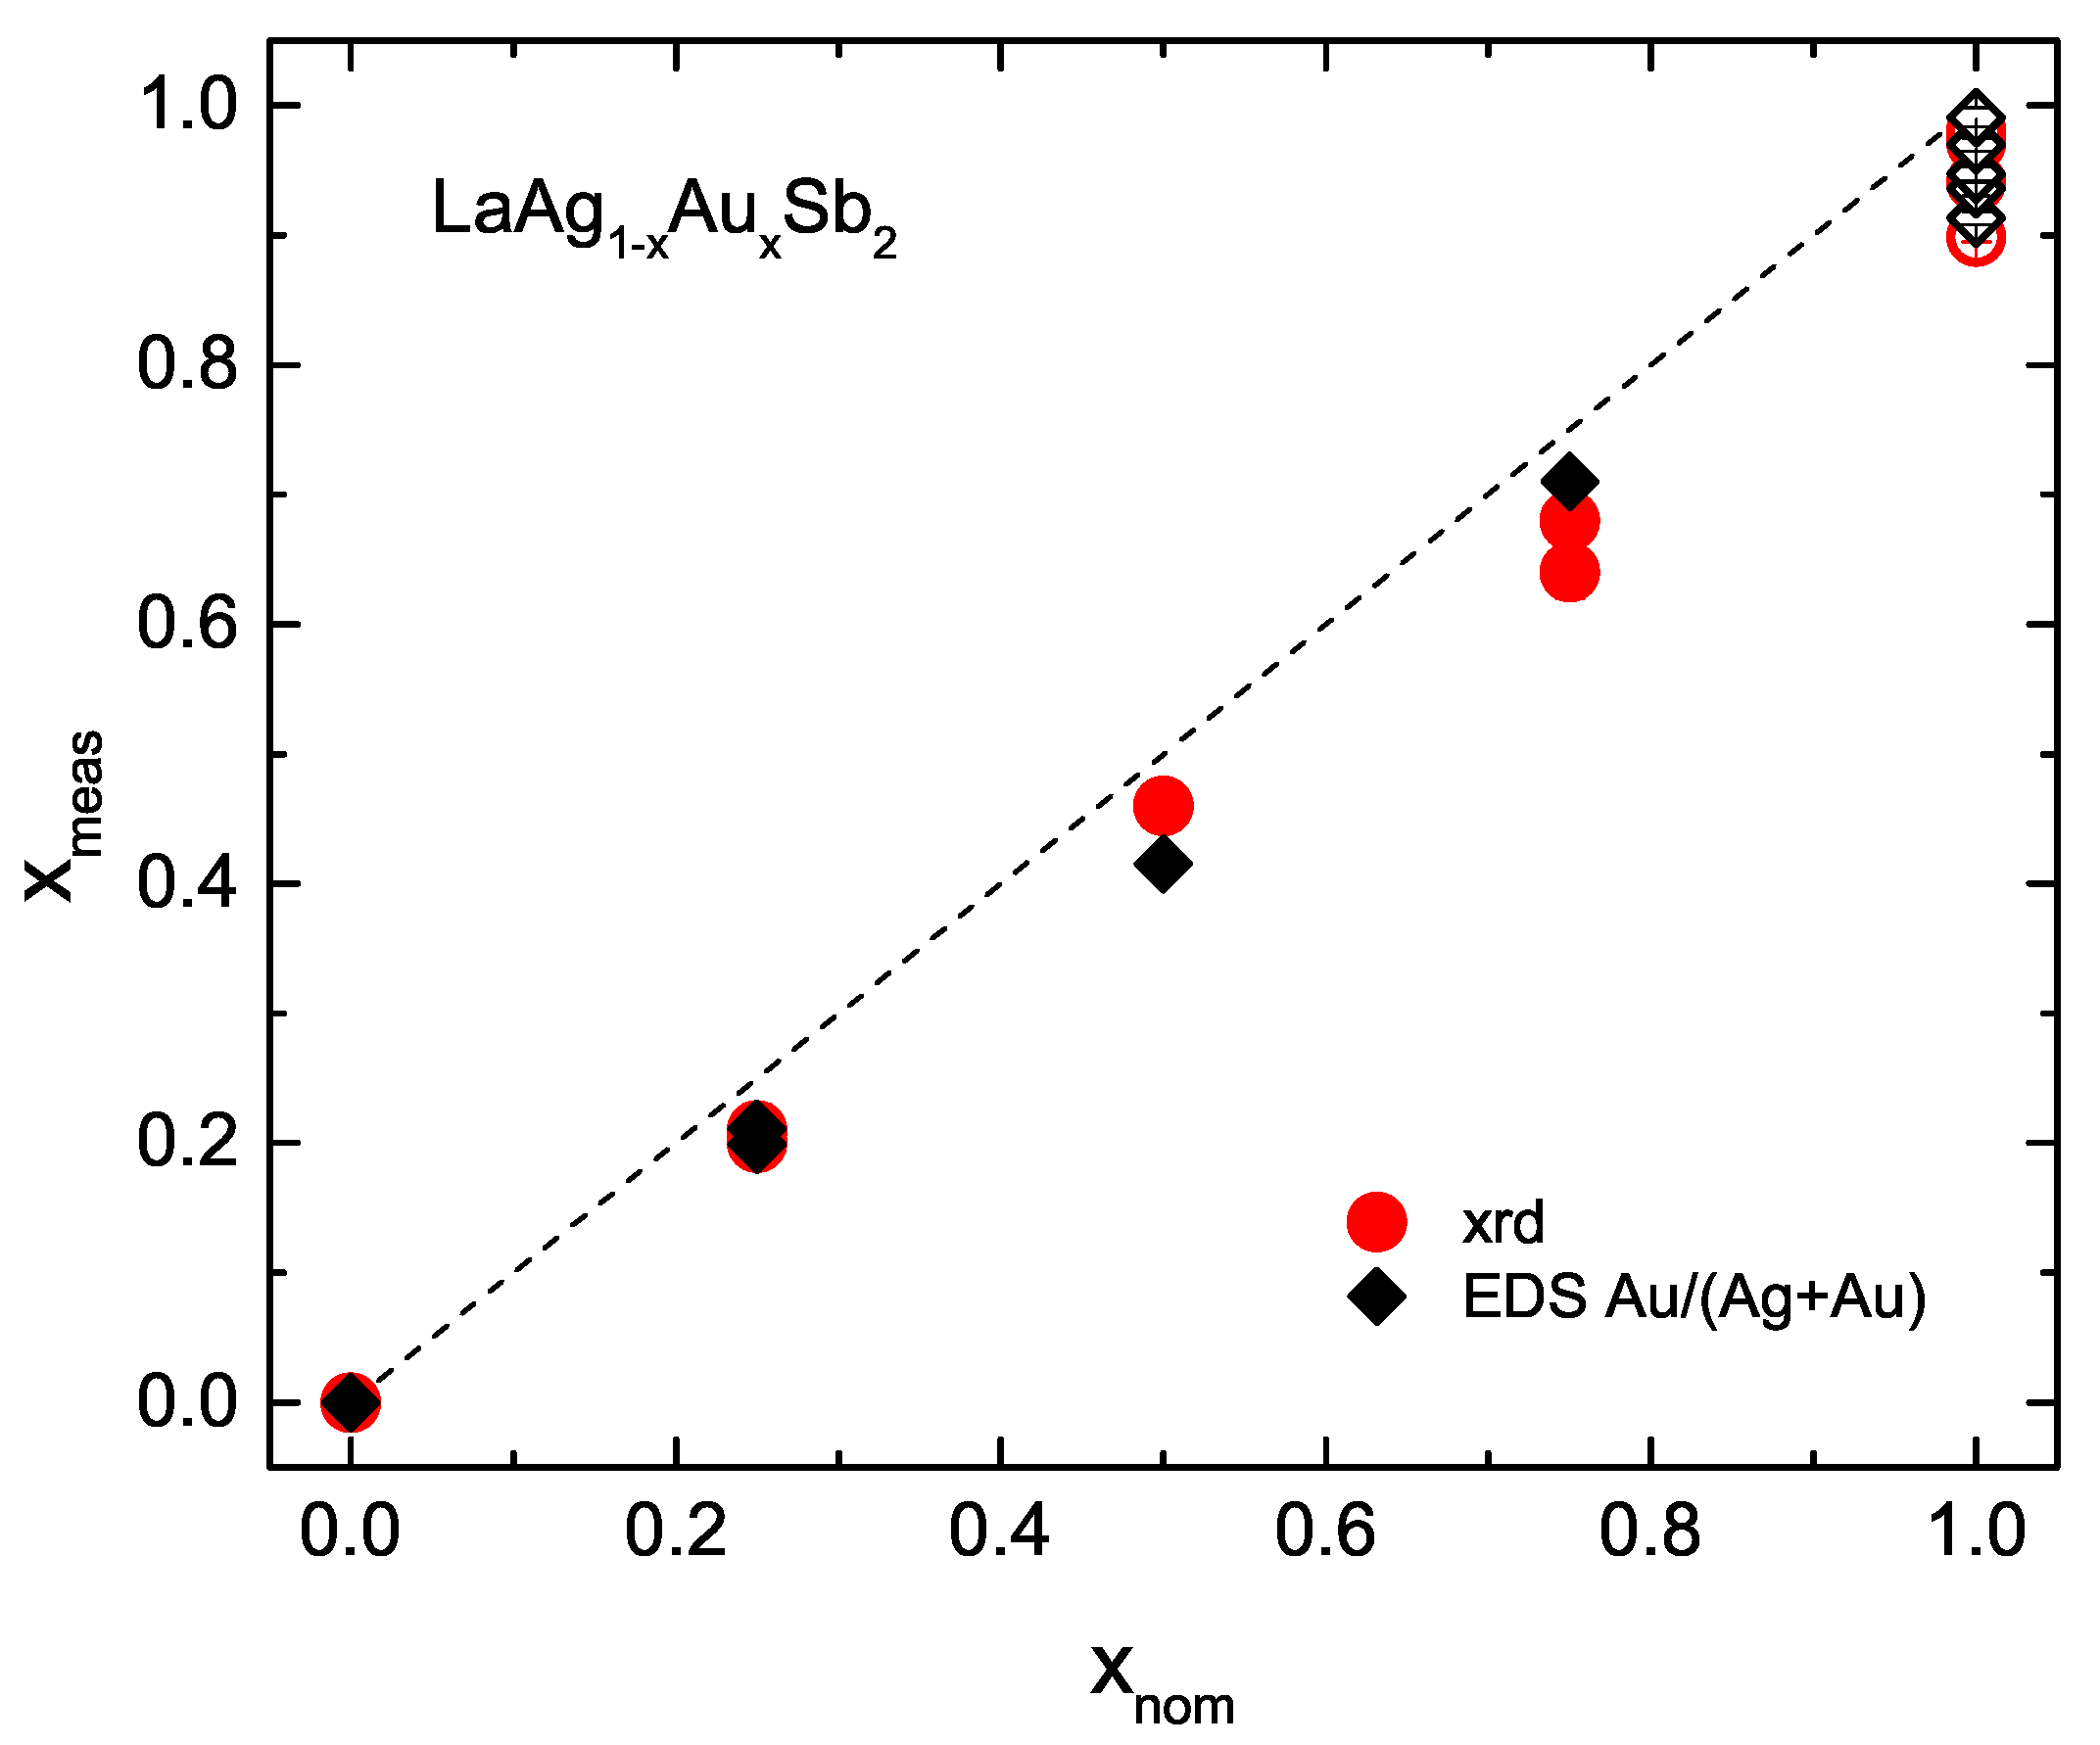
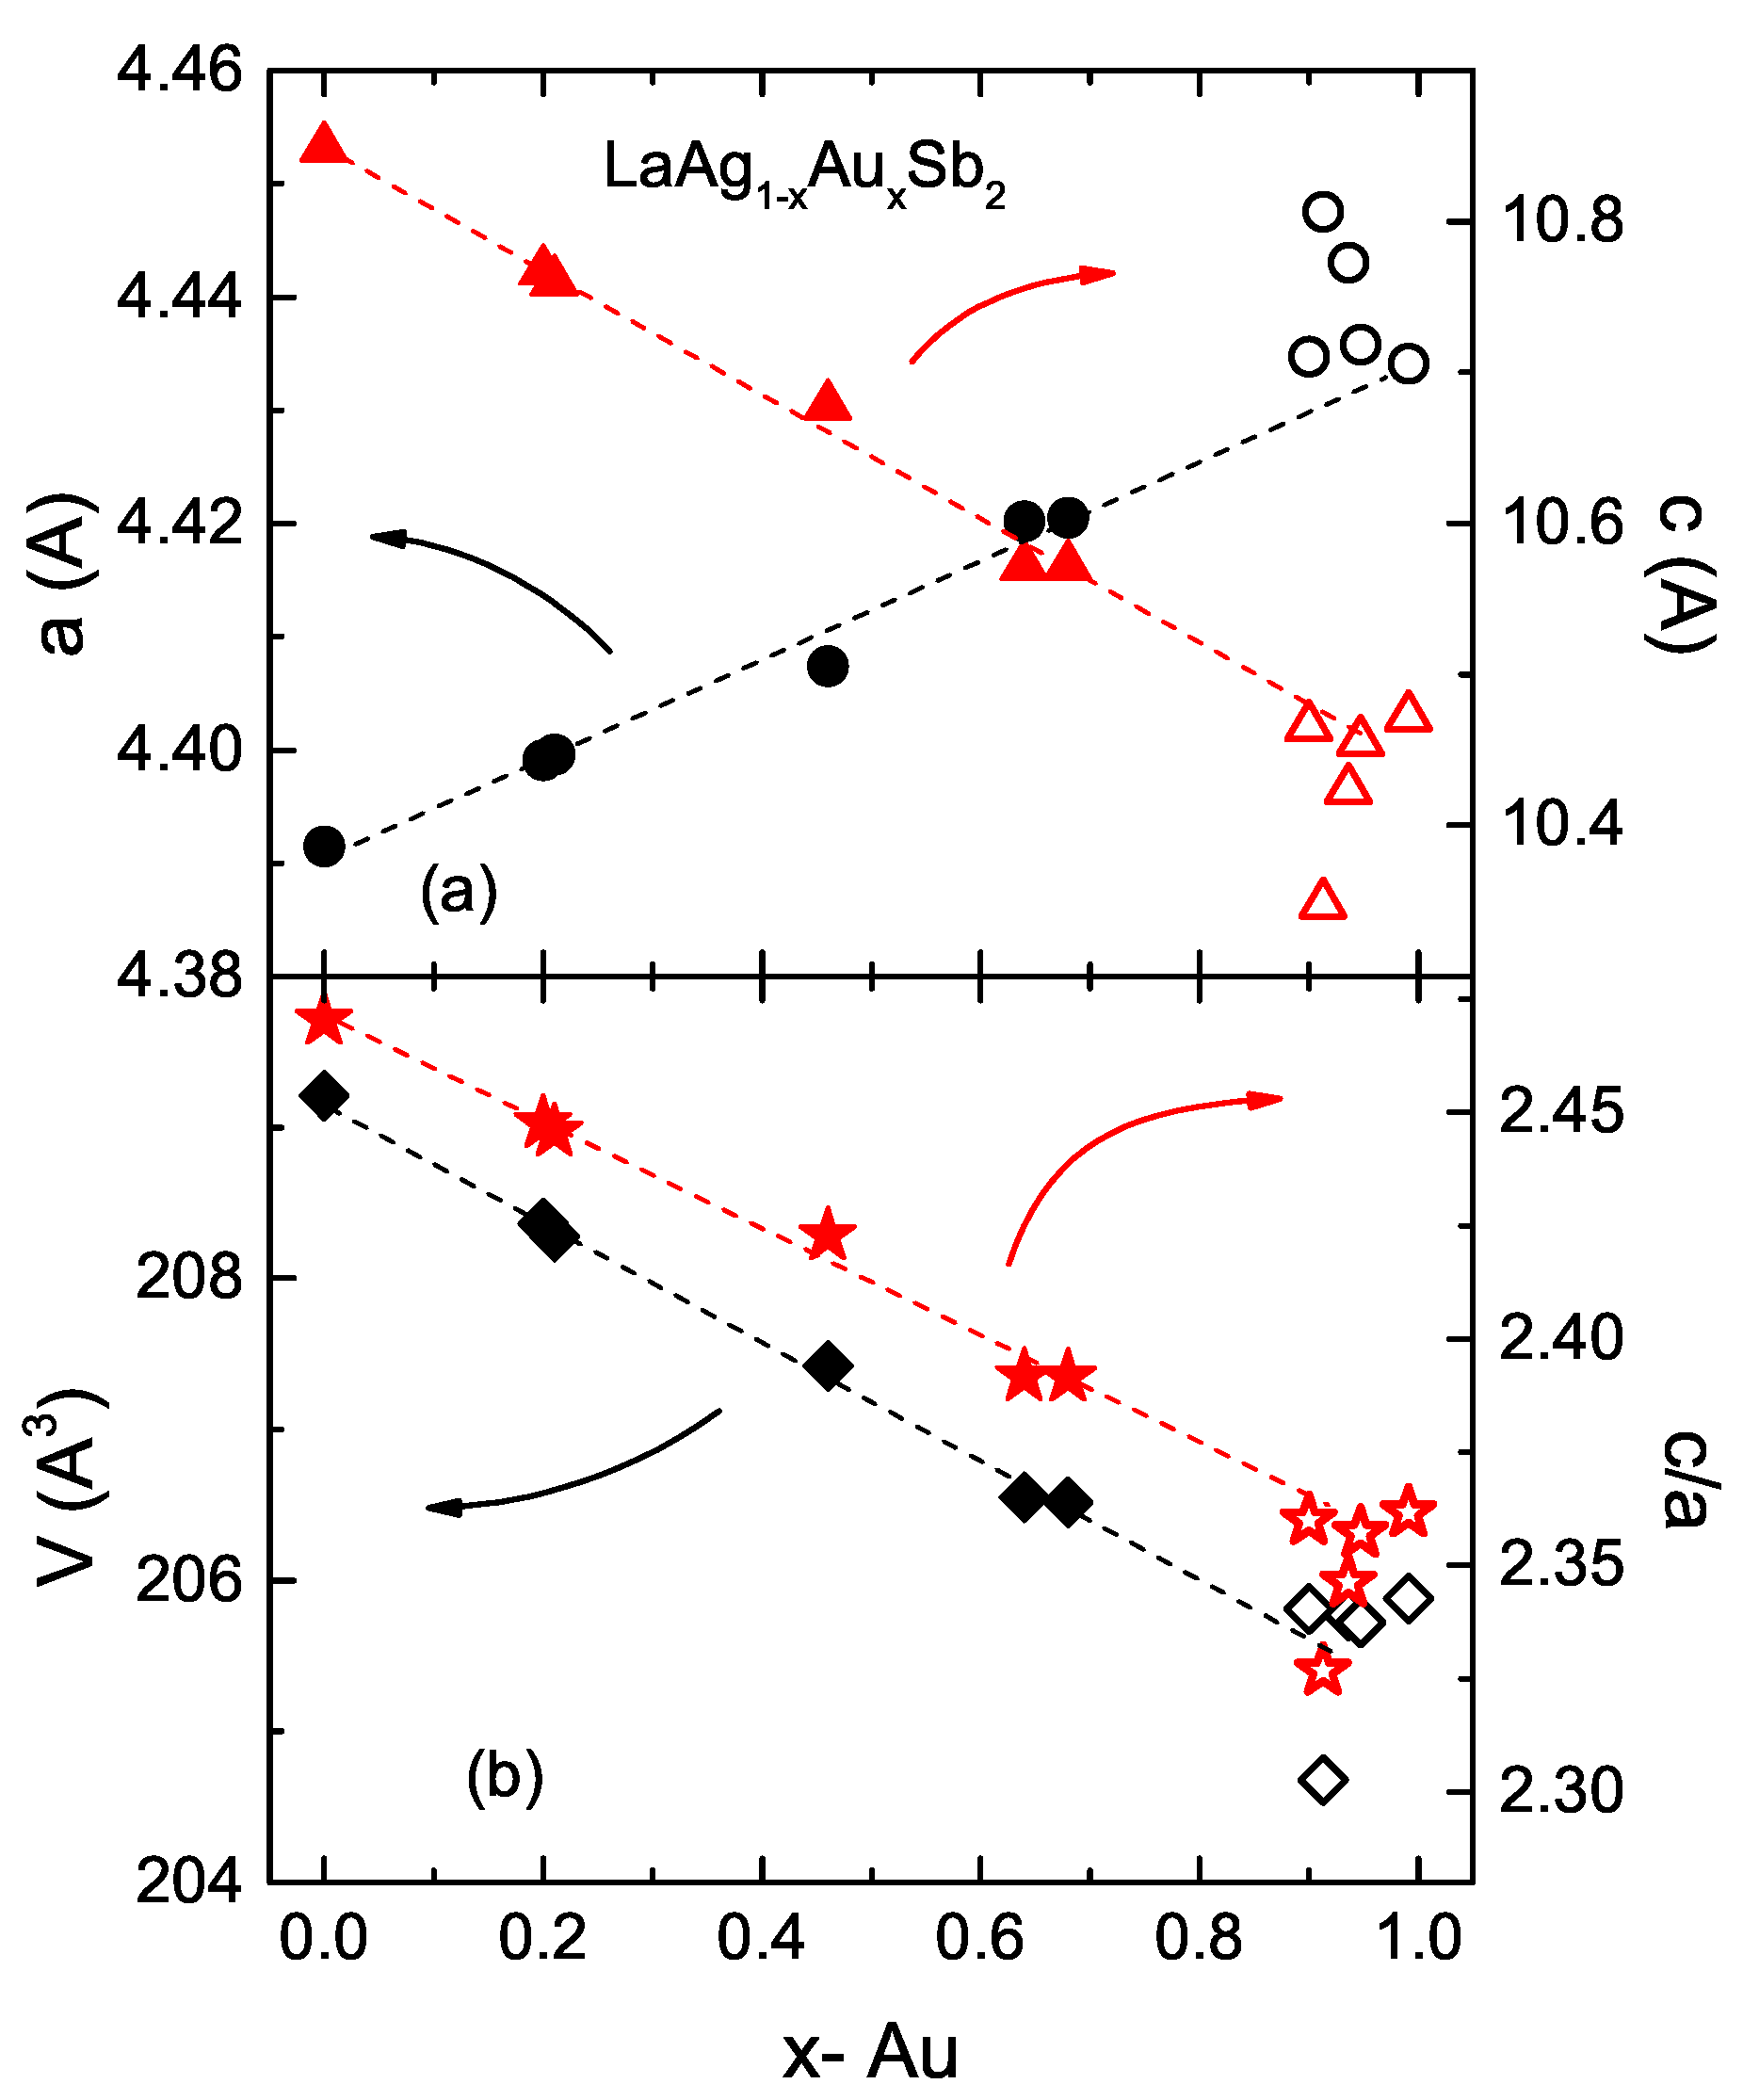
3.1. Structure and Substitution

The X-ray diffraction patterns for all LaAg 1 x Au x Sb 2 samples were fitted using the GSAS/EXPGUI packages [28,29]. Small amounts of residual flux were generally observed as impurity phases and were included in the fits as necessary. Figure 1 shows a typical X-ray diffraction data set for the T2 growth of LaAg 0.75 Au 0.25 Sb 2 with ∼1 wt.% Sb as impuritiy. In the fit, the occupations of the La, Sb1, and Sb2 sites as well as the total occupation of the T = Ag/Au 2 b site were fixed as 1, whereas the Ag/Au ratio was allowed to vary. As the parameter that actually contributes to the scattering from a given site in the structure is the average scattering length for that site, it was not meaningful to refine both the Au/Ag ratio and a possible vacancy level using a single measurement (our X-ray diffraction patterns) of the average scattering length. The same (reduced) average scattering could be constructed from Au-only + some level of vacancy, a fully occupied site with Au + some Ag, or some appropriate, and continuously variable combination of Au + Ag + vacancy. The results from Rietveld analysis of the powder X-ray data for LaAgSb 2 and five LaAg 1 x Au x Sb 2 samples are listed in Table A1 and Table A2 in the Appendix A. The EDS results for LaAgSb 2 and four LaAg 1 x Au x Sb 2 samples are presented in Table A3 in the Appendix A. The values in the table are the average of the measurements taken at between four and eight different places on the samples’ surfaces, standard deviations are listed in the parentheses.
Analysis of the X-ray diffraction as well as EDS results show (Figure 2) that the measured Ag/Au ratio deviates from the nominal with the experimental points for x m e a s being slightly below the x m e a s = x n o m line with x m e a s / x n o m = 0.88 ± 0.02 and 0.90 ± 0.03 for X-ray diffraction and EDS results, respectively. In the rest of the text we will use x-values determined from the X-ray diffraction.
The lattice parameters, unit cell volume and the c / a ratio as a function of Au substitution are presented in Figure 3. All these quantities have an approximately linear dependence of x, in good agreement with Ref. [18].

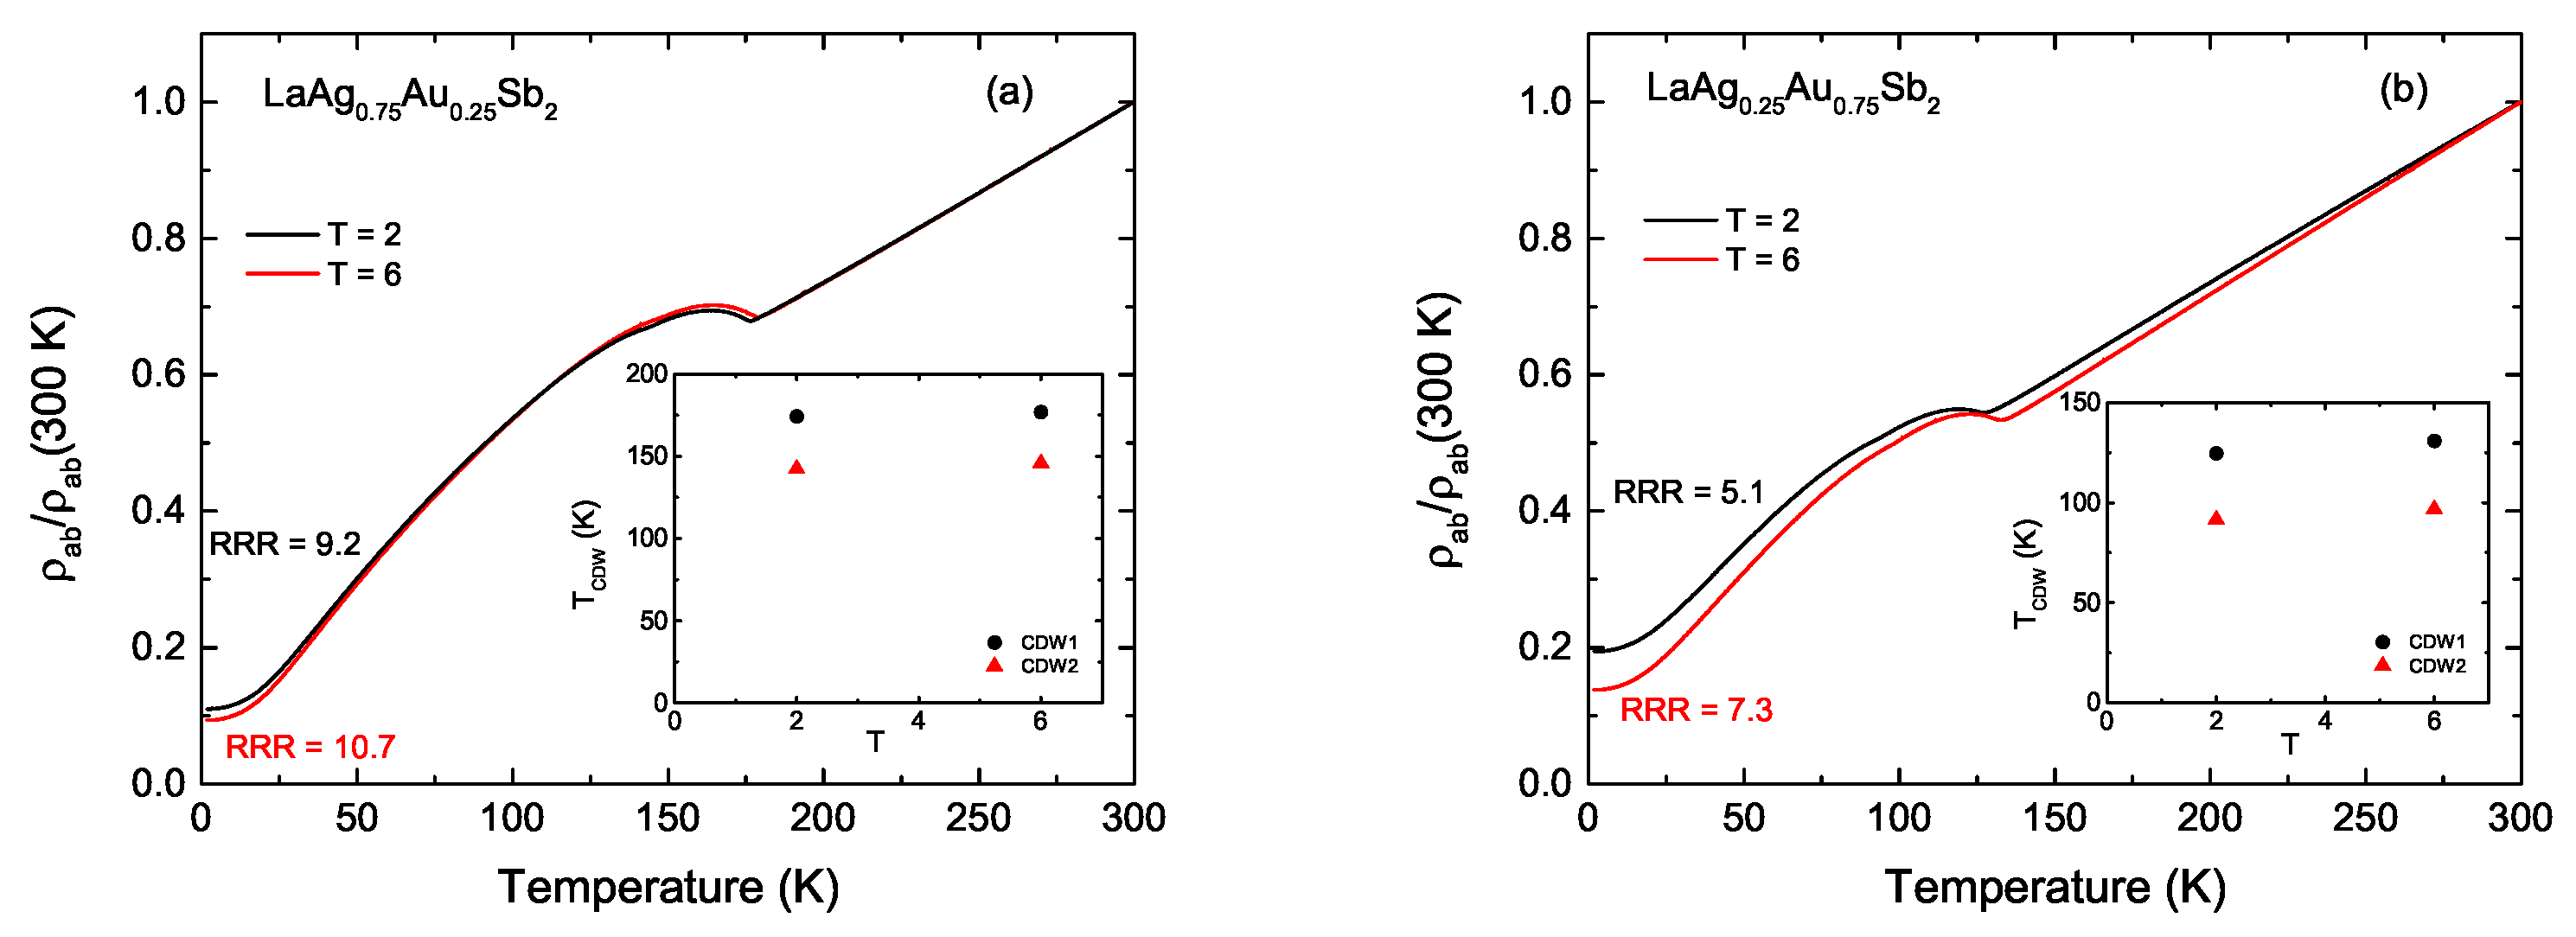
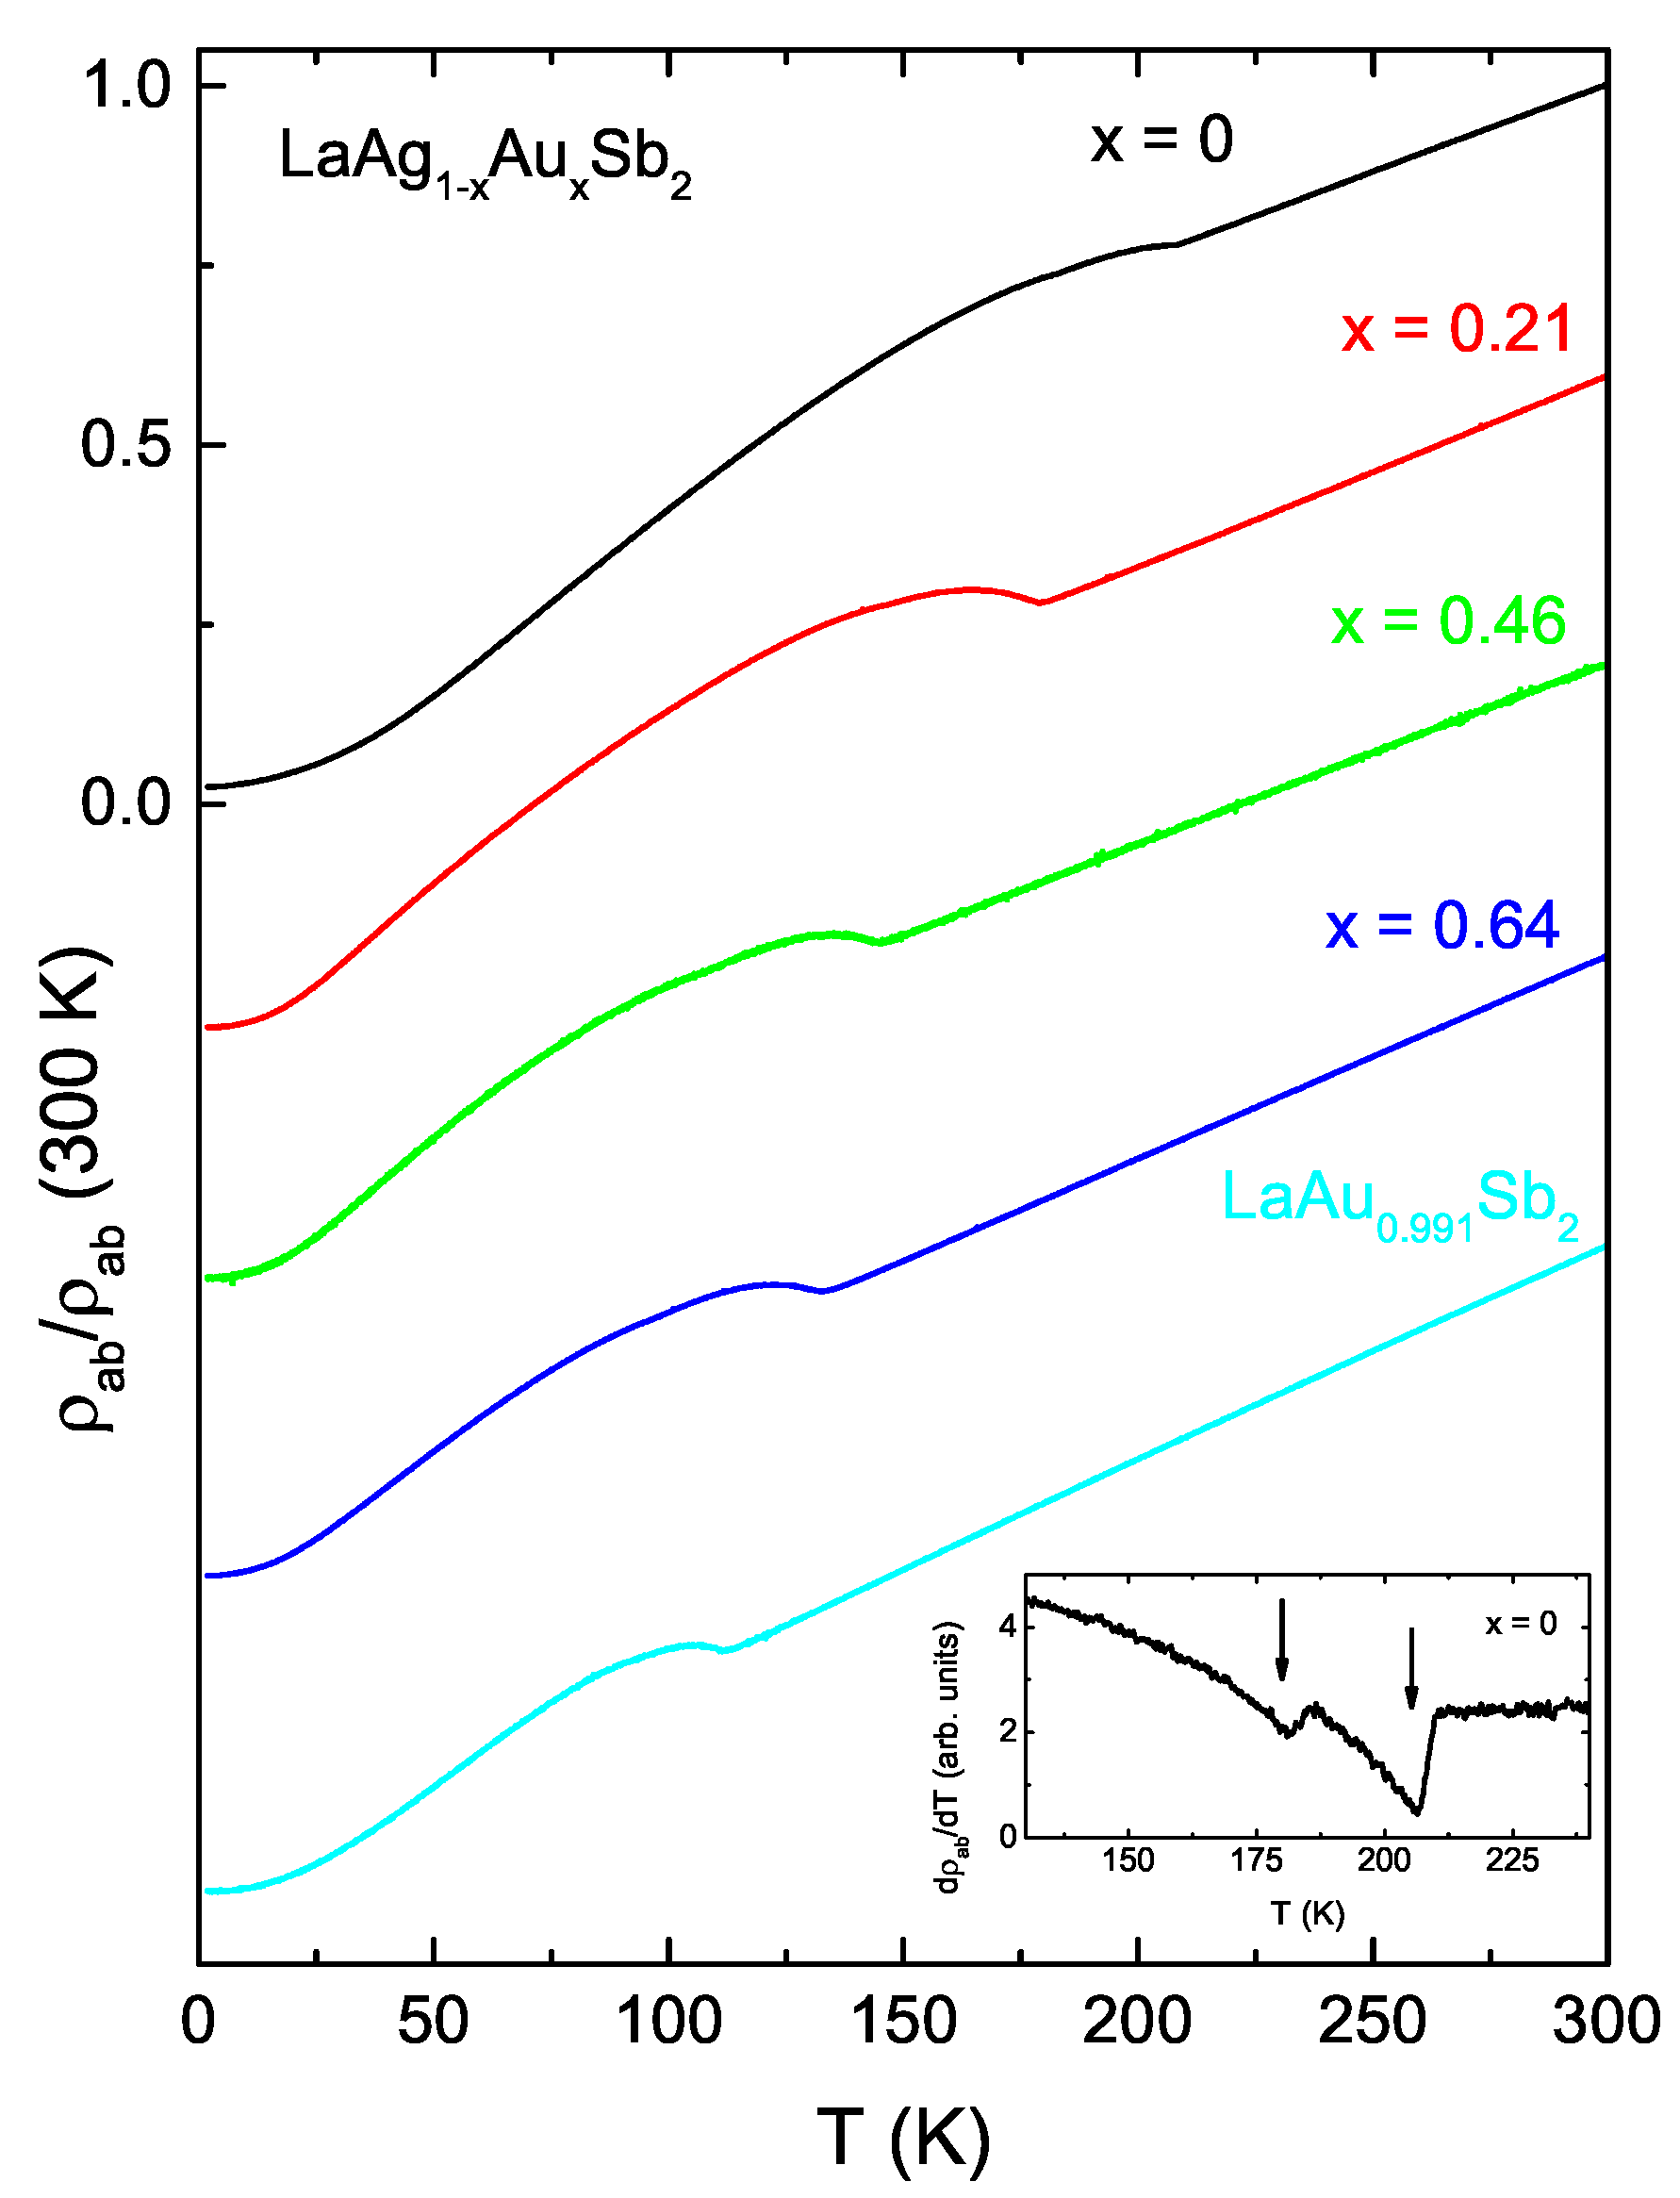
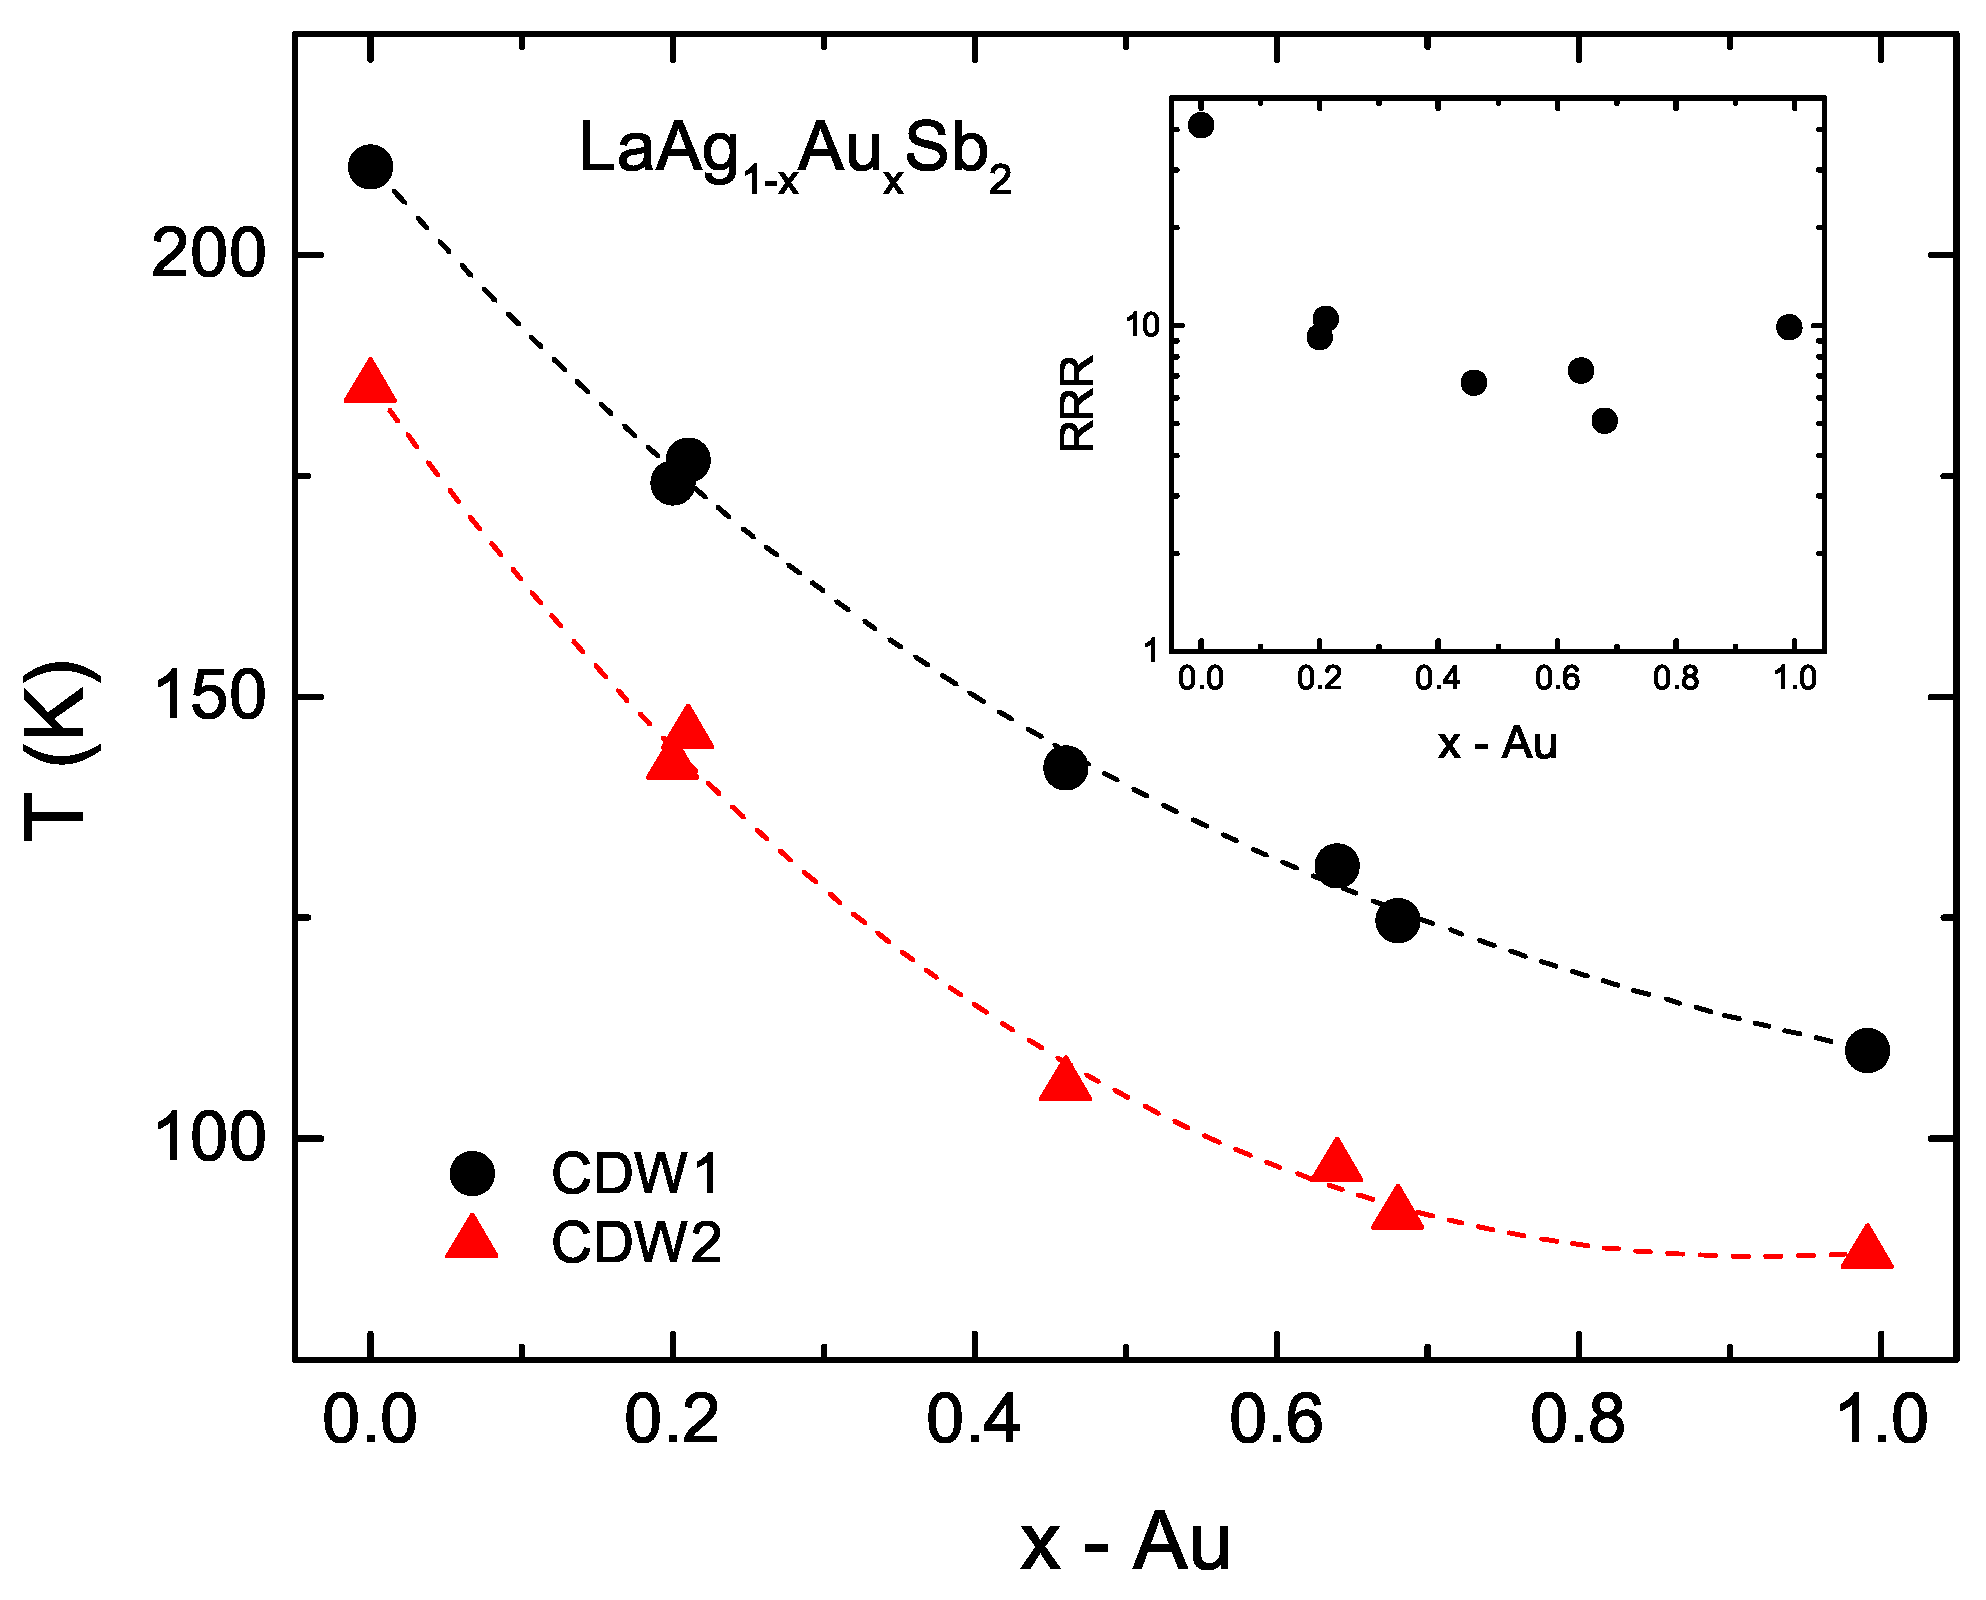
3.2. CDW at Ambient Pressure

Whereas in the case of LaAu x Sb 2 the CDW temperatures were significantly affected by initial growth compositions [17], this appears to be not so critical for LaAg 1 x Au x Sb 2 with the intermediate Au compositions. For the nominal LaAg 0.75 Au 0.25 Sb 2 and LaAg 0.25 Au 0.75 Sb 2 samples the difference between T2 and T6 initial compositions in the XRD-refined Au concentrations is 0.01–0.04 (5–6%) (Table A2) and in the CDW ordering temperatures 3–6 K (2–5%), with the difference, not surprisingly, being larger for the latter samples with higher Au concentration. The normalized in-plane resistivity and the CDW ordering temperatures for T2 and T6 samples of LaAg 0.75 Au 0.25 Sb 2 and LaAg 0.25 Au 0.75 Sb 2 are shown in Figure 4a,b, respectively.
The overall evolution of the in-plane resistivity of LaAg 1 x Au x Sb 2 is shown in Figure 5. CDW transition temperatures decrease with Au substitution. The suppression of T C D W 1 is in fair agreement with the prior results [18]. The ambient pressure x T phase diagram based on the data of Figure 4 and Figure 5 is presented in Figure 6. The T C D W values were determined from extrema in the d ρ a b / d T data; an example of which is shown in the inset to Figure 5.
On going from LaAgSb 2 to LaAuSb 2 , based on electrical transport data, both CDW transitions persist, but both of them are suppressed by ∼100 K without a significant change of the value of T C D W 1 T C D W 2 . The T C D W 1 ( x ) and T C D W 2 ( x ) behavior has an upward curvature. Most likely the disorder induced by substitution contributes to additional suppression of CDW transition temperatures, although to the extent significantly smaller than, e.g., in 2H—TaSe 2 x S x [35]. The presence of substitutional disorder is, expectedly, seen in the evolution of residual resistivity ratio ( R R R = ρ a b ( 300 K ) / ρ a b ( 1.8 K ) ) with Au substitution (Figure 6, inset), which shows a broad local minimum for intermediate substitution values. Similar moderate but visible effect of substitutional disorder was observed in studies of superconducting transition temperature in Y x Lu 1 x Ni 2 B 2 C [36]. A clearer example can be found in a similar, isoelectronic substitution in the Mn(Pt 1 x Pd + x ) 5 P series [37].

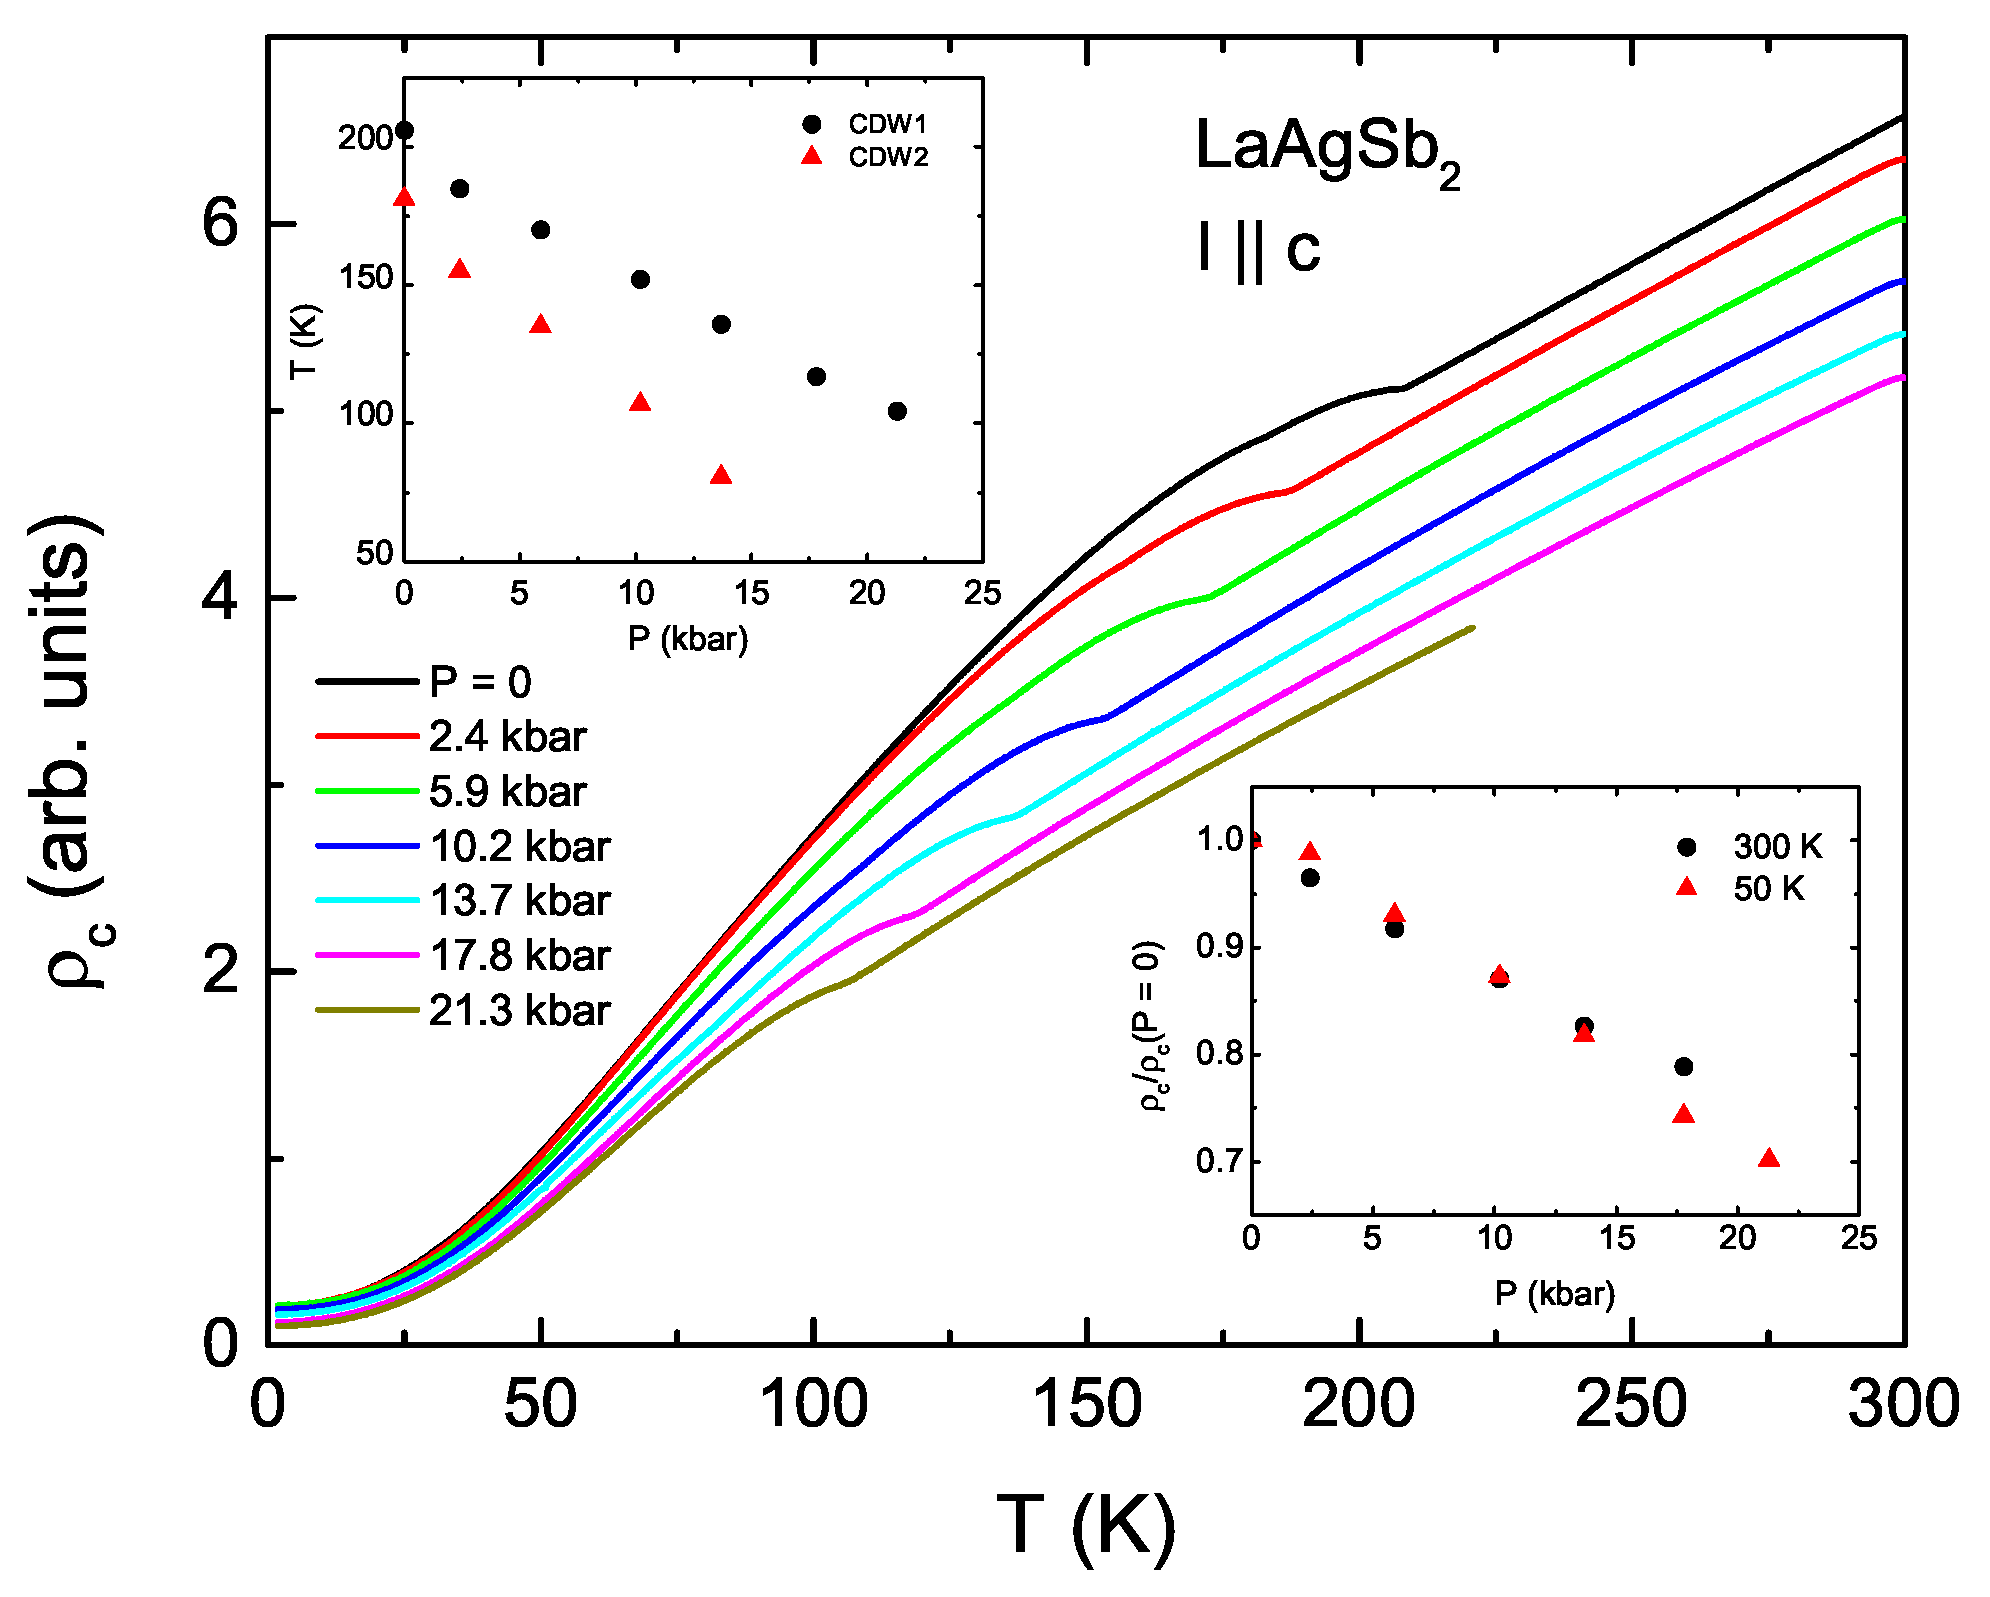
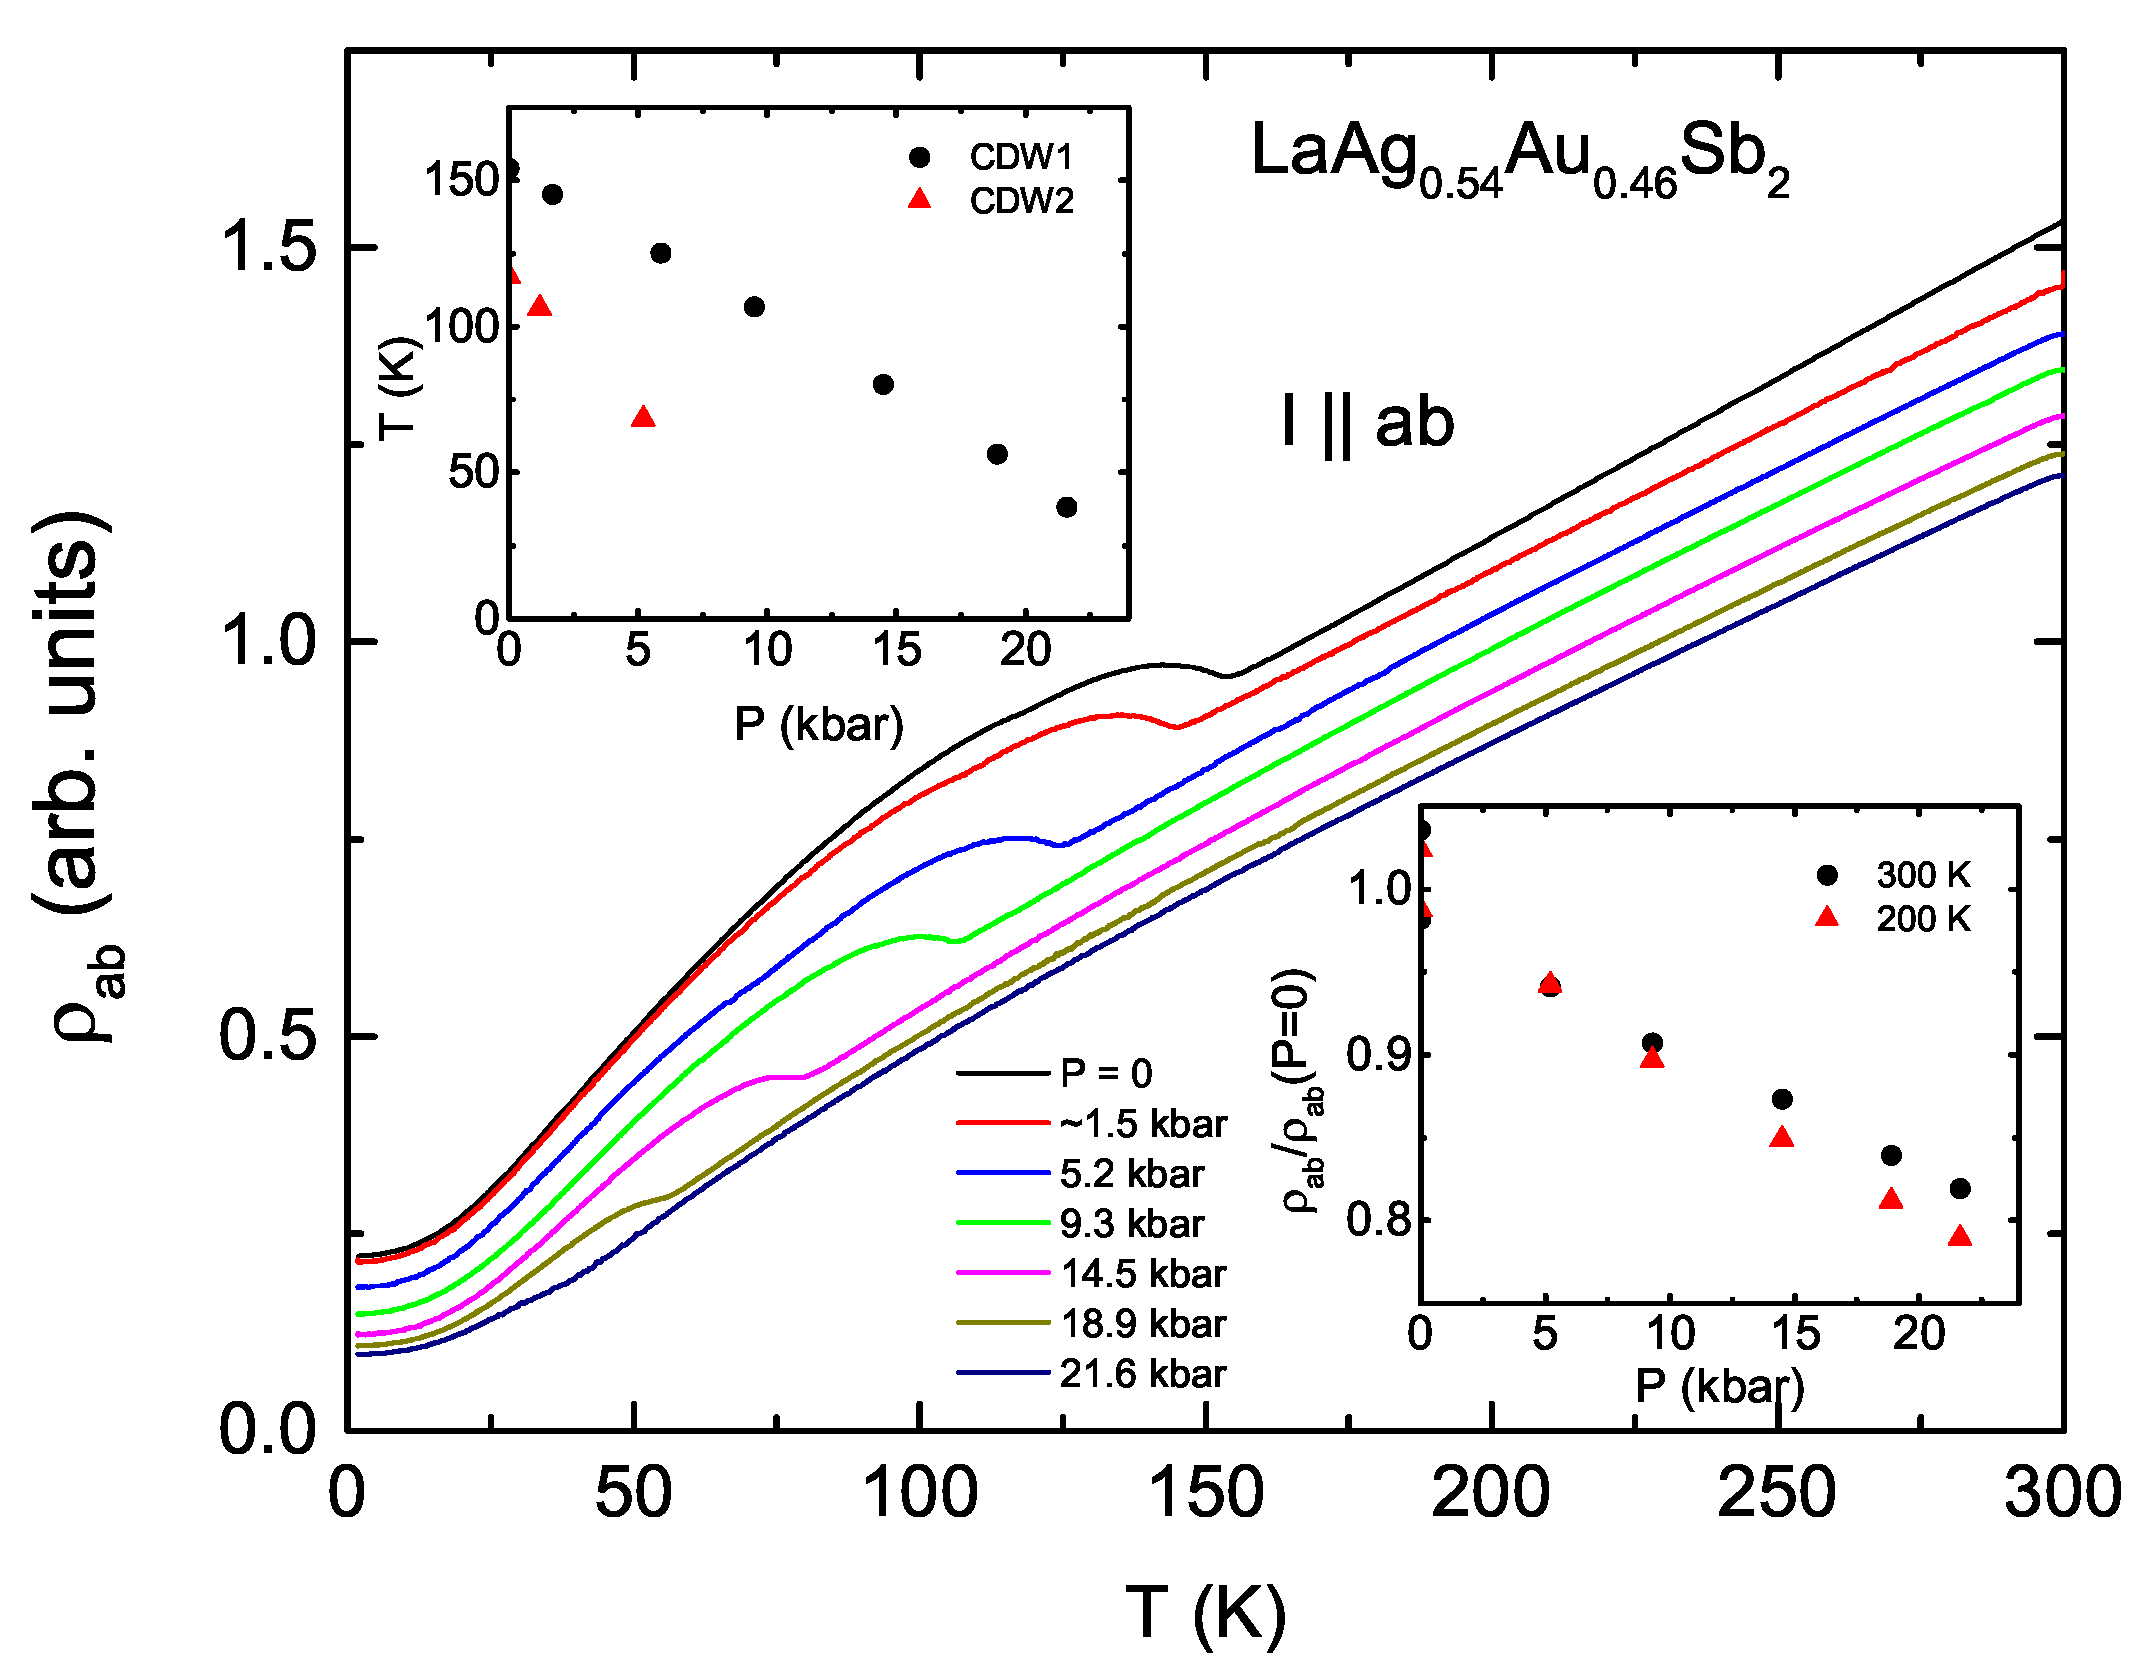
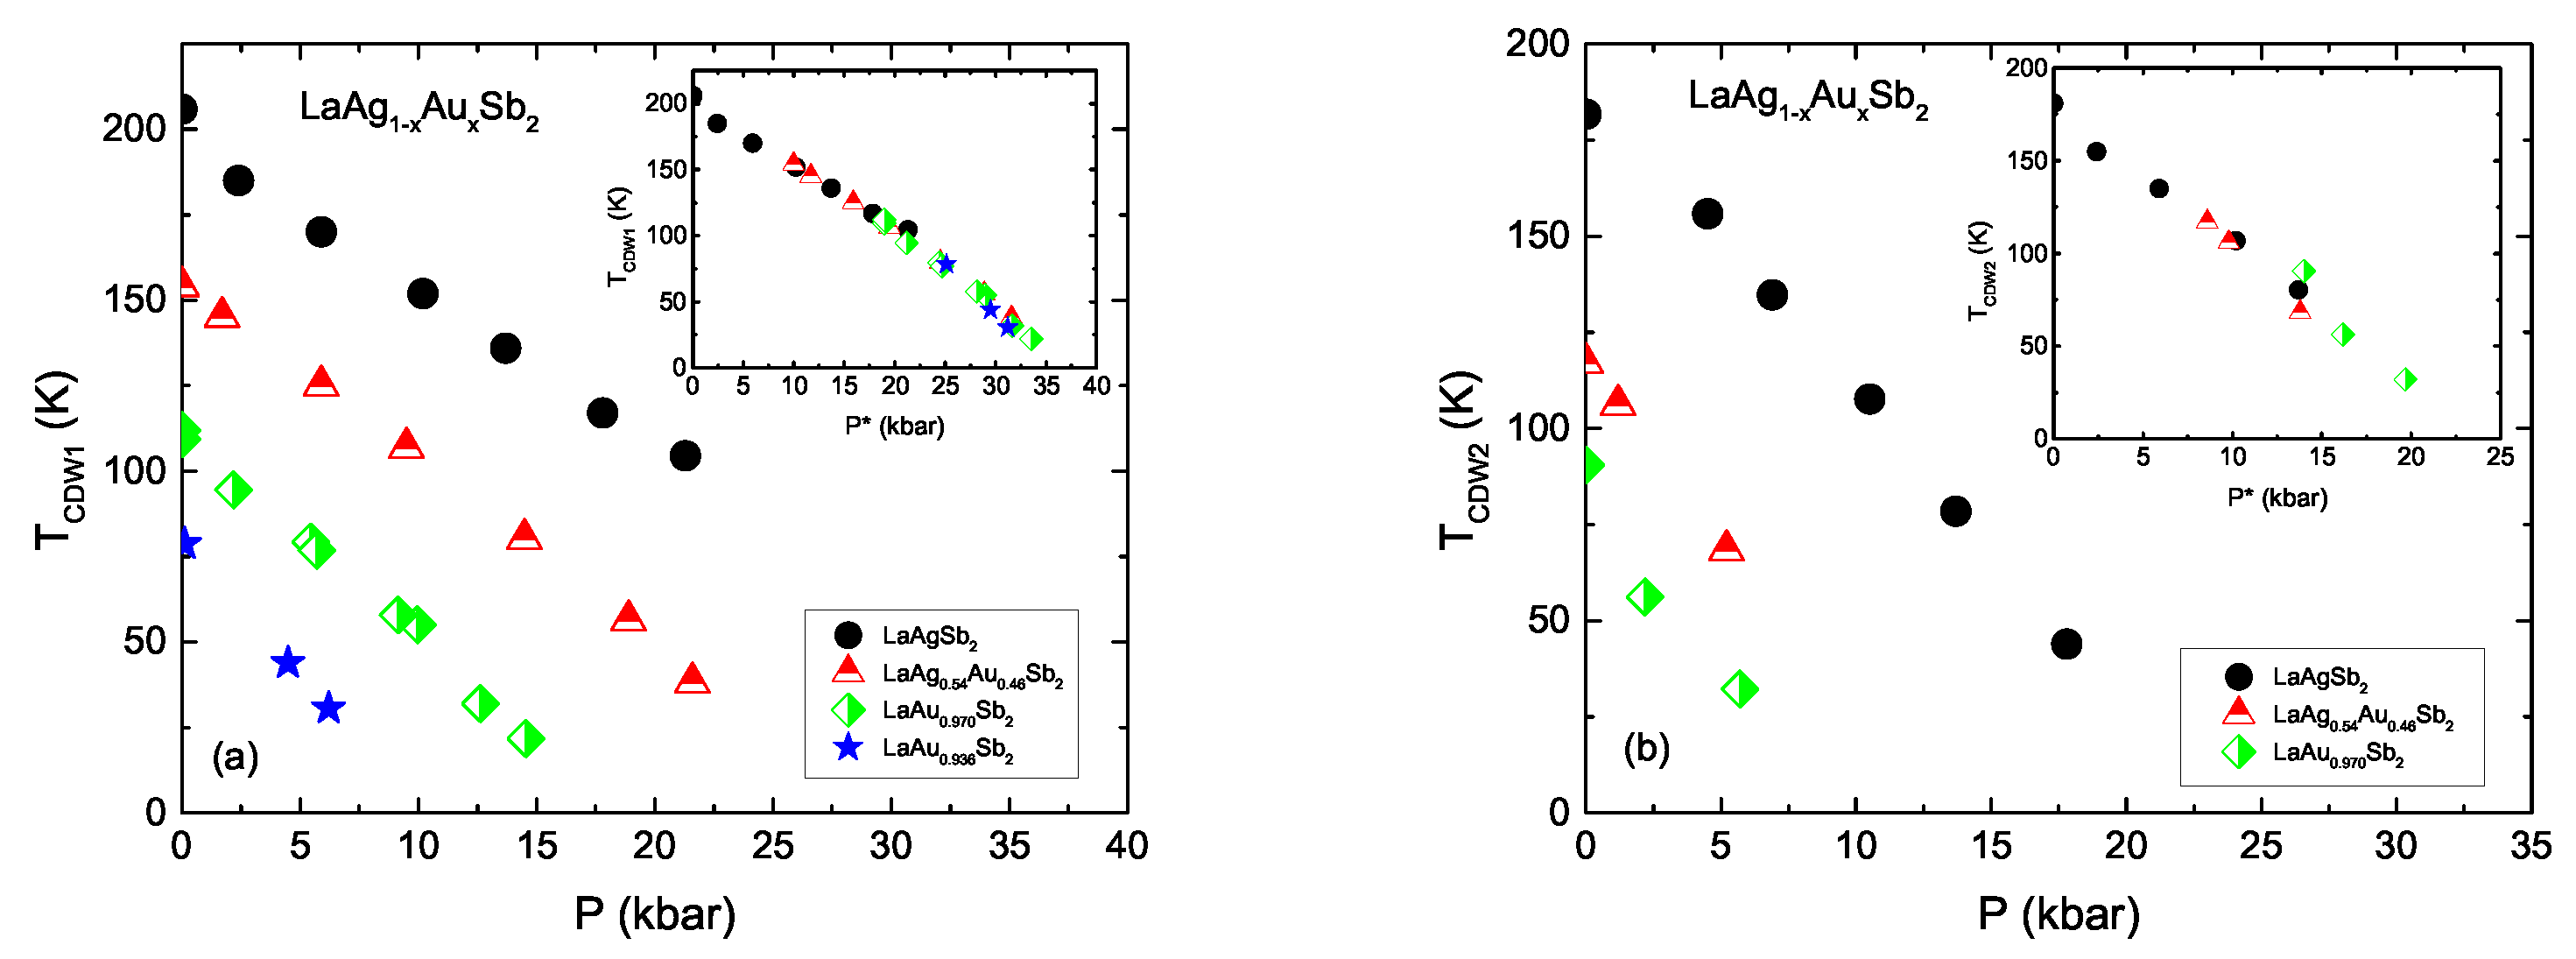
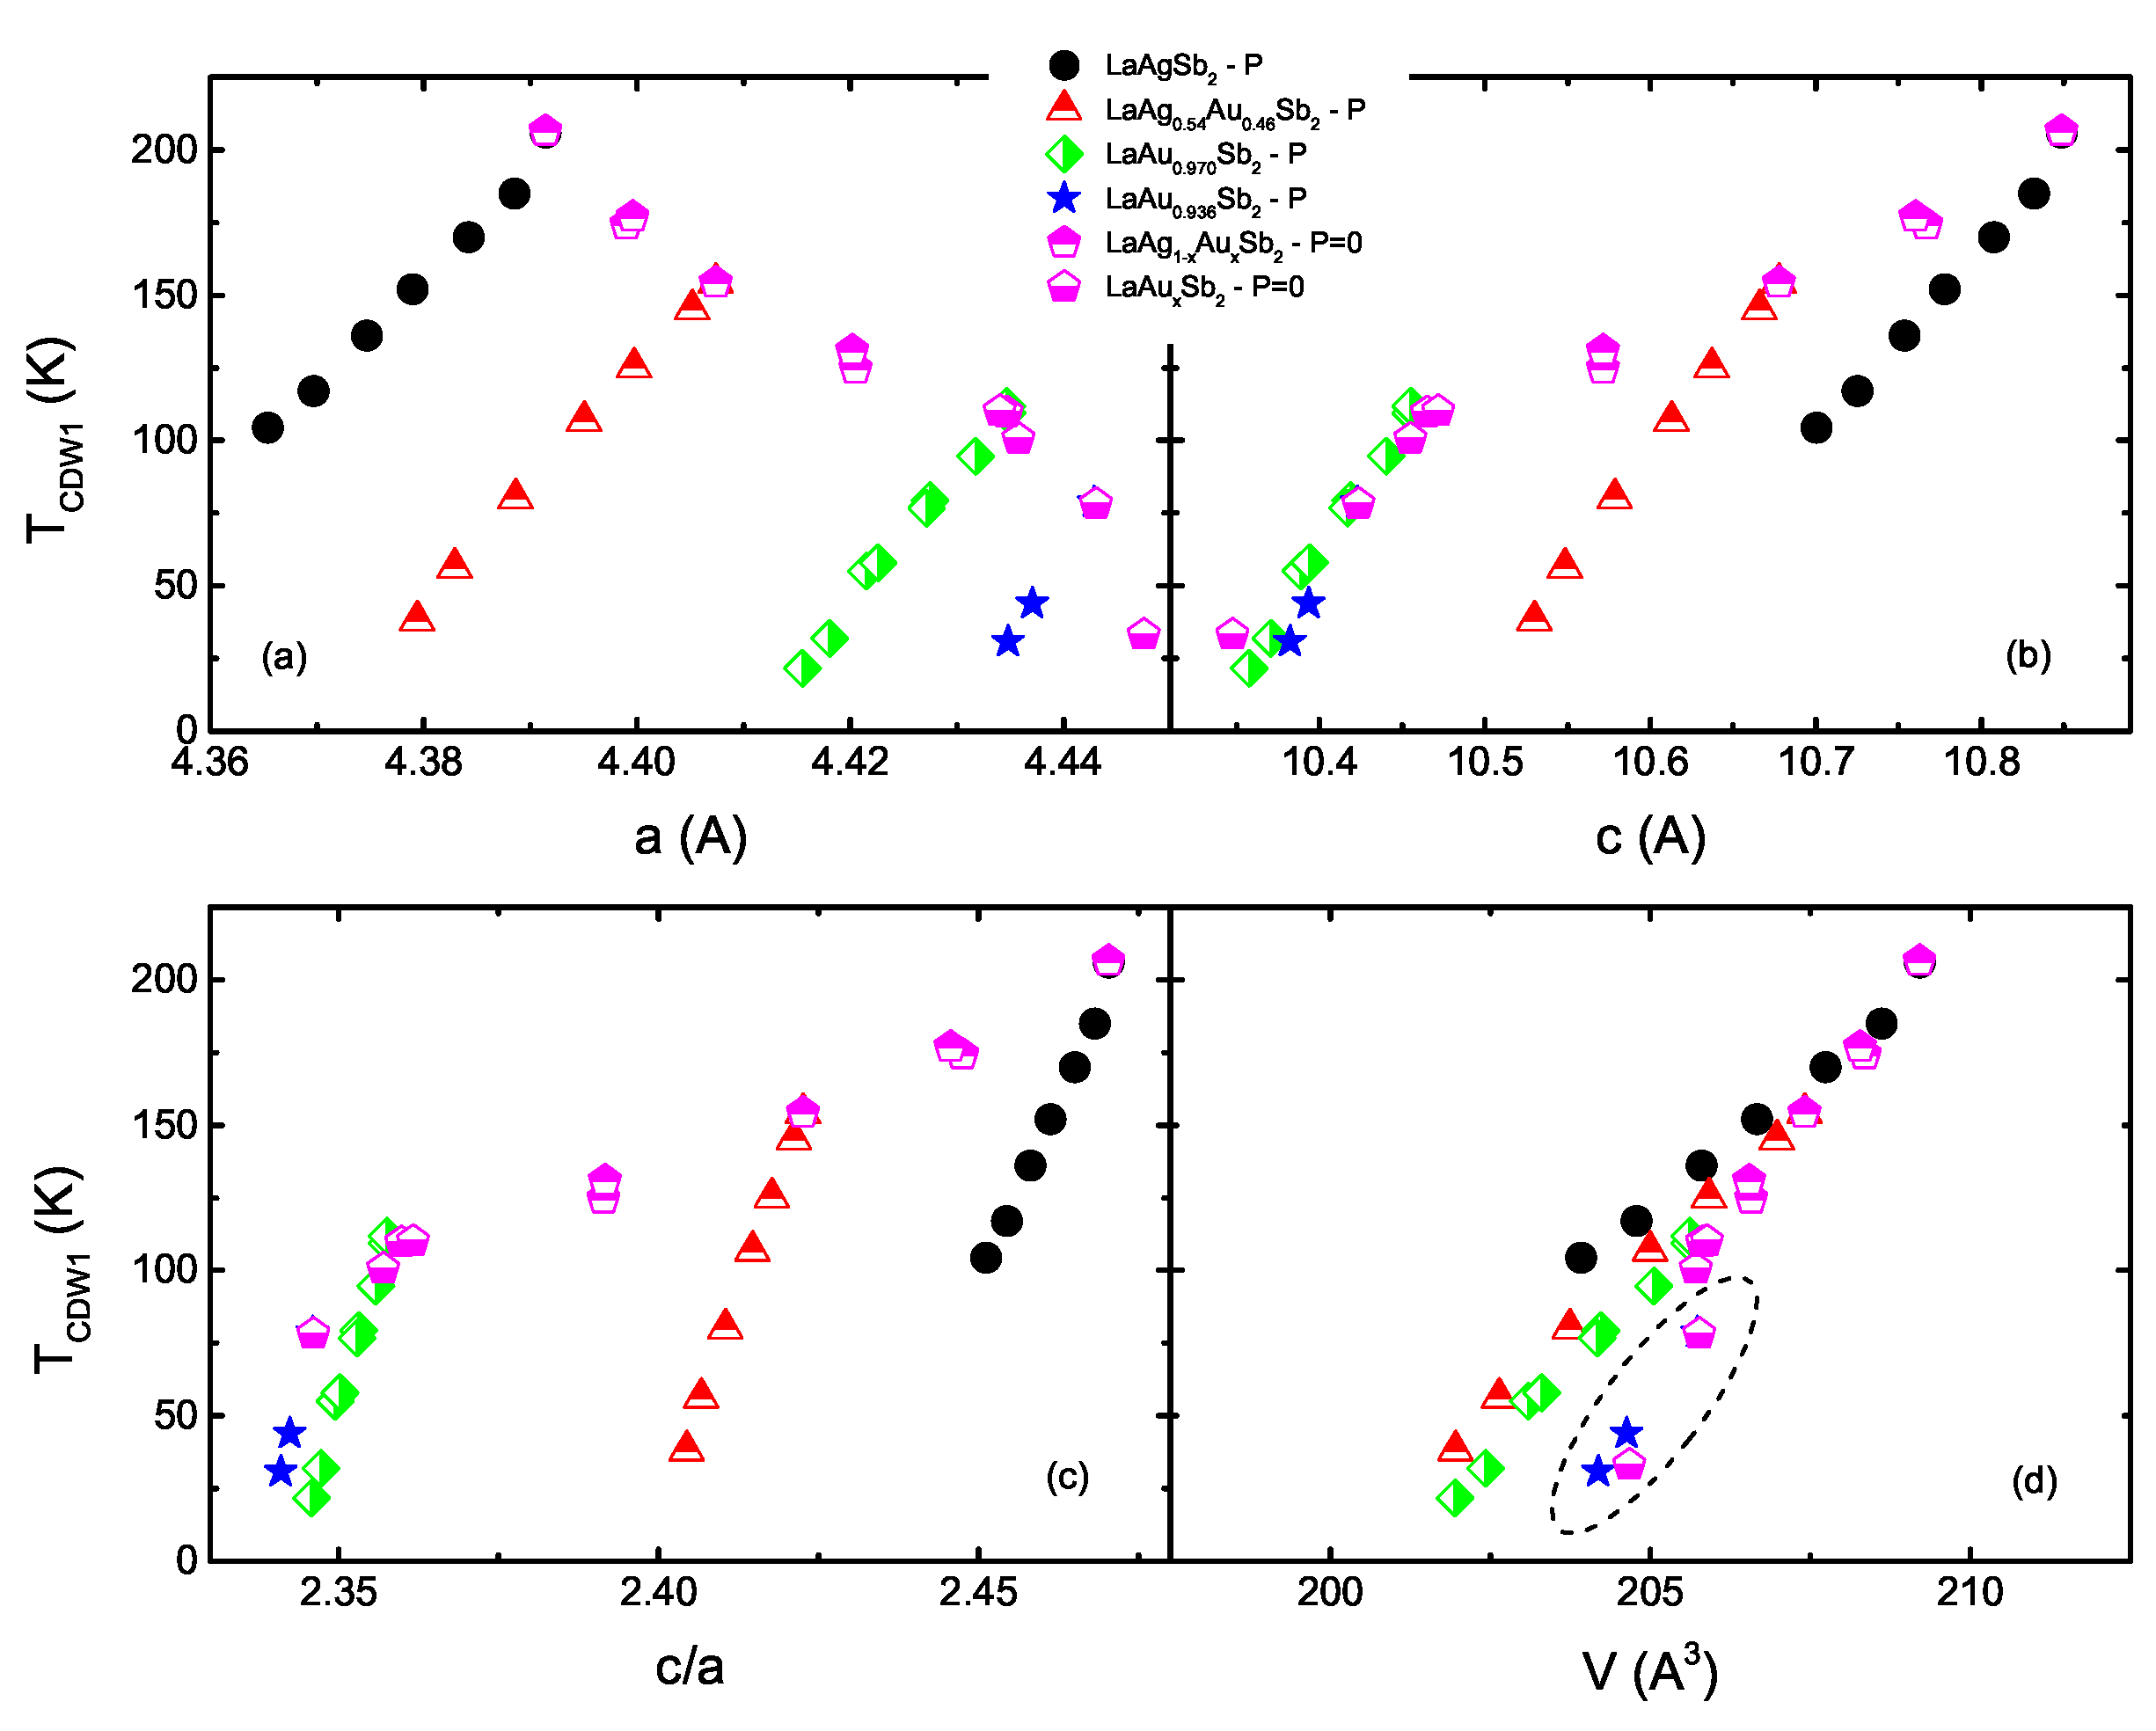
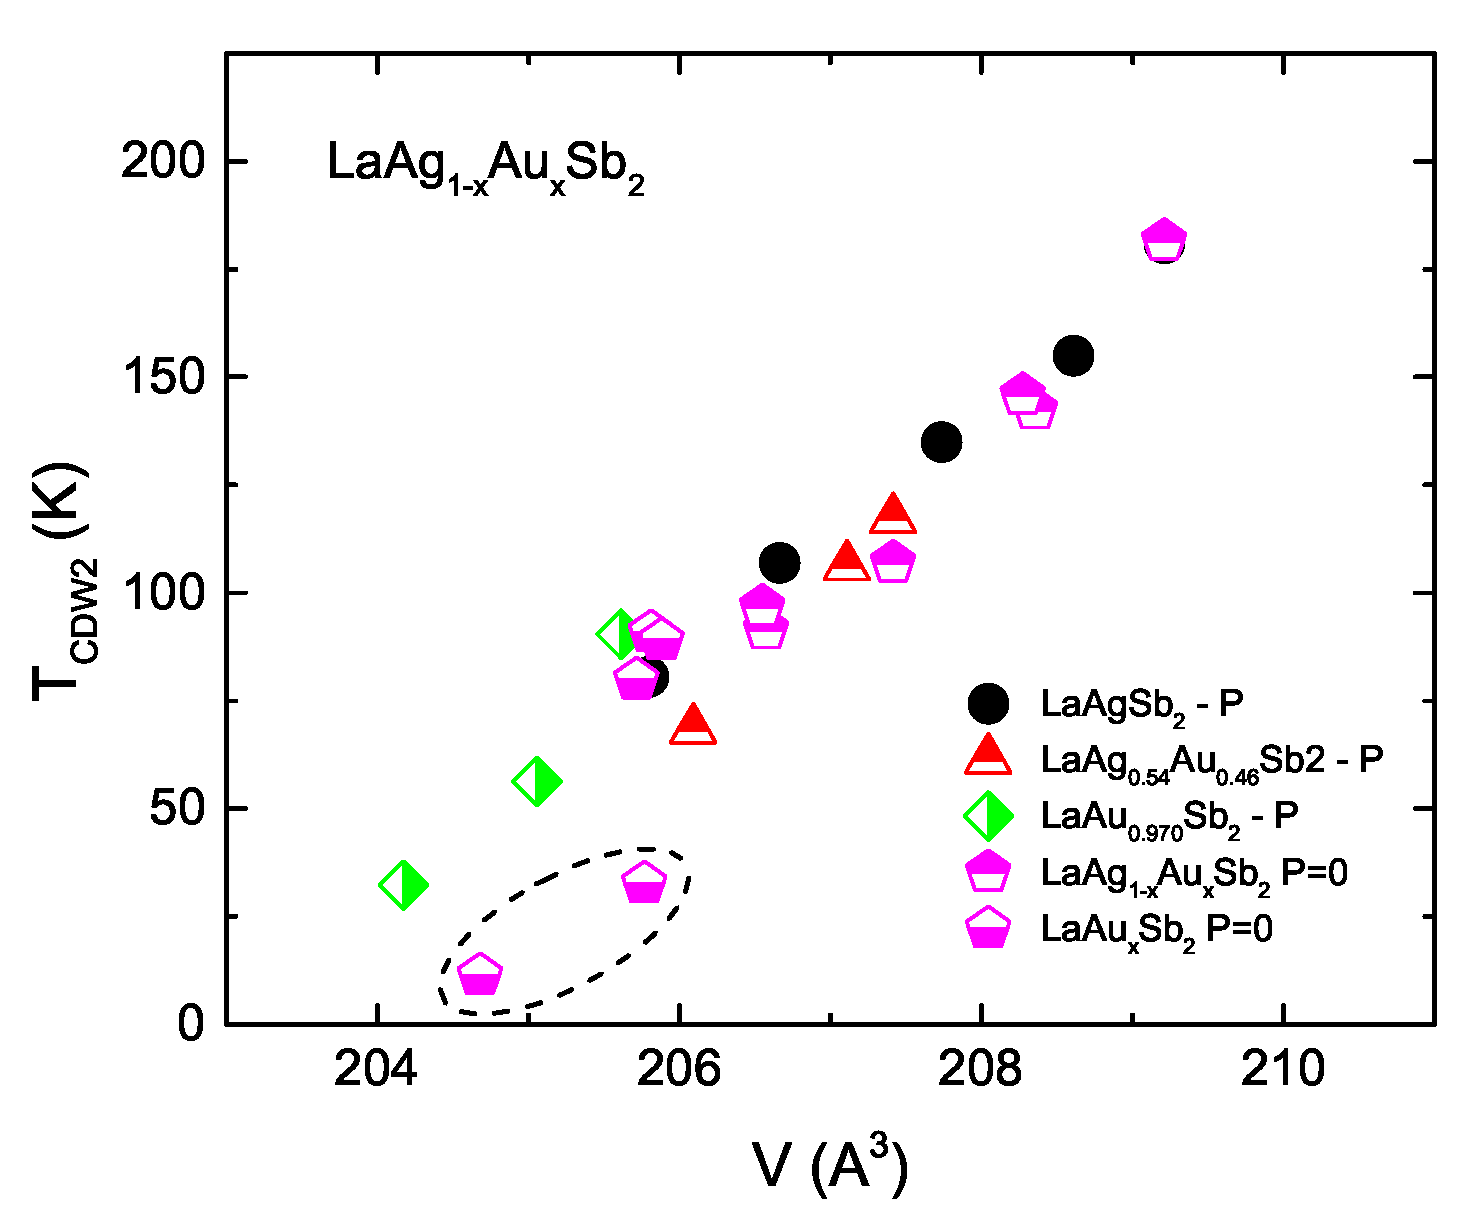
3.3. CDW under Pressure

Note that often (see above) both CDW1 and CDW2 are reasonably well discerned in the derivatives of in-plane resistivity, with the feature associated with CDW2 being less pronounced. Having in mind that (at least in LaAgSb 2 [15]) the CDW2 wavevector is along the c-axis, the ρ c measurements provide better identification of the T C D W 2 with T C D W 1 still being strong. Therefore the measurements for LaAgSb 2 under pressure were performed in I c , H a b geometry.
Main panel of Figure 7 presents c-axis resistivity data taken for LaAgSb 2 at different pressures. The overall resistivity is suppressed as pressure increases. The CDW transitions are moving down in temperature. The insets help to quantify above statement. The relative change of the c-axis resisitivity under pressure, is similar for both temperatures presented, 300 K and 50 K, 1 / ρ c ( 0 ) · d ρ c / d P = ( 0.012 0.014 ) kbar 1 . Both CDW temperatures decrease under in a close to linear fashion, with the derivatives d T C D W 1 / d P = 4.6 ± 0.2 K/kbar and d T C D W 2 / d P = 7.0 ± 0.3 K/kbar. Simple, linear, extrapolation suggests that CDW2 will be suppressed to 0 K at ∼25 kbar and CDW1 at ∼43 kbar. The observed T C D W derivatives are consistent with the published values of −(4.3–5.1) K/kbar for CDW1 [19,20,21] and −8.0 K/kbar for CDW2 [21].
In order to extend the pressure dependence of T C D W 1 and T C D W 2 across the substitutional series, a similar data set (but for ρ a b ) for LaAg 0.54 Au 0.46 Sb 2 (nominal LaAg 0.5 Au 0.5 Sb 2 ) is presented in Figure 8. The relative change in the in-plane resistivity at 300 K and 200 K is 1 / ρ a b ( 0 ) · d ρ a b / d P = −(0.009–0.01) kbar 1 , the same as that in LaAgSb 2 [20]. The initial pressure derivatives of the CDW transitions are d T C D W 1 / d P = 4.9 ± 0.1 K/kbar and d T C D W 2 / d P = 9.4 ± 0.1 K/kbar. For CDW2 simple, linear, extrapolation yields ∼12.5 kbar as a critical pressure of complete suppression of CDW2. Since we cannot observe any distinguishable feature in d ρ a b / d T data at 9.3 kbar below 50 K (see Figure A1 in the Appendix B), it is possible that the T C D W 2 ( P ) behavior is super-linear and the critical pressure for CDW2 is lower than ∼12.5 kbar obtained from the linear extrapolation. Alternatively, the feature associated with CDW2 could be suppressed so much, that it cannot be detectable within our signal-to-noise ratio and digital differentiation. The data in Figure 9 potentially favors the former possibility. T C D W 1 ( P ) dependence has some curvature, the data extrapolate to the value of the critical pressure of ∼26 kbar.
Since for LaAg 0.54 Au 0.46 Sb 2 CDW2 appears to be suppressed to 0 K within our pressure range, we examine if this suppression has any bearing on the low temperature electrical transport. Indeed, the zero applied field data in Figure 9a,b show changes in behavior near 9.3 kbar with the power law exponent, α , having the clearest signature of a possible transition near the 9.3 kbar. So most probably the value of the critical pressure for CDW2 is around 9.3 kbar. The changes observed are rather subtle, however the features associated with CDW suppression in LaAgSb 2 [21] and LaAu x Sb 2 [17] were subtle as well.

4. Discussion

The pressure dependence of the CDW transitions of LaAgSb 2 , LaAg 0.54 Au 0.46 Sb 2 and LaAu x Sb 2 samples is shown in Figure 10. For different members of the family the behavior is very similar. It is noteworthy that the CDW2 suppression rates are almost a factor of 2 higher than those for CDW1. This is possibly due to different effect of pressure on the nesting features along a- and c-axes (note that for LaAgSb 2 the CDW wave-vectors were found to be (0.026 0 0) and (0 0 0.16) for CDW1 and CDW2, respectively, [15]).
The T C D W ( P ) data could be combined on the same universal line by horizontal shift of the data (as shown in the insets to Figure 10). This universal behavior suggest equivalence of the chemical and physical pressure. The approximate scaling is 2 kbar∼0.1 x-Au for CDW1 and slightly smaller pressure shift per 0.1 x-Au for CDW2. We recall that in a similar way the P T phase diagrams for Ba(Fe 1 x Ru x ) 2 As 2 with different value of x were combined to form a universal phase diagram by Δ P shifts with 30 kbar∼0.1 x-Ru [4]. In contrast, the pressure and substitution data in the La 1 x R x AgSb 2 (R = Ce, Nd) series [20] cannot be combined on the same line by Δ P shifts. Apparently rare earth and transition metal substitutions in LaAgSb 2 affect the pressure derivatives of CDW transition temperatures in different manner, with R-substituted compounds having higher (and R-dependent) suppression rates. Of course, whereas both Ag/Au and La/R substitutions are isoelectronic, substitution of Ce or Nd for La brings local moment magnetism that subsitution of Au for Ag does not.
To gain some further insight on which structural parameter could be of importance for change of the CDW temperature under pressure and with Au substitution we plot T C D W 1 as a function of basic structural parameters, a , c , c / a and V in Figure 11. For ambient pressure data the structural parameters obtained from the Rietveld refinement are used. For the high pressure data the structural parameters were obtained from the P = 0 values using LaAgSb 2 elastic constants from Ref. [19] and assuming that their change within the LaAg 1 x Au x Sb 2 series is insignificant.
The data in Figure 11 clearly show that whereas using a , c , and c / a as a structural parameter results in distinctly different trends for chemical and physical pressure, all the data on T C D W 1 vs. V plot fall fairly well on the same line. To check if this holds for CDW2 as well, we plotted T C D W 2 vs. V in Figure 12 as well. The T C D W 2 data also scale with the unit cell volume well. We have few outlier points encircled in Figure 11d and Figure 12. These point correspond to measurably off-stoichiometric LaAu x Sb 2 [17], whereas the rest of the data are for the compounds with stiochiometry very close to 1:1:2. That is possibly the reason for these few point being outliers. The T C D W vs. V scaling could be even better if the elastic constants measured for each compound were used, however to address this, further elastic properties measurements should be performed. It is of a surprise, that despite LaAg 1 x Au x Sb 2 being tetragonal, anisotropic compounds, the chemical and physical pressure appear to be equivalent with a salient structural parameter being the unit cell volume (that lacks any anisotropic information). Hopefully further band structure calculations will be able to address this issue.

5. Summary

Study of compounds of the LaAg 1 x Au x Sb 2 family at ambient and high pressure show that both CDW transitions are suppressed with Au substitution and under pressure in a manner that indicate equivalence of chemical and physical pressure in this series with the unit cell volume being a suitable structural control parameter and with suppression rates being different for CDW1 and CDW2. Such equivalence of physical and chemical pressure was not observed in the La 1 x R x AgSb 2 series [20]. Different CDW suppression rates probably reflect the fact that (at least for LaAgSb 2 ) the CDW wave-vectors are orthogonal, along a- and c-axis for CDW1 and CDW2, respectively.
Additionally, for LaAg 0.54 Au 0.46 Sb 2 anomalies in low temperature electrical transport were observed in the pressure range where CDW2 is completely suppressed.

Author Contributions

Conceptualization, S.L.B.; formal analysis, L.X., D.H.R. and S.L.B.; investigation, L.X. and D.H.R.; data curation, L.X. and D.H.R.; writing—original draft preparation, S.L.B.; writing—review and editing, L.X., D.H.R. and P.C.C.; visualization, L.X., D.H.R. and S.L.B.; supervision, P.C.C. and S.L.B.; funding acquisition, P.C.C. All authors have read and agreed to the published version of the manuscript.

Funding

Work at the Ames National Laboratory was supported by the U.S. Department of Energy, Office of Science, Basic Energy Sciences, Materials Sciences and Engineering Division. The Ames National Laboratory is operated for the U.S. Department of Energy by Iowa State University under contract No. DE-AC02-07CH11358. L.X. was supported, in part, by the W. M. Keck Foundation. Much of this work was carried out while D.H.R. was on sabbatical at Iowa State University and Ames Laboratory and their generous support (again under under contract No. DE-AC02-07CH11358) during this visit is gratefully acknowledged. D.H.R. was supported as well by Fonds Québécois de la Recherche sur la Nature et les Technologies.

Data Availability Statement

The data presented in this study are available on reasonable request from the corresponding author.

Acknowledgments

We thank Warren E. Straszheim for help with the EDS measurements, and Elena Gati and Raquel A. Ribeiro for useful discussions. PCC would like to acknowledge Paul Delvaux for ongoing inspiration.

Conflicts of Interest

The authors declare no conflict of interest.

Appendix A. Rietveld Refinement and EDS Results

This Appendix A contains tables with the results of Rietveld refinements and EDS chemical analysis of the LaAg 1 x Au x Sb 2 samples. Data for LaAu x Sb 2 [17] in Table A1 are added for comparison.
Table A1. Lattice parameters of LaAg 1 x Au x Sb 2 samples (labels in parentheses indicate initial growth compositions, see Experimental details section for more details).
Samplea (Å)c (Å)V 3 )
LaAgSb 2 (T2)4.3915(1)10.8485(4)209.21(1)
LaAg 0.75 Au 0.25 Sb 2 (T2)4.3991(1)10.7669(4)208.36(1)
LaAg 0.75 Au 0.25 Sb 2 (T6)4.3996(1)10.7601(4)208.28(1)
LaAg 0.5 Au 0.5 Sb 2 (T2)4.4074(2)10.6777(6)207.42(2)
LaAg 0.25 Au 0.75 Sb 2 (T2)4.4205(2)10.5715(5)206.52(2)
LaAg 0.25 Au 0.75 Sb 2 (T6)4.4202(1)10.5716(4)206.55(1)
LaAu x Sb 2 (T2) [17]4.4430(2)10.4237(4)205.77(1)
LaAu x Sb 2 (T6) [17]4.4347(1)10.4653(3)205.88(1)
Table A2. Atomic coordinates, occupancy, and isotropic displacement parameters of LaAg 1 x Au x Sb 2 samples (labels in parentheses indicate initial growth compositions, see Experimental details section for more details).
SampleAtomSitexyzOccupancy U eq
LaAgSb 2 (T2)La2c0.250.250.2397(1)10.0260(5)
Ag2b0.750.250.510.0297(6)
Sb12a0.750.25010.0275(5)
Sb22c0.250.250.6691(2)10.0275(5)
LaAg 0.75 Au 0.25 Sb 2 (T2)La2c0.250.250.2424(2)10.0335(6)
Ag2b0.750.250.50.80(1)0.033(1)
Au2b0.750.250.50.20(1)0.033(1)
Sb12a0.750.25010.0318(7)
Sb22c0.250.250.6696(2)10.0318(7)
LaAg 0.75 Au 0.25 Sb 2 (T6)La2c0.250.250.2418(2)10.0281(7)
Ag2b0.750.250.50.79(2)0.027(1)
Au2b0.750.250.50.21(2)0.027(1)
Sb12a0.750.25010.0275(7)
Sb22c0.250.250.6700(2)10.0275(7)
LaAg 0.5 Au 0.5 Sb 2 (T2)La2c0.250.250.2448(2)10.0366(7)
Ag2b0.750.250.50.54(2)0.042(1)
Au2b0.750.250.50.46(1)0.042(1)
Sb12a0.750.25010.0357(8)
Sb22c0.250.250.6700(2)10.0357(8)
LaAg 0.25 Au 0.75 Sb 2 (T2)La2c0.250.250.2455(3)10.0159(8)
Ag2b0.750.250.50.32(2)0.021(1)
Au2b0.750.250.50.68(2)0.021(1)
Sb12a0.750.25010.0177(8)
Sb22c0.250.250.6999(3)10.0177(8)
LaAg 0.25 Au 0.75 Sb 2 (T6)La2c0.250.250.2453(2)10.0298(6)
Ag2b0.750.250.50.36(2)0.0320(8)
Au2b0.750.250.50.64(2)0.0320(8)
Sb12a0.750.25010.0331(6)
Sb22c0.250.250.6998(2)10.0331(6)
Table A3. EDS results for LaAg 1 x Au x Sb 2 samples.
SampleLa at.%Ag at. %Au at.%Sb at. %Au/3(Ag + Au)/
(Ag + Au)(La + Sb)
LaAgSb 2 (T2)25.4(2)25.9(1)048.7(2)01.05(2)
LaAg 0.75 Au 0.25 Sb 2 (T2)25.6(1)20.4(2)5.08(7)48.9(1)0.199(5)1.03(6)
LaAg 0.75 Au 0.25 Sb 2 (T6)25.5(2)20.2(2)5.40(4)48.9(1)0.211(4)1.03(3)
LaAg 0.5 Au 0.5 Sb 2 (T2)25.6(1)14.8(2)10.50(8)49.2(1)0.415(9)1.01(3)
LaAg 0.25 Au 0.75 Sb 2 (T6)25.7(1)7.4(1)17.7(1)49.28(8)0.71(1)1.00(2)

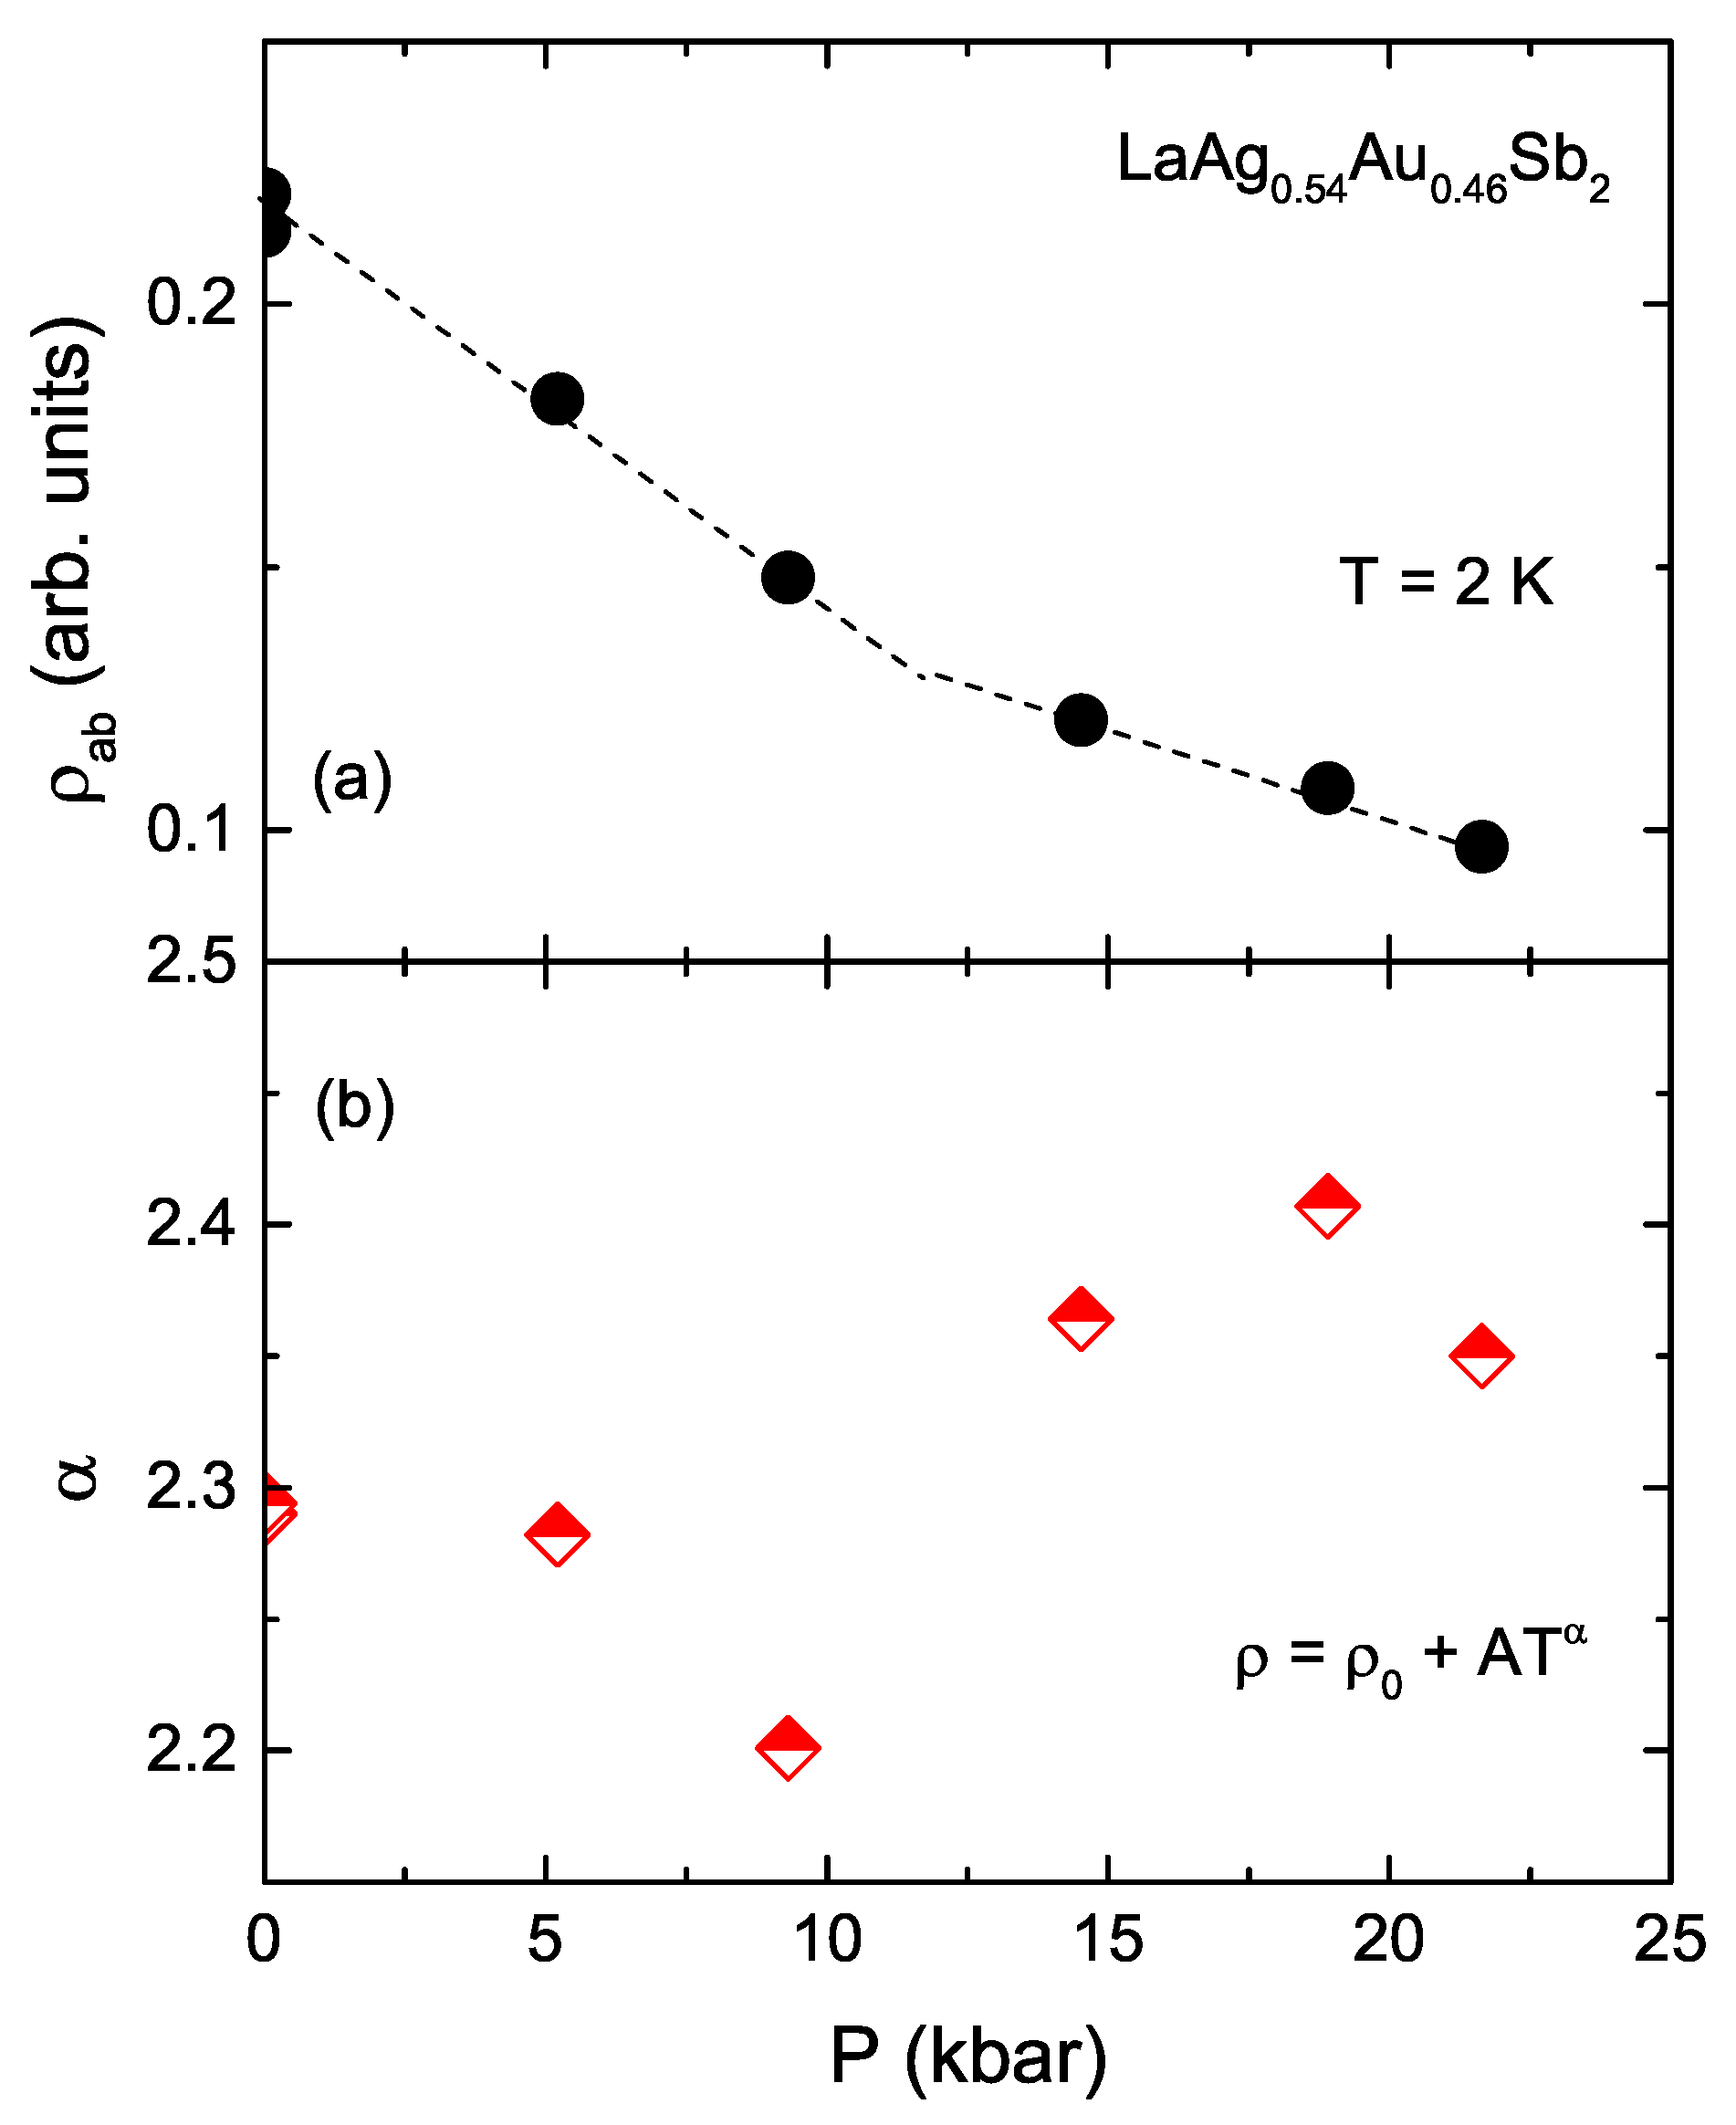
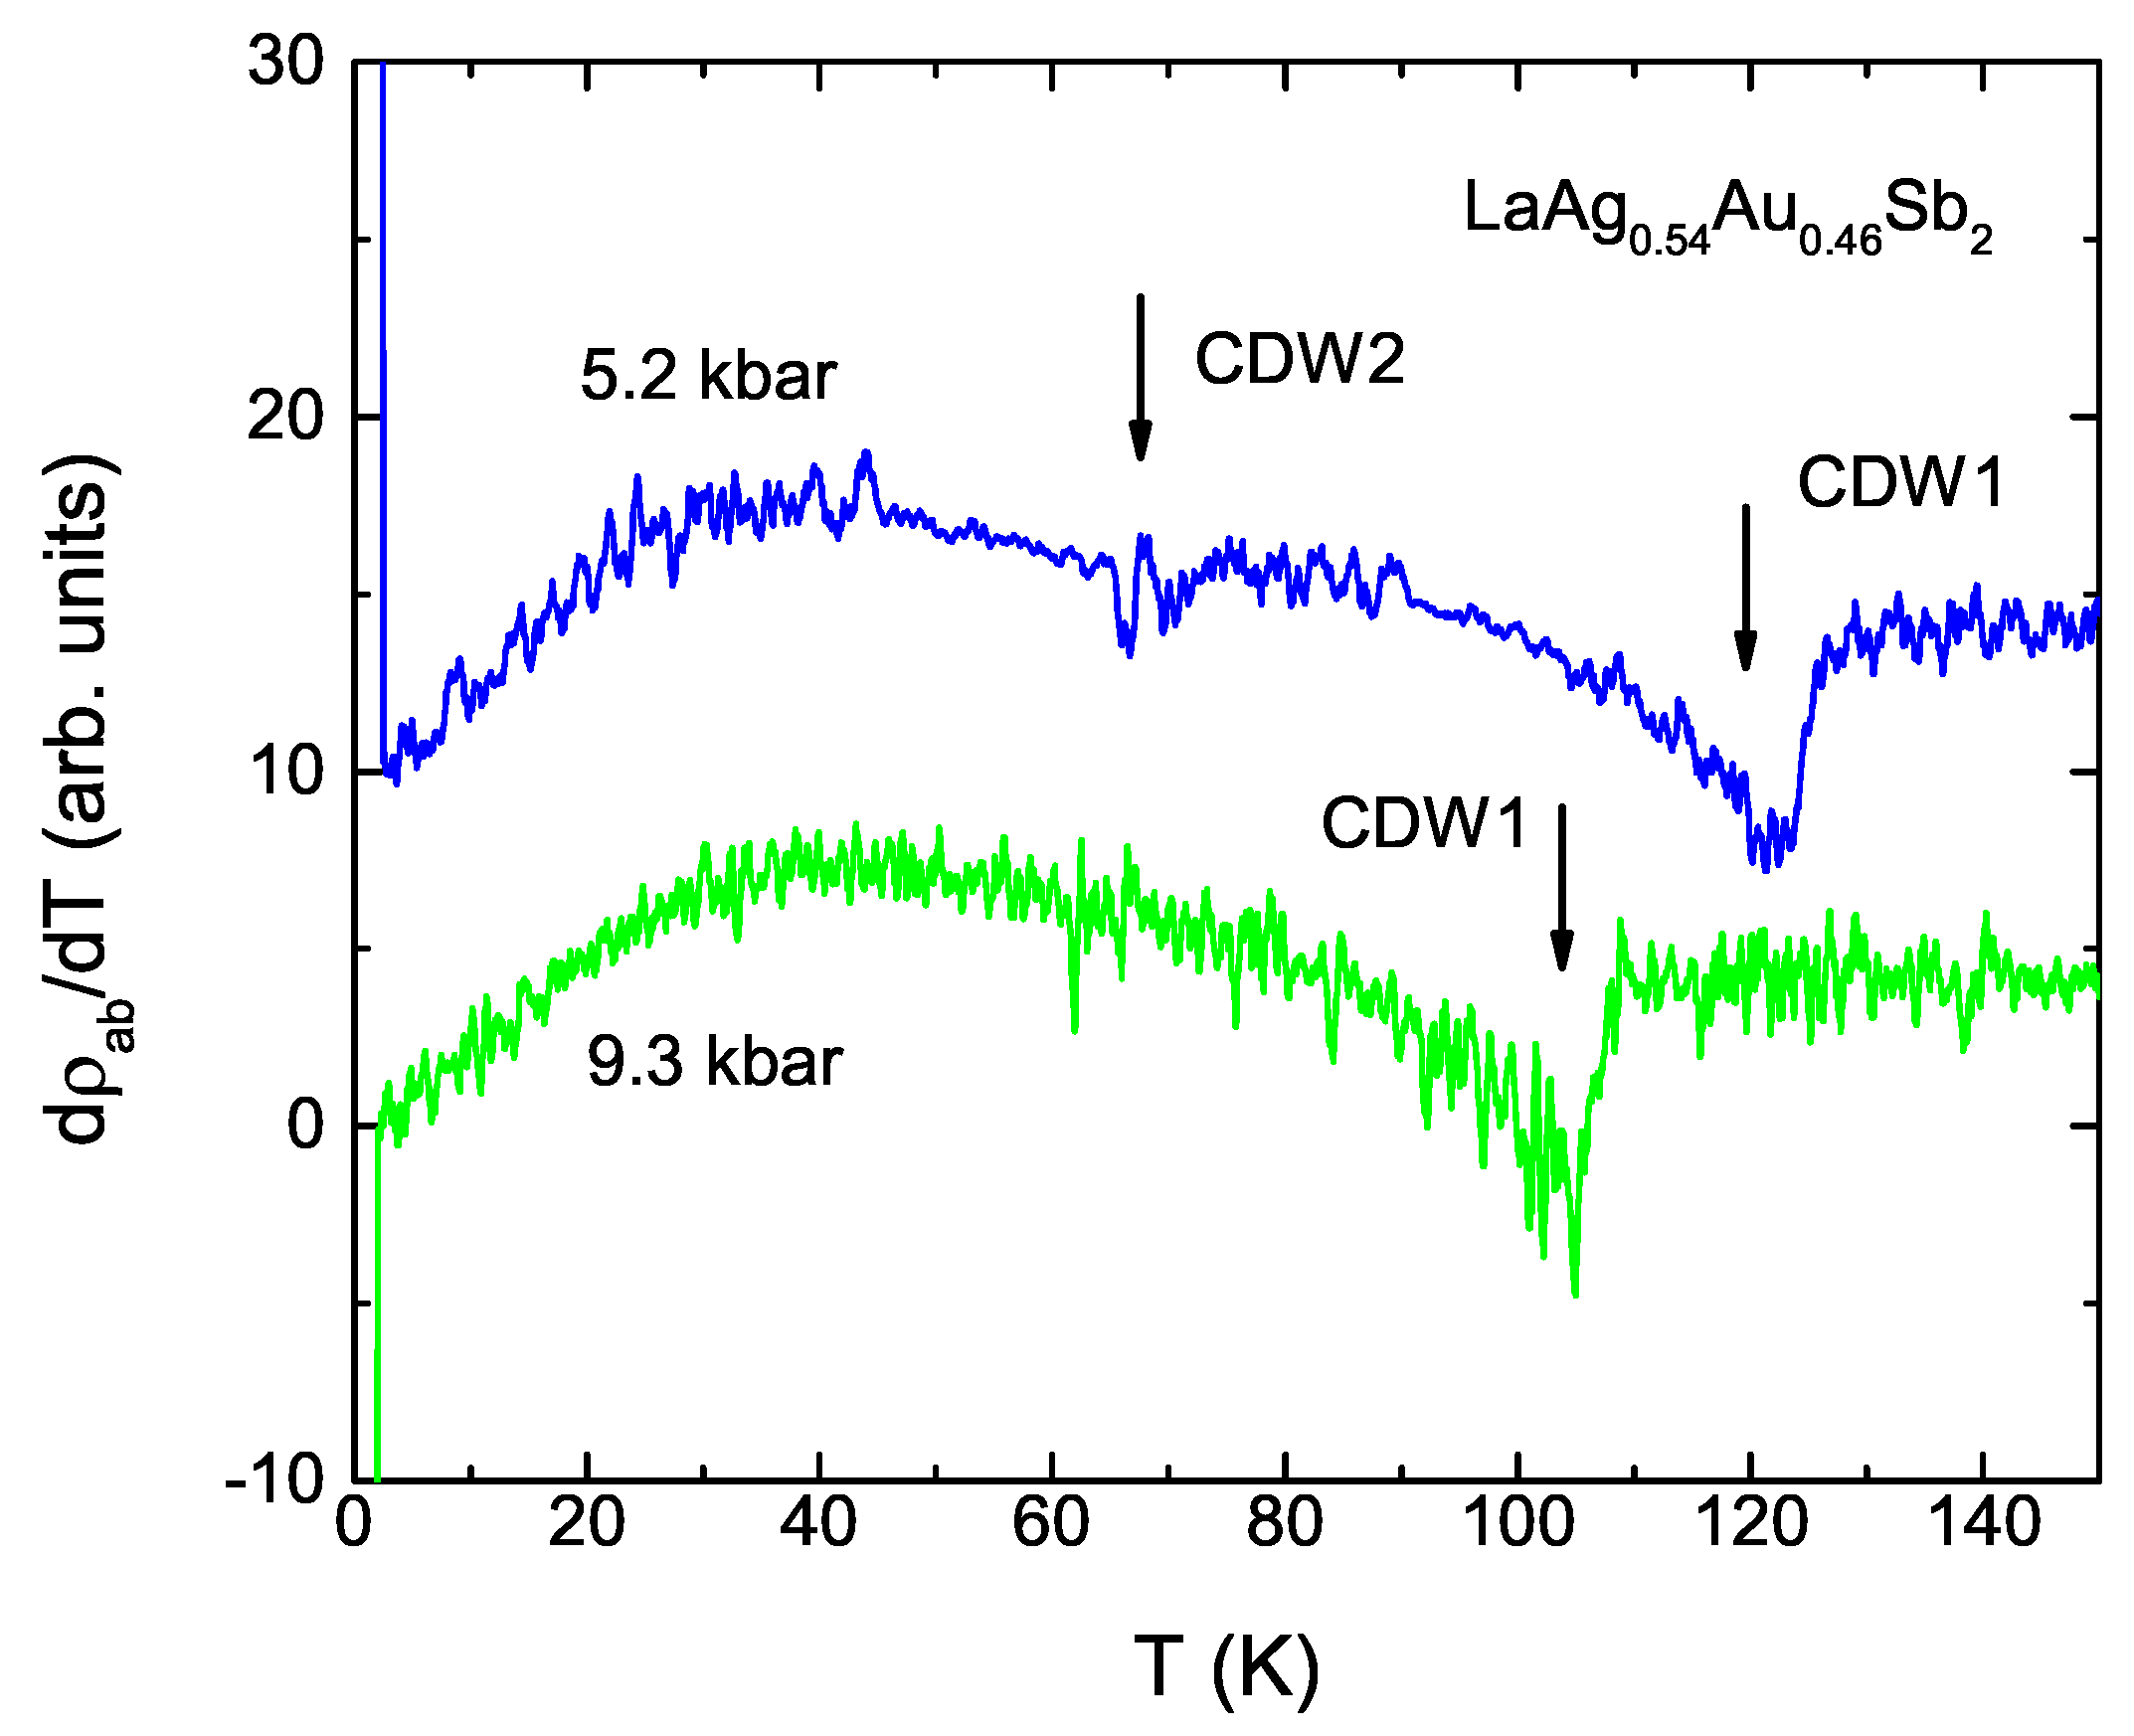
Appendix B. LaAg 0.54 Au 0.46 Sb 2 under Pressure

Figure A1 presents the derivatives of the resistivity data taken at 5.2 kbar and 9.3 kbar for LaAg 0.54 Au 0.46 Sb 2 sample.
Figure A1. Resistivity derivatives, d ρ a b / d T , data at 5.2 kbar and 9.3 kbar for LaAg 0.54 Au 0.46 Sb 2 . Arrows point to CDW transition temperatures. The 5.5 kbar data are shifted vertically by 10 for clarity.
Crystals 12 01693 g0a1

References

  1. Wang, D.; Ding, Y.; Mao, H.K. Future Study of Dense Superconducting Hydrides at High Pressure. Materials 2021, 14, 7563. [Google Scholar] [CrossRef]
  2. Klintberg, L.E.; Goh, S.; Kasahara, S.; Nakai, Y.; Ishida, K.; Sutherland, M.; Shibauchi, T.; Matsuda, Y.; Terashima, T. Chemical Pressure and Physical Pressure in BaFe2(As1−xPx)2. J. Phys. Soc. Jpn. 2010, 79, 123706. [Google Scholar] [CrossRef] [Green Version]
  3. Paglione, J.; Greene, R.L. High-temperature superconductivity in iron-based materials. Nat. Phys. 2010, 6, 645. [Google Scholar] [CrossRef] [Green Version]
  4. Kim, S.K.; Torikachvili, M.S.; Colombier, E.; Thaler, A.; Bud’ko, S.L.; Canfield, P.C. Combined effects of pressure and Ru substitution on BaFe2As2. Phys. Rev. B 2011, 84, 134525. [Google Scholar] [CrossRef] [Green Version]
  5. Fernandes, A.A.R.; Santamaria, J.; Bud’ko, S.L.; Nakamura, O.; Guimpel, J.; Schuller, I.K. Effect of physical and chemical pressure on the superconductivity of high-temperature oxide superconductors. Phys. Rev. B 1991, 44, 7601. [Google Scholar] [CrossRef]
  6. Monceau, P. Electronic crystals: An experimental overview. Adv. Phys. 2012, 61, 325. [Google Scholar]
  7. Peierls, R.E. Quantum Theory of Solids; Oxford University: Oxford, UK, 1955. [Google Scholar]
  8. Johannes, M.D.; Mazin, I.I. Fermi surface nesting and the origin of charge density waves in metals. Phys. Rev. B 2008, 77, 165135. [Google Scholar] [CrossRef] [Green Version]
  9. Eiter, H.M.; Lavagnini, M.; Hackl, R.; Nowadnick, E.A.; Kemper, A.F.; Devereaux, T.P.; Chu, J.H.; Analytis, J.G.; Fisher, I.R.; Degiorgi, L. Alternative route to charge density wave formation inmultiband systems. Proc. Natl. Acad. Sci. USA 2013, 110, 64. [Google Scholar] [CrossRef] [Green Version]
  10. Zhu, X.; Cao, Y.; Zhang, J.; Plummer, E.W.; Guo, J. Classification of charge density waves based on their nature. Proc. Natl. Acad. Sci. USA 2015, 112, 2367. [Google Scholar] [CrossRef] [Green Version]
  11. Brylak, M.; Möller, M.H.; Jeitschko, W. Ternary Arsenides ACuAs2 and Ternary Antimonides AAgSb2 (A = Rare-Earth Elements and Uranium) with HfCuSi2-Type Structure. J. Solid State Chem. 1995, 115, 305. [Google Scholar] [CrossRef]
  12. Sologub, O.; Hiebl, K.; Rogl, P.; Noël, H.; Bodak, O. On the crystal structure and magnetic properties of the ternary rare earth compounds RETSb2 with RE = rare earth and T = Ni, Pd, Cu and Au. J. Alloys Compd. 1994, 210, 153. [Google Scholar] [CrossRef]
  13. Myers, K.D.; Bud’ko, S.L.; Fisher, I.R.; Islam, Z.; Kleinke, H.; Lacerda, A.H.; Canfield, P.C. Systematic study of anisotropic transport and magnetic properties of RAgSb2 (R = Y, La – Nd, Sm, Gd – Tm). J. Magn. Magn. Mater. 1999, 205, 27. [Google Scholar] [CrossRef]
  14. Seo, S.; Sidorov, V.A.; Lee, H.; Jang, D.; Fisk, Z.; Thompson, J.G.; Park, T. Pressure effects on the heavy-fermion antiferromagnet CeAuSb2. Phys. Rev. B 2012, 85, 205145. [Google Scholar] [CrossRef] [Green Version]
  15. Song, C.; Park, J.; Koo, J.; Lee, K.-B.; Rhee, J.Y.; Bud’ko, S.L.; Canfield, P.C.; Harmon, B.N.; Goldman, A.I. Charge-density-wave orderings in LaAgSb2: An X-ray scattering study. Phys. Rev. B 2003, 68, 035113. [Google Scholar] [CrossRef]
  16. Bud’ko, S.L.; Law, S.A.; Canfield, P.C.; Samolyuk, G.D.; Torikachvili, M.S.; Schmiedeshoff, G.M. Thermal expansion and magnetostriction of pure and doped RAgSb2 (R = Y, Sm, La) single crystals. J. Phys. Condens. Matter 2008, 20, 115210. [Google Scholar] [CrossRef] [Green Version]
  17. Xiang, L.; Ryan, D.H.; Straszheim, W.E.; Canfield, P.C.; Bud’ko, S.L. Tuning of charge density wave transitions in LaAuxSb2 by pressure and Au stoichiometry. Phys. Rev. B 2020, 102, 125110. [Google Scholar] [CrossRef]
  18. Masubuchi, S.; Ishii, Y.; Ooiwa, K.; Fukuhara, T.; Shimizu, F.; Sato, H. Chemical Substitution Effect on CDW State in LaAgSb2. JPS Conf. Proc. 2014, 3, 011053. [Google Scholar]
  19. Bud’ko, S.L.; Wiener, T.A.; Ribeiro, R.A.; Canfield, P.C.; Lee, Y.; Vogt, T.; Lacerda, A.H. Effect of pressure and chemical substitutions on the charge-density-wave in LaAgSb2. Phys. Rev. B 2006, 73, 184111. [Google Scholar] [CrossRef] [Green Version]
  20. Torikachvili, M.S.; Bud’ko, S.L.; Law, S.A.; Tillman, M.E.; Mun, E.D.; Canfield, P.C. Hydrostatic pressure study of pure and doped La1-xRxAgSb2 (R = Ce, Nd) charge-density-wave compounds. Phys. Rev. B 2007, 76, 235110. [Google Scholar] [CrossRef] [Green Version]
  21. Akiba, K.; Nishimori, H.; Umeshita, N.; Kobayashi, T.C. Successive destruction of charge density wave states by pressure in LaAgSb2. Phys. Rev. B 2021, 103, 085134. [Google Scholar] [CrossRef]
  22. Zhang, B.; An, C.; Chen, X.; Zhou, Y.; Zhou, Y.; Yuan, Y.; Chen, Y.; Zhang, C.; Yang, L.; Yang, Z. Structural and electrical transport properties of charge density wave material LaAgSb2 under high pressure. Chin. Phys. B 2021, 30, 076201. [Google Scholar] [CrossRef]
  23. Akiba, K.; Umeshita, N.; Kobayashi, T.C. Observation of superconductivity and its enhancement at the charge density wave critical point in LaAgSb2. Phys. Rev. B 2022, 106, L161113. [Google Scholar] [CrossRef]
  24. Du, F.; Su, H.; Luo, S.S.; Shen, B.; Nie, Z.Y.; Yin, L.C.; Chen, Y.; Li, R.; Smidman, M.; Yuan, H.Q. Interplay between charge density wave order and superconductivity in LaAuSb2 under pressure. Phys. Rev. B 2020, 102, 144510. [Google Scholar] [CrossRef]
  25. Lingannan, G.; Joseph, B.; Vajeeston, P.; Kuo, C.N.; Lue, C.S.; Kalaiselvan, G.; Rajak, P.; Arumugam, S. Pressure-dependent modifications in the LaAuSb2 charge density wave system. Phys. Rev. B 2021, 103, 195126. [Google Scholar] [CrossRef]
  26. Zhao, L.; Yelland, E.A.; Bruin, J.A.; Sheikin, I.; Canfield, P.C.; Fritsch, V.; Sakai, H.; Mackenzie, A.P.; Hicks, C.W. Field-temperature phase diagram and entropy landscape of CeAuSb2. Phys. Rev. B 2016, 93, 195124. [Google Scholar] [CrossRef] [Green Version]
  27. Canfield, P.C.; Kong, T.; Kaluarachchi, U.S.; Jo, N.H. Use of frit-disc crucibles for routine and exploratory solution growth of single crystalline samples. Philos. Mag. 2016, 96, 84. [Google Scholar] [CrossRef] [Green Version]
  28. Larson, A.C.; Von Dreele, R.B. General Structure Analysis System (GSAS); Los Alamos National Laboratory Report LAUR 86-748; Los Alamos National Laboratory: Los Alamos, NM, USA, 2004.
  29. Toby, B.H. EXPGUI, a graphical user interface for GSAS. J. Appl. Cryst. 2001, 34, 210. [Google Scholar] [CrossRef] [Green Version]
  30. Standard Reference Material 676a; NIST: Gaithersburg, MD, USA, 2015.
  31. Bud’ko, S.L.; Voronovskii, A.N.; Gapotchenko, A.G.; Itskevich, E.S. The Fermi surface of cadmium at an electron-topological phase transition under pressure. Zh. Eksp. Teor. Fiz. 1984, 86, 778, [English translation: Sov. Phys. JETP 1984, 59, 454]. [Google Scholar]
  32. Torikachvili, M.S.; Kim, S.K.; Colombier, E.; Bud’ko, S.L.; Canfield, P.C. Solidification and loss of hydrostaticity in liquid media used for pressure measurements. Rev. Sci. Instrum. 2015, 86, 123904. [Google Scholar] [CrossRef] [Green Version]
  33. Eiling, A.; Schilling, J.S. Pressure and temperature dependence of electrical resistivity of Pb and Sn from 1 to 300 K and 0–10 GPa-use as continuous resistive pressure monitor accurate over wide temperature range; superconductivity under pressure in Pb, Sn and In. J. Phys. F Met. Phys. 1981, 11, 623. [Google Scholar] [CrossRef]
  34. Xiang, L.; Gati, E.; Bud’ko, S.L.; Ribeiro, R.A.; Ata, A.; Tutsch, U.; Lang, M.; Canfield, P.C. Characterization of the pressure coefficient of manganin and temperature evolution of pressure in piston-cylinder cells. Rev. Sci. Instrum. 2020, 91, 095103. [Google Scholar] [CrossRef] [PubMed]
  35. Li, L.; Deng, X.; Wang, Z.; Liu, Y.; Abeykoon, M.; Dooryhee, E.; Tomic, A.; Huang, Y.; Warren, J.B.; Bozin, E.S.; et al. Superconducting order from disorder in 2H-TaSe2-xSx. npj Quant. Mater. 2017, 2, 11. [Google Scholar] [CrossRef] [Green Version]
  36. Fuchs, G.; Müller, K.-H.; Freudenberger, J.; Nenkov, K.; Drechsler, S.-L.; Shulga, S.V.; Lipp, D.; Gladun, A.; Cichorek, T.; Gegenwart, P. Influence of disorder on superconductivity in non-magnetic rare-earth nickel borocarbides. Pramana 2002, 58, 791. [Google Scholar] [CrossRef]
  37. Slade, T.J.; Mudiyanselage, R.S.D.; Furukawa, N.; Smith, T.R.; Schmidt, J.; Wang, L.L.; Kang, C.-J.; Wei, K.; Shu, Z.; Kong, T.; et al. Mn(Pt1-xPdx)5P: Isovalent Tuning of Mn Sublattice Magnetic Order. arXiv 2022, arXiv:2211.01818. [Google Scholar]
Figure 1. Cu-K α X-ray diffraction patterns for the T2 growth of LaAg 0.75 Au 0.25 Sb 2 showing the two overlapping data blocks that were co-fitted using the GSAS/EXPGUI packages [28,29]. The red points are the data and the green lines show the fits with the residuals shown below each fitted pattern. The Bragg markers show the positions of the reflections from (top) Sb, and (bottom) LaAg 1 x Au x Sb 2 .
Crystals 12 01693 g001
Figure 2. Measured vs. nominal values of Au concentration x in LaAg 1 x Au x Sb 2 (filled symbols). Double filled red circles for x n o m = 0.25 (not clearly discerned on the plot) and 0.75, as well as double filled black rhombi for x n o m = 0.25 correspond to T2 and T6 growths, see Section 2. These data are presented in the Appendix A in a tabular form (Table A2 and Table A3). For example, of two red circles at x n o m = 0.75 , higher corresponds to T2 and lower to T6 growth. Data for LaAu x Sb 2 [17] (open symbols) are added for the reference, here again multiple symbols correspond to different initial La:Au:Sb growth compositions [17]. Dashed line corresponds to x m e a s = x n o m .
Crystals 12 01693 g002
Figure 3. (a) Lattice parameters, (b) unit cell volume and c / a ratio vs. Au concentration in LaAg 1 x Au x Sb 2 determined from Rietveld refinement (filled symbols). Data for LaAu x Sb 2 [17] (open symbols) are added for the reference. Dashed lines are guide to the eye.
Crystals 12 01693 g003
Figure 4. Normalized in-plane resistivity, ρ a b / ρ a b ( 300 K ) and the ordering temperatures CDW1 and CDW2 for T2 and T6 samples with nominal compositions (a) LaAg 0.75 Au 0.25 Sb 2 and (b) LaAg 0.25 Au 0.75 Sb 2 .
Crystals 12 01693 g004
Figure 5. Normalized in-plane resistivity for LaAg 1 x Au x Sb 2 . Data are vertically shifted for clarity. The curve for LaAu 0.991 Sb 2 [17] is added for the reference. The inset shows an example of d ρ a b / d T for LaAgSb 2 with two CDW transitions marked.
Crystals 12 01693 g005
Figure 6. Transition temperatures, CDW1 and CDW2, as a function of x in LaAg 1 x Au x Sb 2 . Data are vertically shifted for clarity. Dashed lines are guide for the eye. The inset shows residual resistivity ratio, R R R = ρ a b ( 300 K ) / ρ a b ( 1.8 K ) as a function of x-Au.
Crystals 12 01693 g006
Figure 7. Temperature-dependent c-axis resistivity of LaAgSb 2 measured at different applied pressures. Upper inset: CDW transition temperatures, T C D W 1 and T C D W 2 , as a function of pressure. Lower inset: normalized resistivity at 300 K and 50 K as a function of pressure.
Crystals 12 01693 g007
Figure 8. Temperature-dependent in-plane resistivity of LaAg 0.54 Au 0.46 Sb 2 measured at different applied pressures. Upper inset: CDW transition temperatures, T C D W 1 and T C D W 2 , as a function of pressure. Lower inset: normalized resistivity at 300 K and 200 K as a function of pressure. Note, some minor corrections of pressure values, following Ref. [17] were applied.
Crystals 12 01693 g008
Figure 9. Pressure dependence of (a) in-plane resistivity at 2 K (dashed lines are guide to the eye); (b) exponent α in ρ = ρ 0 + A T α fit of low temperature resistivity (fit performed between 1.8 K and 20 K) for LaAg 0.54 Au 0.46 Sb 2 .
Crystals 12 01693 g009
Figure 10. Pressure dependence of (a) T C D W 1 and (b) T C D W 2 for different LaAg 1 x Au x Sb 2 shown on the same plot. Data for LaAu x Sb 2 are taken from Ref. [17]. Insets: the same data positioned on universal lines by horizontal shifts, Δ P .
Crystals 12 01693 g010
Figure 11. CDW1 transition temperature for LaAg 1 x Au x Sb 2 and LaAu x Sb 2 [17] at ambient and high pressure as a function of (a) a; (b) c; (c) c / a ; and (d) V structural parameters. Encircled points discussed in the text.
Crystals 12 01693 g011
Figure 12. CDW2 transition temperature for LaAg 1 x Au x Sb 2 and LaAu x Sb 2 [17] at ambient and high pressure as a function of the unit cell volume, V. Encircled points discussed in the text.
Crystals 12 01693 g012
Publisher’s Note: MDPI stays neutral with regard to jurisdictional claims in published maps and institutional affiliations.

